
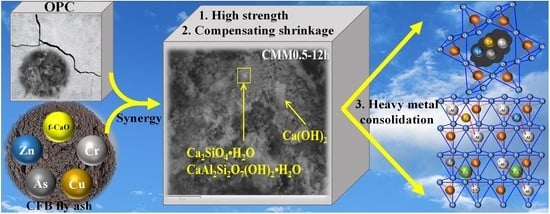
Circulating Fluidized Bed Fly Ash Mixed Functional Cementitious Materials: Shrinkage Compensation of f-CaO, Autoclaved Hydration Characteristics and Environmental Performance


Abstract
:
1. Introduction
2. Materials and Methods
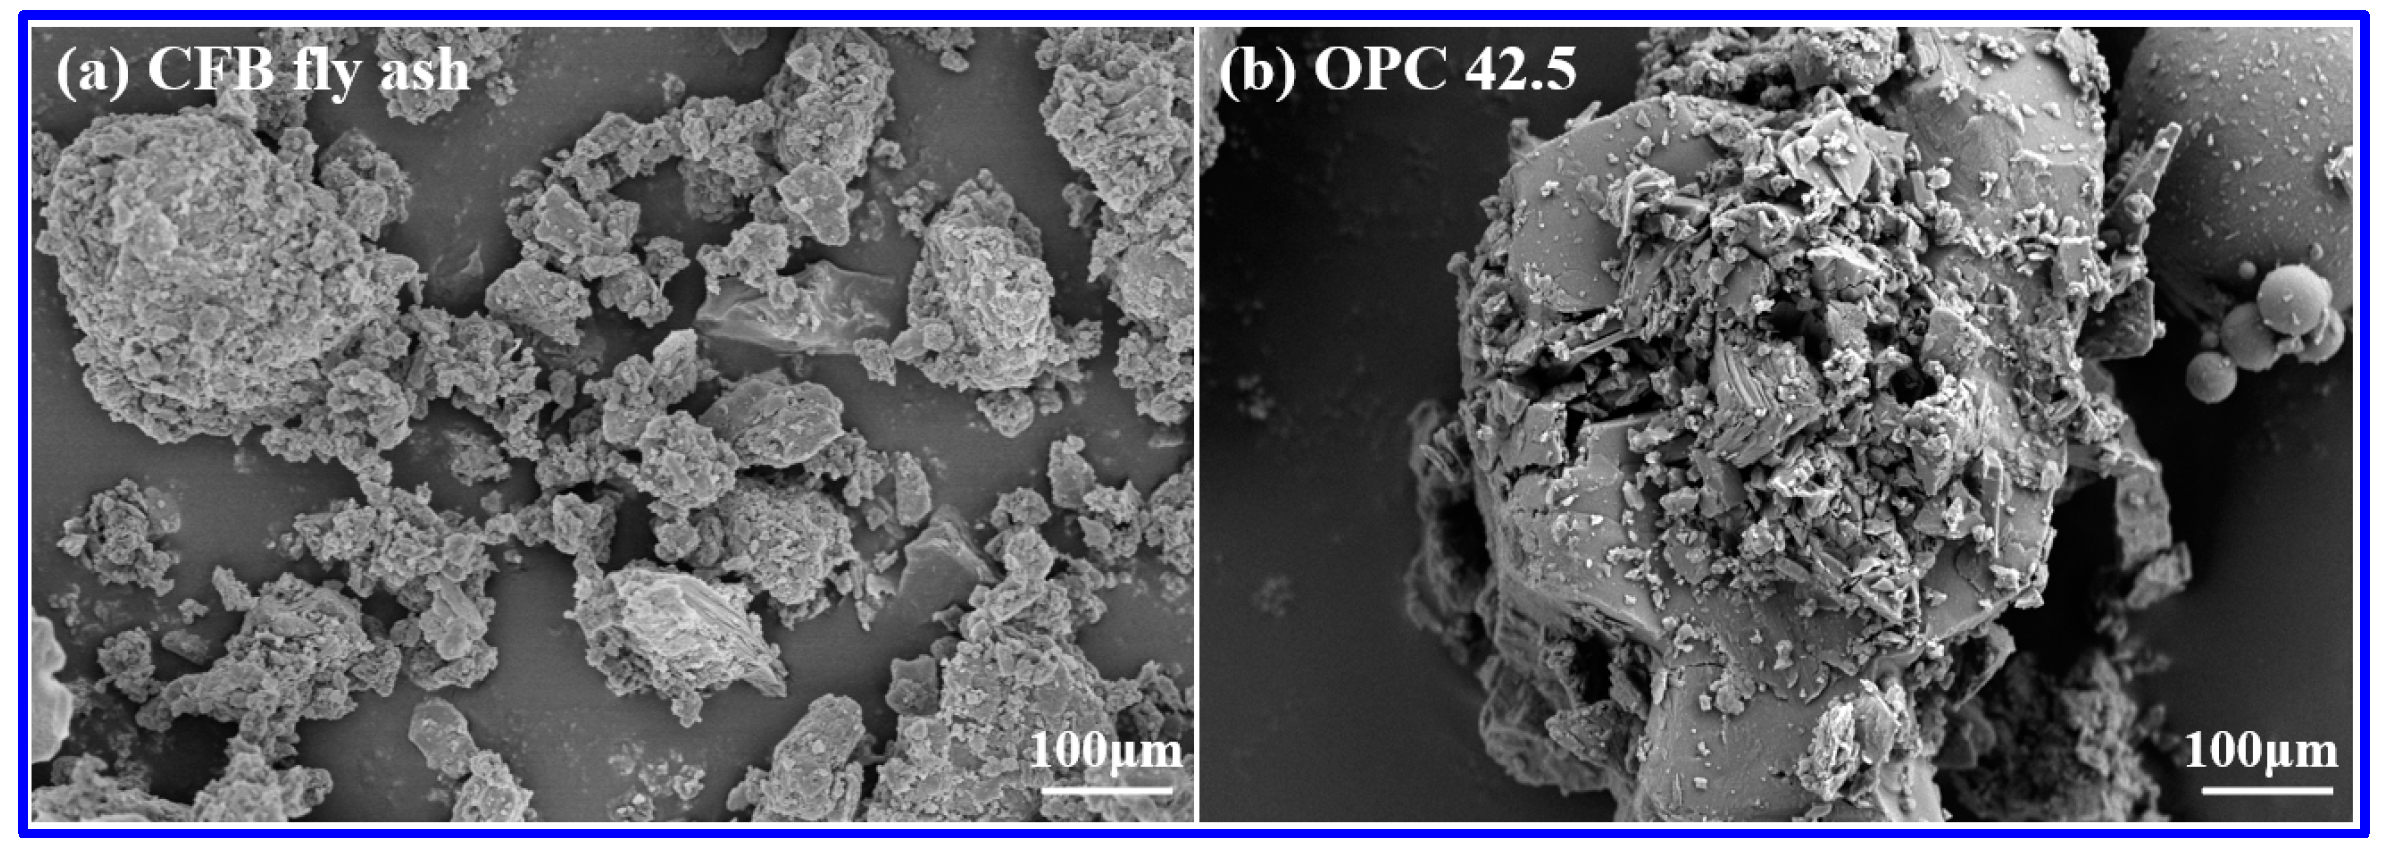
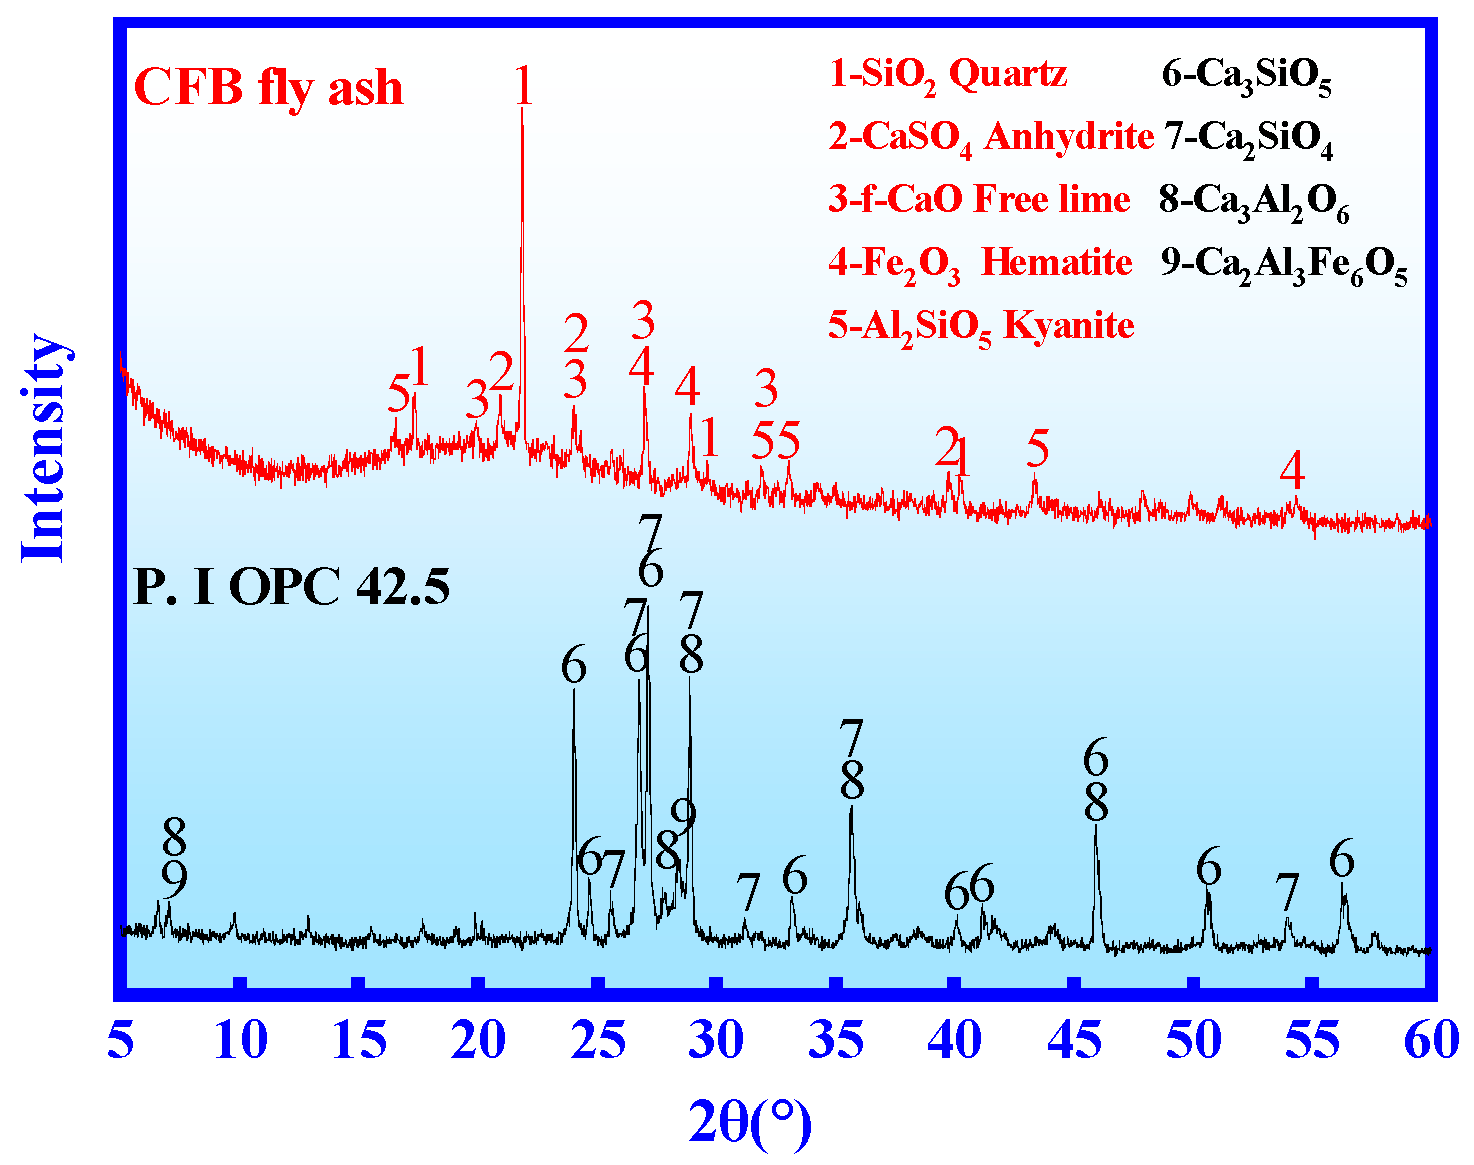
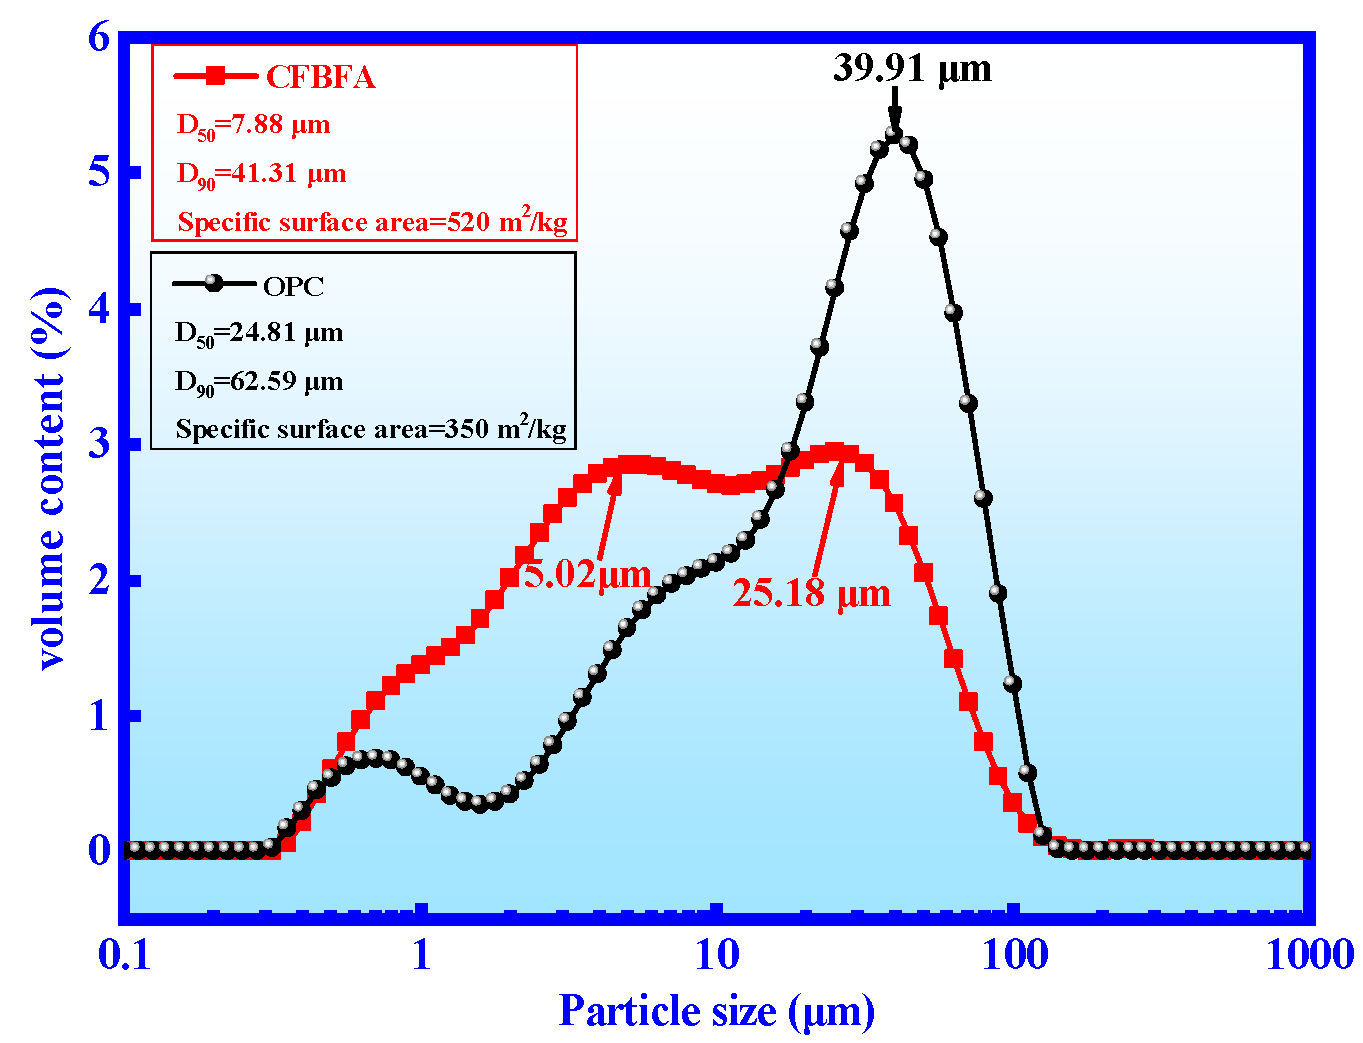
2.1. Materials
2.2. Proportional Design of CMM
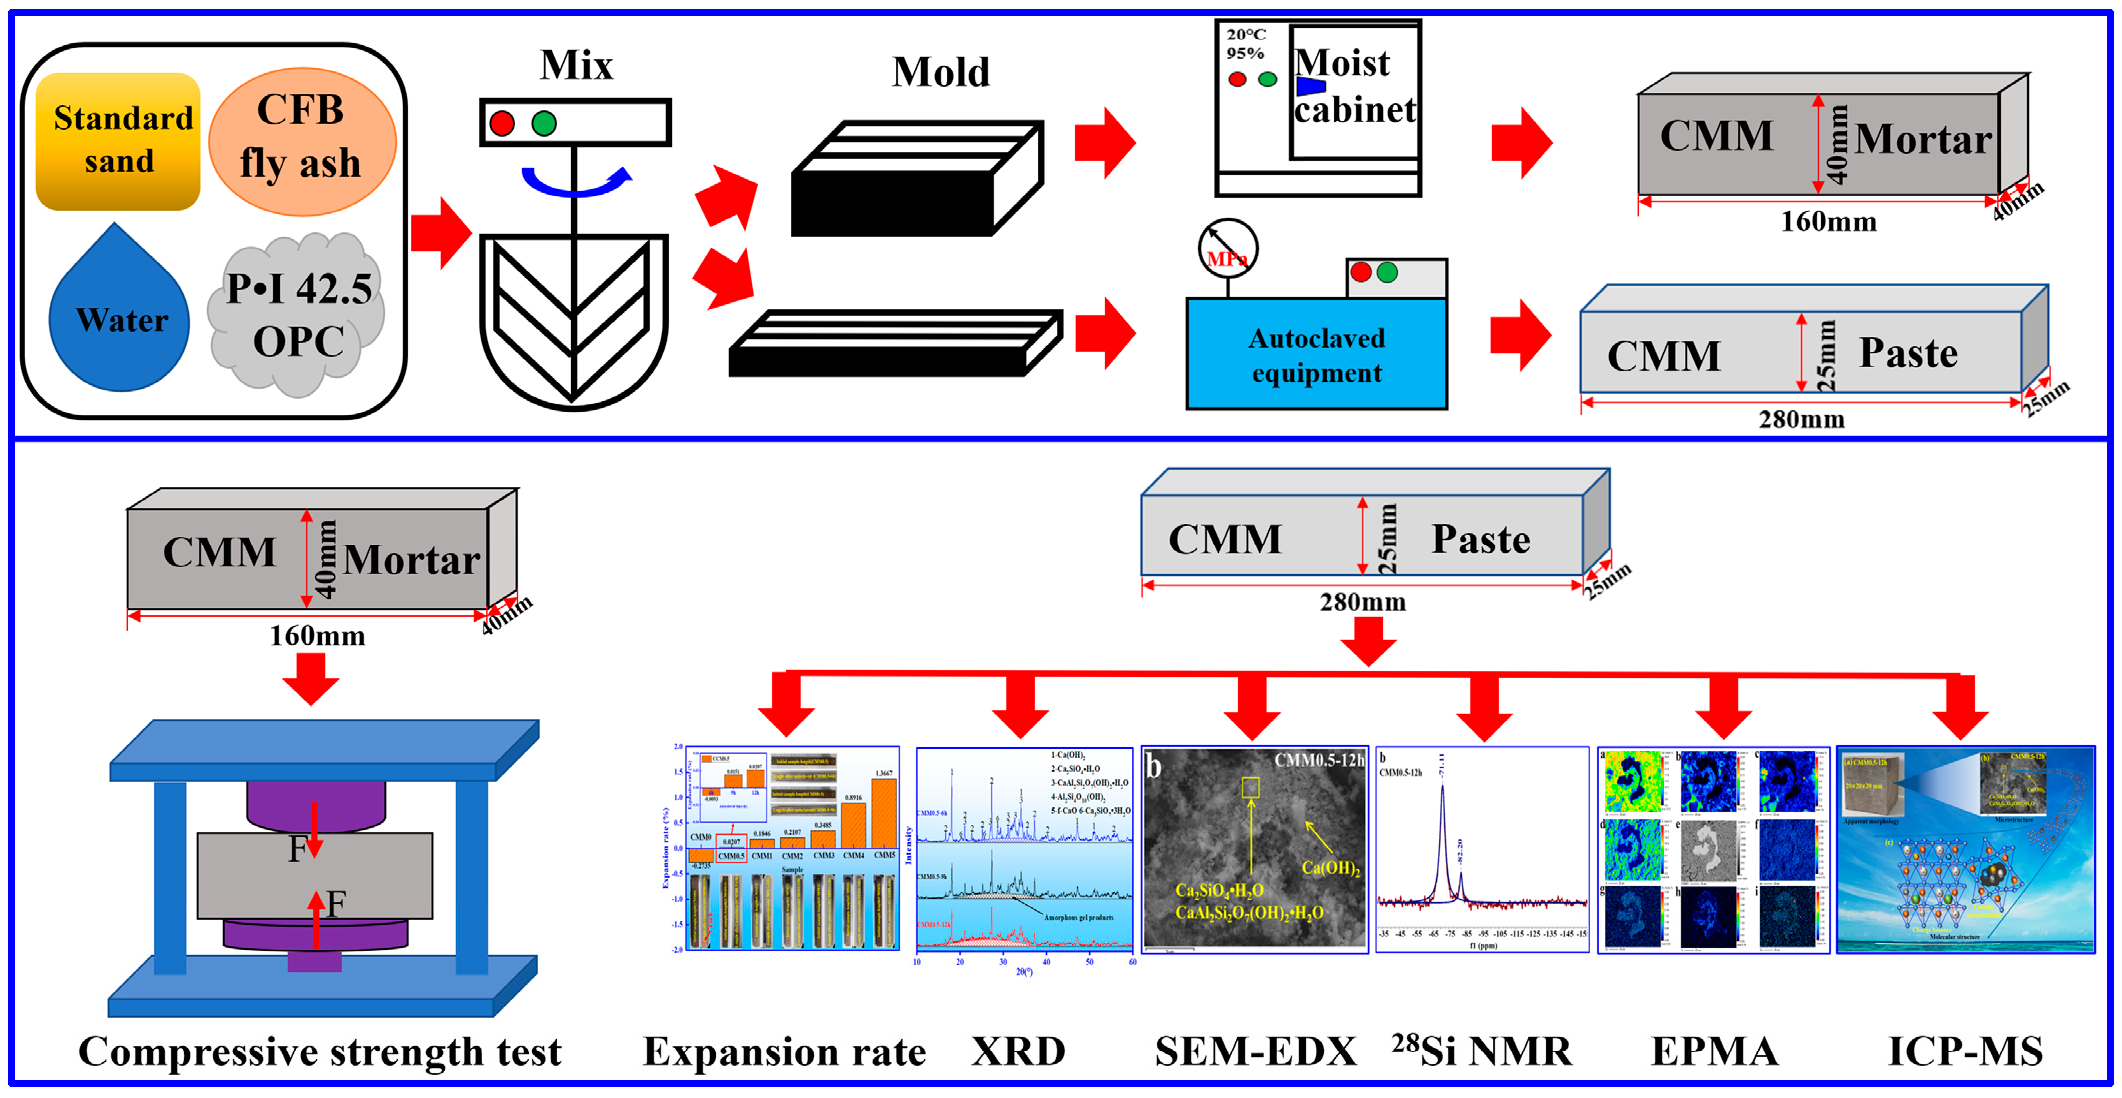
2.3. Preparation of CMM
2.4. Test Methods
3. Results and Discussion
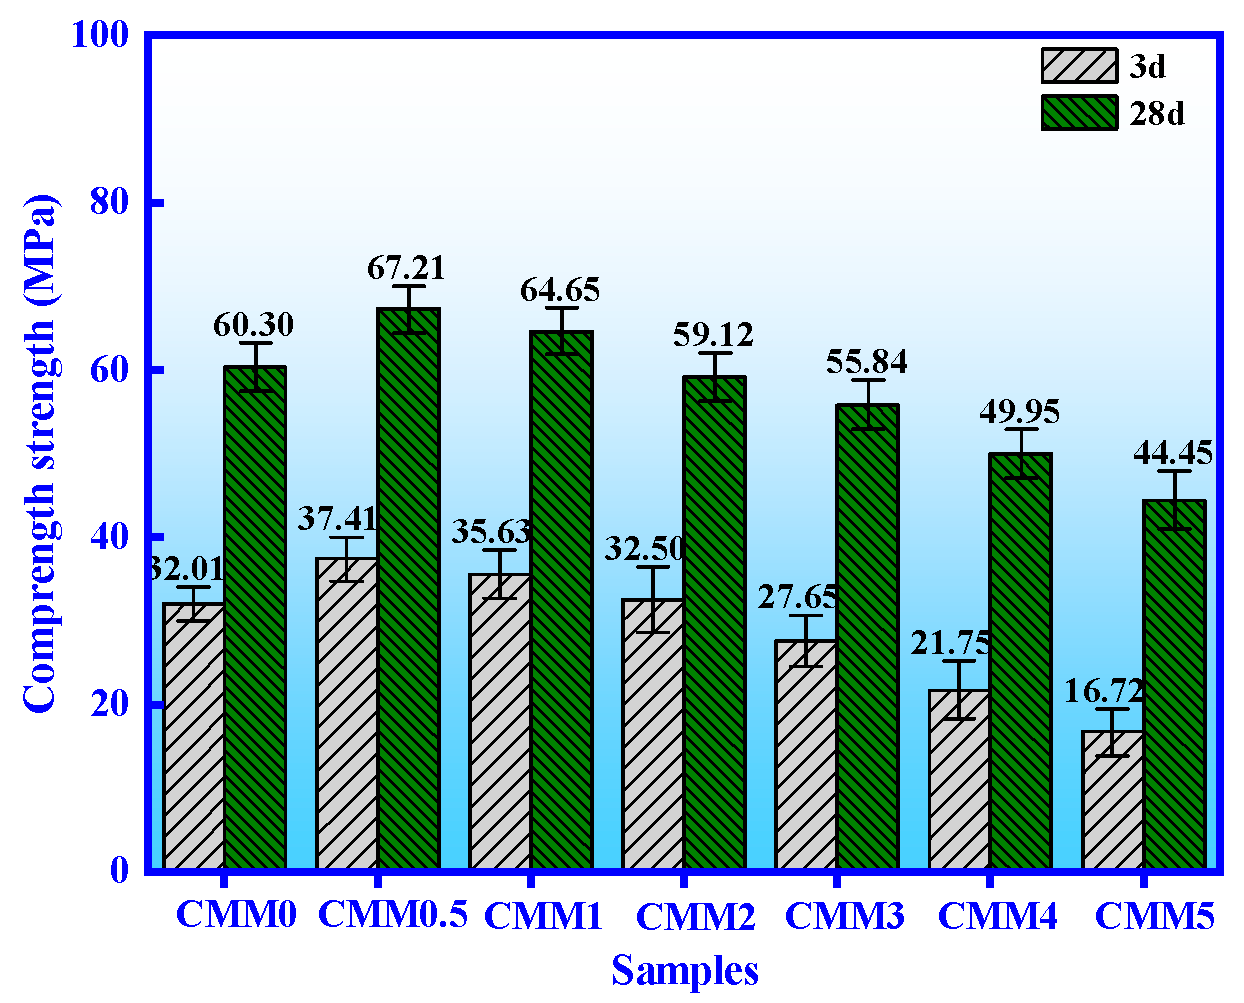
3.1. Mechanical Properties
3.2. Hydration Heat
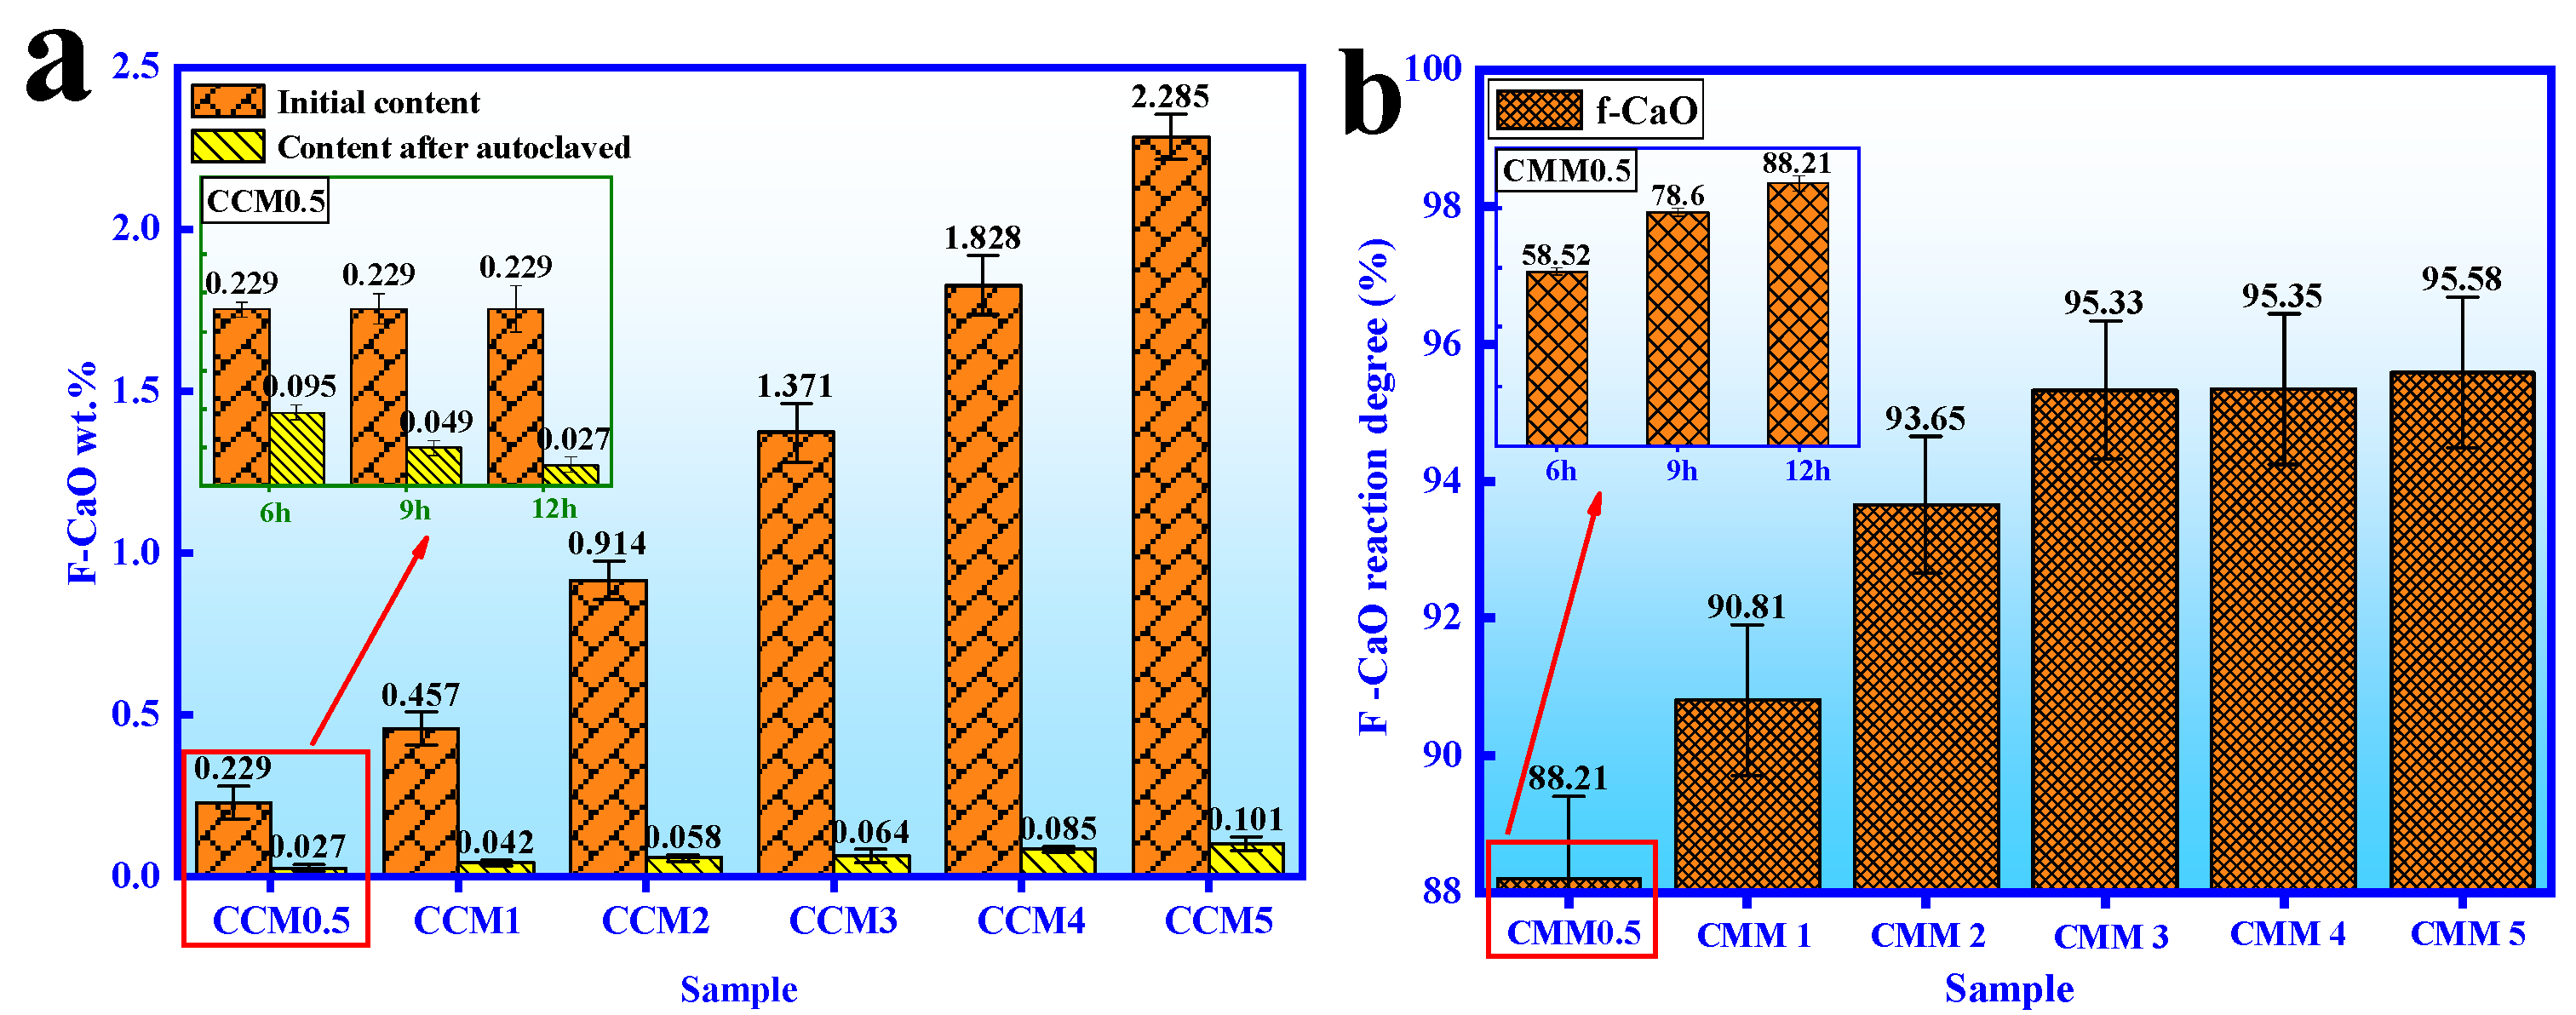
3.3. Volume Stability
3.4. Autoclaved Hydration Characteristics
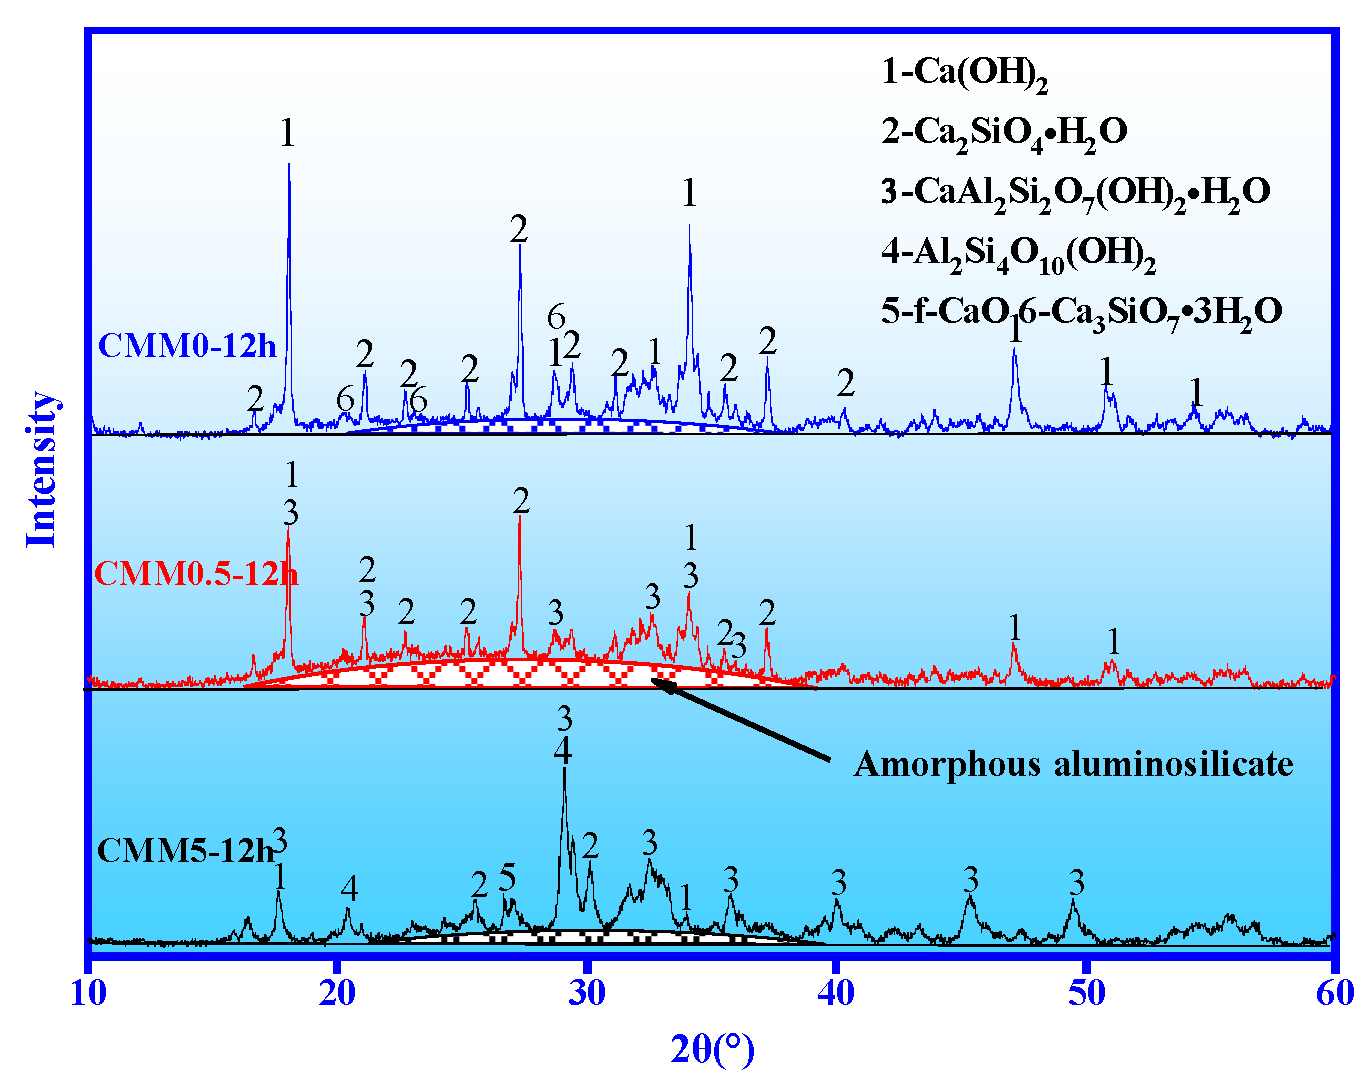
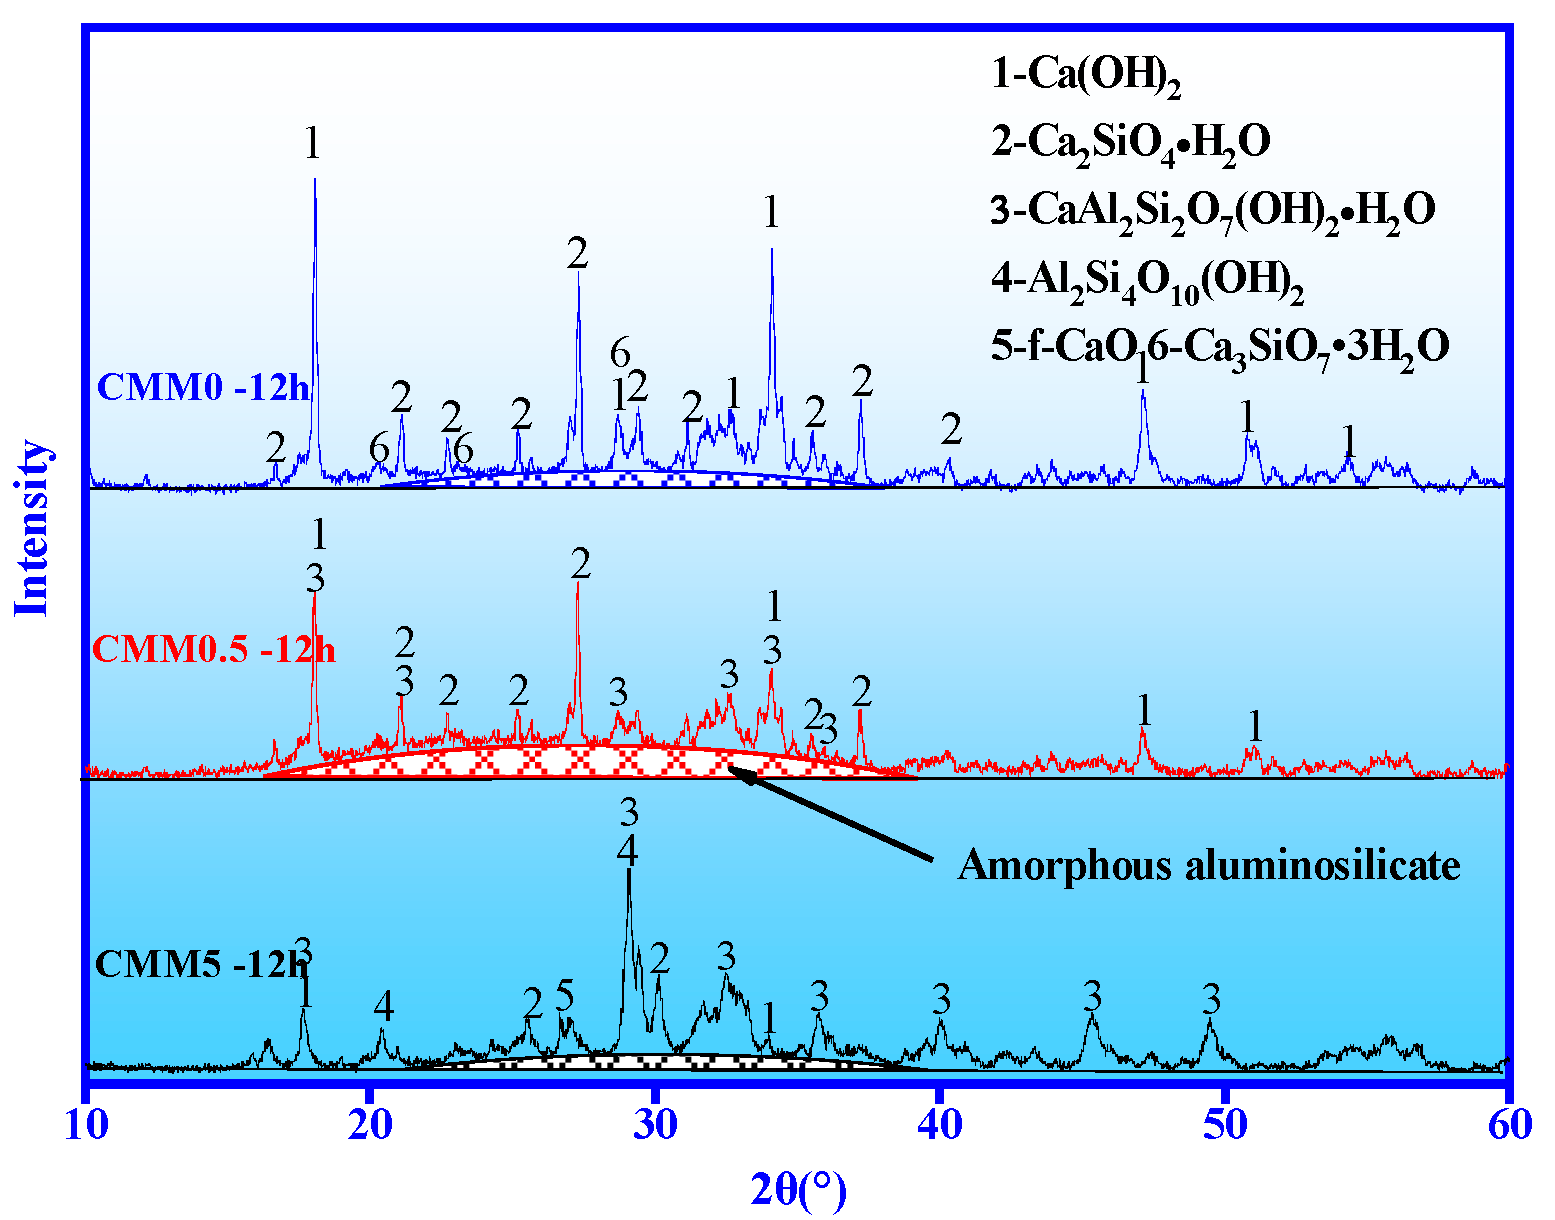
3.4.1. XRD
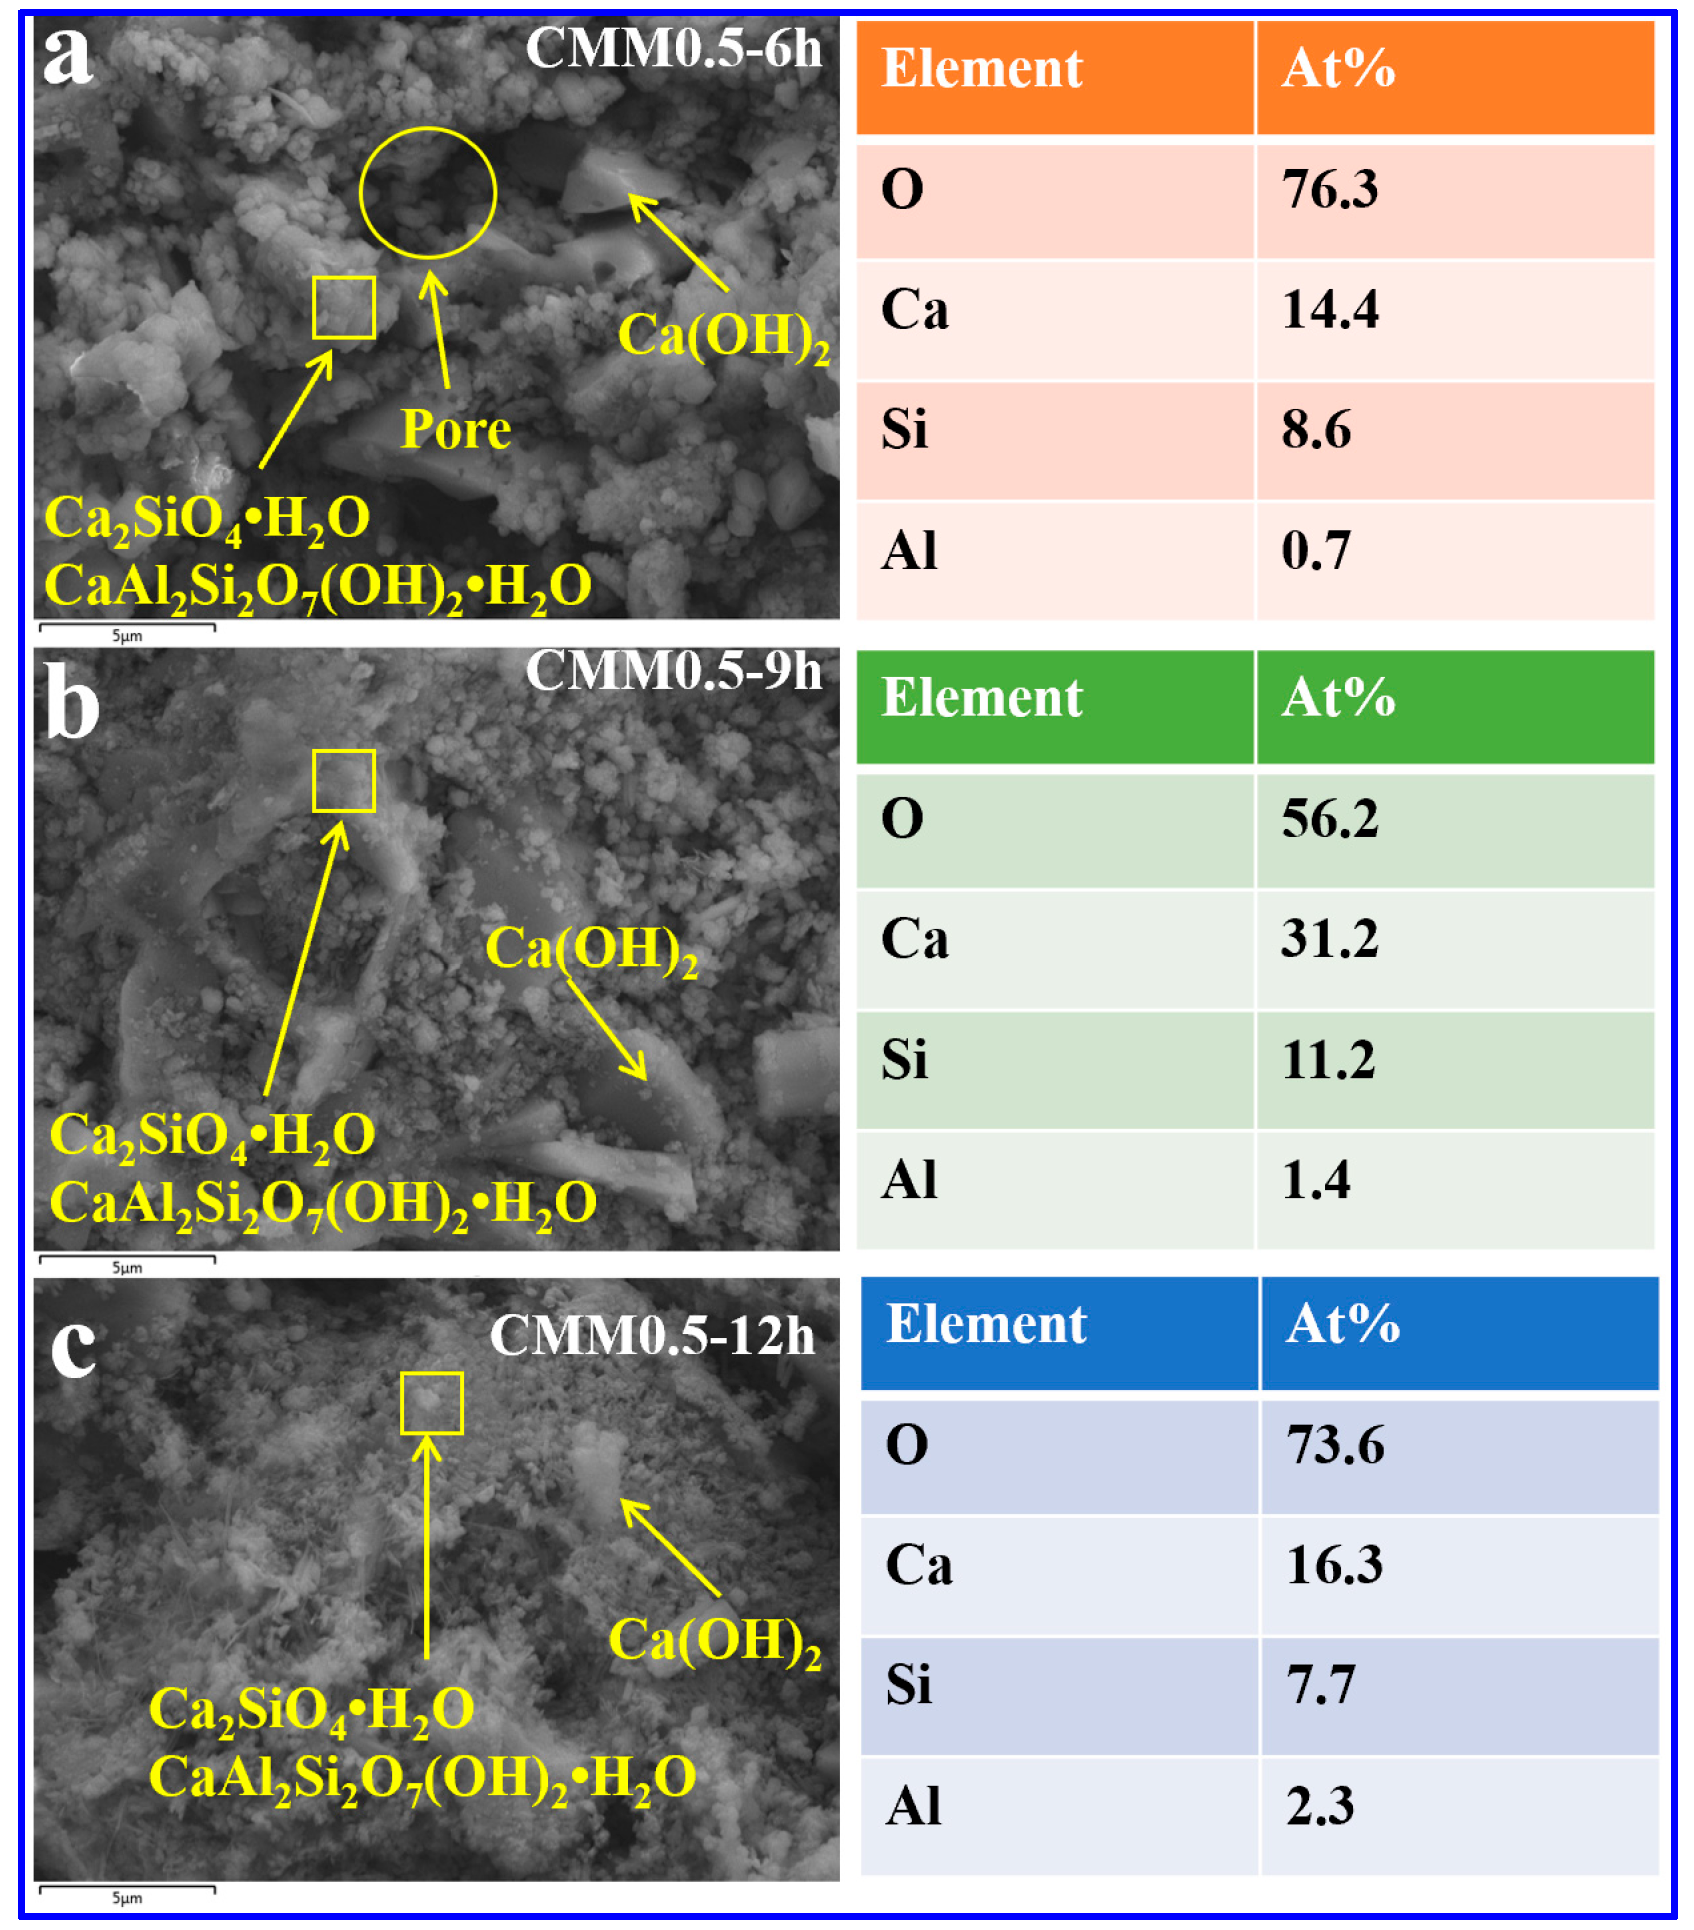
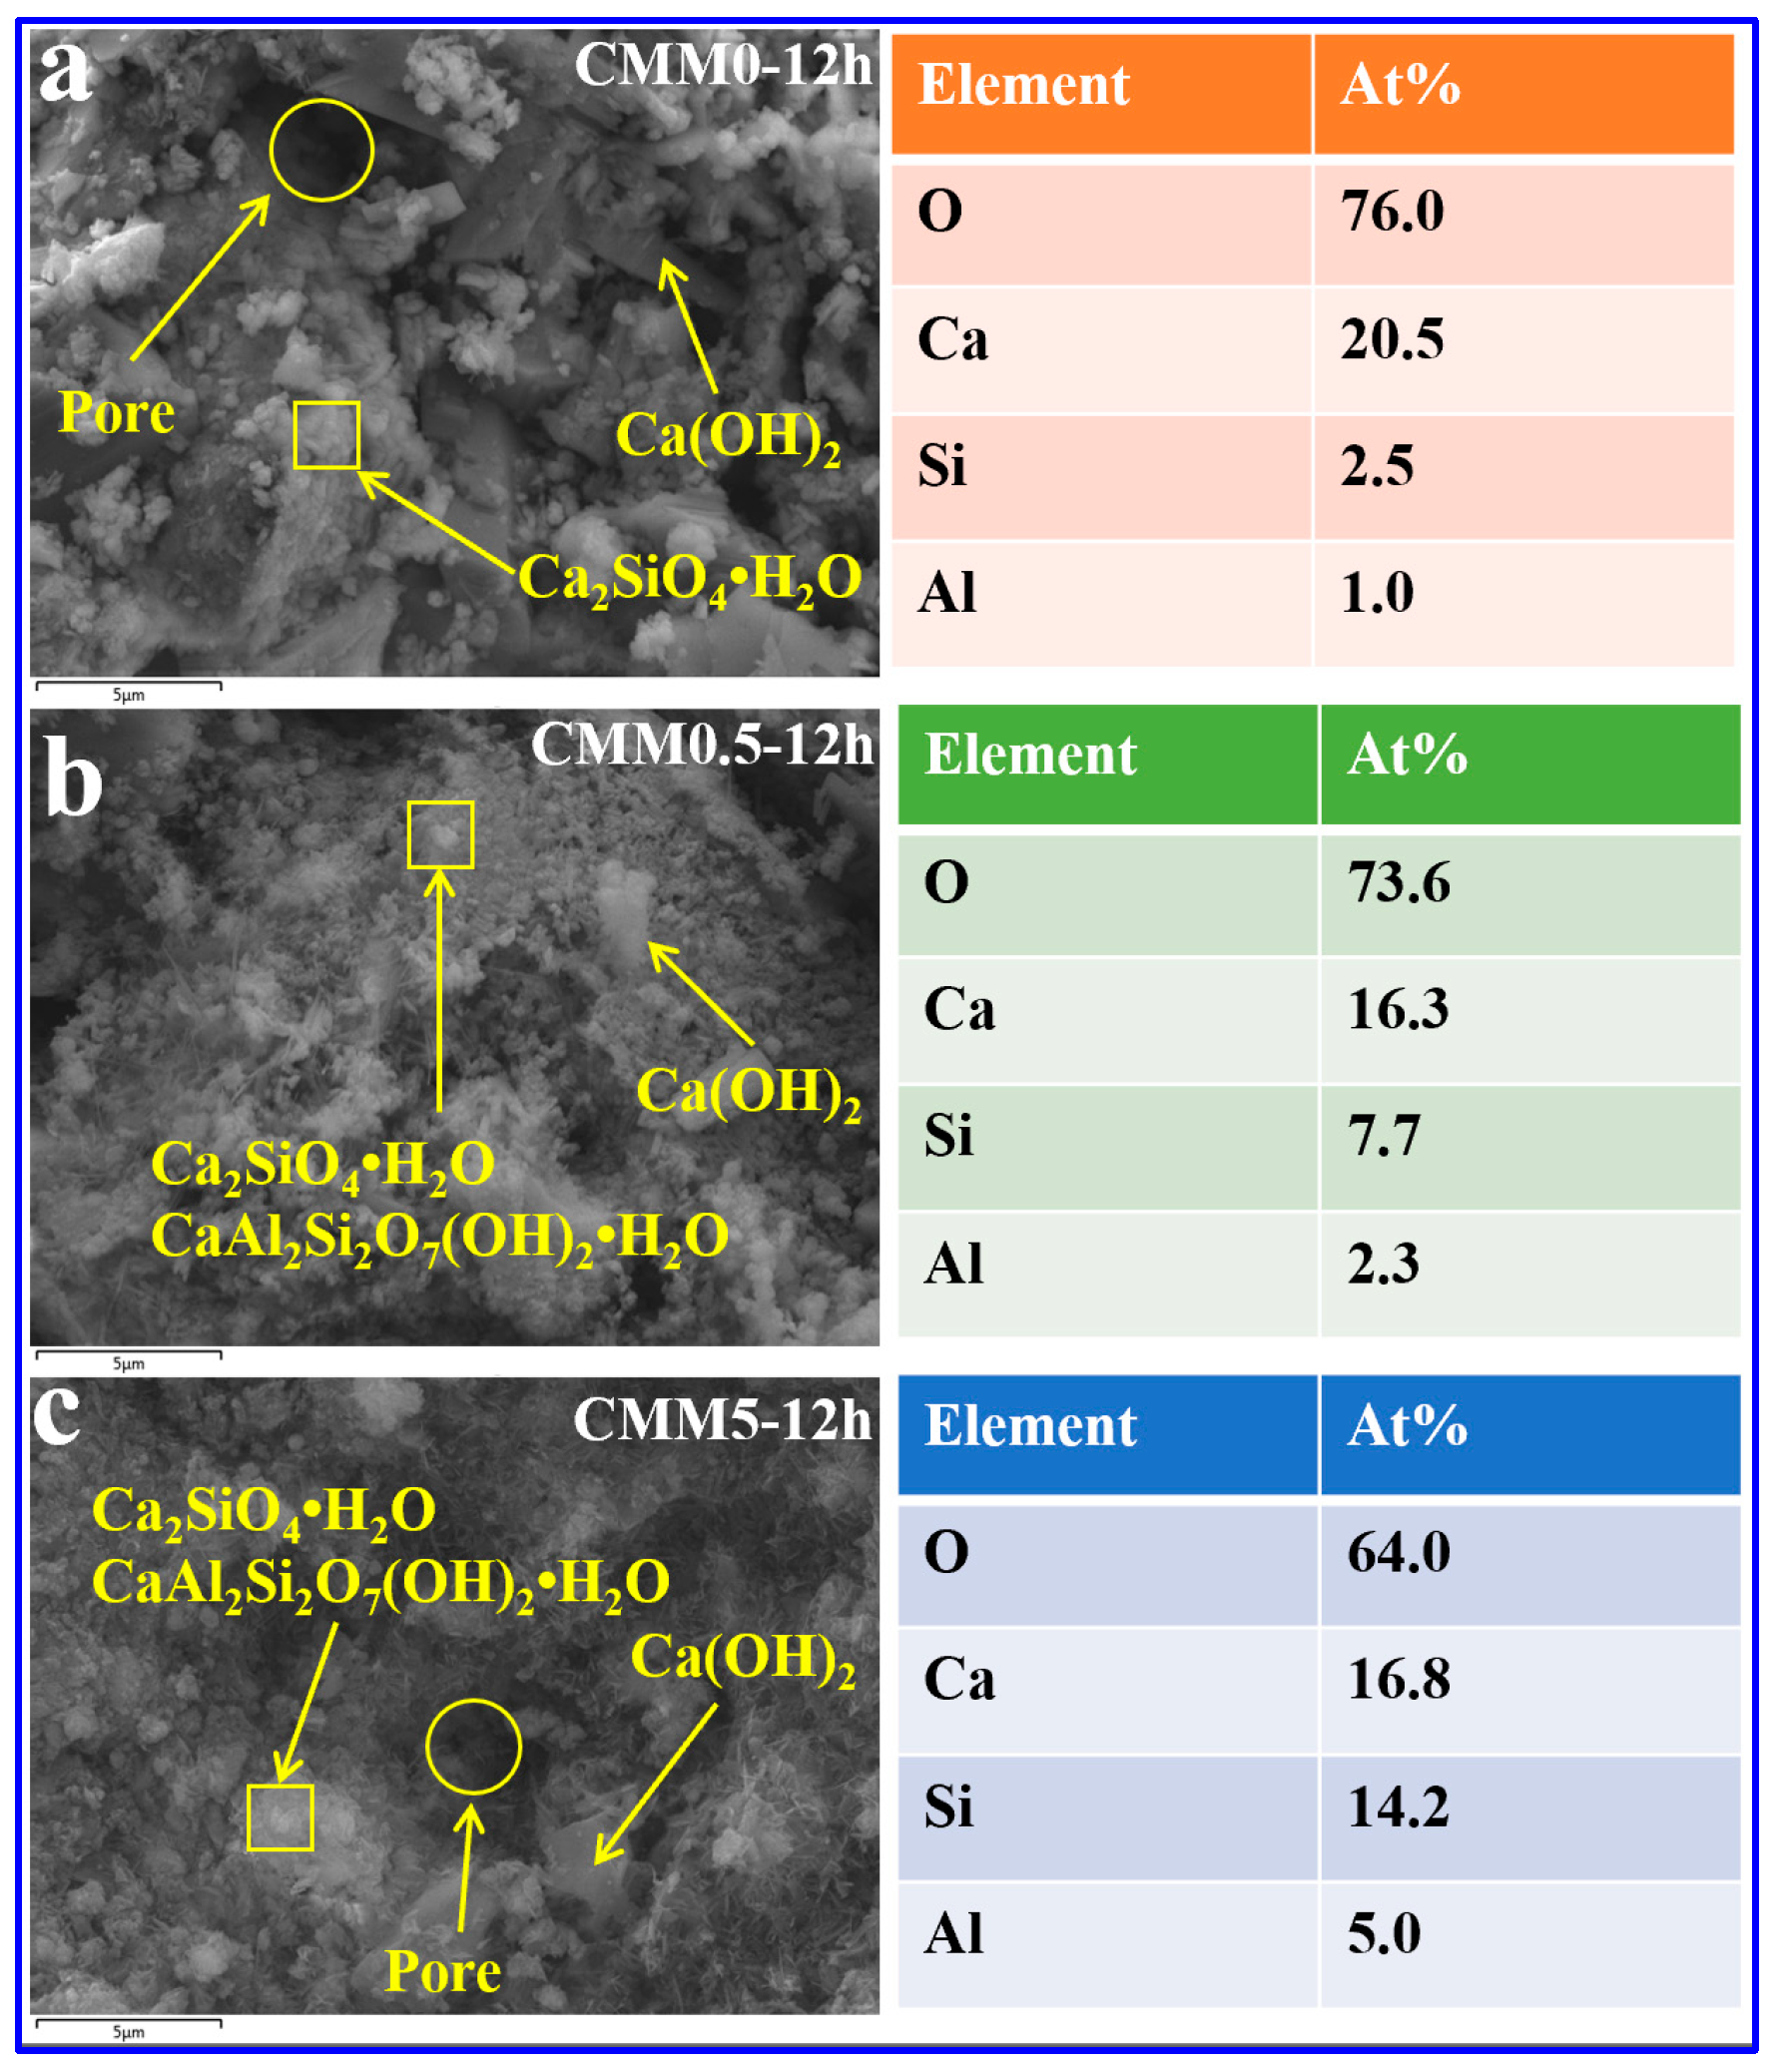
3.4.2. SEM-EDX
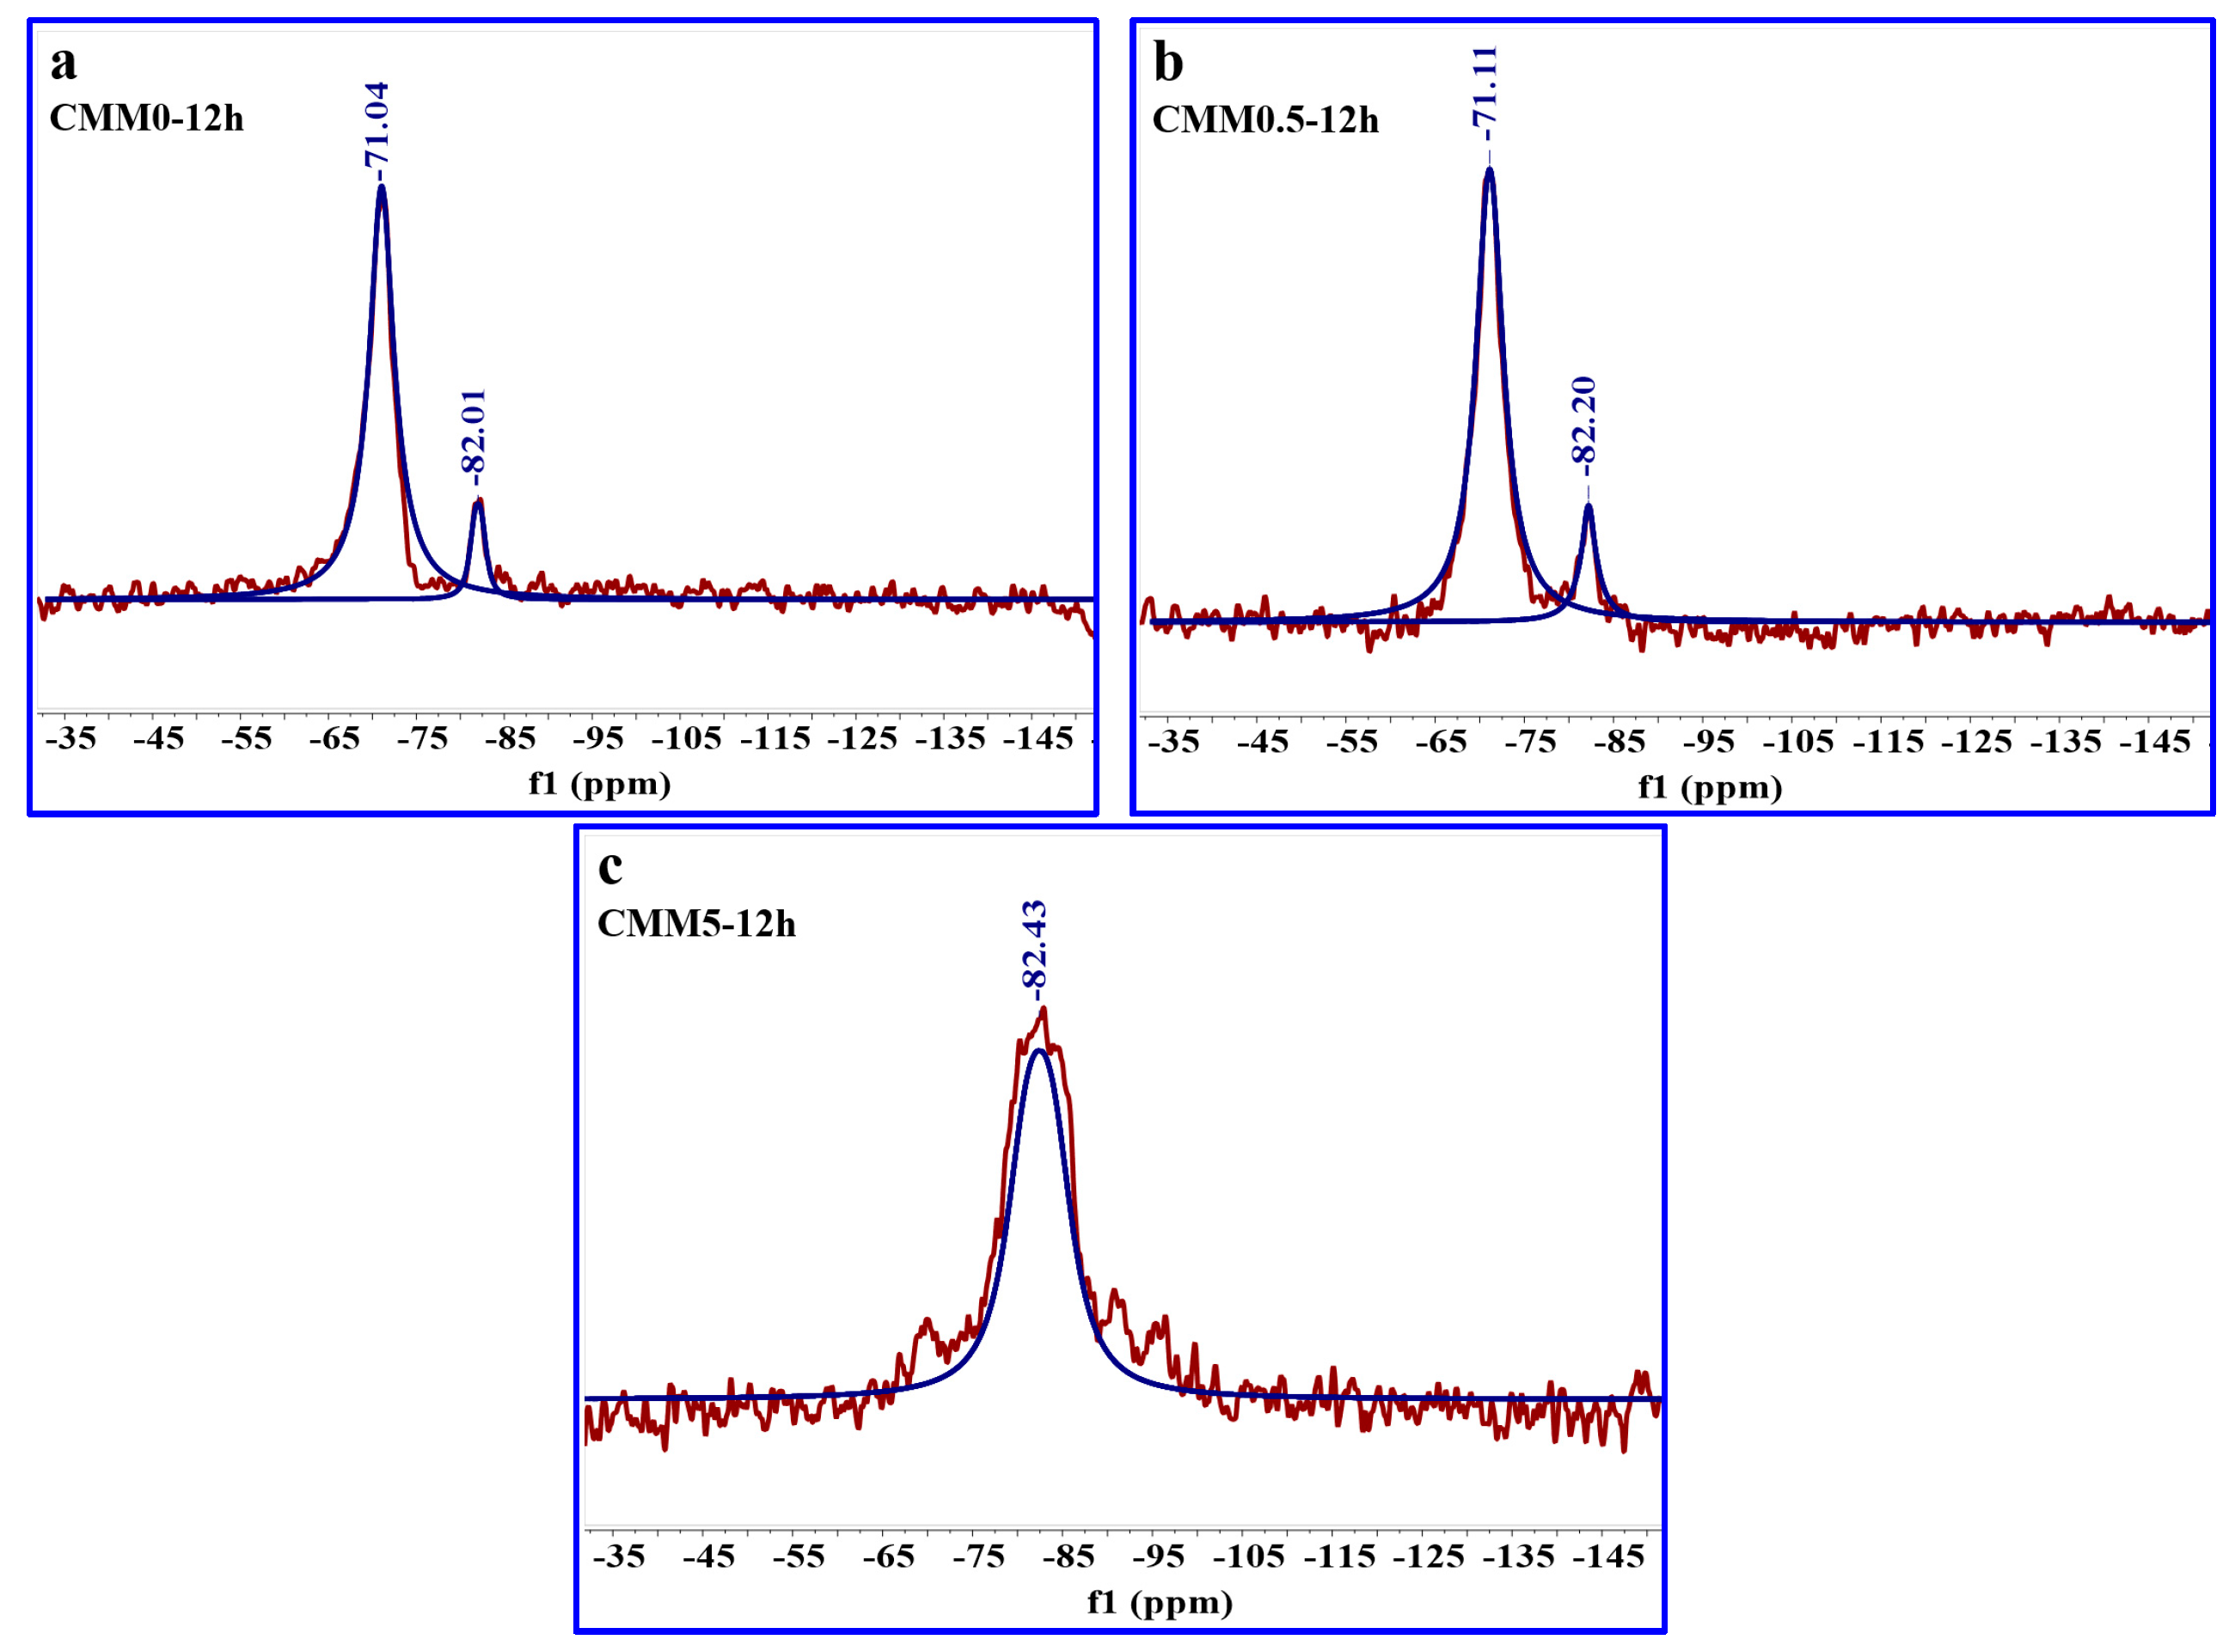
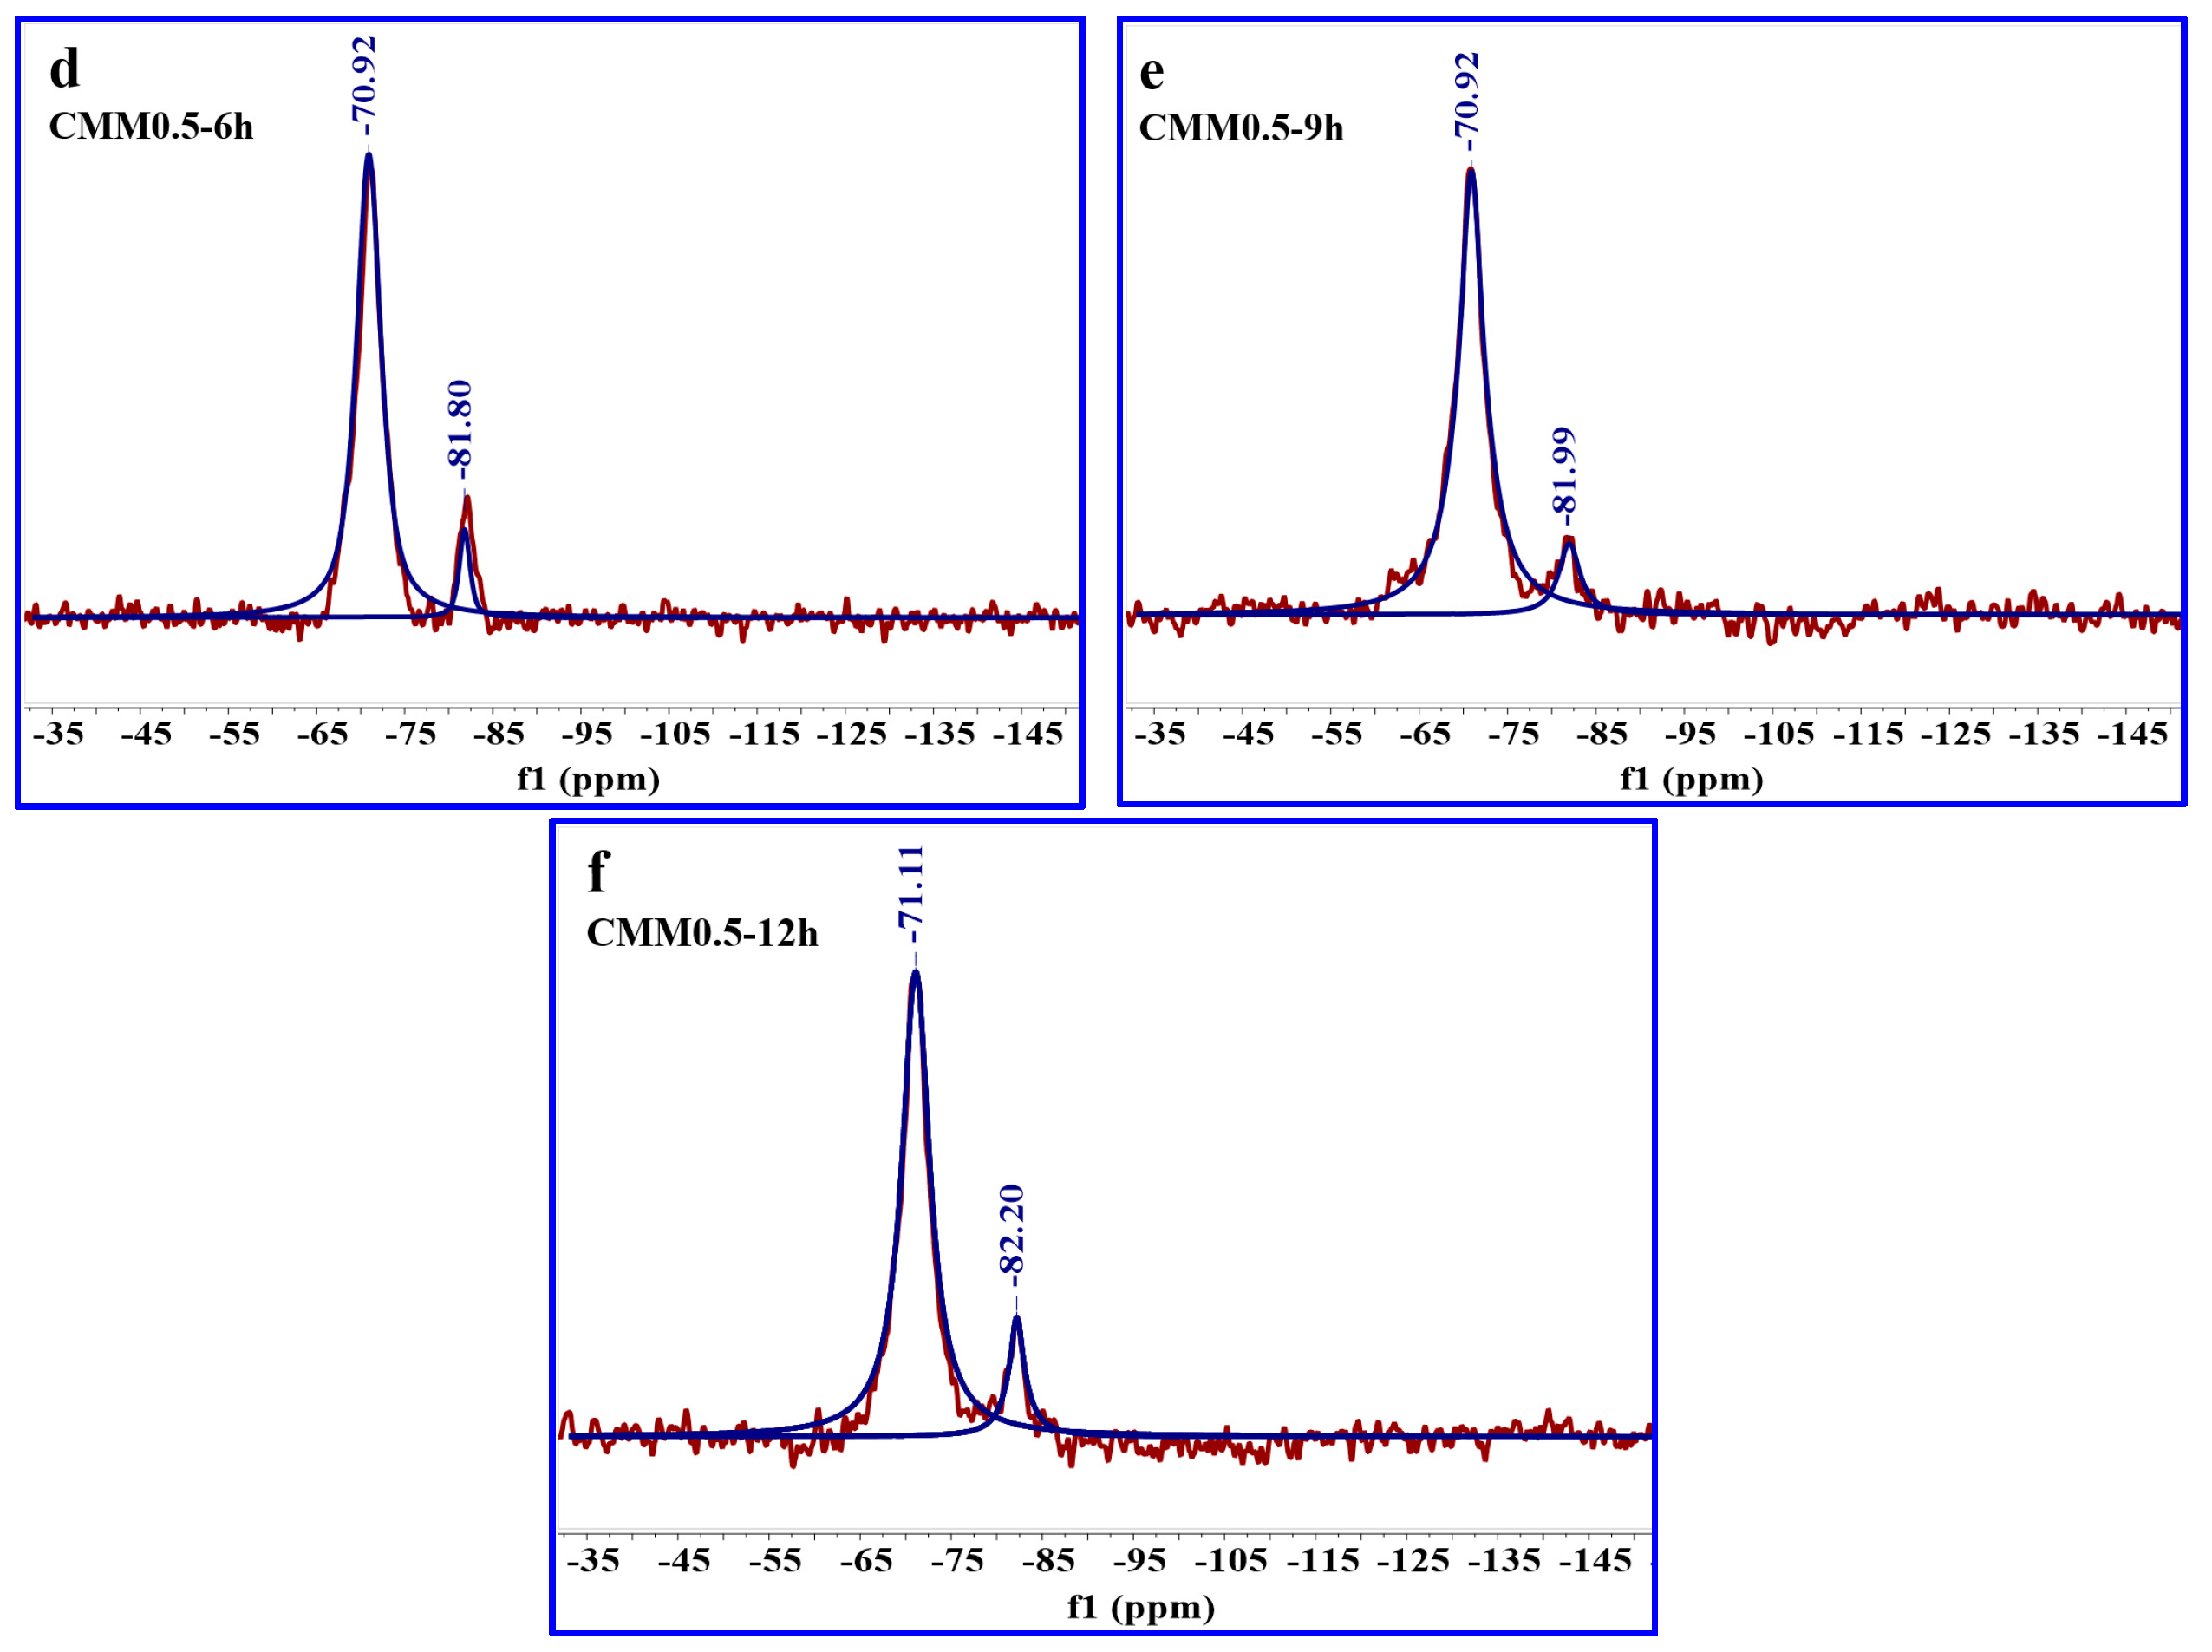
3.4.3. 29Si MAS NMR
3.5. Environmental Performance
3.5.1. Heavy Metal Leaching
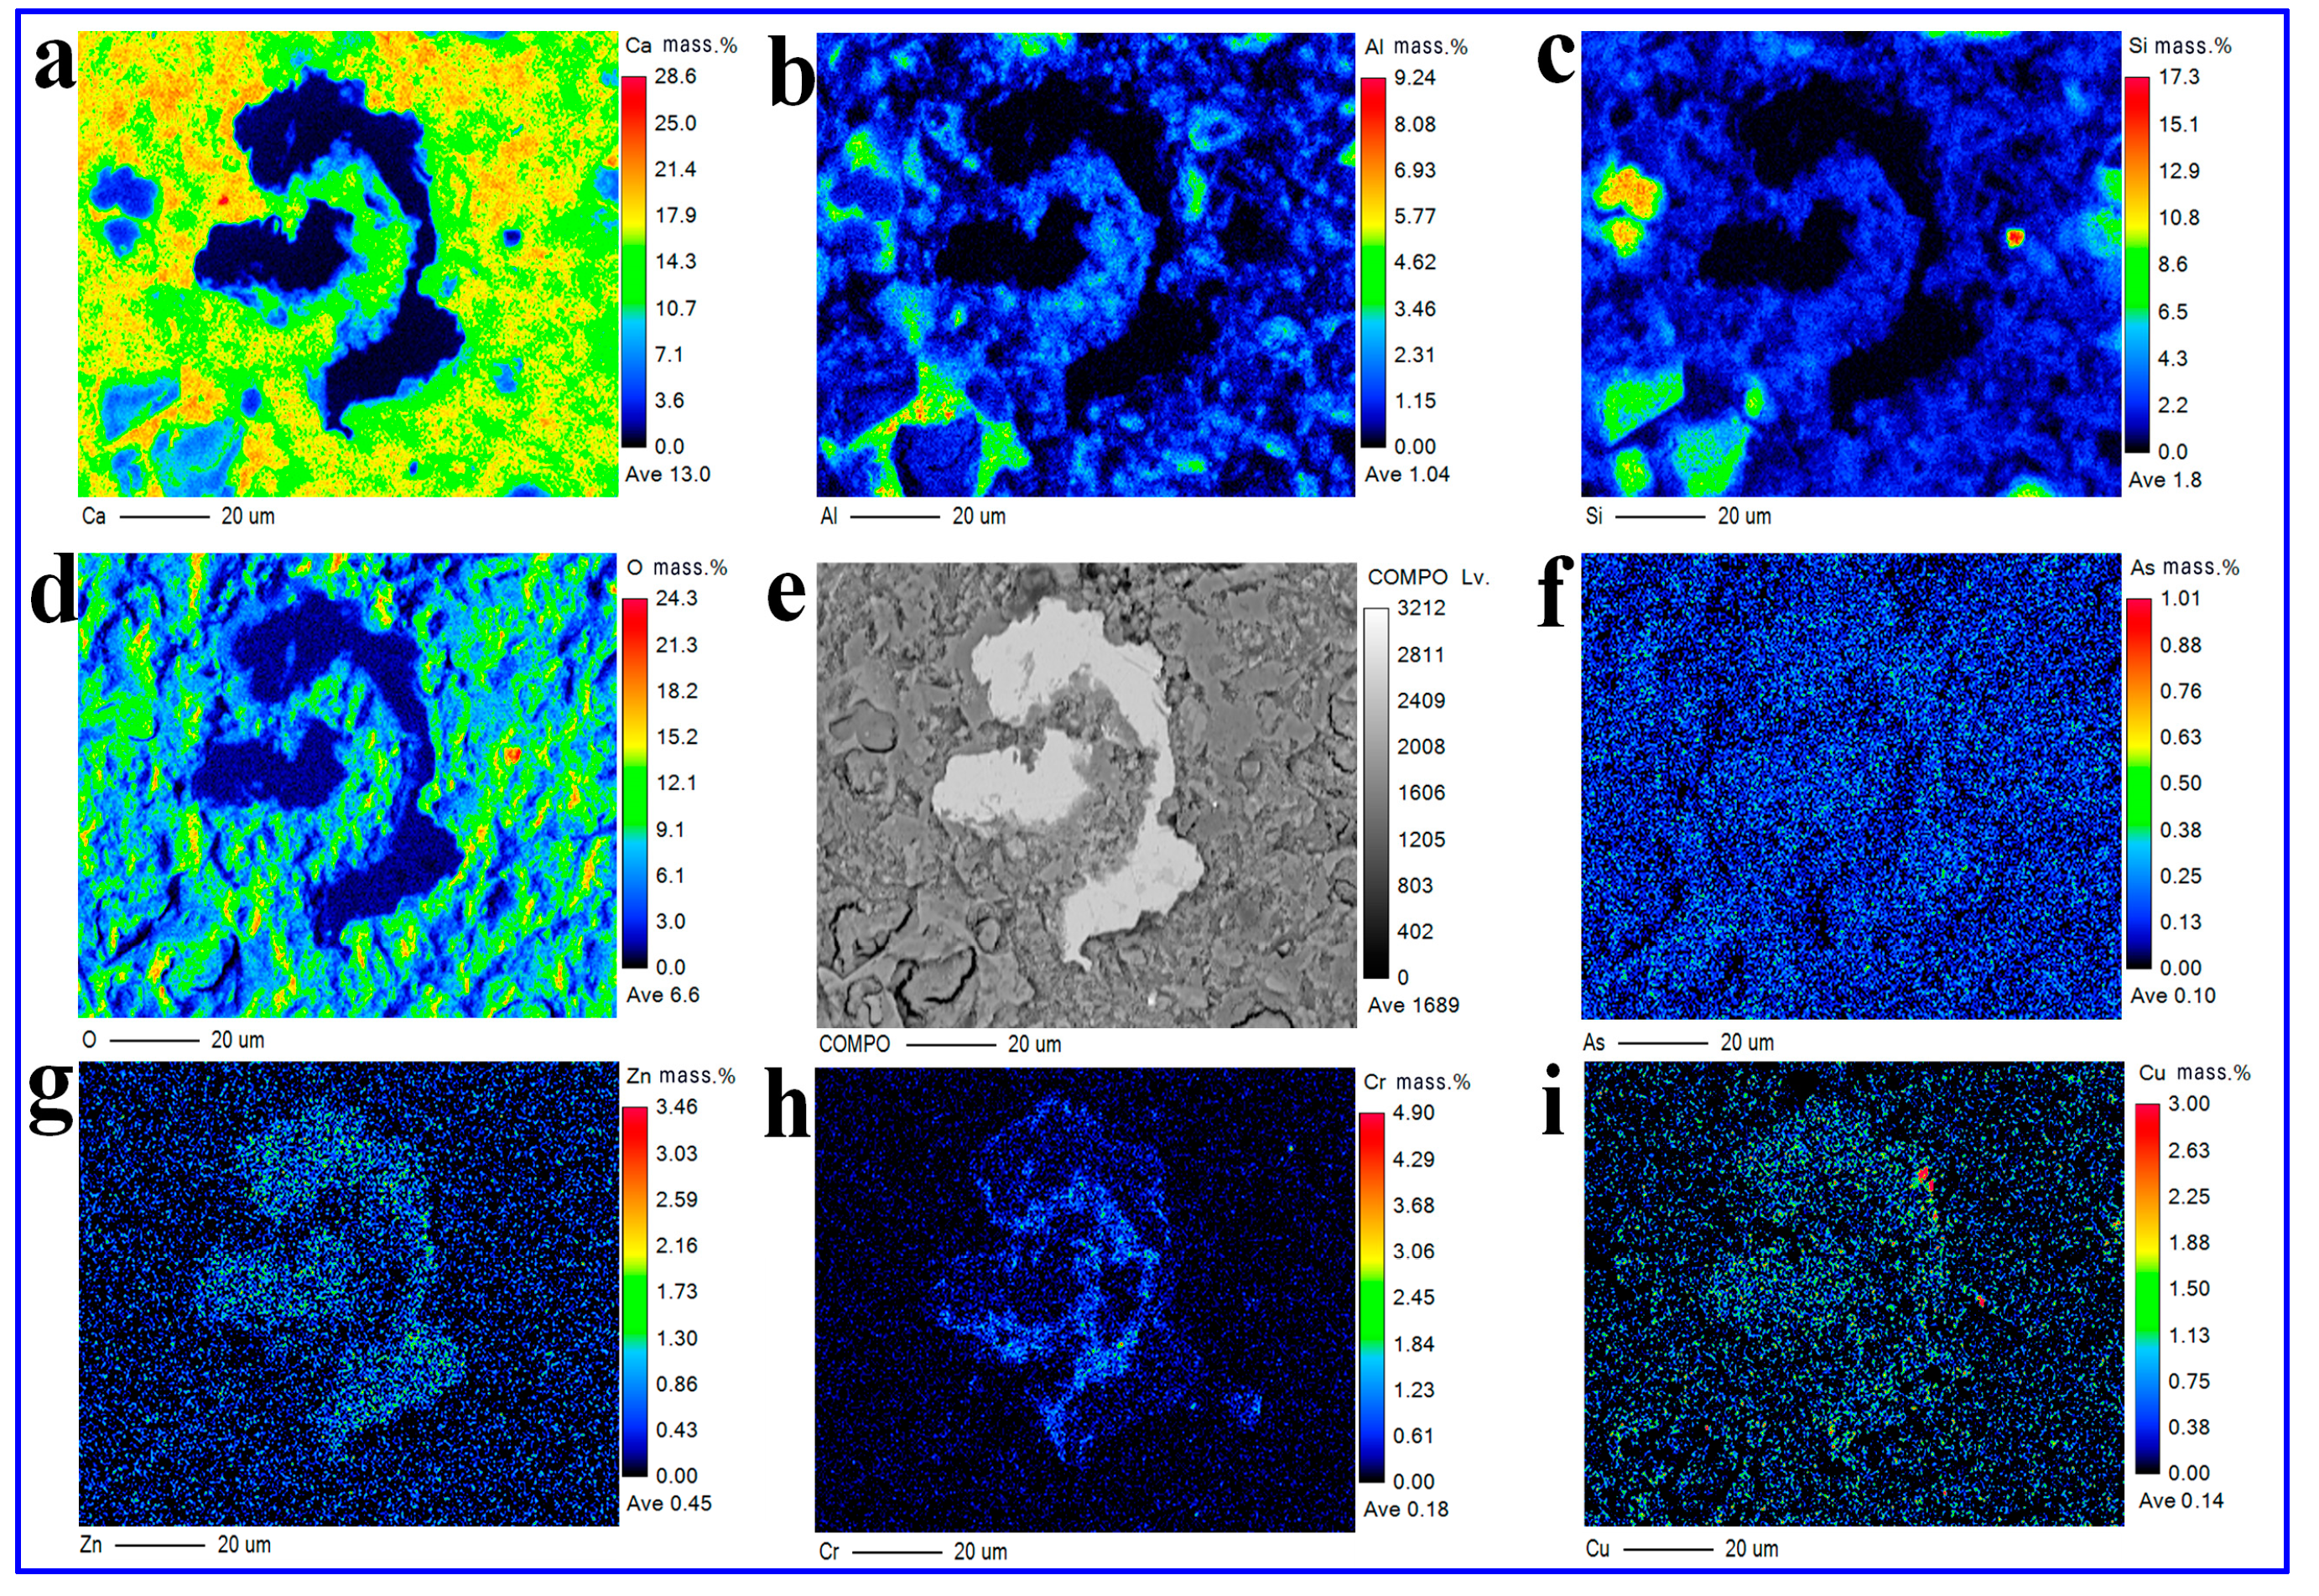
3.5.2. EPMA
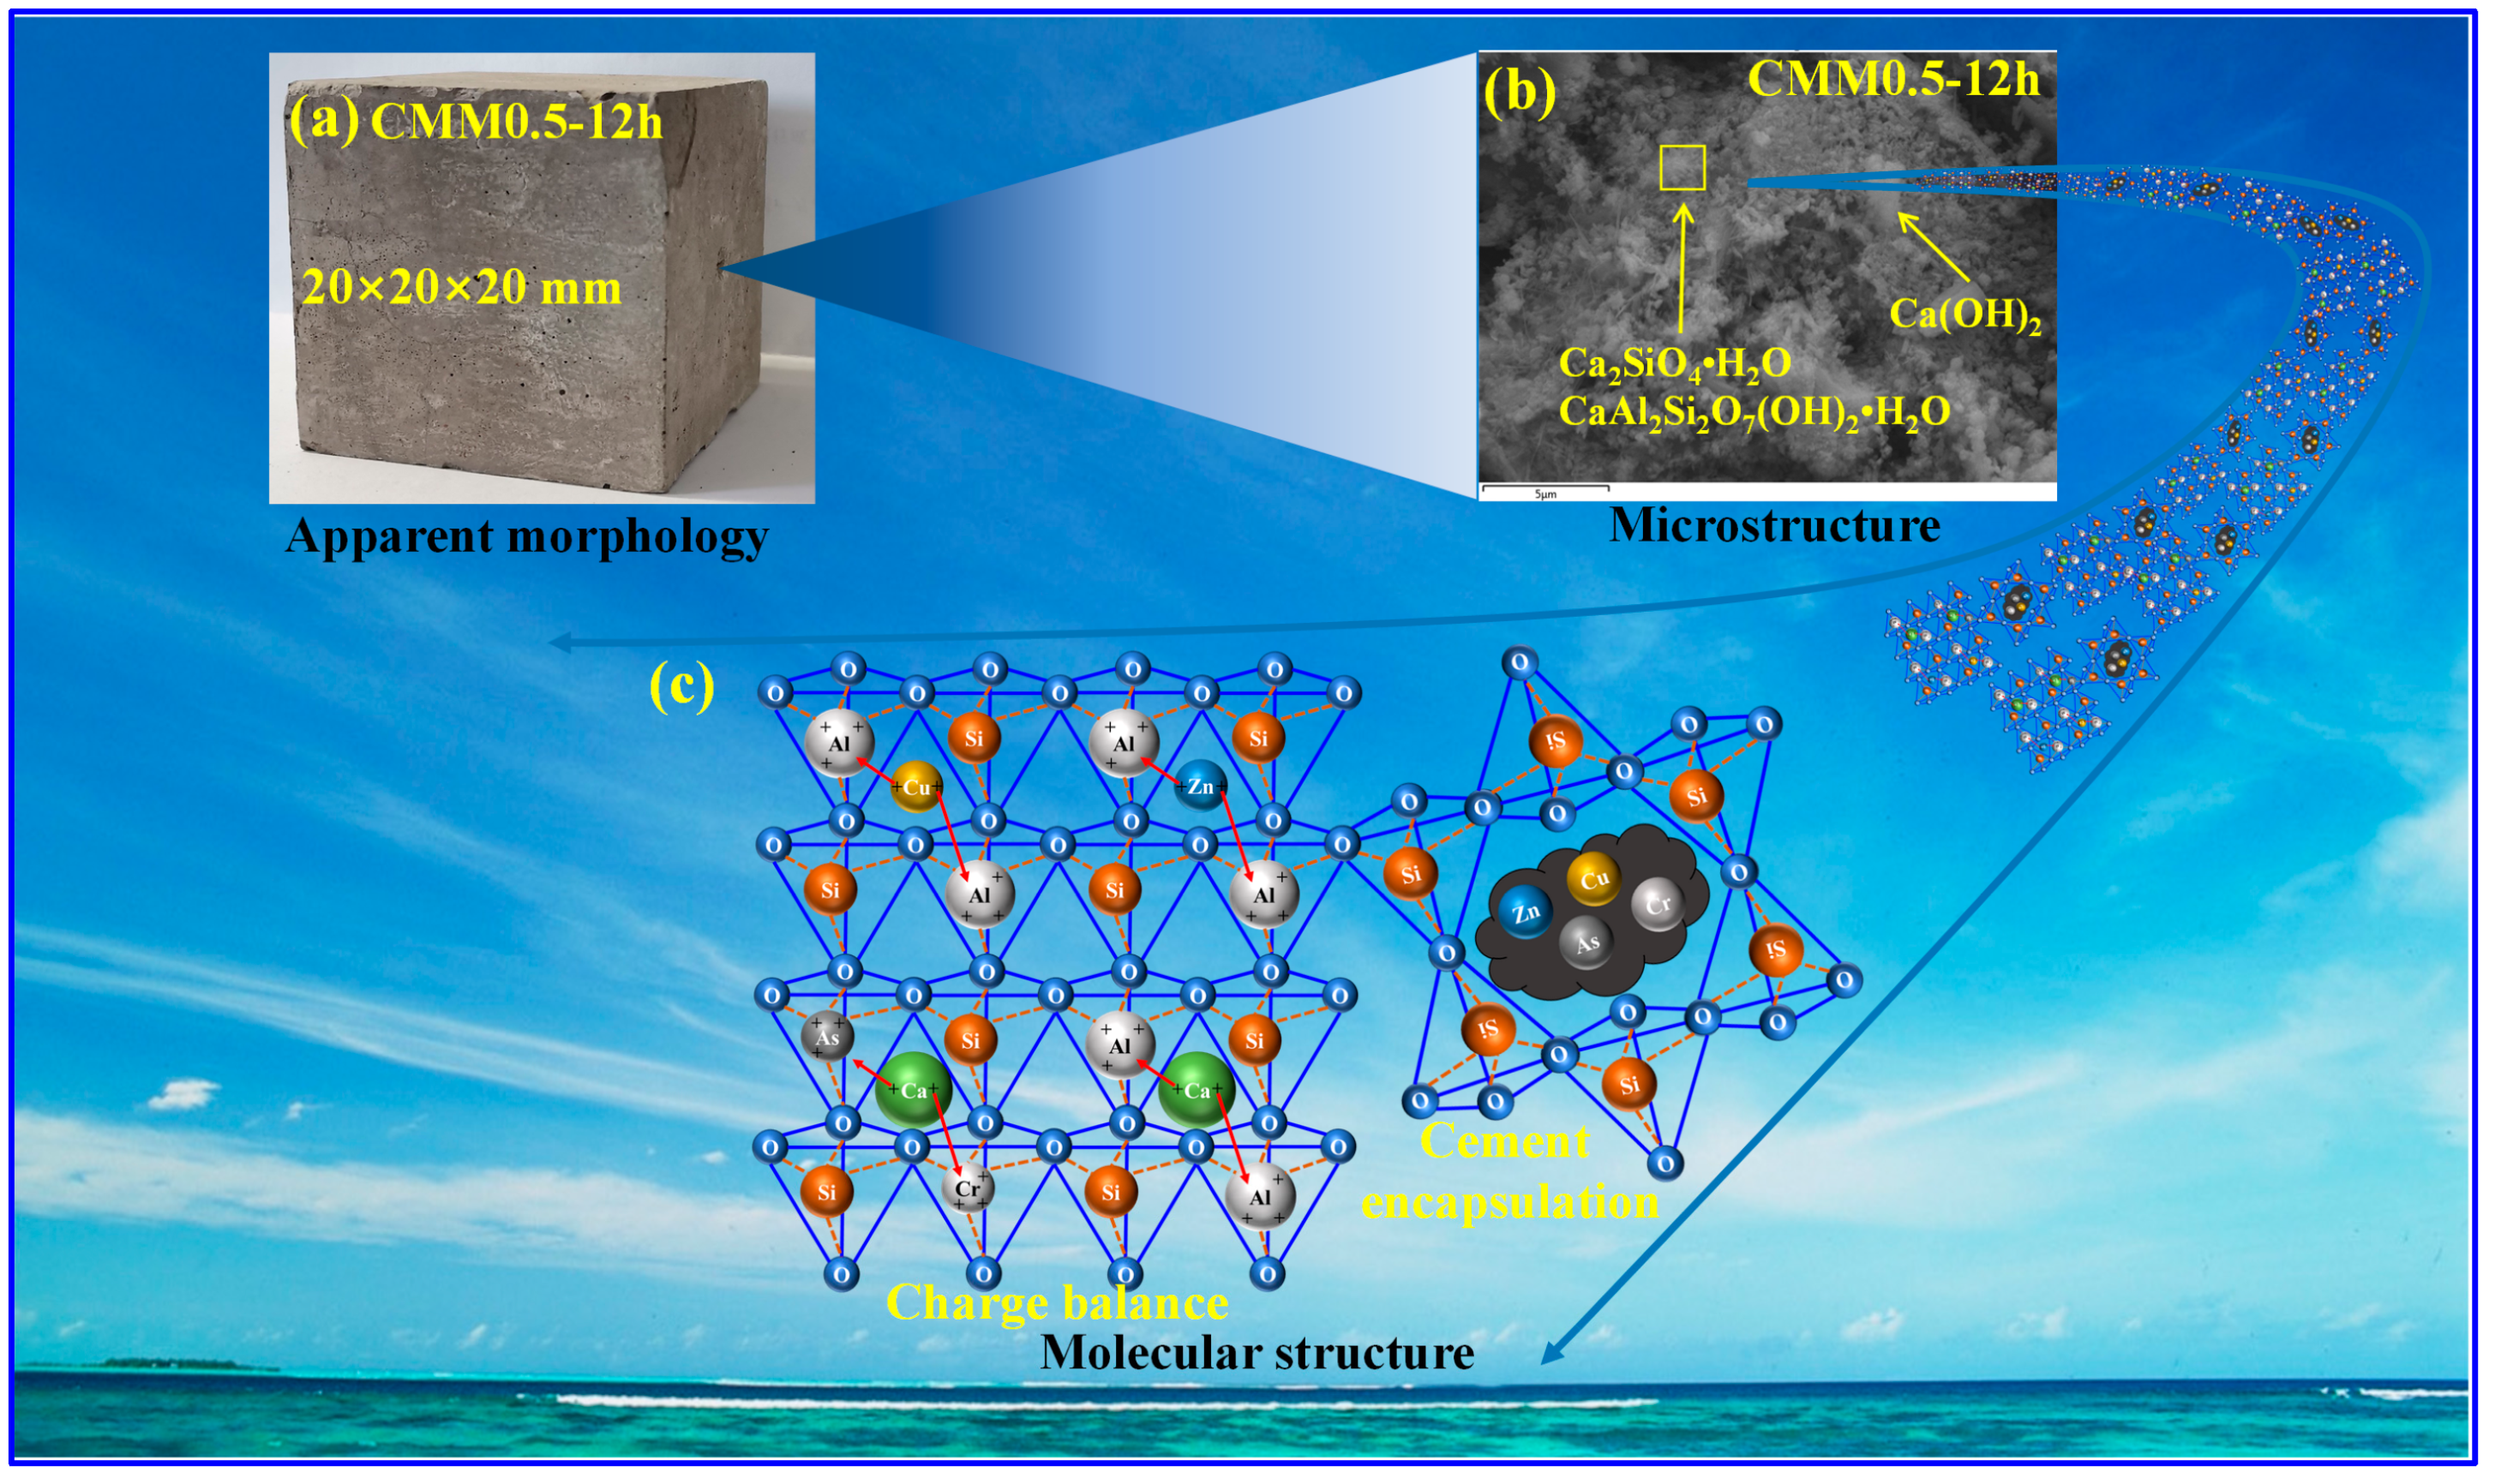
3.5.3. Consolidation Mechanism
4. Conclusions
- (1)
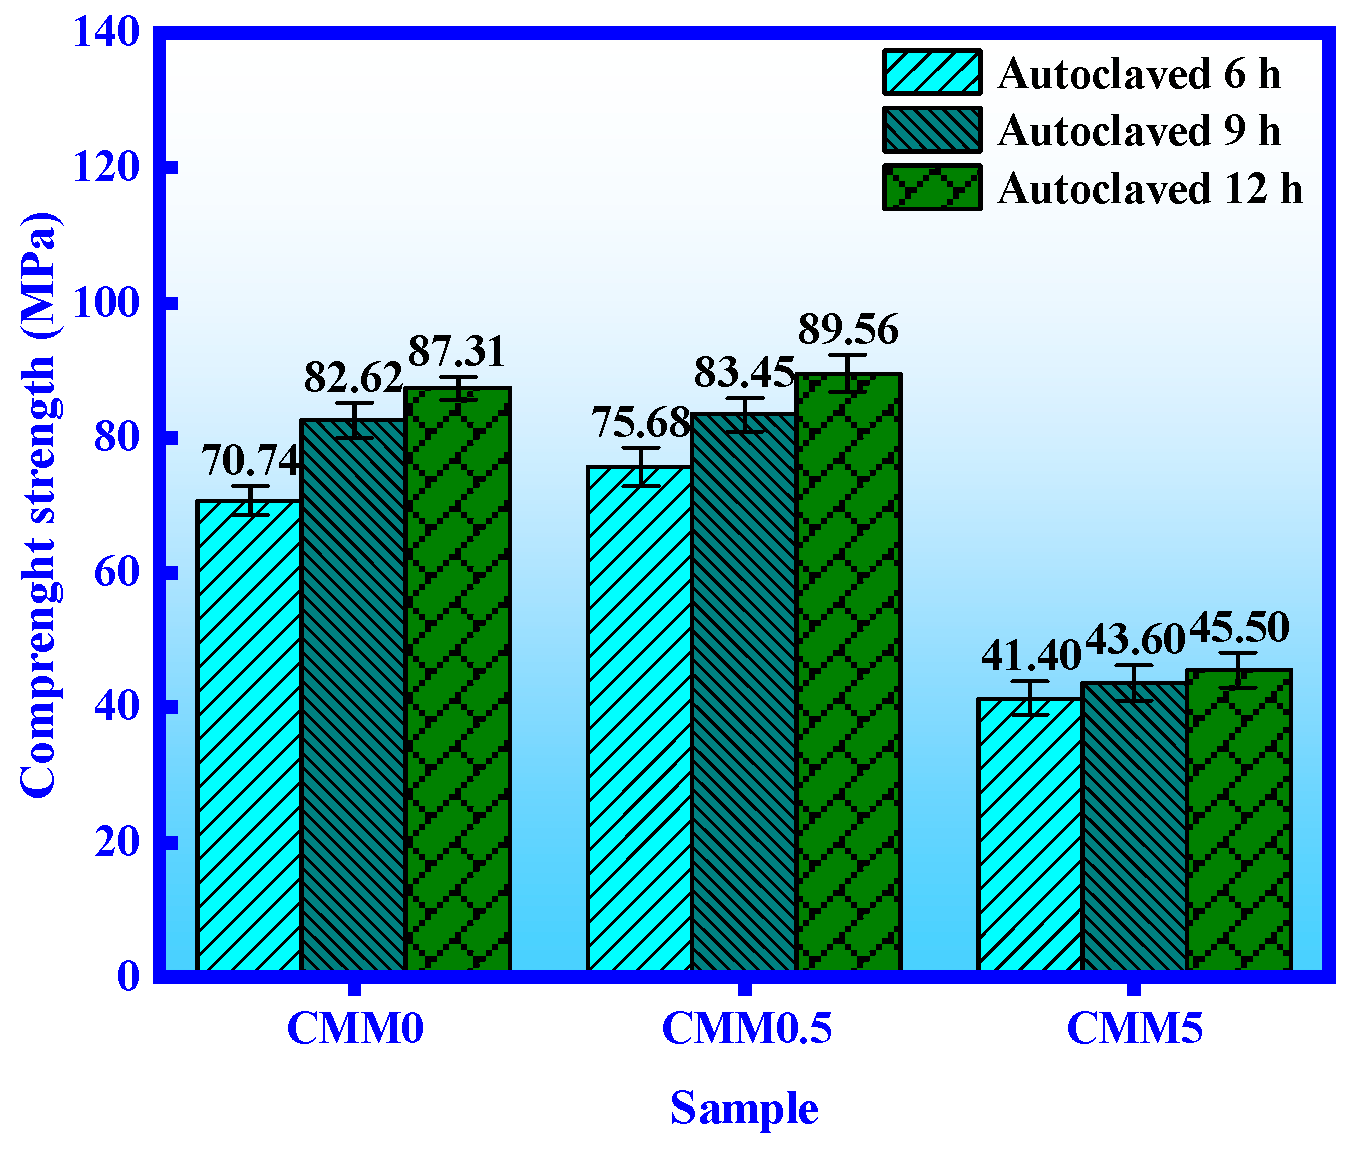
- The normal and autoclaved strength of CMM0.5 are the highest. The compressive strength of CMM0.5 autoclaved for 6, 9 and 12 h is 75.68 MPa, 83.45 MPa and 89.56 MPa, respectively. In addition, the compressive strength of CMM0.5 is 37.41 MPa and 67.21 MPa at normal curing 3 and 28 days, which satisfies the standard of 52.5 OPC.
- (2)
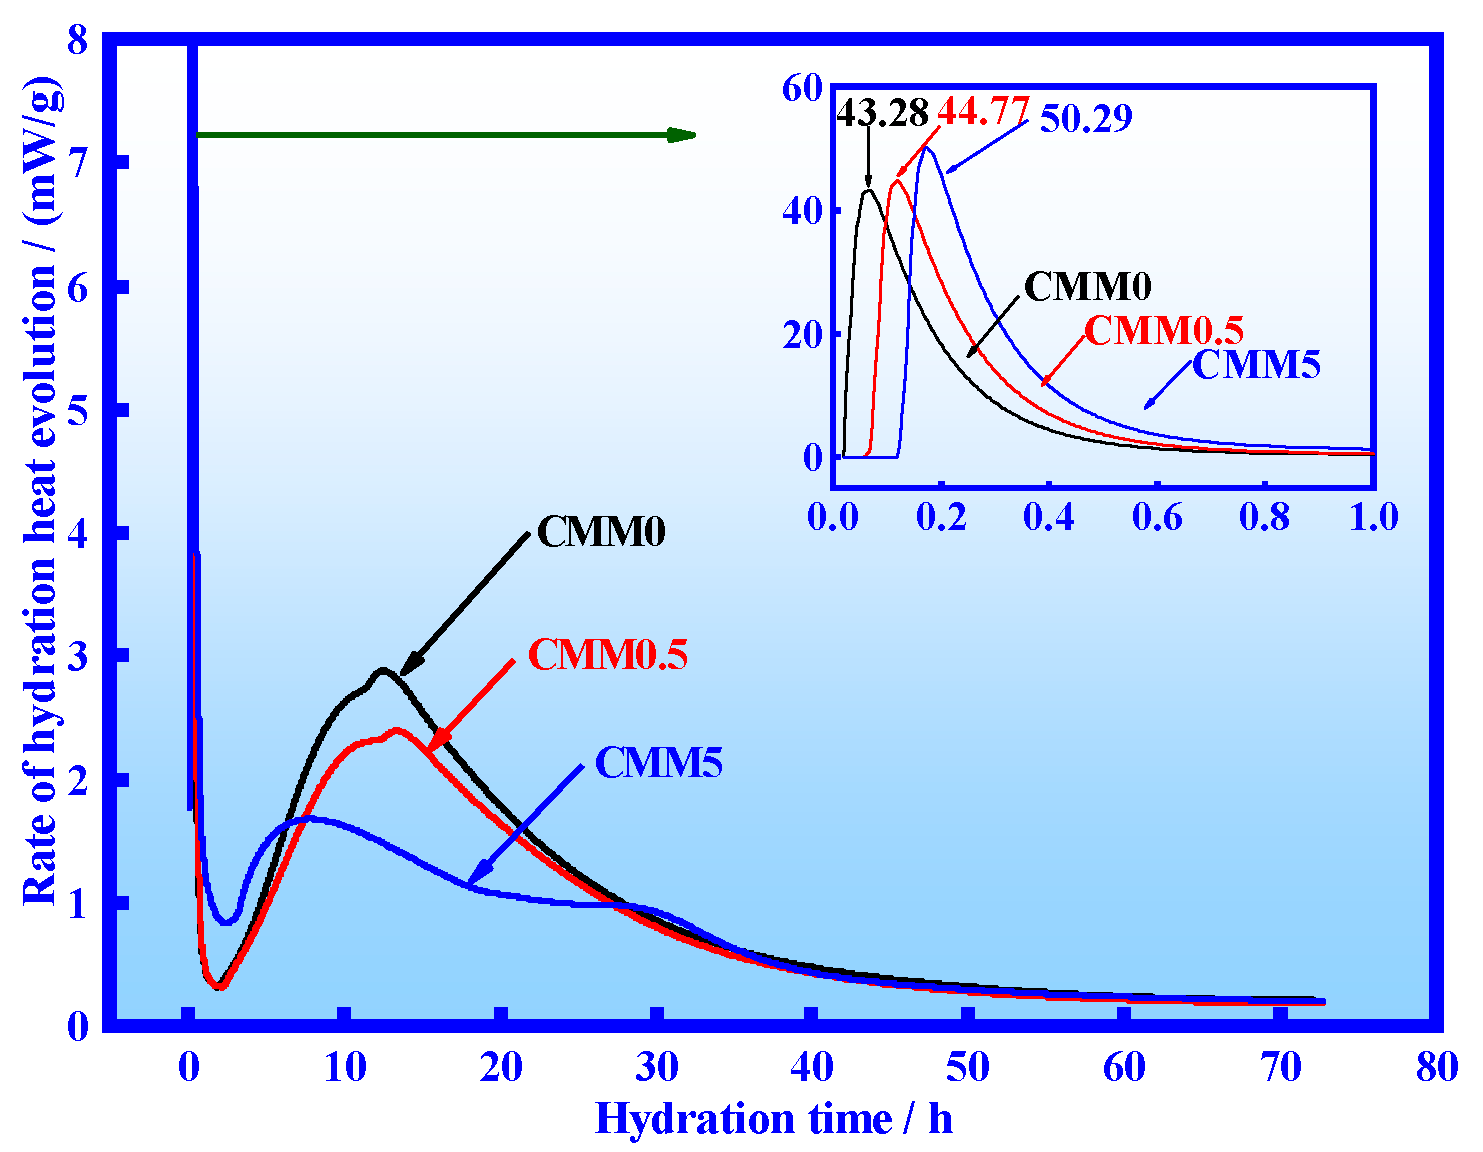
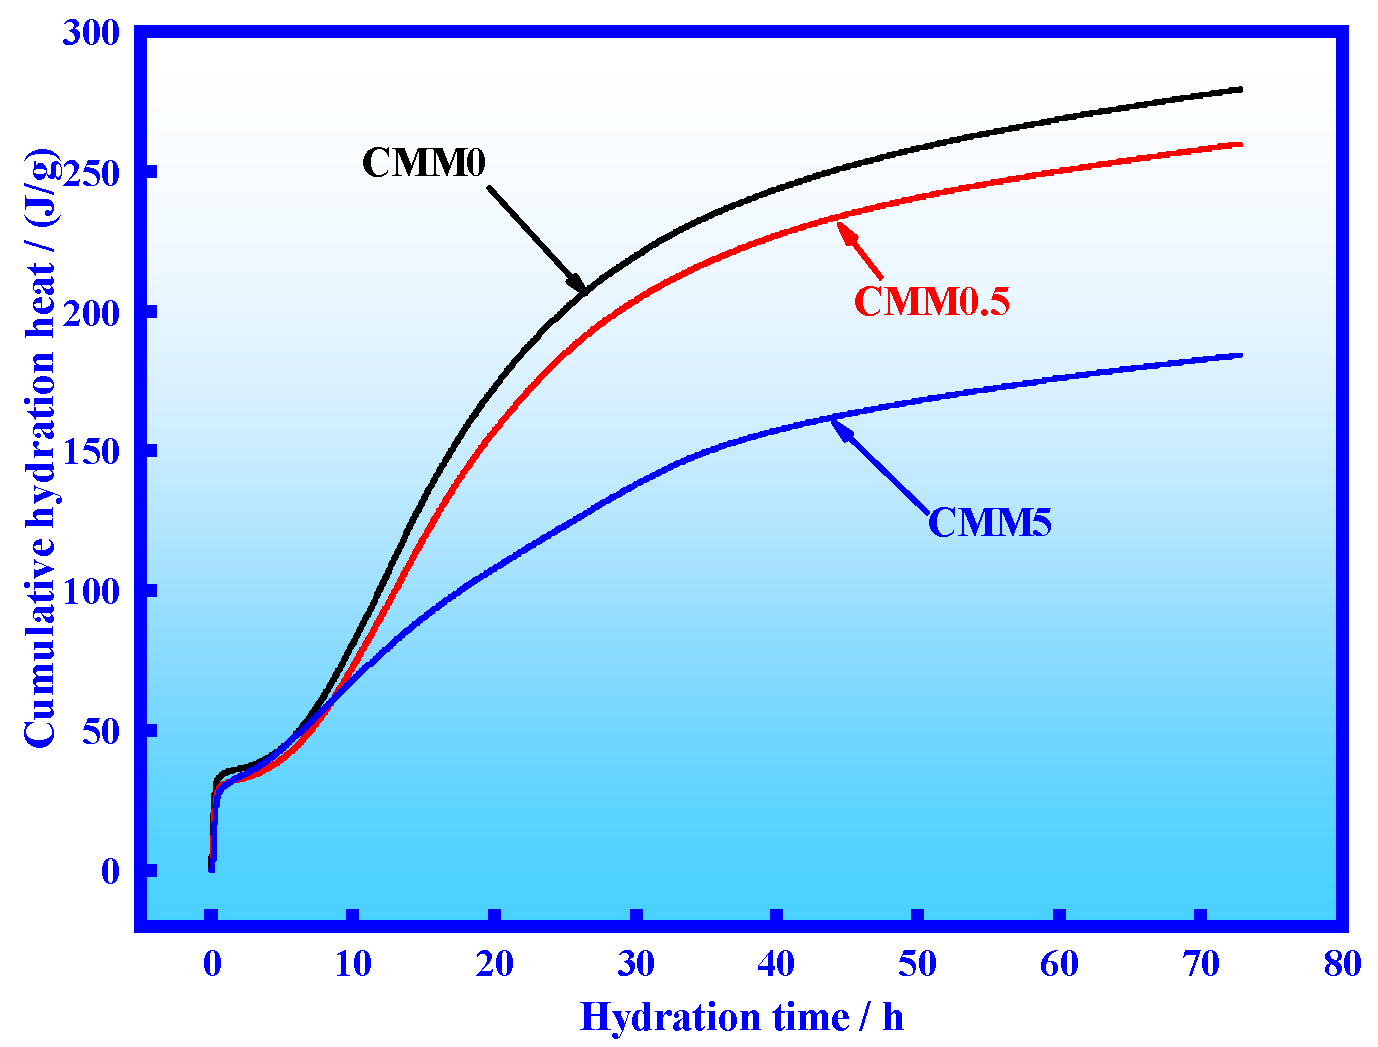
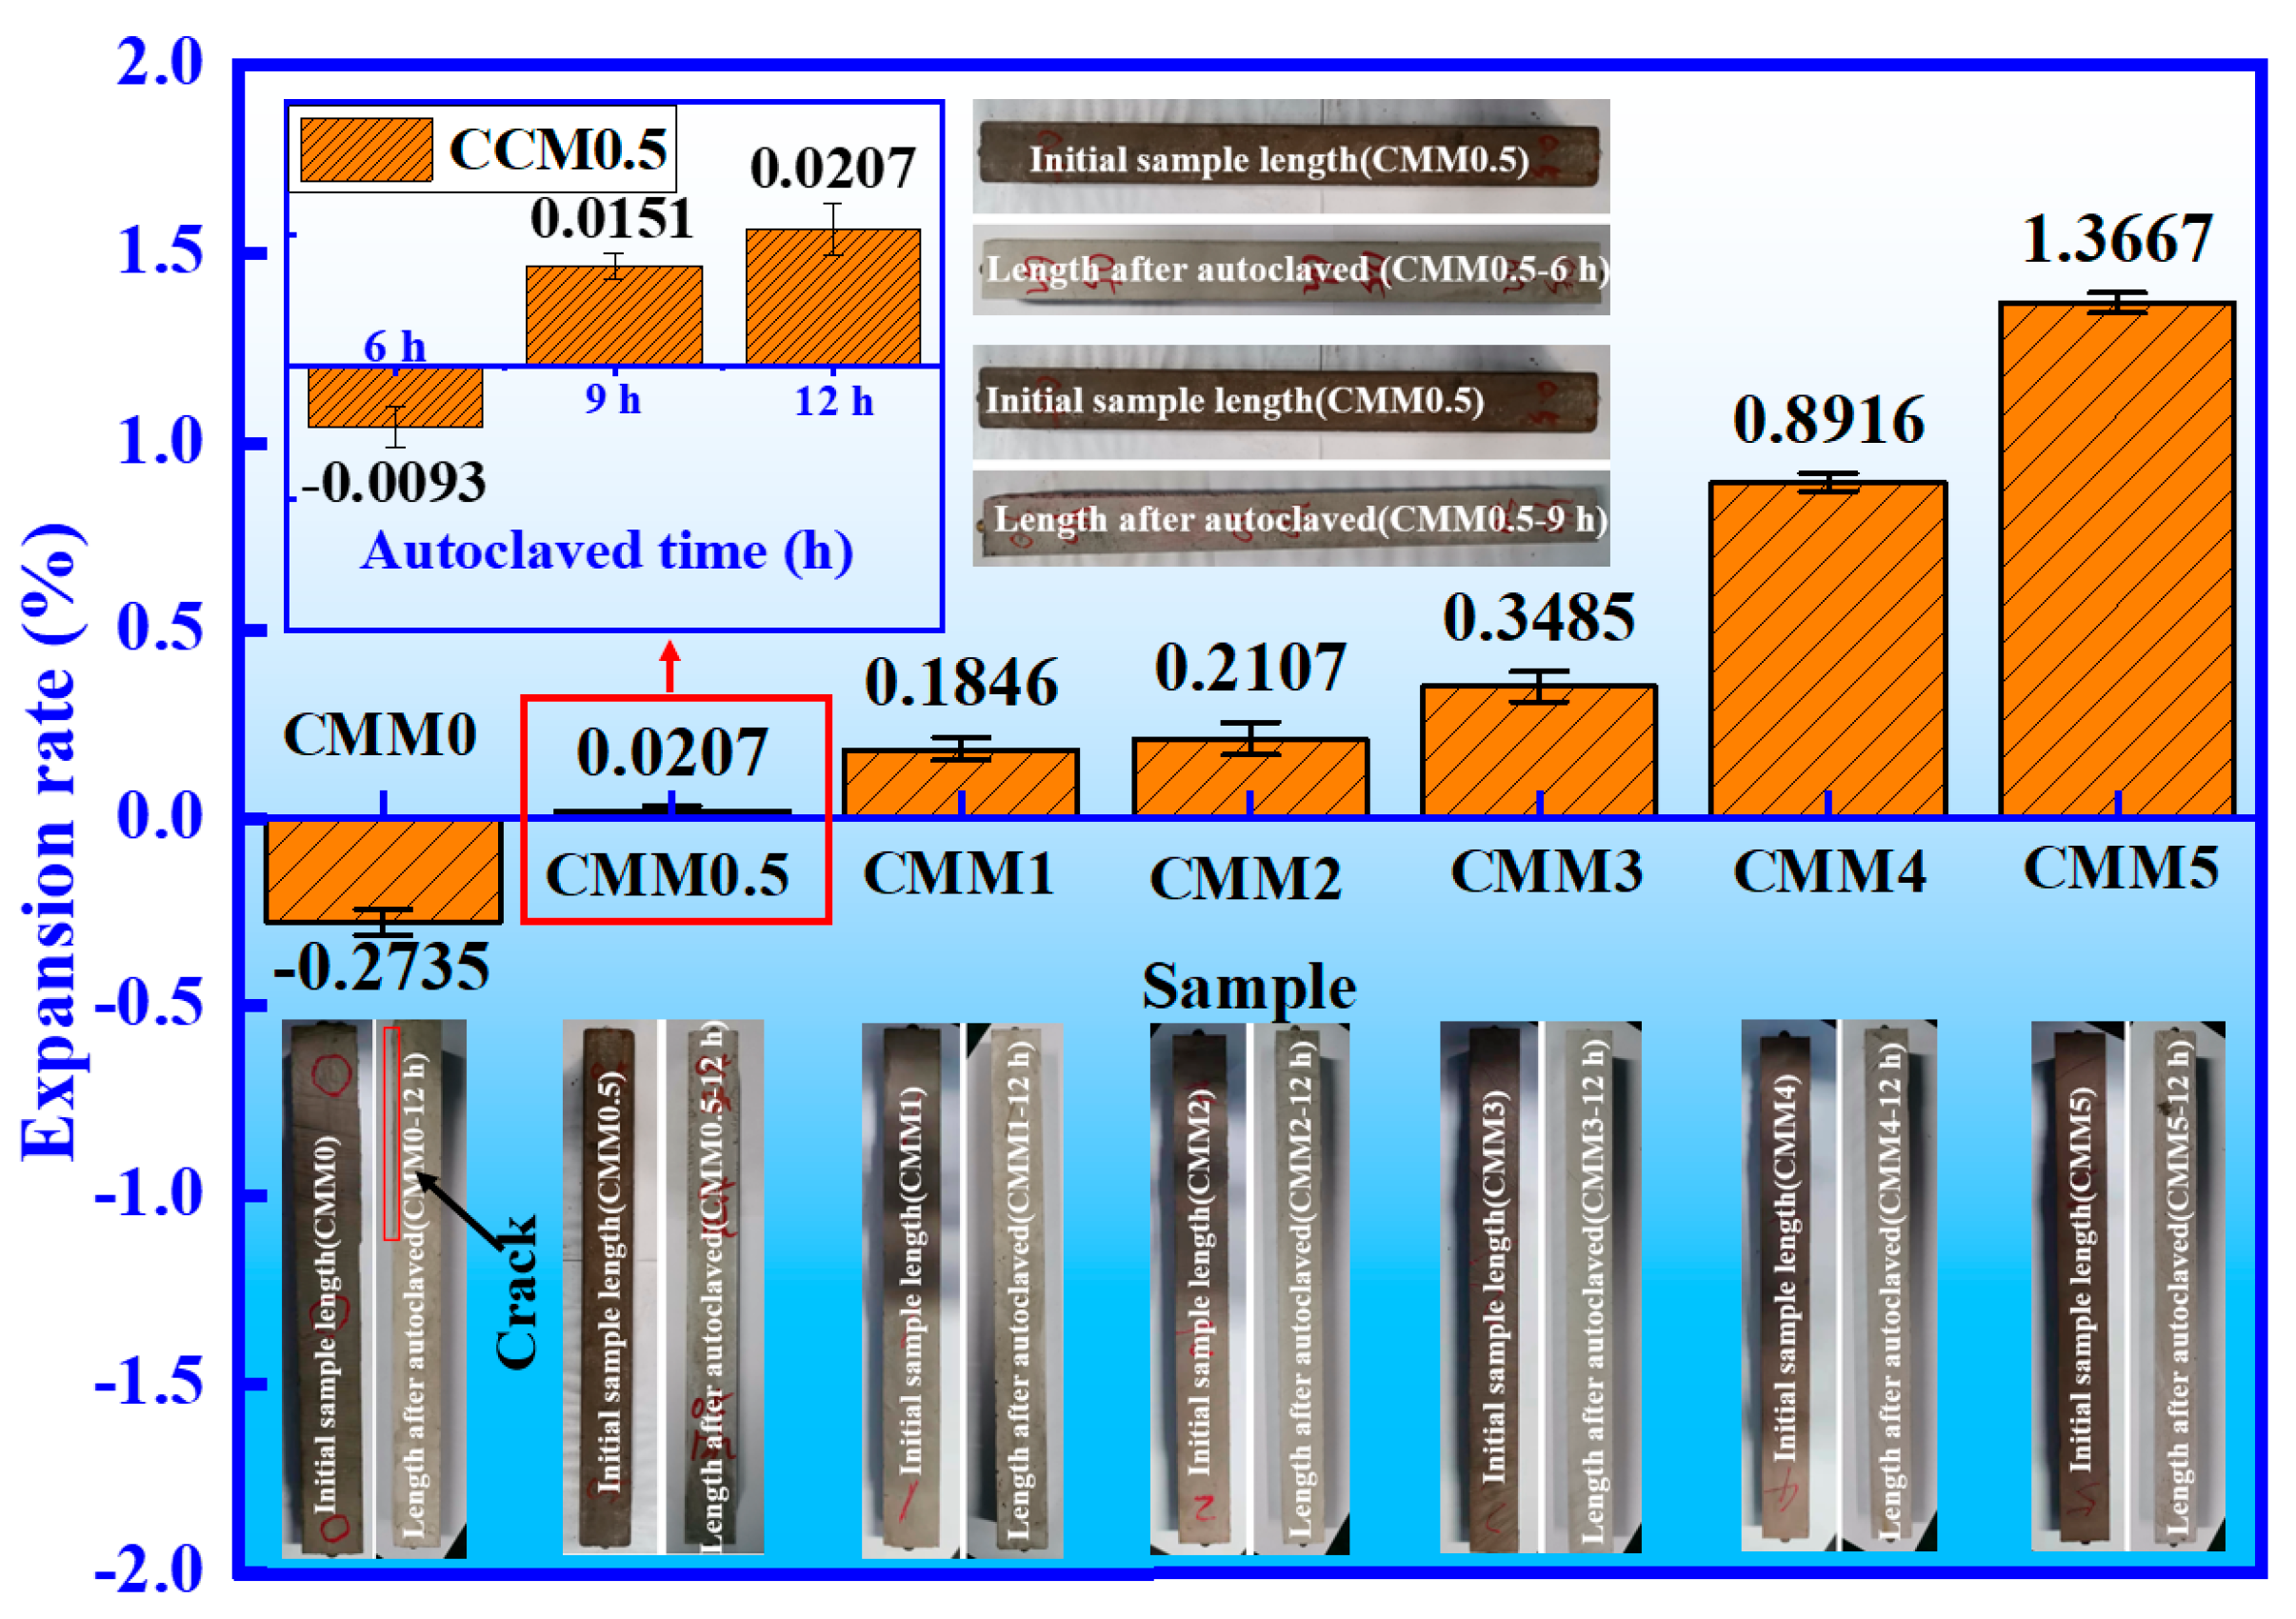
- CMM0.5 shows the lowest expansion rate (0.0207%), higher strength, and lower hydration heat. The long-term volume stability of CMM0.5 satisfies the cement expansion standard (≤0.5%) and avoids cement cracking.
- (3)
- The main autoclaved hydration products of CMM0.5 are C-S-H, C-A-S-H gel and Ca(OH)2. The densified microstructure and high polymerization degree are presented at CMM0.5. The microstructure and polymerization degree of the hydration product are beneficial to the strength development and long-term volume stability of CMM0.5.
- (4)
- Heavy metals are effectively consolidated by CMM0.5 due to physical encapsulation and charge balance. The lowest leaching concentration of heavy metals is shown at CMM0.5, which meet the WHO standards for drinking water. Therefore, CMM0.5 is an environment-friendly cementitious material with long-term volume stability.
Author Contributions
Funding
Institutional Review Board Statement
Informed Consent Statement
Data Availability Statement
Conflicts of Interest
References
- Zhang, S.; Shi, T.; Ni, W.; Li, K.; Gao, W.; Wang, K.; Zhang, Y. The mechanism of hydrating and solidifying green mine fill materials using circulating fluidized bed fly ash-slag-based agent. J. Hazard. Mater. 2021, 415, 125625. [Google Scholar] [CrossRef]
- Davies, T. Grasses more sensitive to SO2 pollution in conditions of low irradiance and short days. Nature 1980, 284, 483–485. [Google Scholar] [CrossRef]
- Uzal, B.; Turanl, L.; Yücel, H.; Göncüoğlu, M.C.; Çulfaz, A. Pozzolanic activity of clinoptilolite: A comparative study with silica fume, fly ash and a non-zeolitic natural pozzolan. Cem. Concr. Res. 2010, 40, 398–404. [Google Scholar] [CrossRef]
- Allen, S.J.; Ivanova, E.; Koumanova, B. Adsorption of sulfur dioxide on chemically modified natural clinoptilolite. Acid modification. Chem. Eng. J. 2009, 152, 389–395. [Google Scholar] [CrossRef]
- Engin, B.; Kayahan, U.; Atakül, H. A comparative study on the air, the oxygen-enriched air and the oxy-fuel combustion of lignites in CFB. Energy 2020, 196, 117021. [Google Scholar] [CrossRef]
- Li, J.; Chen, Z.; Li, L.; Qiao, Y.; Yuan, Z.; Zeng, L.; Li, Z. Study on pore and chemical structure characteristics of atmospheric circulating fluidized bed coal gasification fly ash. J. Clean. Prod. 2021, 308, 127395. [Google Scholar] [CrossRef]
- Qiu, R.; Cheng, F.; Huang, H. Removal of Cd2+ from aqueous solution using hydrothermally modified circulating fluidized bed fly ash resulting from coal gangue power plant. J. Clean. Prod. 2018, 172, 1918–1927. [Google Scholar] [CrossRef]
- Allen, S.J.; Gan, Q.; Matthews, R.; Johnson, P.A. Kinetic modeling of the adsorption of basic dyes by kudzu. J. Colloid Interface Sci. 2005, 286, 101–109. [Google Scholar] [CrossRef]
- Chen, R.; Zhang, T.; Guo, Y.; Wang, J.; Wei, J.; Yu, Q. Recent advances in simultaneous removal of SO2 and NOx from exhaust gases: Removal process, mechanism and kinetics. Chem. Eng. J. 2020, 420, 127588. [Google Scholar] [CrossRef]
- Park, J.-H.; Ahn, J.-W.; Kim, K.-H.; Son, Y.-S. Historic and futuristic review of electron beam technology for the treatment of SO2 and NOx in flue gas. Chem. Eng. J. 2019, 355, 351–366. [Google Scholar] [CrossRef]
- Wan, X.; Taskinen, P.; Shi, J.; Jokilaakso, A. A potential industrial waste–waste co-treatment process of utilizing waste SO2 gas and residue heat to recover Co, Ni, and Cu from copper smelting slag. J. Hazard. Mater. 2021, 414, 125541. [Google Scholar] [CrossRef]
- Yin, S.; Wu, X.; Yuan, P.; Zhang, Y. Study on the preparation of fly ash-slag composite ultrafine powder and its application in cement. Cement 2020, 1–4. [Google Scholar] [CrossRef]
- Preston, A. Heavy Metals in British Waters. Nature 1973, 242, 95–97. [Google Scholar] [CrossRef]
- Zhang, H.; Yuan, X.; Xiong, T.; Wang, H.; Jiang, L. Bioremediation of co-contaminated soil with heavy metals and pesticides: Influence factors, mechanisms and evaluation methods. Chem. Eng. J. 2020, 398, 125657. [Google Scholar] [CrossRef]
- Zhao, X.; Yu, X.; Wang, X.; Lai, S.; Sun, Y.; Yang, D. Recent advances in metal-organic frameworks for the removal of heavy metal oxoanions from water. Chem. Eng. J. 2021, 407, 127221. [Google Scholar] [CrossRef]
- Al-Ghouti, M.A.; Khraisheh, M.A.M.; Ahmad, M.N.M.; Allen, S. Adsorption behaviour of methylene blue onto Jordanian diatomite: A kinetic study. J. Hazard. Mater. 2009, 165, 589–598. [Google Scholar] [CrossRef] [PubMed]
- Guo, J.; Liu, X.; Yu, J.; Xu, C.; Wu, Y.; Pan, D.; Senthil, R.A. An overview of the comprehensive utilization of silicon-based solid waste related to PV industry. Resour. Conserv. Recycl. 2021, 169, 105450. [Google Scholar] [CrossRef]
- Ding, Y.; Zhao, J.; Liu, J.-W.; Zhou, J.; Cheng, L.; Zhao, J.; Shao, Z.; Iris, Ç.; Pan, B.; Li, X.; et al. A review of China’s municipal solid waste (MSW) and comparison with international regions: Management and technologies in treatment and resource utilization. J. Clean. Prod. 2021, 293, 126144. [Google Scholar] [CrossRef]
- Chien Bong, C.P.; Ho, W.S.; Hashim, H.; Lim, J.S.; Ho, C.S.; Peng Tan, W.S.; Lee, C.T. Review on the renewable energy and solid waste management policies towards biogas development in Malaysia. Renew. Sustain. Energy Rev. 2017, 70, 988–998. [Google Scholar] [CrossRef]
- Zhou, M.; Chen, P.; Chen, X.; Ge, X.; Wang, Y. Study on hydration characteristics of circulating fluidized bed combustion fly ash (CFBCA). Constr. Build. Mater. 2020, 251, 118993. [Google Scholar] [CrossRef]
- Li, D.; Sun, R.; Wang, D.; Ren, C.; Fang, K. Study on the pozzolanic activity of ultrafine circulating fluidized-bed fly ash prepared by jet mill. Fuel 2021, 291, 120220. [Google Scholar] [CrossRef]
- Siddique, S.; Kim, H.; Jang, J.G. Properties of high-volume slag cement mortar incorporating circulating fluidized bed combustion fly ash and bottom ash. Constr. Build. Mater. 2021, 289, 123150. [Google Scholar] [CrossRef]
- Zahedi, M.; Jafari, K.; Rajabipour, F. Properties and durability of concrete containing fluidized bed combustion (FBC) fly ash. Constr. Build. Mater. 2020, 258, 119663. [Google Scholar] [CrossRef]
- Jang, J.G.; Park, S.-M.; Chung, S.; Ahn, J.-W.; Kim, H.-K. Utilization of circulating fluidized bed combustion ash in producing controlled low-strength materials with cement or sodium carbonate as activator. Constr. Build. Mater. 2018, 159, 642–651. [Google Scholar] [CrossRef]
- Chen, X.; Gao, J.; Yan, Y.; Liu, Y. Investigation of expansion properties of cement paste with circulating fluidized bed fly ash. Constr. Build. Mater. 2017, 157, 1154–1162. [Google Scholar] [CrossRef]
- GB/T 8074-2008. Testing Method for Specific Surface of Cement. Blaine Method. 2008. Available online: https://www.antpedia.com/standard/5179370.html (accessed on 1 August 2008).
- GB/T17671-1999. Method of Testing Cements—Determination of Strength. 1999. Available online: https://www.antpedia.com/standard/385067.html (accessed on 1 May 1999).
- GB/T 750-1992. Autoclave Method for Soundness of Portland Cement. 1992. Available online: https://www.antpedia.com/standard/75783-1.html (accessed on 1 June 1993).
- Qiang, Q. Comparative analysis of the content of free calcium oxide in steel slag by different methods. Cem. Eng. 2019, 2, 60–63. [Google Scholar] [CrossRef]
- GB 5086.1-1997. Test Method Standard for Leaching Toxicity of Solid Wastes—Roll Over Leaching Procedure. 1997. Available online: https://www.antpedia.com/standard/351944.html (accessed on 1 July 1998).
- Zou, F.; Zhang, M.; Hu, C.; Wang, F.; Hu, S. Novel C-A-S-H/PCE nanocomposites: Design, characterization and the effect on cement hydration. Chem. Eng. J. 2021, 412, 128569. [Google Scholar] [CrossRef]
- He, J.; Li, S.; Wang, X.; Gao, C.; Zhou, Y.; Zhou, Z. Effect of composite admixtures on fluidity and long-term strenght of cement mortar. Concr. Cem. Prod. 2021, 1, 1–6. [Google Scholar] [CrossRef]
- Zhang, N.; Li, H.; Liu, X. Hydration mechanism an leaching behavior of bauxite-calcination-method red mud-coal gangue based cementitious materials. J. Hazard. Mater. 2016, 314, 172–180. [Google Scholar] [CrossRef] [PubMed]
- Tsunashima, Y.; Iizuka, A.; Akimoto, J.; Hongo, T.; Yamasaki, A. Preparation of sorbents containing ettringite phase from concrete sludge and their performance in removing borate and fluoride ions from waste water. Chem. Eng. J. 2012, 200–202, 338–343. [Google Scholar] [CrossRef]
- Shi, W.; Najimi, M.; Shafei, B. Reinforcement corrosion and transport of water and chloride ions in shrinkage-compensating cement concretes. Cem. Concr. Res. 2020, 135, 106121. [Google Scholar] [CrossRef]
- Szeląg, M. Fractal characterization of thermal cracking patterns and fracture zone in low-alkali cement matrix modified with microsilica. Cem. Concr. Compos. 2020, 114, 103732. [Google Scholar] [CrossRef]
- Zhou, Q.; Glasser, F.P. Thermal stability and decomposition mechanisms of ettringite at <120 °C. Cem. Concr. Res. 2001, 31, 1333–1339. [Google Scholar] [CrossRef]
- Zhu, X.; Tang, D.; Yang, K.; Zhang, Z.; Li, Q.; Pan, Q.; Yang, C. Effect of Ca(OH)2 on shrinkage characteristics and microstructures of alkali-activated slag concrete. Constr. Build. Mater. 2018, 175, 467–482. [Google Scholar] [CrossRef] [Green Version]
- Liu, X.; Zhang, N.; Yao, Y.; Sun, H.; Feng, H. Micro-structural characterization of the hydration products of bauxite-calcination-method red mud-coal gangue based cementitious materials. J. Hazard. Mater. 2013, 262, 428–438. [Google Scholar] [CrossRef]
- Andersen, M.D.; Jakobsen, H.J.; Skibsted, J. Characterization of white Portland cement hydration and the C-S-H structure in the presence of sodium aluminate by 27Al and 29Si MAS NMR spectroscopy. Cem. Concr. Res. 2004, 34, 857–868. [Google Scholar] [CrossRef]
- Zhang, J.X.; Sun, H.H.; Sun, Y.M.; Zhang, N. Correlation between 29Si polymerization and cementitious activity of coal gangue. J. Zhejiang Univ. Sci. A 2009, 10, 1334–1340. [Google Scholar] [CrossRef]
- Zhang, W.; Liu, X.; Wang, Y.; Li, Z.; Li, Y.; Ren, Y. Binary reaction behaviors of red mud based cementitious material: Hydration characteristics and Na+ utilization. J. Hazard. Mater. 2021, 410, 124592. [Google Scholar] [CrossRef]
- Zhang, W.; Gu, J.; Zhou, X.; Li, Y.; Wang, Y.; Xue, Y.; Liu, X. Circulating fluidized bed fly ash based multi-solid wastes road base materials: Hydration characteristics and utilization of SO3 and f-CaO. J. Clean. Prod. 2021, 316, 128355. [Google Scholar] [CrossRef]
- Liu, X.; Zhao, X.; Yin, H.; Chen, J.; Zhang, N. Intermediate-calcium based cementitious materials prepared by MSWI fly ash and other solid wastes: Hydration characteristics and heavy metals solidification behavior. J. Hazard. Mater. 2018, 349, 262–271. [Google Scholar] [CrossRef]
- Cao, Y.; Fan, D.; Tian, P.; Cao, L.; Sun, T.; Xu, S.; Yang, M.; Liu, Z. The influence of low-temperature hydration methods on the stability of Cu-SAPO-34 SCR catalyst. Chem. Eng. J. 2018, 354, 85–92. [Google Scholar] [CrossRef]
- Wang, Y.; Liu, X.; Zhang, W.; Li, Z.; Zhang, Y.; Li, Y.; Ren, Y. Effects of Si/Al ratio on the efflorescence and properties of fly ash based geopolymer. J. Clean. Prod. 2020, 244, 118852. [Google Scholar] [CrossRef]


| Oxide | T-CaO | SiO2 | Al2O3 | SO3 | Fe2O3 | MgO | TiO2 | K2O | Na2O | f-CaO | LOI |
|---|---|---|---|---|---|---|---|---|---|---|---|
| CFB fly ash | 14.87 | 39.90 | 28.09 | 7.73 | 6.21 | 1.46 | 0.98 | 0.95 | 0.23 | 4.57 | 10.38 |
| OPC | 63.15 | 21.05 | 5.43 | 2.66 | 3.56 | 1.86 | 0.38 | 0.65 | 0.27 | - | 3.42 |
| Mix Sample | CFB Fly Ash (wt.%) | CFB Fly Ash (kg/m3) | OPC (kg/m3) |
|---|---|---|---|
| CMM0 | 0 | 0 | 450 |
| CMM 0.5 | 5.0 | 22.5 | 427.5 |
| CMM 1 | 10 | 45 | 405 |
| CMM 2 | 20 | 90 | 360 |
| CMM 3 | 30 | 135 | 315 |
| CMM 4 | 40 | 180 | 270 |
| CMM 5 | 50 | 225 | 225 |
| Oxides | CMM0 | CMM0.5 | CMM1 | CMM2 | CMM3 | CMM4 | CMM5 |
|---|---|---|---|---|---|---|---|
| T-CaO | 63.15 | 60.74 | 58.32 | 53.49 | 48.67 | 43.84 | 39.01 |
| f-CaO | 0 | 0.23 | 0.46 | 0.91 | 1.37 | 1.83 | 2.29 |
| SiO2 | 21.05 | 21.99 | 22.94 | 24.82 | 26.71 | 28.59 | 30.48 |
| Al2O3 | 5.43 | 6.56 | 7.70 | 9.96 | 12.23 | 14.49 | 16.76 |
| SO3 | 2.66 | 2.91 | 3.17 | 3.67 | 4.18 | 4.69 | 5.20 |
| Fe2O3 | 3.56 | 3.69 | 3.83 | 4.09 | 4.36 | 4.62 | 4.89 |
| MgO | 1.86 | 1.84 | 1.82 | 1.78 | 1.74 | 1.70 | 1.66 |
| TiO2 | 0.38 | 0.41 | 0.44 | 0.50 | 0.56 | 0.62 | 0.68 |
| K2O | 0.65 | 0.67 | 0.68 | 0.71 | 0.74 | 0.77 | 0.80 |
| Na2O | 0.27 | 0.27 | 0.27 | 0.26 | 0.26 | 0.25 | 0.25 |
| Ca/(Si+Al) mass ratio | 2.38 | 2.13 | 1.90 | 1.54 | 1.25 | 1.02 | 0.83 |
| Sample | Initial Length (mm) | After Autoclaved (mm) | Length Change (mm) | Expansion Rate (%) |
|---|---|---|---|---|
| CMM0.5–6 h | 296.4345 | 296.4070 | −0.0275 | −0.0093% |
| CMM0.5–9 h | 297.2860 | 297.3310 | 0.0450 | 0.0151% |
| CMM0.5–12 h | 296.9880 | 297.0495 | 0.06150 | 0.0207% |
| CMM0–12 h | 296.9040 | 296.0920 | −0.8120 | −0.2735% |
| CMM0.5–12 h | 296.9880 | 297.0495 | 0.06150 | 0.0207% |
| CMM1–12 h | 296.2830 | 296.8300 | 0.5470 | 0.1846% |
| CMM2–12 h | 297.5940 | 298.2210 | 0.6270 | 0.2107% |
| CMM3–12 h | 295.8320 | 296.8630 | 1.0310 | 0.3485% |
| CMM4–12 h | 294.5420 | 297.1680 | 2.6260 | 0.8916% |
| CMM5–12 h | 293.3320 | 297.3410 | 4.0090 | 1.3667% |
| Sample | Peak Position (ppm) | Assign | Relative | RBO Value |
|---|---|---|---|---|
| CMM0–12 h | −71.04 | SiQ1 | 100.00 | 27.44% |
| −82.01 | SiQ2(1Al) | 10.84 | ||
| CMM0.5–12 h | −71.11 | SiQ1 | 100.00 | 28.35% |
| −82.20 | SiQ2(1Al) | 15.46 | ||
| CMM5–12 h | −82.43 | SiQ2(1Al) | 100.00 | 25.00% |
| Sample | Peak Position (ppm) | Assign | Relative | RBO Value |
|---|---|---|---|---|
| CMM0.5–6 h | −70.92 | SiQ1 | 100.00 | 26.85% |
| −81.80 | SiQ2(1Al) | 8.01 | ||
| CMM0.5–9 h | −70.92 | SiQ1 | 100.00 | 27.73% |
| −81.99 | SiQ2(1Al) | 12.24 | ||
| CMM0.5–12 h | −71.11 | SiQ1 | 100.00 | 28.35% |
| −82.20 | SiQ2(1Al) | 15.46 |
| Sample | As | Cr | Zn | Cu |
|---|---|---|---|---|
| CFB fly ash | 0.32175 | 0.18767 | 0.84240 | 0.14650 |
| CMM0.5 | 0.00005 | 0.00711 | 0.00352 | 0.00062 |
| CMM5 | 0.00210 | 0.01906 | 0.00738 | 0.00438 |
| WHO drinking water standard | 0.01000 | 0.05000 | 3.00000 | 1.00000 |
Publisher’s Note: MDPI stays neutral with regard to jurisdictional claims in published maps and institutional affiliations. |
© 2021 by the authors. Licensee MDPI, Basel, Switzerland. This article is an open access article distributed under the terms and conditions of the Creative Commons Attribution (CC BY) license (https://creativecommons.org/licenses/by/4.0/).
Share and Cite
Zhang, W.; Liu, X.; Zhang, Z.; Wang, Y.; Xue, Y.; Hao, X.; Lu, Y. Circulating Fluidized Bed Fly Ash Mixed Functional Cementitious Materials: Shrinkage Compensation of f-CaO, Autoclaved Hydration Characteristics and Environmental Performance. Materials 2021, 14, 6004. https://doi.org/10.3390/ma14206004
Zhang W, Liu X, Zhang Z, Wang Y, Xue Y, Hao X, Lu Y. Circulating Fluidized Bed Fly Ash Mixed Functional Cementitious Materials: Shrinkage Compensation of f-CaO, Autoclaved Hydration Characteristics and Environmental Performance. Materials. 2021; 14(20):6004. https://doi.org/10.3390/ma14206004
Chicago/Turabian StyleZhang, Wei, Xiaoming Liu, Zengqi Zhang, Yaguang Wang, Yang Xue, Xiansheng Hao, and Yang Lu. 2021. "Circulating Fluidized Bed Fly Ash Mixed Functional Cementitious Materials: Shrinkage Compensation of f-CaO, Autoclaved Hydration Characteristics and Environmental Performance" Materials 14, no. 20: 6004. https://doi.org/10.3390/ma14206004
APA StyleZhang, W., Liu, X., Zhang, Z., Wang, Y., Xue, Y., Hao, X., & Lu, Y. (2021). Circulating Fluidized Bed Fly Ash Mixed Functional Cementitious Materials: Shrinkage Compensation of f-CaO, Autoclaved Hydration Characteristics and Environmental Performance. Materials, 14(20), 6004. https://doi.org/10.3390/ma14206004