
Experimental Study on the Correlation between Crack Width and Crack Depth of RC Beams


Abstract
:1. Introduction
2. Experimental Program
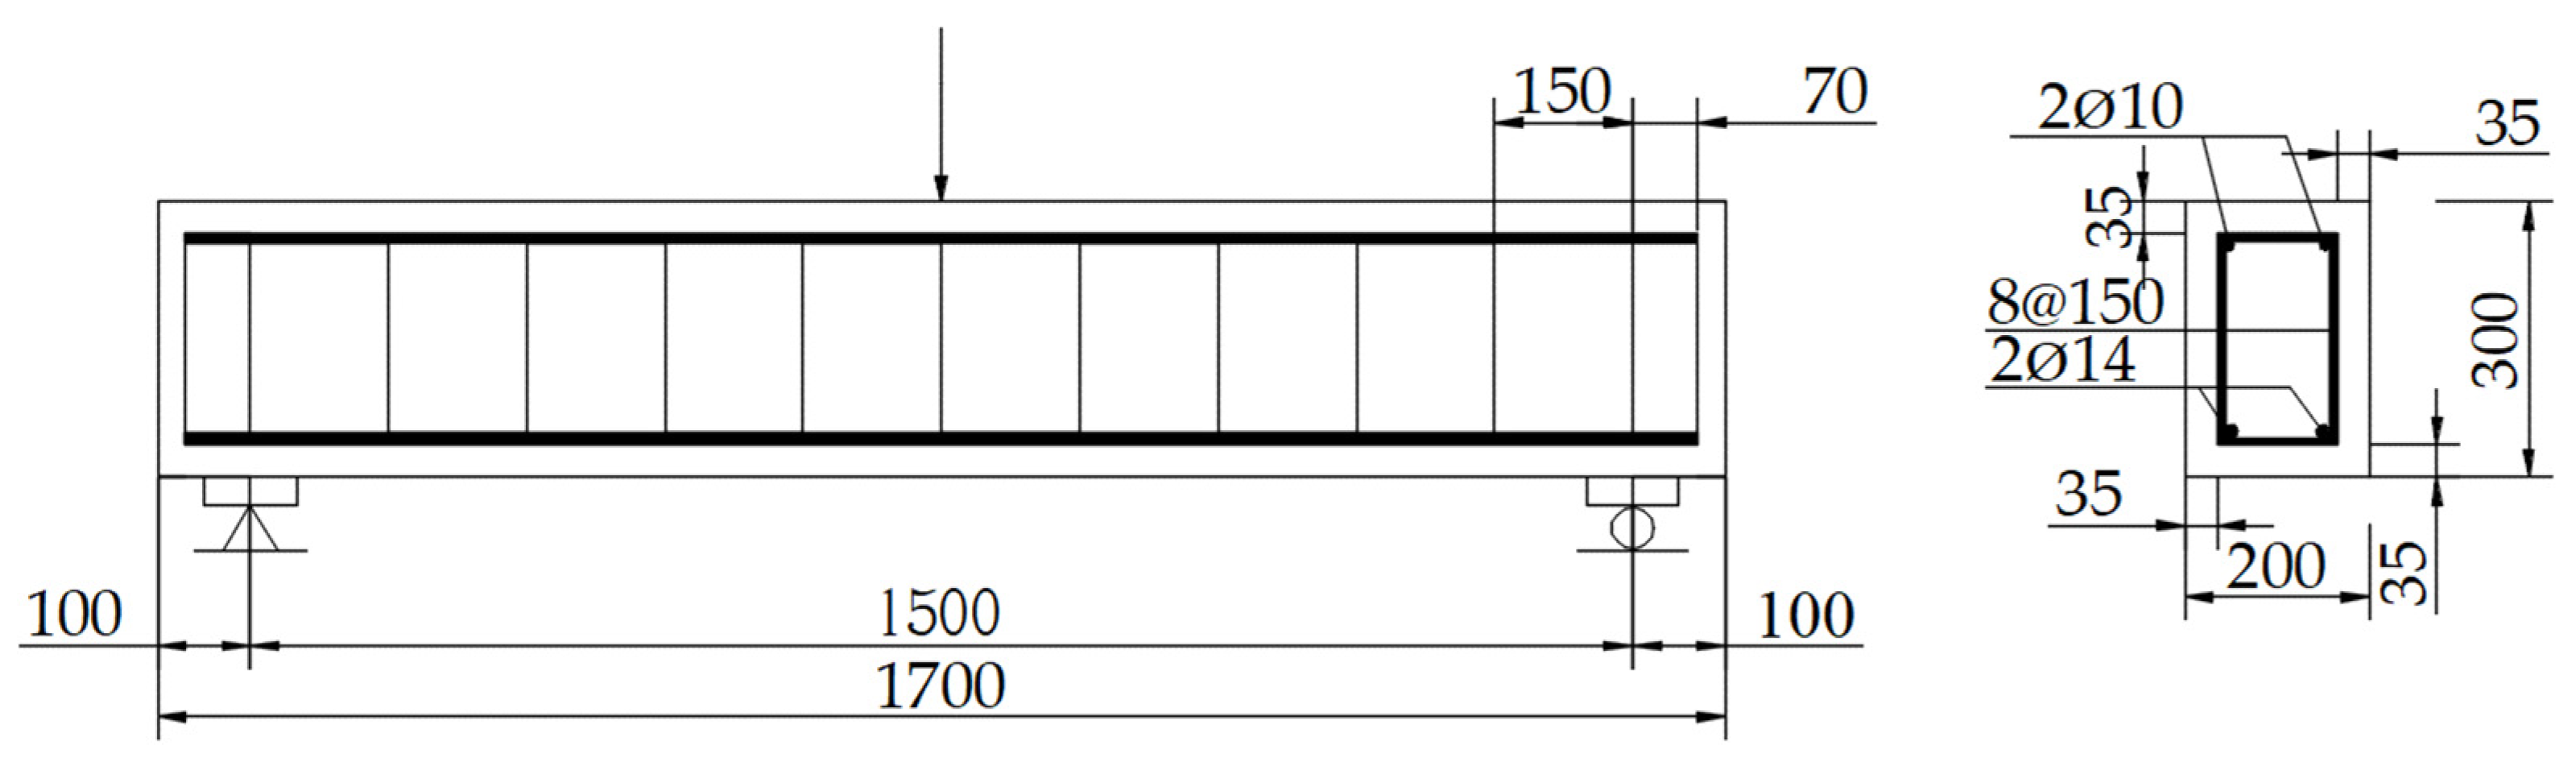
2.1. Materials and Preparation of Specimens
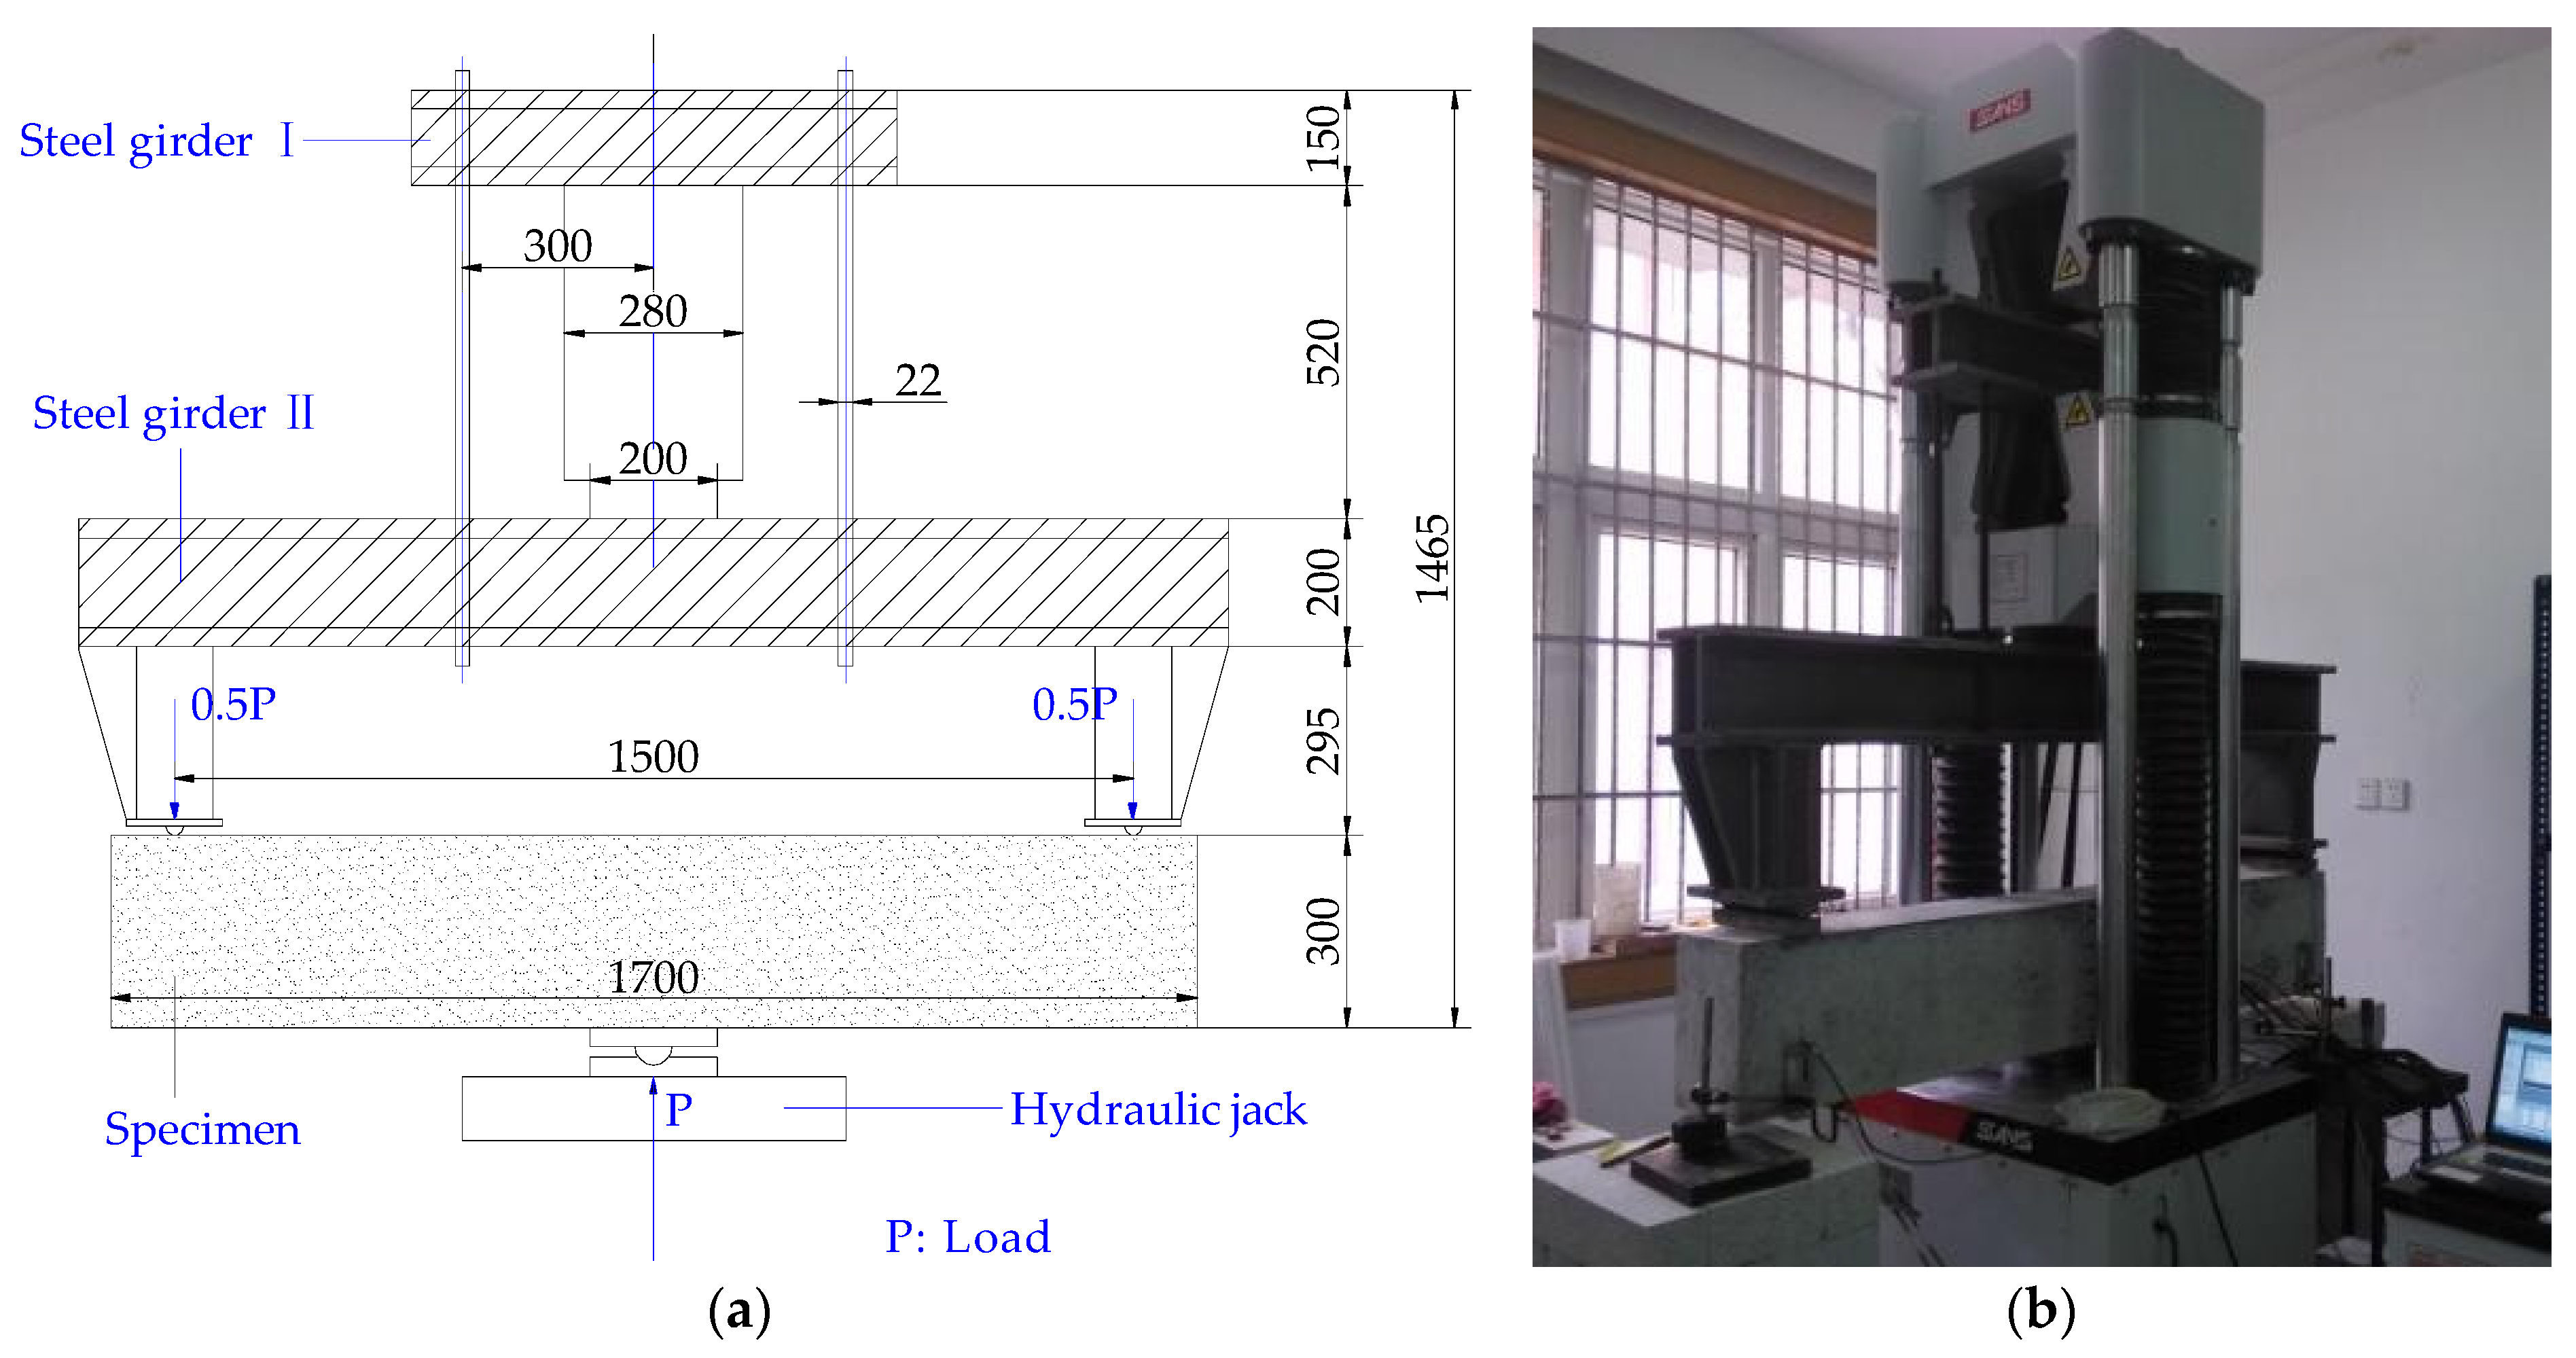
2.2. Loading System
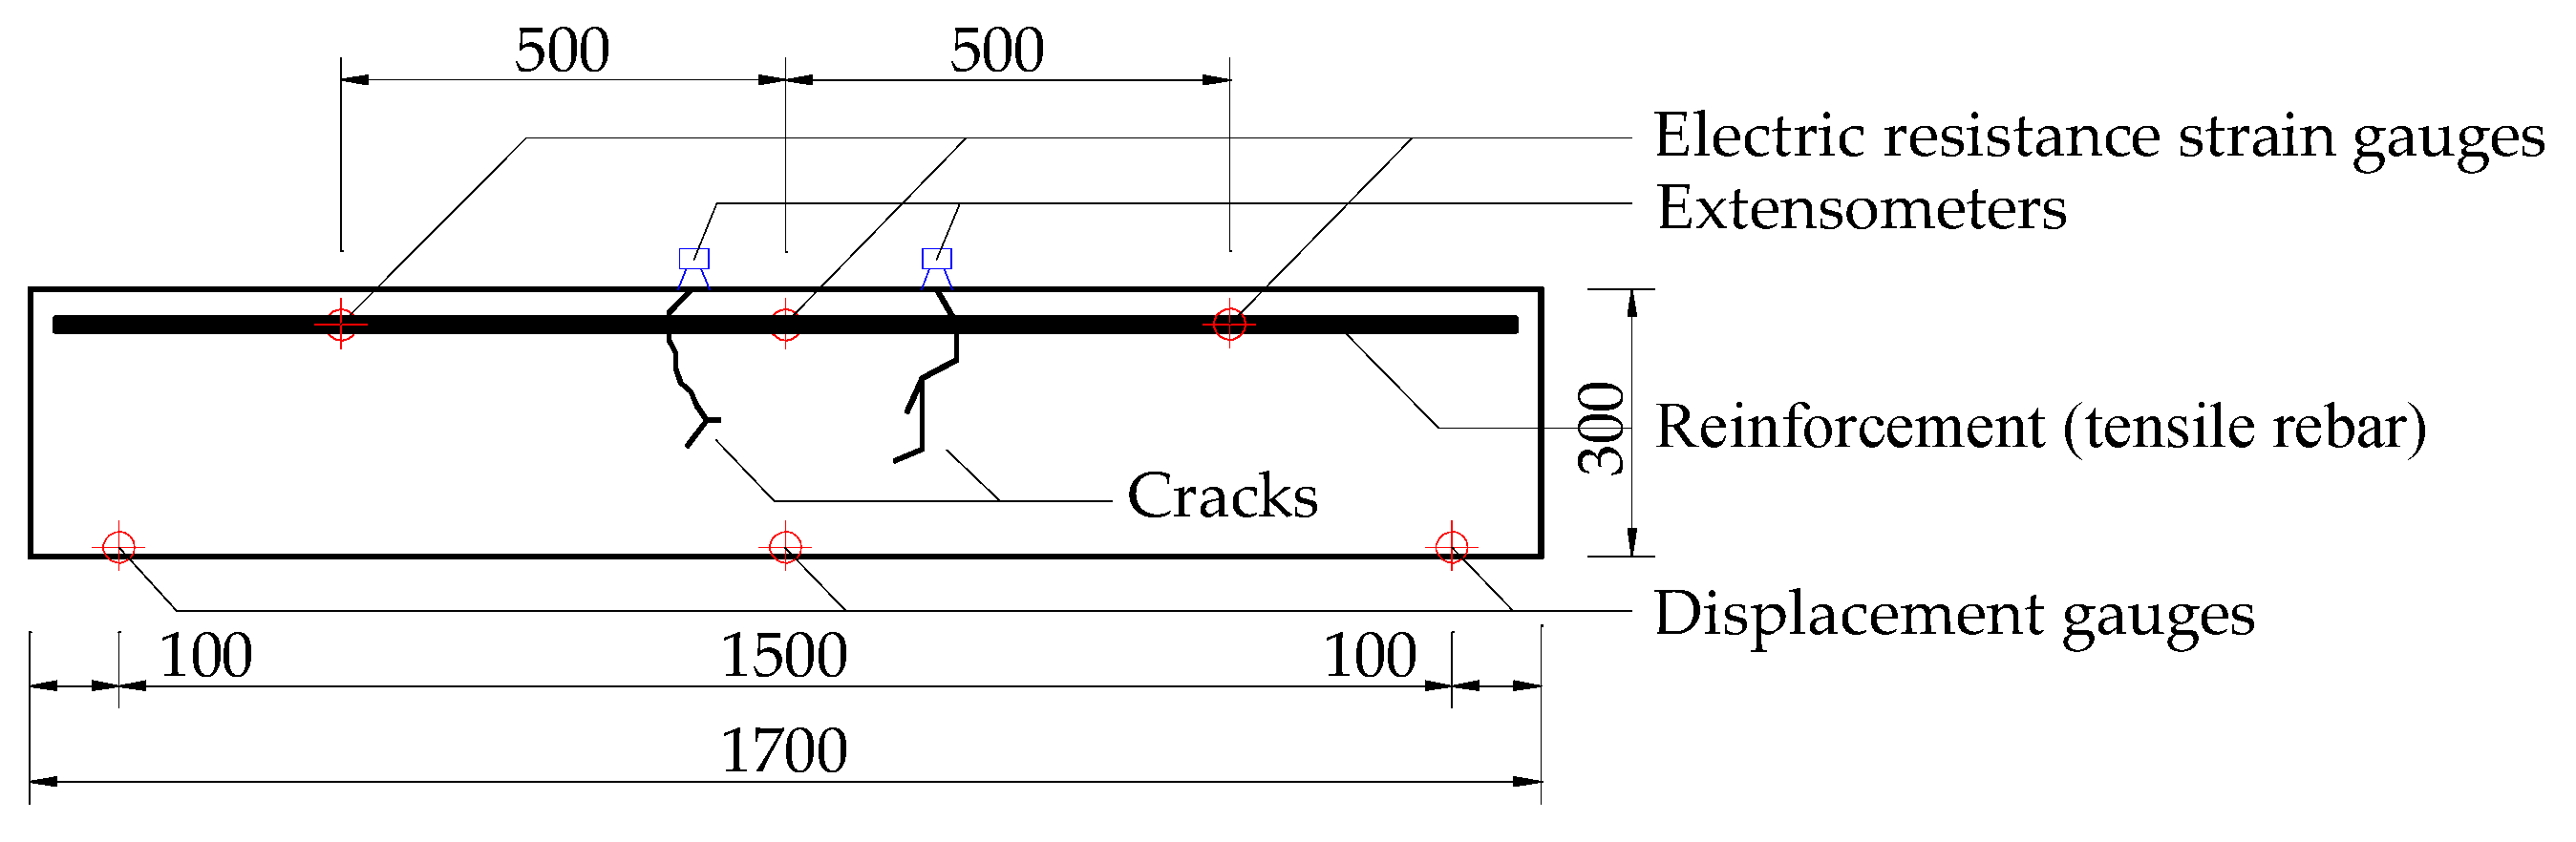
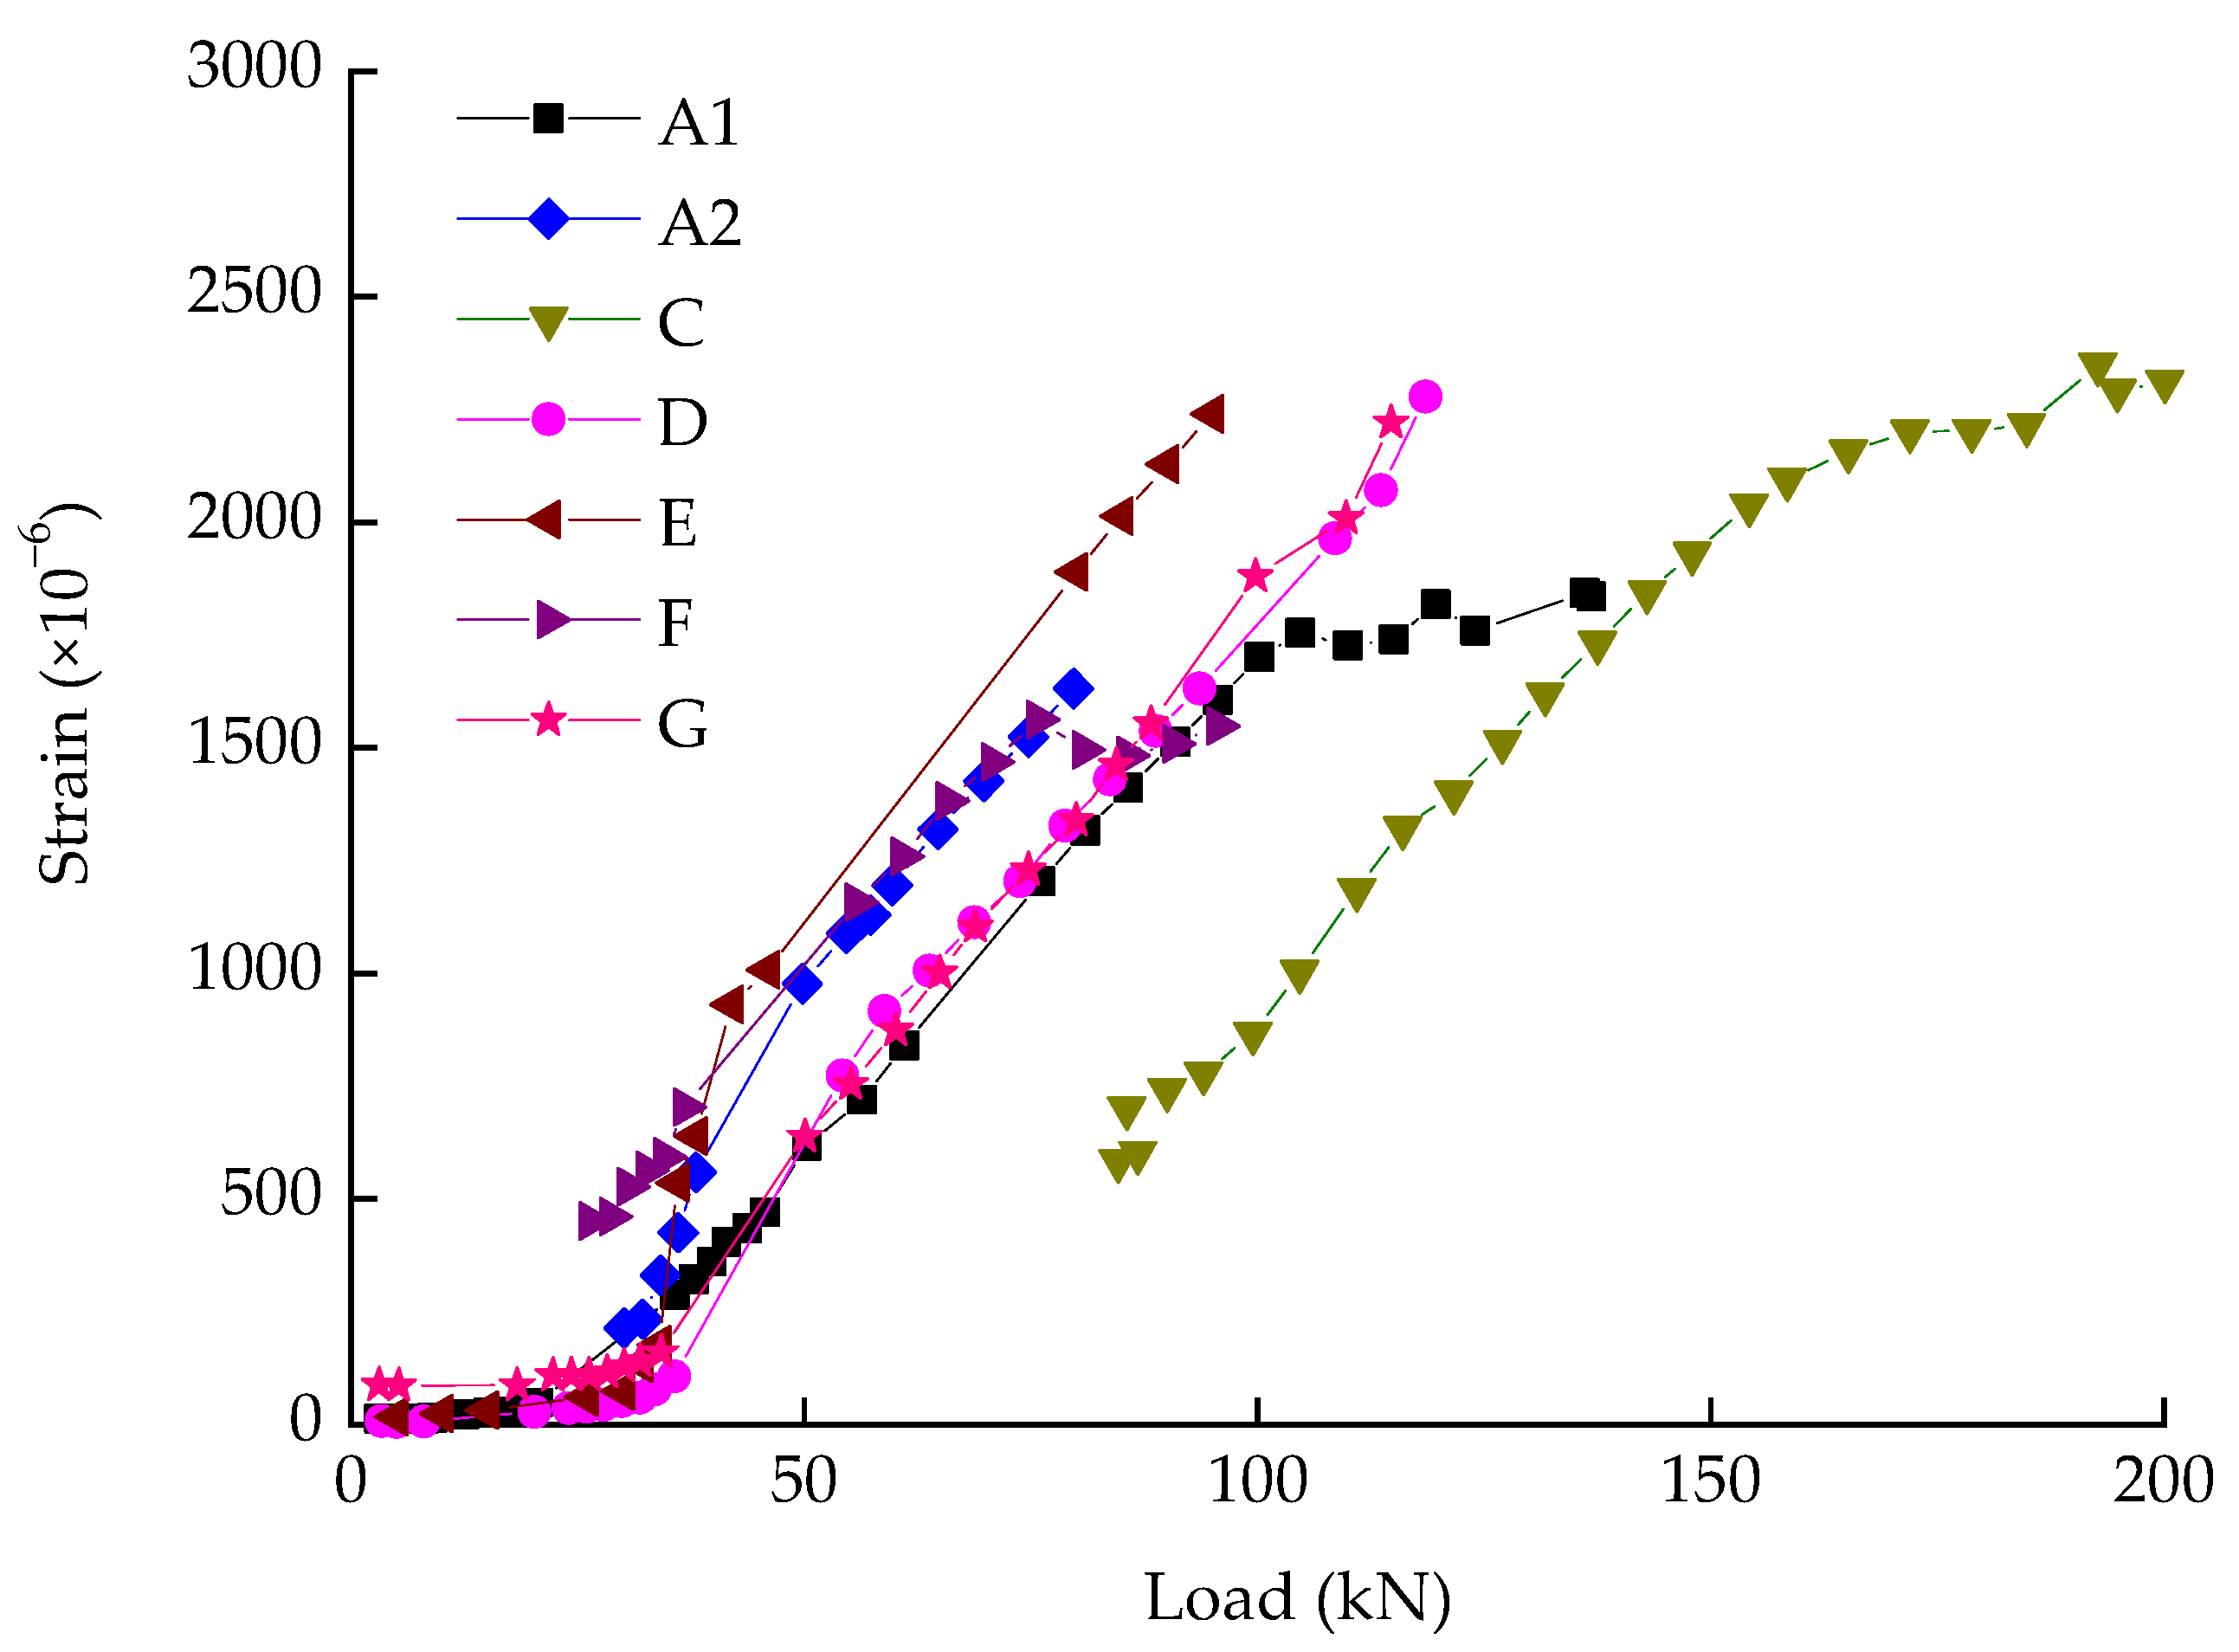
2.3. Measurement
3. Results and Analysis
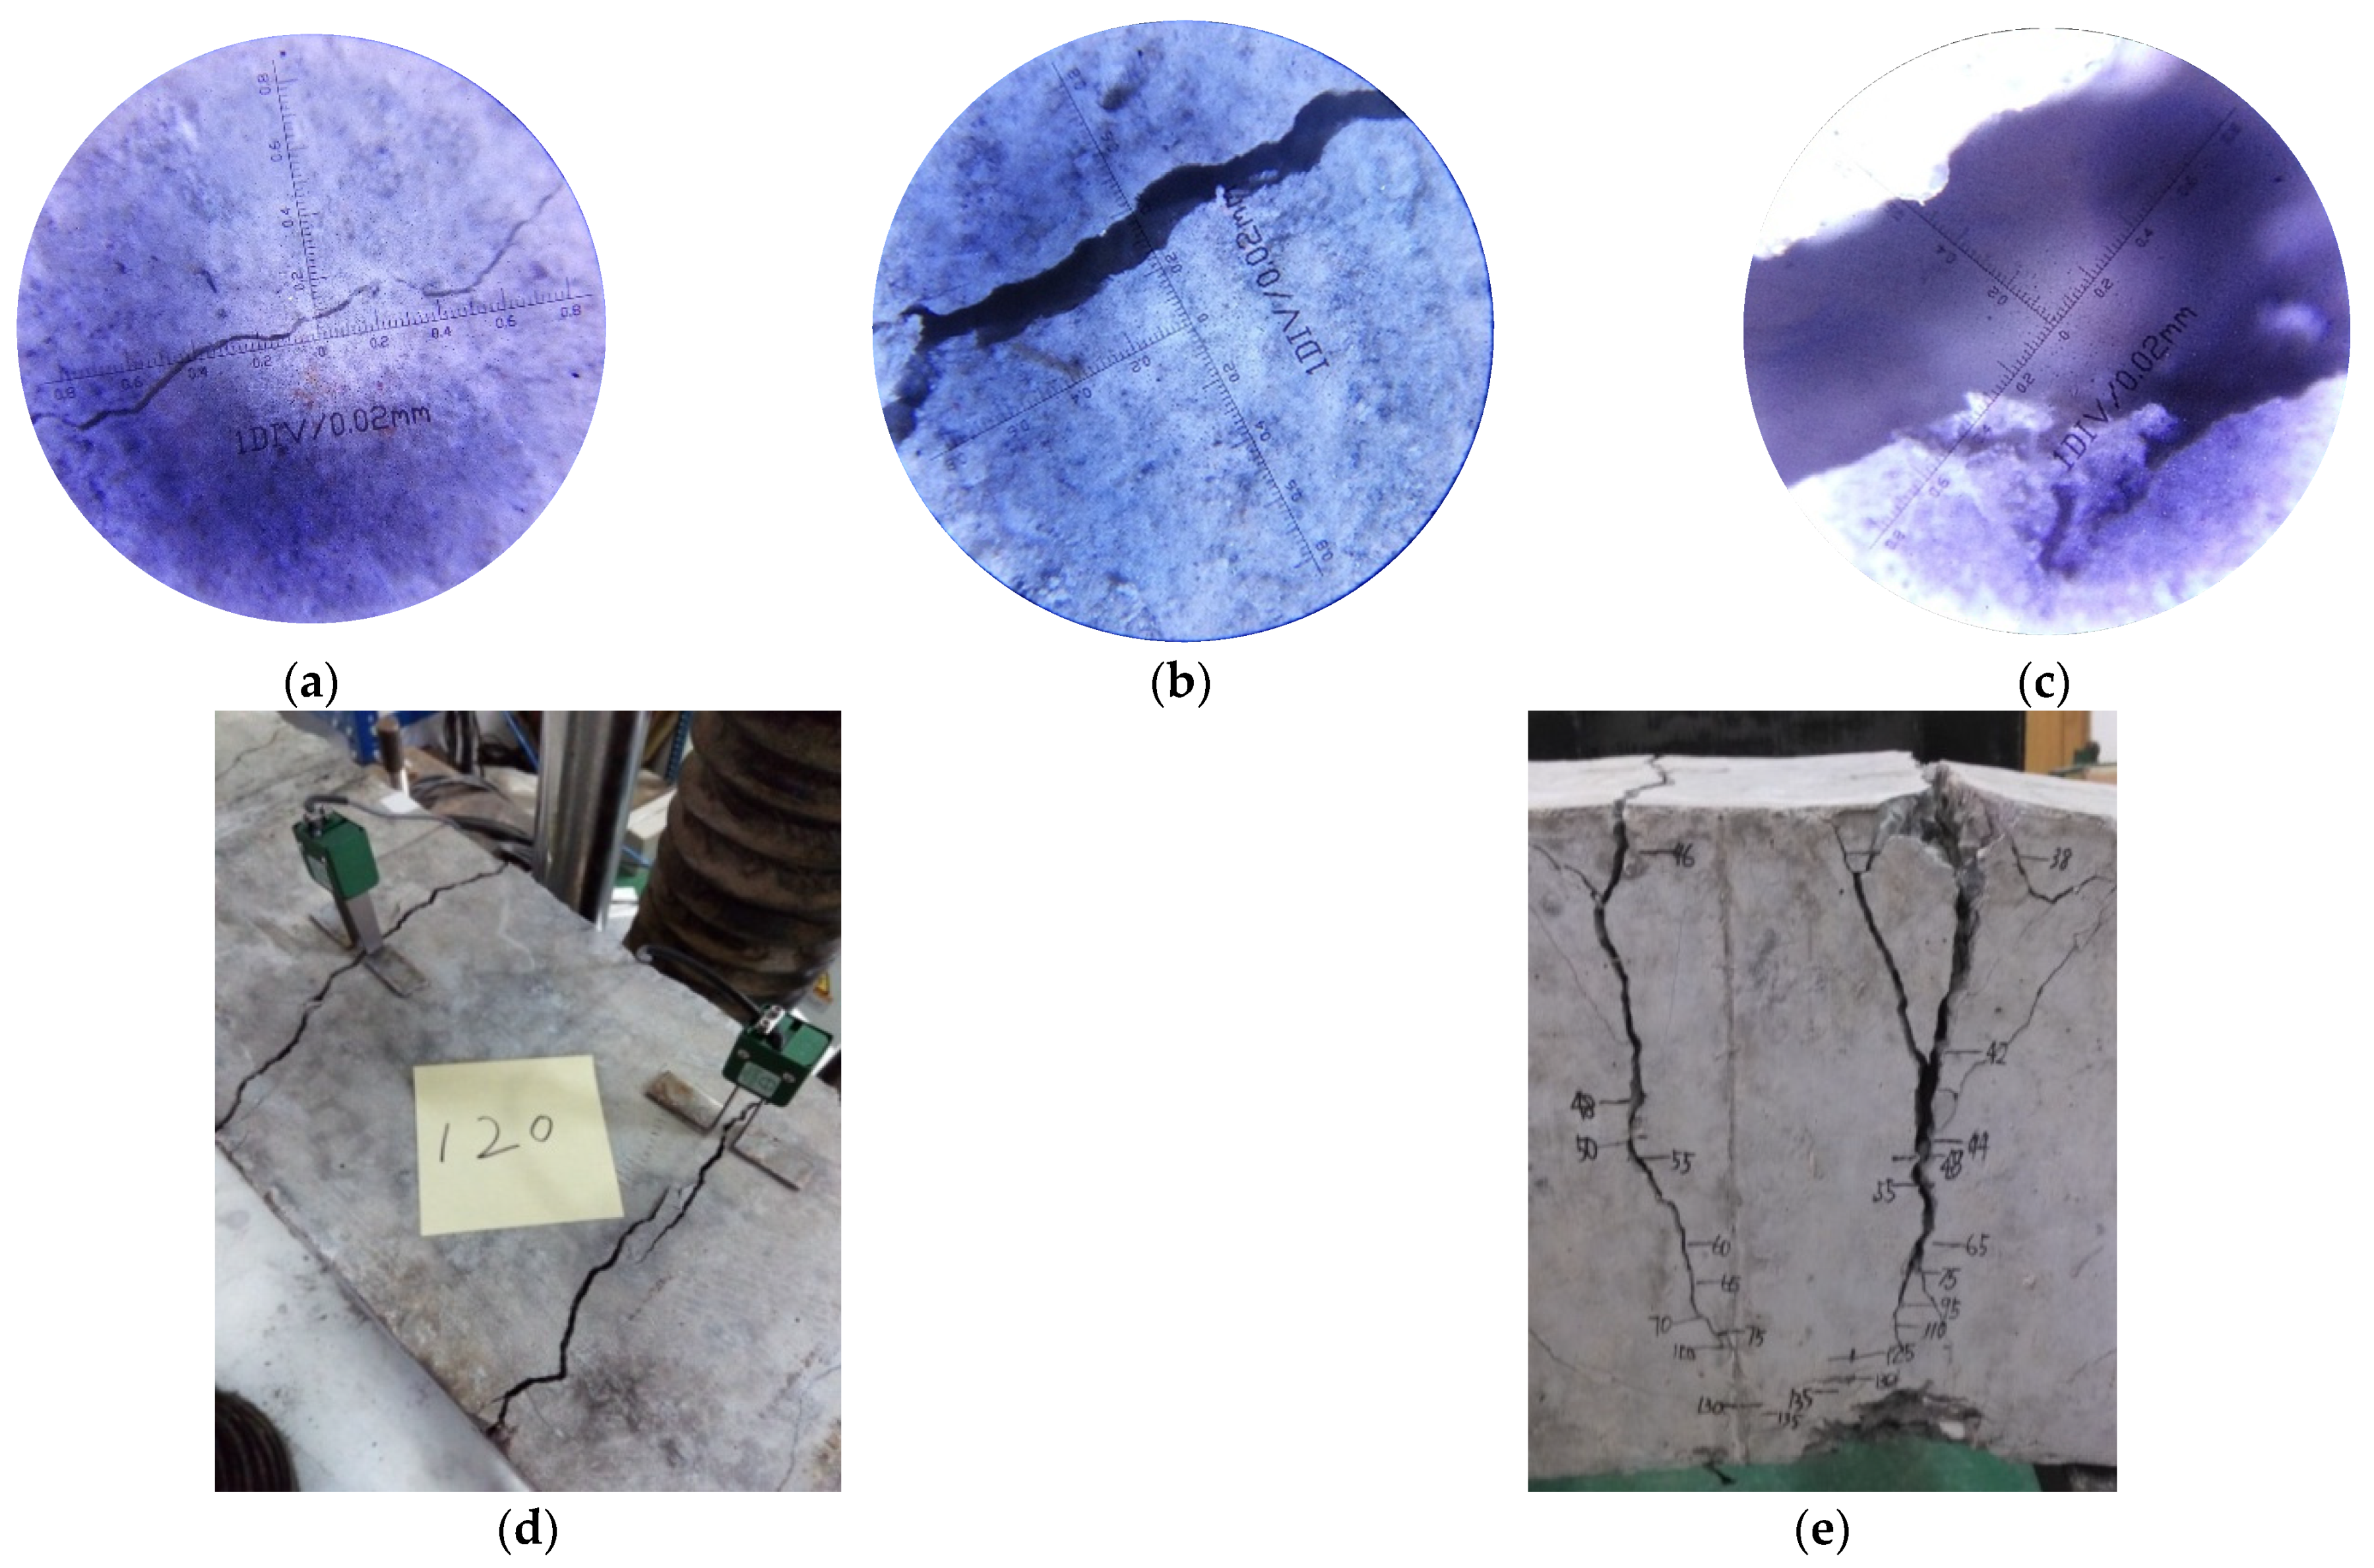
3.1. Cracking Behaviors
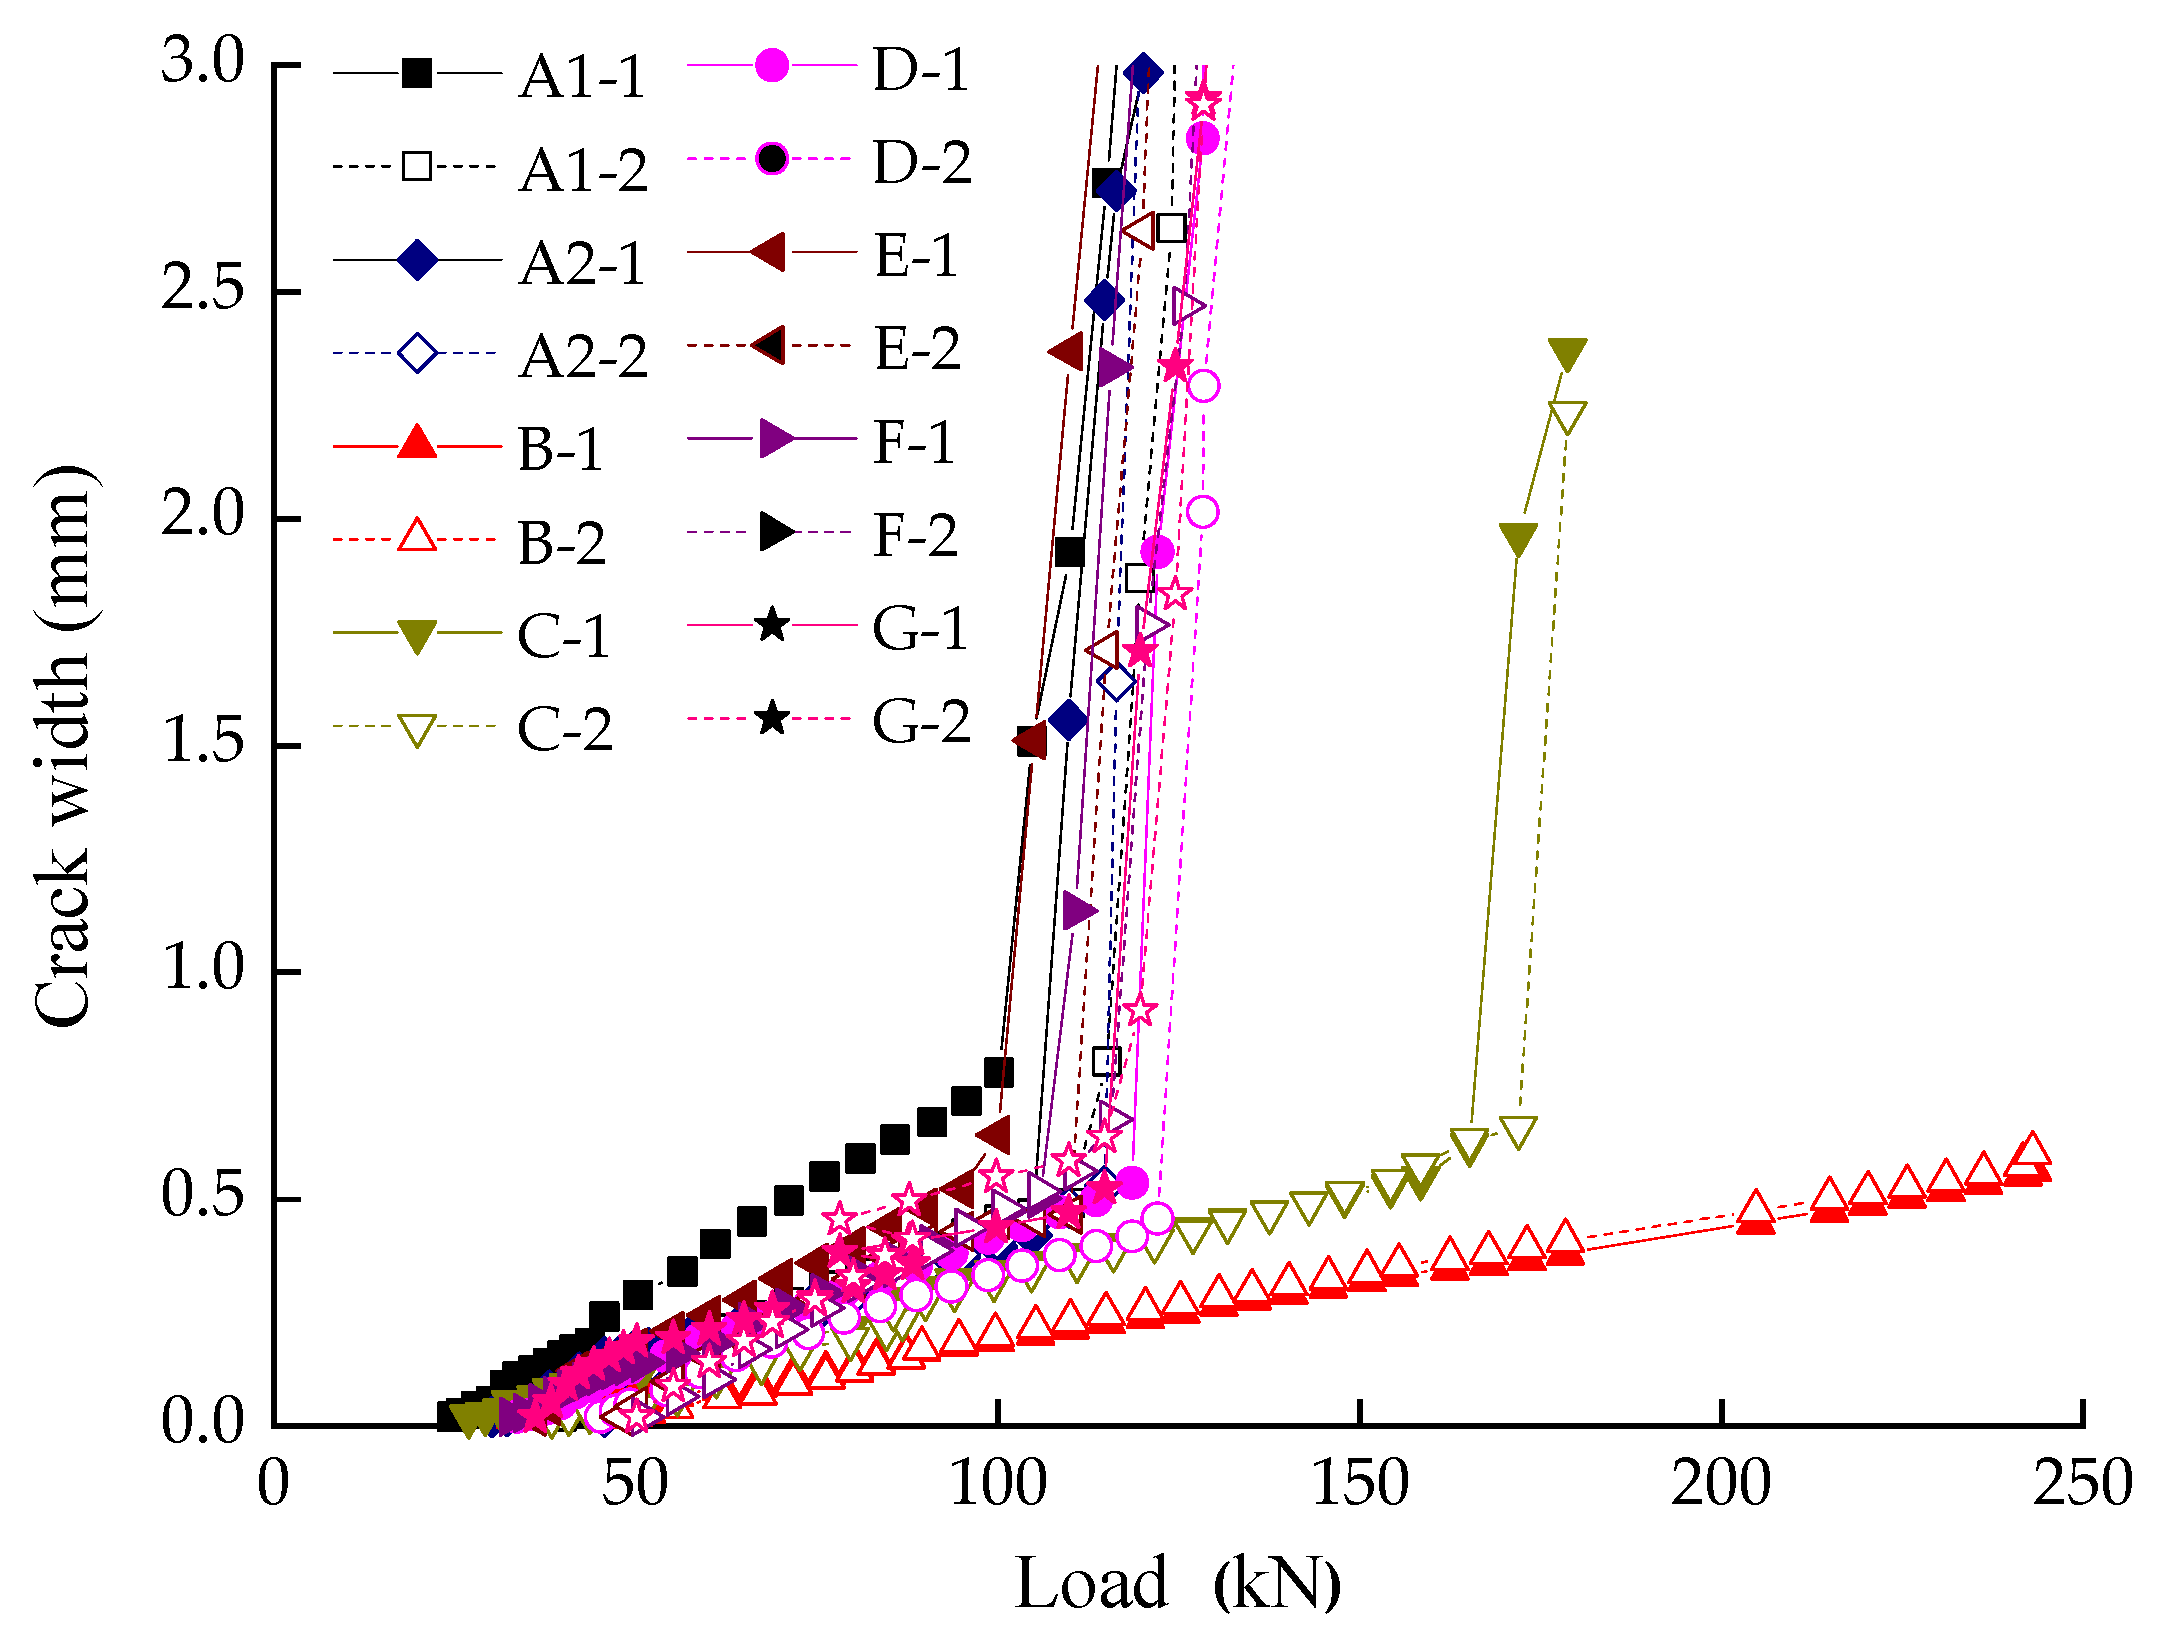
3.2. Load and Crack Width
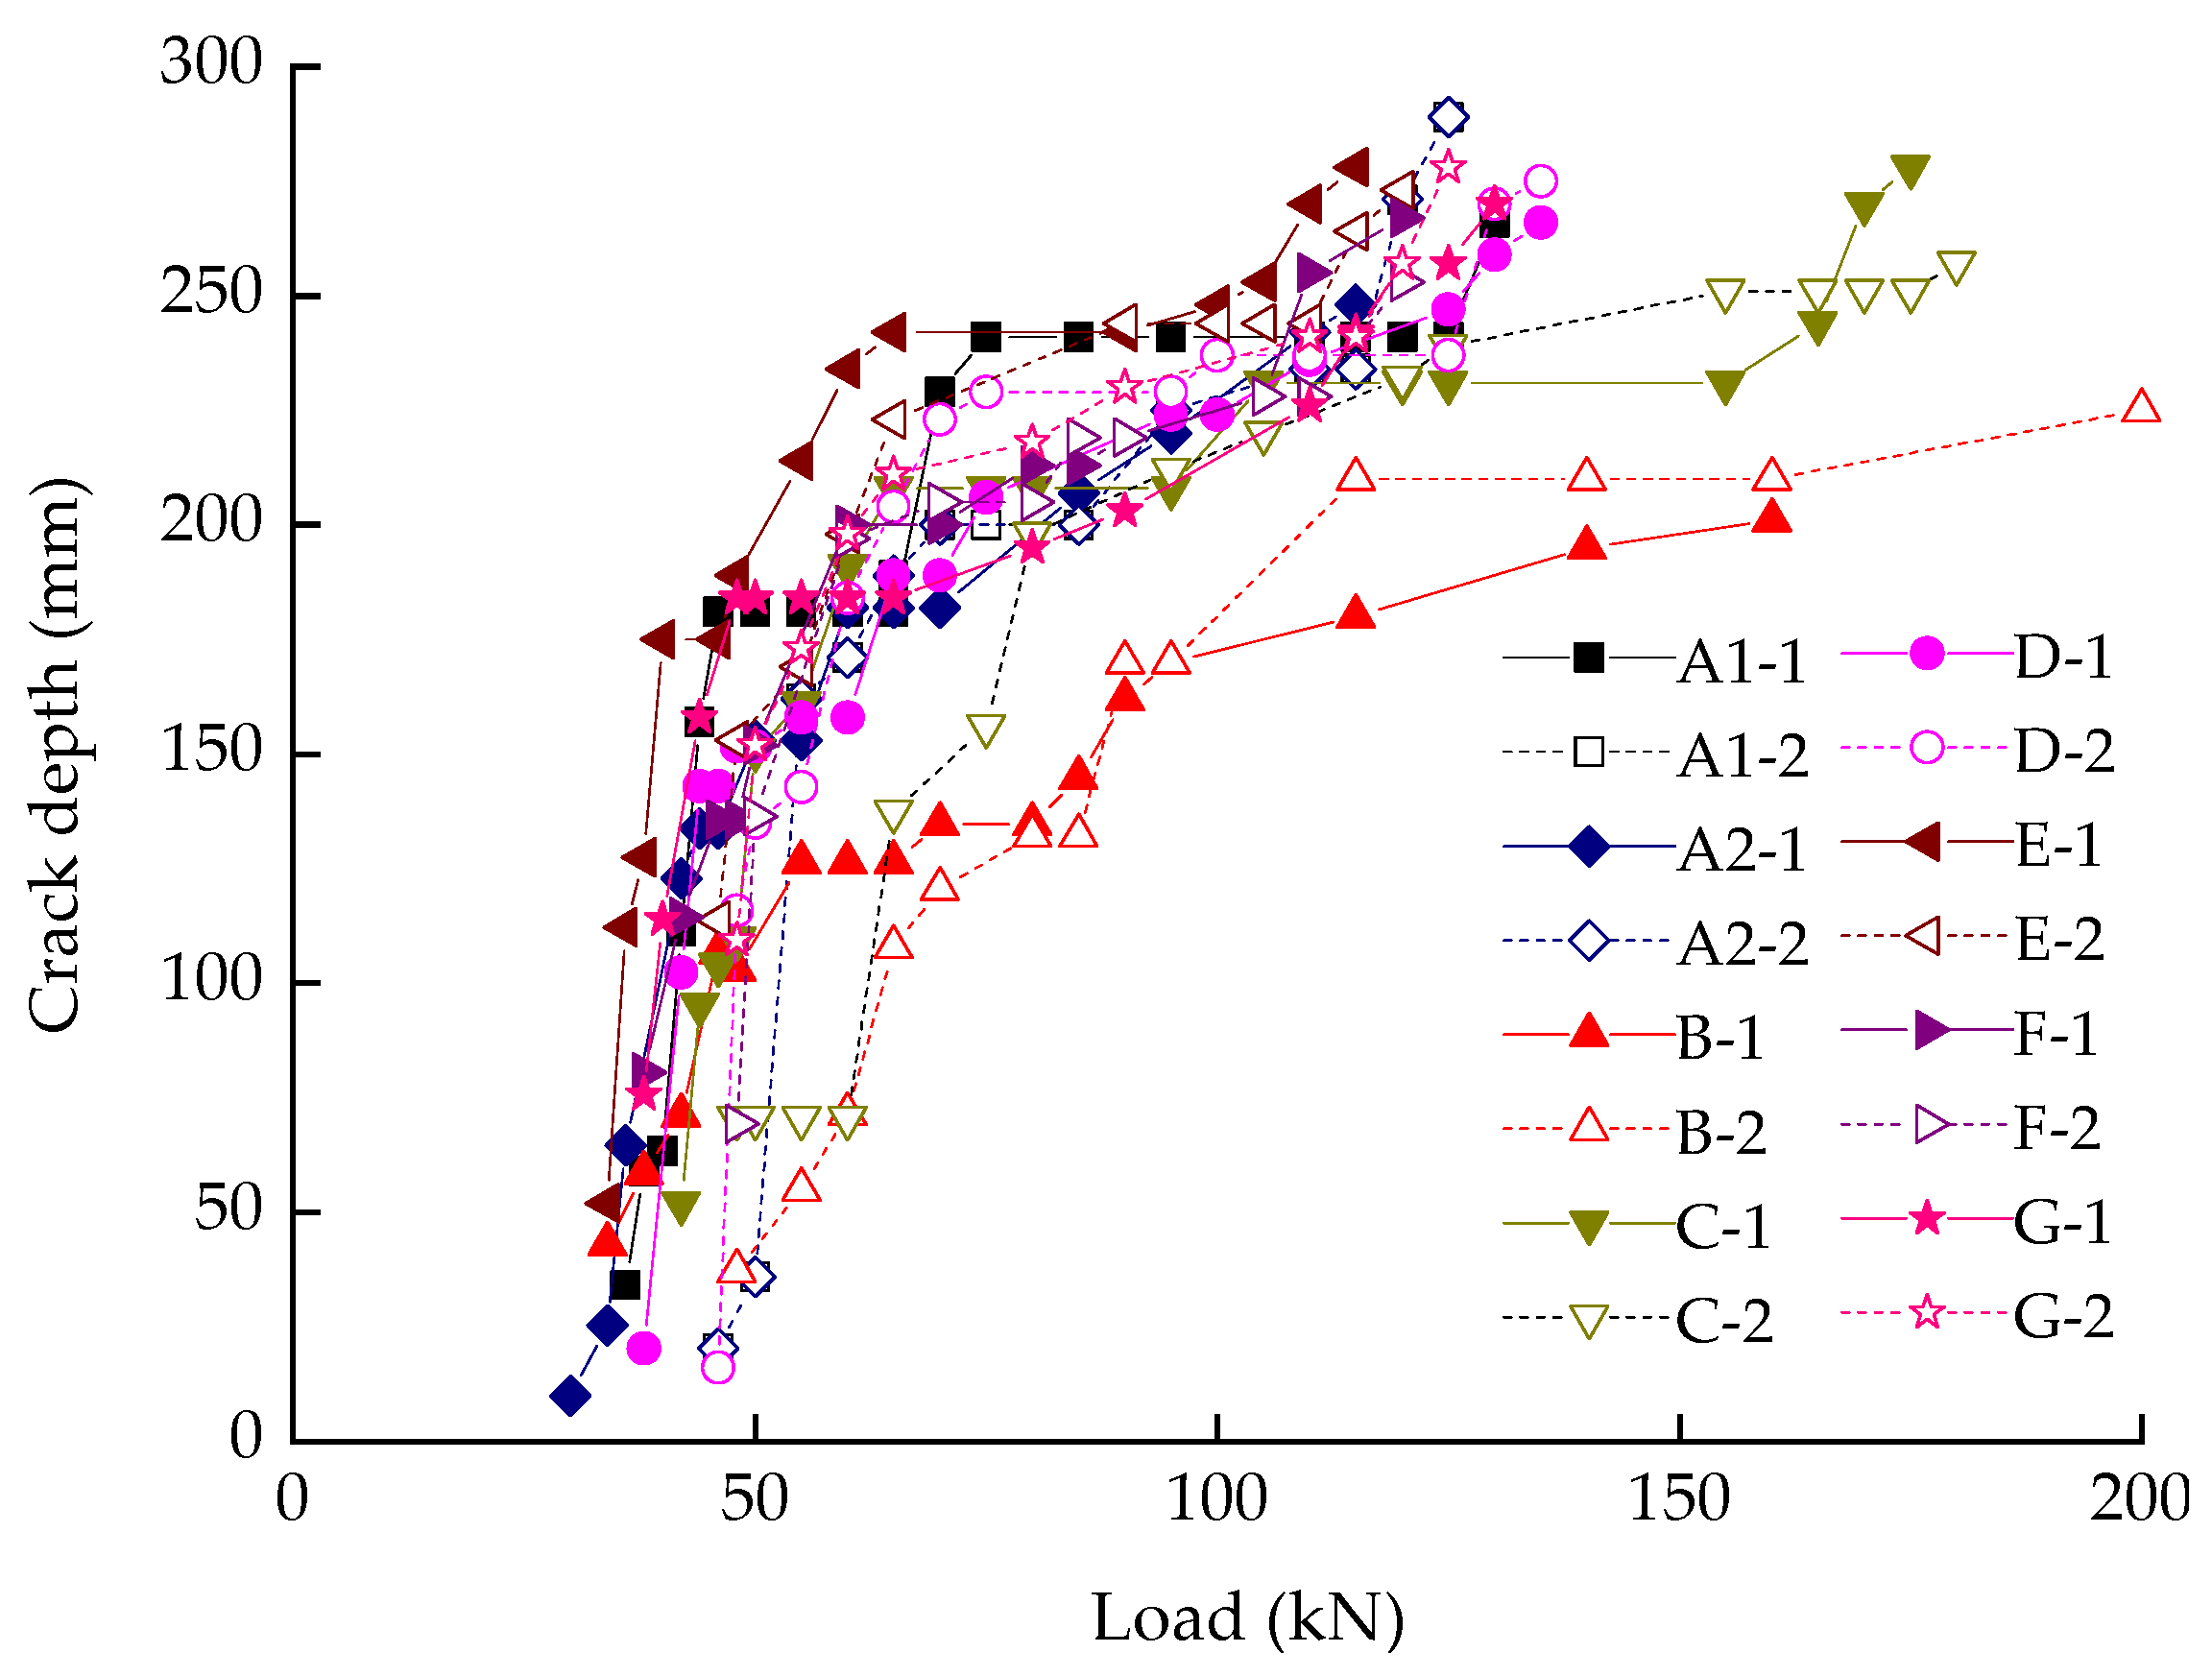
3.3. Load and Crack Depth
4. Discussion
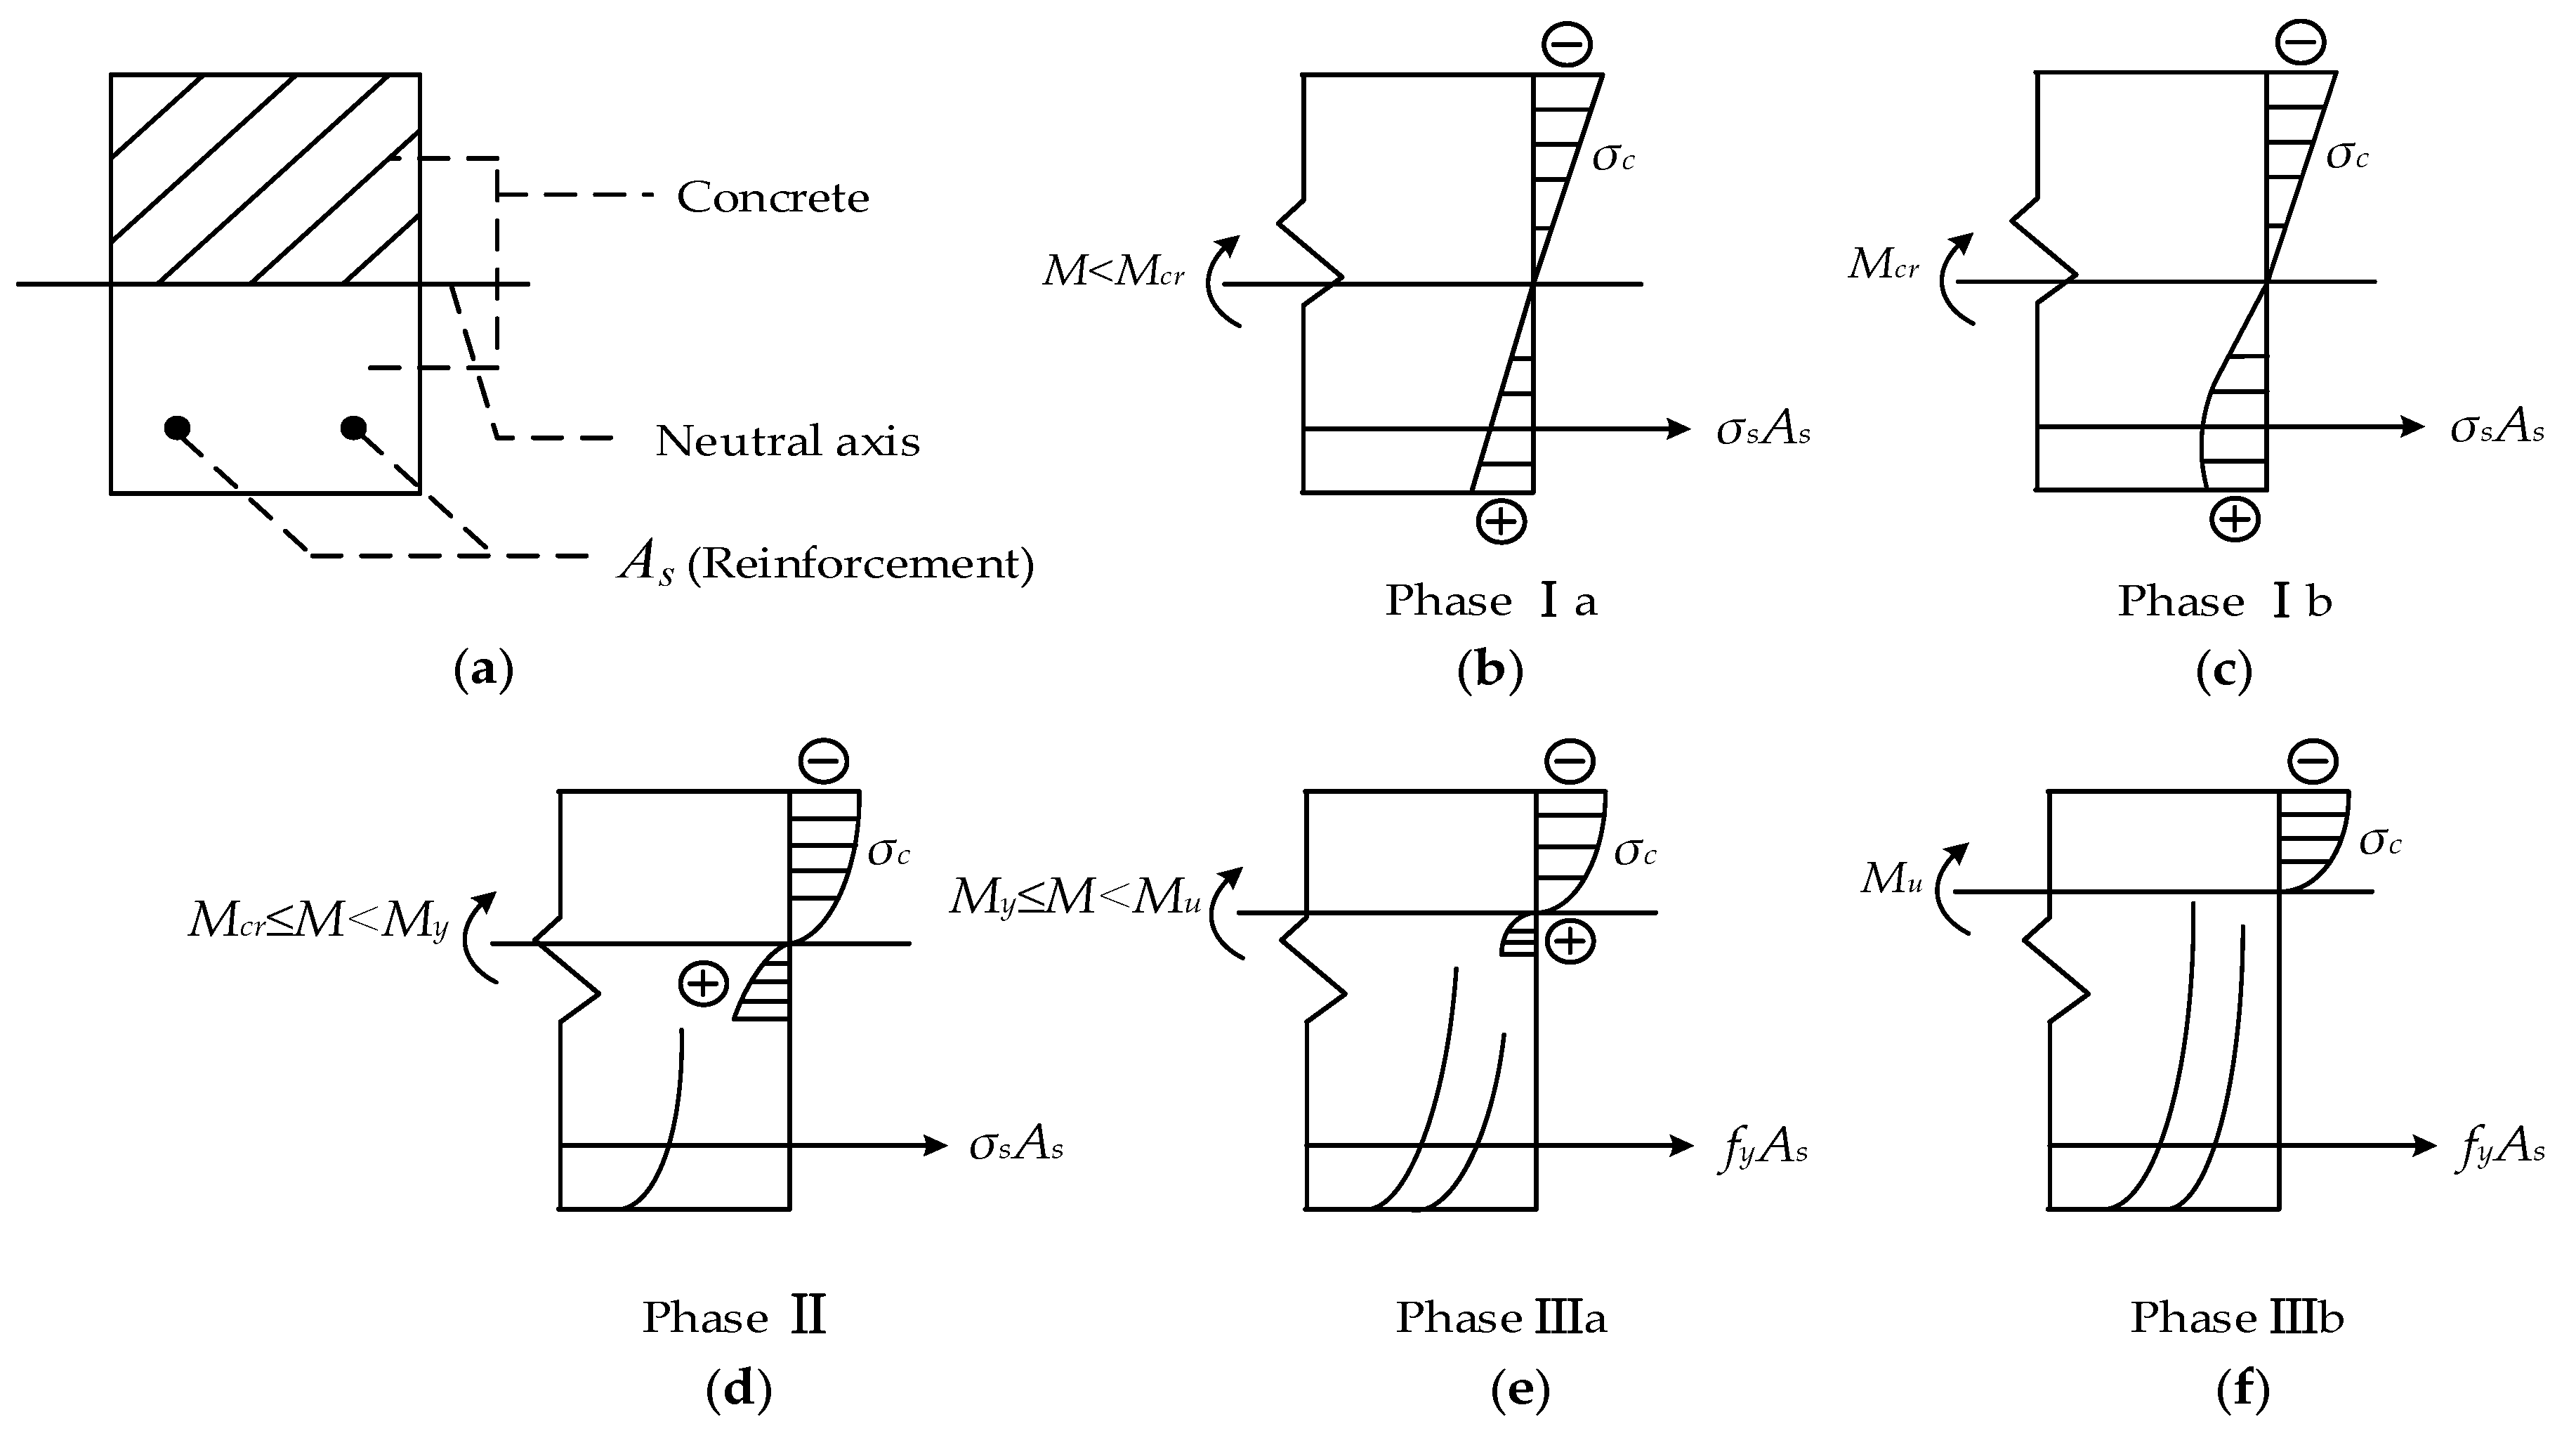
4.1. Work Phases of Concrete Across-Section and Correlation between Crack Width and Depth
4.2. Verification of the Fitting Function
5. Summary and Conclusions
- The cracking load of specimens is 30 ± 4 kN, and the splitting tensile strength of concrete has a certain influence on the cracking load. In the early stage, the maximum crack width increased slowly with the applied load. When the load was up to 75–85% of the ultimate loading capacity, the turning point arose and then the growth rate of crack width became faster. The relationship between crack width and load was generally linear for all specimens in the whole loading process, even after yielding of the longitudinal reinforcements.
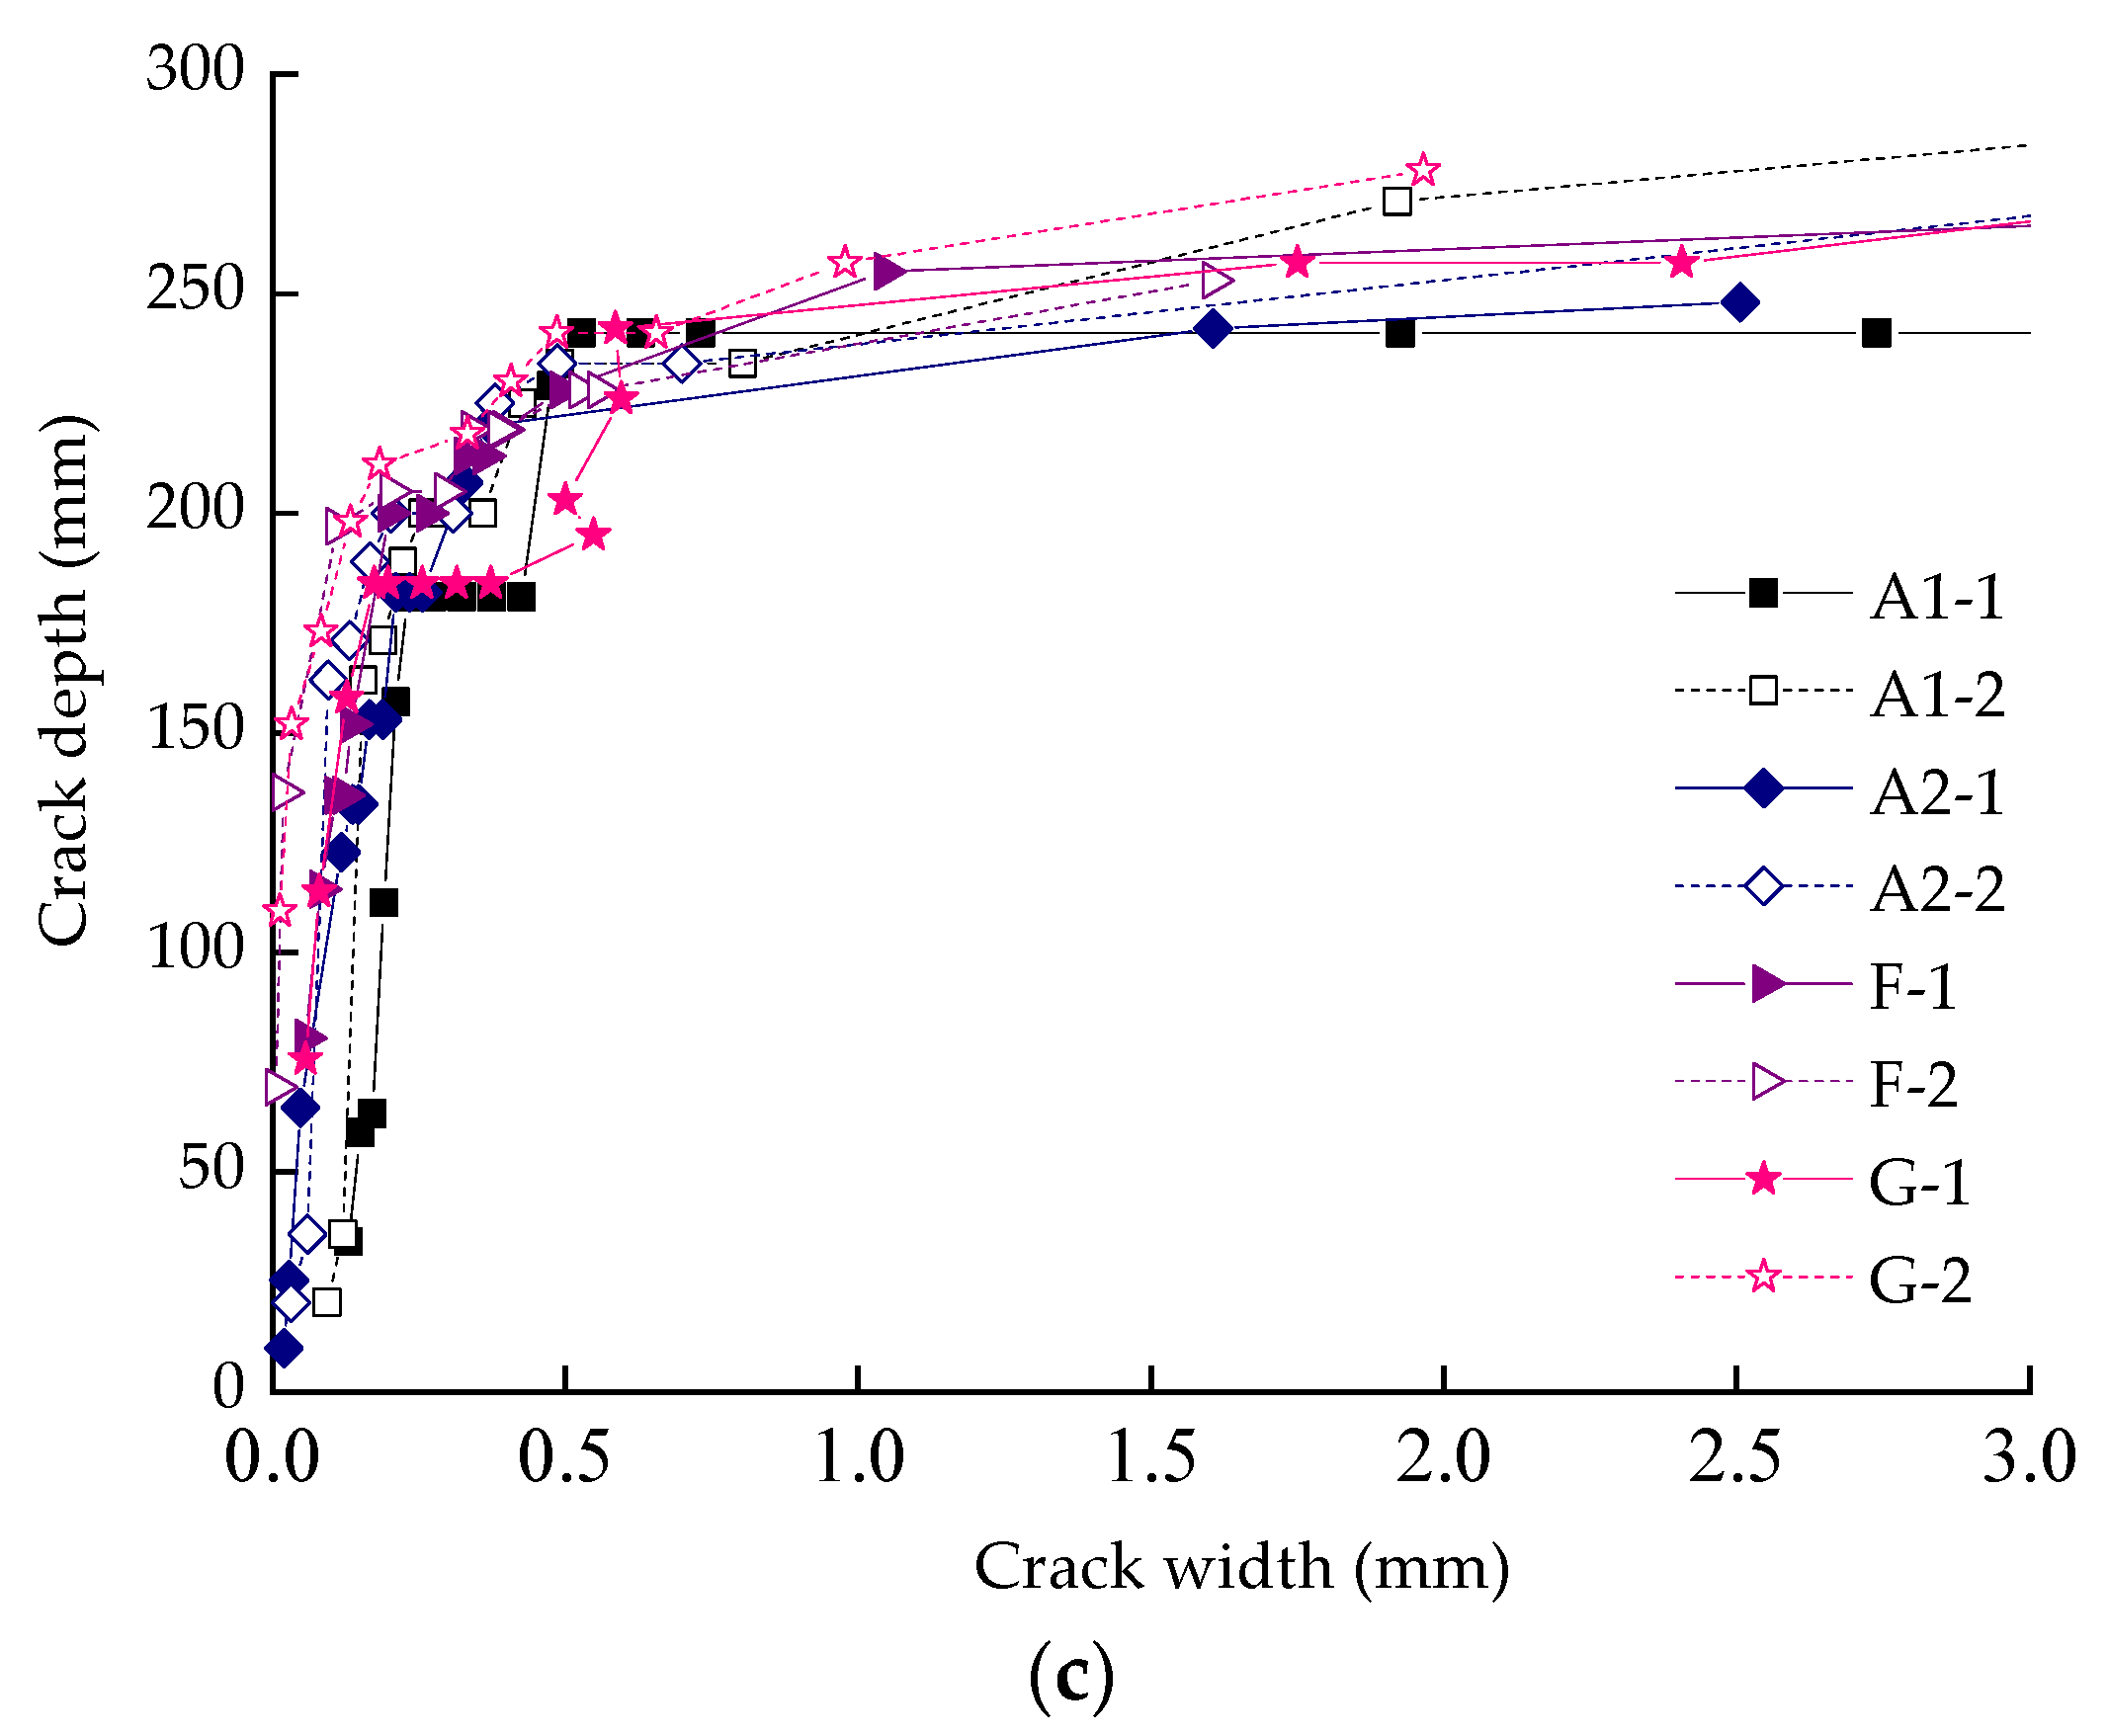
- The crack initiation on side-surface was later than its appearance on top-surface of beams. But the crack depth propagated more quickly, reaching the original position of neutral axis in a very short time. After that, the rate became slower due to the limitation from the compression zone.
- The theoretical analysis of correlation between crack width and crack depth was carried out by combining work phases of a cross-section of concrete and curves of depth/width. The work phase can be classified into three phases, namely uncracked, crack propagation, and fracture phases. The curves of depth/width grew linearly in the beginning. After that, no linear behavior was observed. When the reinforcements yielded, the crack depth remained stable even with a great increase of crack width.
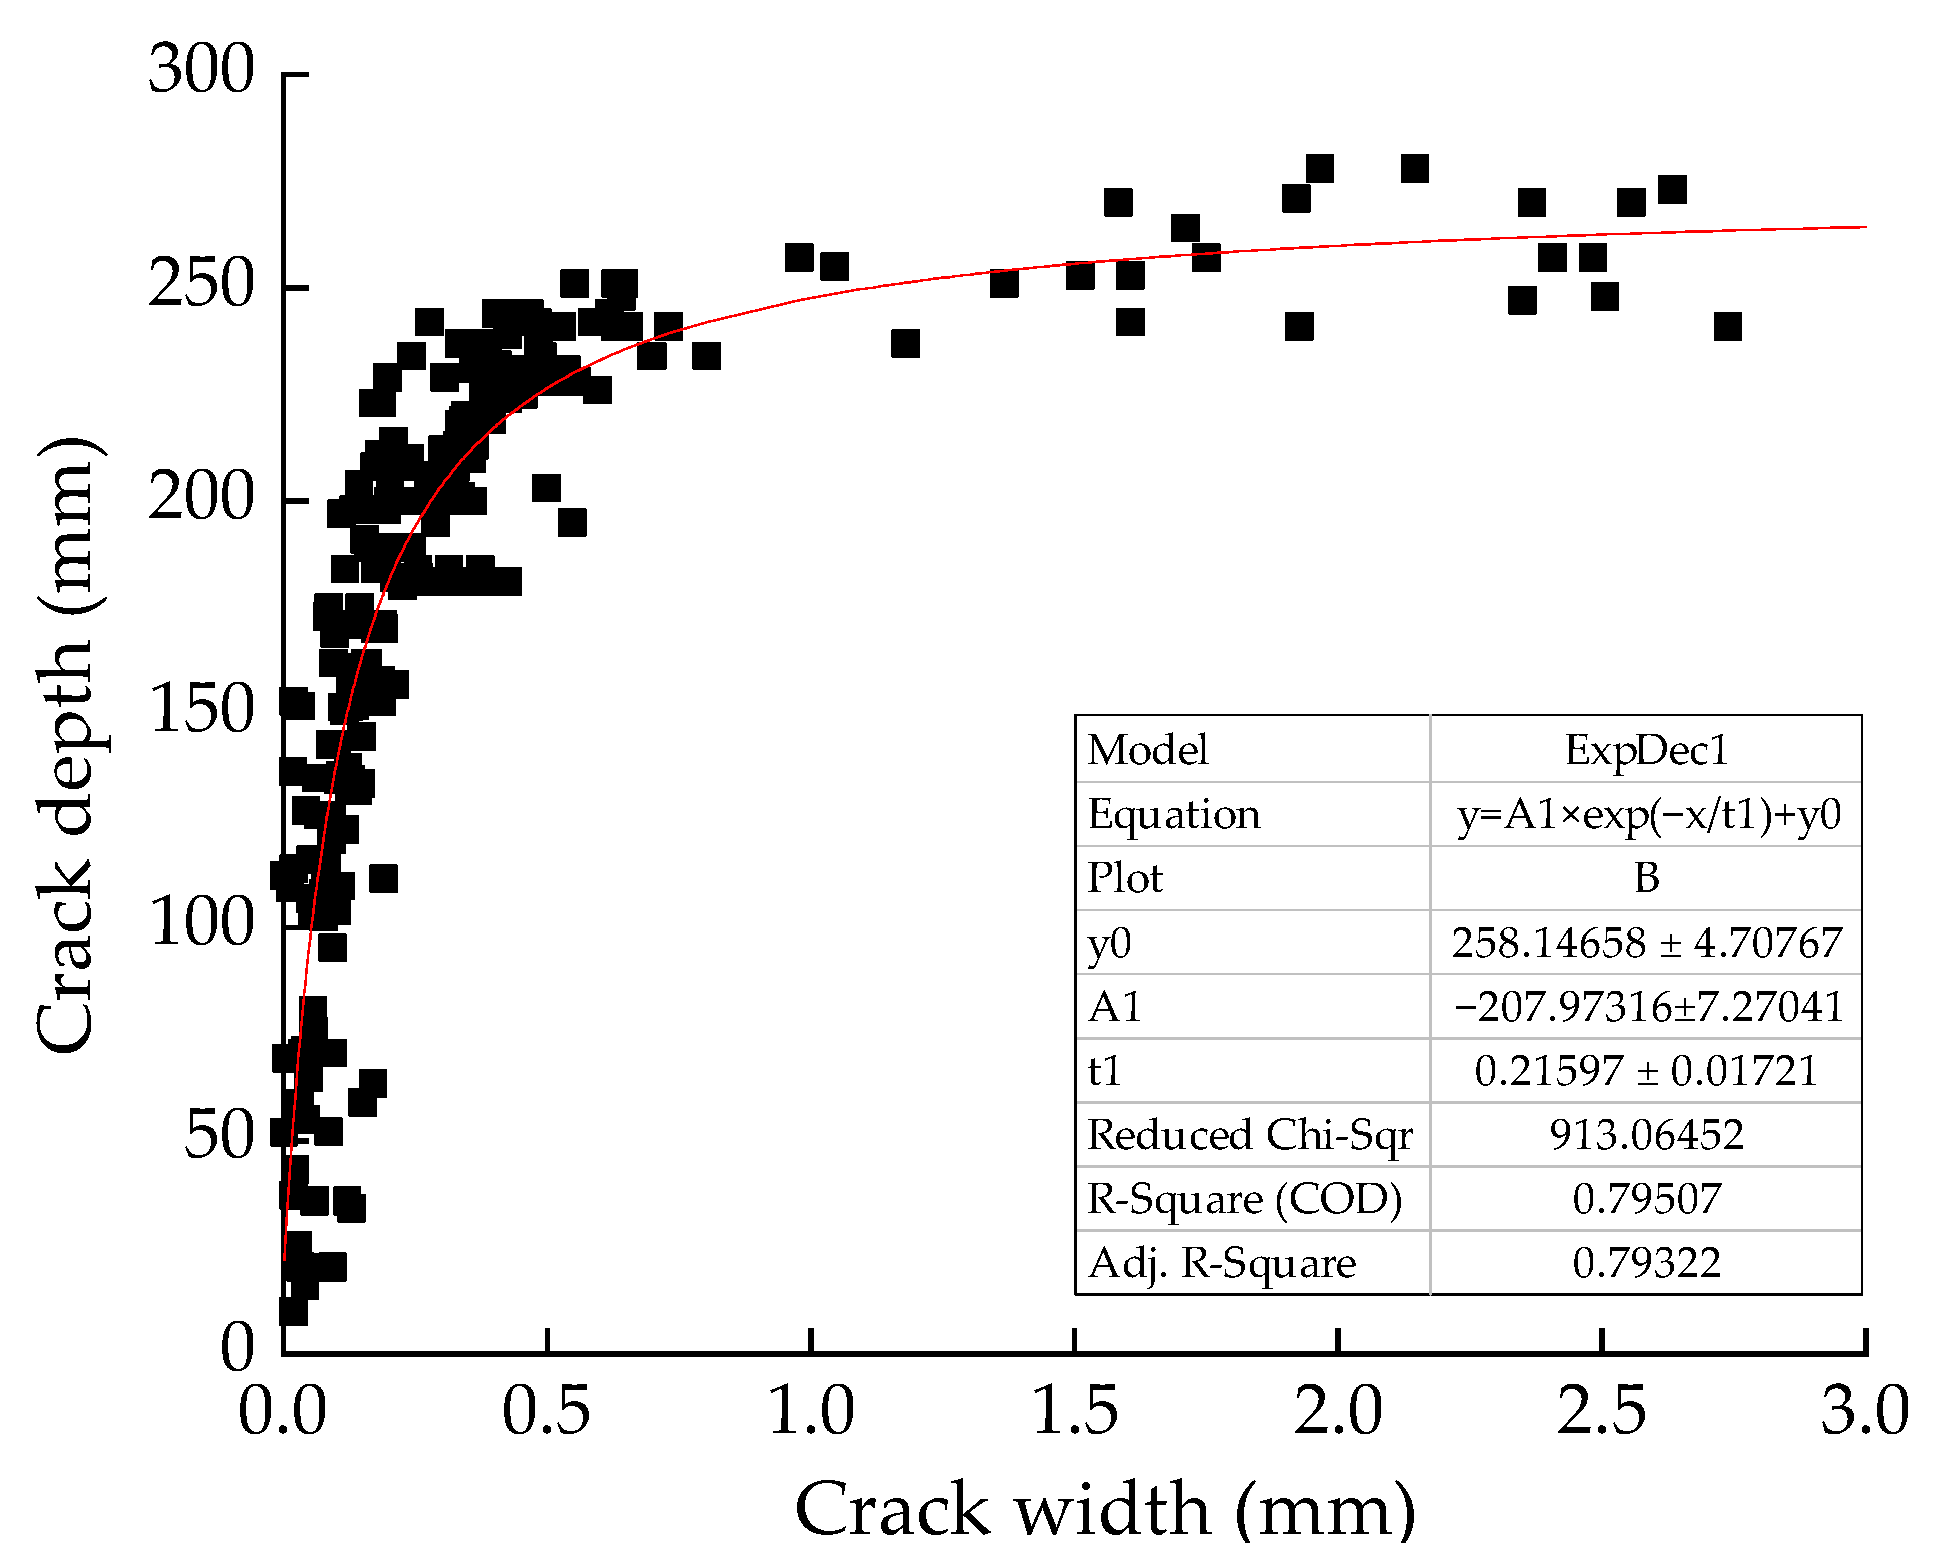
- On a foundation of achievements in this paper, an exponential function was proposed to predict load-induced crack depth. Verification work has been conducted to illustrate that the fitting function achieved a good agreement between the theoretical and the experimental relationship.
Author Contributions
Funding
Institutional Review Board Statement
Informed Consent Statement
Data Availability Statement
Conflicts of Interest
References
- Kashani, M.M.; Alagheband, P.; Khan, R.; Davis, S. Impact of Corrosion on Low-cycle Fatigue Degradation of Reinforcing Bars with the Effect of Inelastic Buckling. Int. J. Fatigue 2015, 77, 174–185. [Google Scholar] [CrossRef] [Green Version]
- Kim, A.T.V.; Mark, G.S. Structural Reliability of Concrete Bridges Including Improved Chloride Induced Corrosion Models. Struct. Saf. 2000, 22, 313–333. [Google Scholar] [CrossRef]
- Li, H.D.; Li, B.; Jin, R.Y.; Li, S.; Yu, J.G. Effects of Sustained Loading and Corrosion on the Performance of Reinforced Concrete Beams. Constr. Build. Mater. 2018, 169, 179–187. [Google Scholar] [CrossRef]
- Guzmán, S.; Gálvez, J.C. Modelling of Concrete Cover Cracking Due to Non-uniform Corrosion of Reinforcing Steel. Constr. Build. Mater. 2017, 155, 1063–1071. [Google Scholar] [CrossRef]
- Hájková, K.; Šmilauer, V.; Jendele, L.; Červenka, J. Prediction of Reinforcement Corrosion Due to Chloride Ingress and Its Effects on Serviceability. Eng. Struct. 2018, 174, 768–777. [Google Scholar] [CrossRef]
- Li, Y.; Chen, Y.; Shao, W.; Zhang, J.; Liao, S.; Fernandez-Steeger, T.M. Service Life Prediction and Lateral Bearing Capacity Analysis of Piles Considering Coupled Corrosion-Temperature Deterioration Processes. J. Mar. Sci. Eng. 2021, 9, 614. [Google Scholar] [CrossRef]
- Rasmussen, A.B.; Fisker, J.; Hagsten, L.G. Cracking in Flexural Reinforced Concrete Members. Proc. Eng. 2017, 172, 922–929. [Google Scholar] [CrossRef]
- Zhu, H.G.; Yi, C.; Sun, F.Y. Geometrical Characteristic of Concrete Shrinkage Crack and Its Effect on Chloride Ion Permeability. J. Harbin Inst. Technol. 2016, 48, 142–147. (In Chinese) [Google Scholar]
- Laterza, M.; Amato, M.D.; Braga, F.; Gigliotti, R. Extension to Rectangular Section of an Analytical Model for Concrete Confined by Steel Stirrups and/or FRP Jackets. Compos. Struct. 2017, 176, 910–922. [Google Scholar] [CrossRef]
- Naotunna, C.N.; Samarakoon, S.M.S.M.K.; Fossa, K.T. Experimental Investigation of Crack Width Variation along the Concrete Cover Depth in Reinforced Concrete Specimens with Ribbed Bars and Smooth Bars. Case Stud. Constr. Mater. 2021, 15, e00593. [Google Scholar] [CrossRef]
- Tung, N.D.; Betschoga, B.; Tue, N.V. Analysis of the Crack Development and Shear Transfer Mechanisms of Reinforced Concrete Beams with Low Amounts of Shear Reinforcement. Eng. Struct. 2020, 222, 111114. [Google Scholar] [CrossRef]
- Cheng, X.D.; Su, Q.Z.; Ma, F.L.; Liu, X.Q.; Liang, X.C. Investigation on Crack Propagation of Concrete Cover Induced by Non-uniform Corrosion of Multiple Rebars. Eng. Fract. Mech. 2018, 201, 366–384. [Google Scholar] [CrossRef]
- Yang, S.T.; Li, K.F.; Li, C.Q. Numerical Determination of Concrete Crack Width for Corrosion-affected Concrete Structures. Comput. Struct. 2018, 207, 75–82. [Google Scholar] [CrossRef] [Green Version]
- British Standards Institution. BS 8007: Code of Practice for Design of Concrete Structures for Retaining Aqueous Liquids; British Standards Institution Publisher: London, UK, 1987. [Google Scholar]
- Comité Européen de Normalisation. EN 1992-1-1: Eurocode 2: Design of Concrete Structures: General Rules and Rules for Buildings; British Standards Institution Publisher: London, UK, 2014. [Google Scholar]
- ACI (American Concrete Institute). ACI 318-19 & ACI 318R-19: Building Code Requirements for Structural Concrete and Commentary; American Concrete Institute: Farmington Hills, MI, USA, 2019. [Google Scholar]
- Frosch, R.J. Another Look at Cracking and Crack Control in Reinforced Concrete. ACI Struct. J. 1999, 96, 437–442. [Google Scholar]
- GB 50010–2010. Ministry of Housing and Urban–Rural Development of People’s Republic of China. Code for Design of Concrete Structures; Architecture and Building Press: Beijing, China, 2010.
- GB 50152–2012. Ministry of Housing and Urban–Rural Development of People’s Republic of China. Standard Methods for Testing of Concrete Structure; Architecture and Building Press: Beijing, China, 2012.
- Grégoire, D.; Rojas-Solano, L.B.; Pijaudier-Cabot, G. Failure and Size Effect for Notched and Unnotched Concrete Beams. Int. J. Numer. Anal. Method Geomech. 2013, 37, 1434–1452. [Google Scholar] [CrossRef]
- Qin, R.Y.; Zhou, A.; Lau, D. Effect of Reinforcement Ratio on the Flexural Performance of Hybrid FRP Reinforced Concrete Beams. Compos. Part B-Eng. 2017, 108, 200–209. [Google Scholar] [CrossRef]
- Yoo, D.Y.; Moon, D.Y. Effect of Steel Fibers on the Flexural Behavior of RC beams with very low reinforcement ratios. Constr. Build. Mater. 2018, 188, 237–254. [Google Scholar] [CrossRef]
- Osman, B.H.; Wu, E.; Ji, B.; Abdulhameed, S.S. Effect of Reinforcement Ratios on Shear Behaviour of Concrete Beams Strengthened with CFRP Sheets. HBRC J. 2018, 14, 29–36. [Google Scholar] [CrossRef] [Green Version]
- Kaszubska, M.; Kotynia, R.; Barros, J.A.O. Influence of Longitudinal GFRP Reinforcement Ratio on Shear Capacity of Concrete Beams without Stirrups. Proc. Eng. 2017, 193, 361–368. [Google Scholar] [CrossRef]
- Kamyani, Z.A.; Guadagnini, M.; Pilakoutas, K. Predicting Shrinkage Induced Curvature in Plain and Reinforced Concrete. Eng. Struct. 2018, 176, 468–480. [Google Scholar] [CrossRef]
- Bouziadi, F.; Boulekbache, B.; Haddi, A.; Djelal, C. Experimental and Finite Element Analysis of Creep Behaviour of Steel Fibre Reinforced High Strength Concrete Beams. Constr. Build. Mater. 2018, 173, 101–110. [Google Scholar] [CrossRef]
- Jongvivatsakul, P.; Attachaiyawuth, A.; Pansuk, W. A Crack-shear Slip Model of High-strength Steel Fiber-reinforced Concrete Based on a Push-off Test. Constr. Build. Mater. 2016, 126, 924–935. [Google Scholar] [CrossRef]
- Caldentey, P.; Peiretti, C.; Soto, G. Cracking of RC Members Revisited: Influence of Cover, ϕ/ρs,e and Stirrup Spacing–An experimental and Theoretical Study. Struct. Concr. 2013, 14, 69–78. [Google Scholar] [CrossRef]
- Rimkus, A.; Cervenka, V.; Gribniak, V.; Cervenka, J. Uncertainty of the Smeared Crack Model Applied to RC Beams. Eng. Fract. Mech. 2020, 233, 107088. [Google Scholar] [CrossRef]
- Gribniak, V.; Caldentey, A.P.; Kaklauskas, G.; Rimkus, A.; Sokolov, A. Effect of Arrangement of Tensile Reinforcement on Flexural Stiffness and Cracking. Eng. Struct. 2016, 124, 418–428. [Google Scholar] [CrossRef]


| Standard | Calculation of Crack Widths | Parameter |
|---|---|---|
| EN (Comprehensive theory) | , . | w is crack width, Sr,max is the maximum crack spacing; εsm is the mean strain in the reinforcement; εcm is the mean strain in the concrete between cracks; σs is the stress in the tension reinforcement; kt is a factor dependent on the duration of the load; αe is average tensile strength of concrete when cracks are about to appear; ρp,eff is effective reinforcement ratio. Es is elastic modulus of reinforcement. |
| ACI (No-slip theory) | , . . [17]) | s is the spacing between reinforcement; fs is the stresses in reinforcement; cc is the clear cover of reinforcement. (wc is the maximum crack width; Es is elastic modulus of reinforcement; dc is the distance from the concrete bottom to the centroid of the reinforcement near the bottom; ds is the shortest distance from the side edge of concrete to the centroid of the edge reinforcement) |
| GB (Comprehensive theory) | . | wmax is the maximum crack width; αcr is characteristic coefficient of members; ψ is the uneven strain coefficient of tensile steels; σsq is the tensile stress in longitudinal reinforcement; calculated under the quasi-permanent combination of actions; cs is the distance from the outer edge of the outermost tensile steel bar to the edge of the tension zone, deq is the equivalent diameter of the longitudinal rebar; ρte is viewed as effective reinforcement ratio. |
| Description of the Environment | No Risk of Corrosion or Attack | Corrosion Induced by Carbonation | Corrosion Induced by Chlorides | Corrosion Induced by Chlorides from Marine | Freeze/Thaw Attack | Chemical Attack |
|---|---|---|---|---|---|---|
| EN wcr (mm) | X0 0.4 | XC1–XC2 0.4 | XD1–XD3 0.3 | XS1–XS3 0.3 | XF1–XF4 0.3 | XA1–ZA3 0.3 |
| GB wcr (mm) | Ⅰ 0.3 | Ⅱa–Ⅱb 0.2 | Ⅱb 0.2 | Ⅲa 0.2 | Ⅲa–Ⅲb 0.2 | Ⅲb 0.2 |
| Concrete Type | Water | Cement | Sand | Coarse Aggregate | Water/Cement |
|---|---|---|---|---|---|
| C20 | 170 | 300 | 732 | 1193 | 0.57 |
| C30 | 180 | 334 | 660 | 1228 | 0.54 |
| C40 | 180 | 408 | 562 | 1250 | 0.44 |
| Concrete Type | Compressive Strength (fcu) | Tensile Strength (ftk) | Rebar Diameter (mm) | Yield Strength (fy) | Ulitimate Strength (fsu) |
|---|---|---|---|---|---|
| C20 | 38.1 | 2.70 | Ø 22 | 446 | 686 |
| C30 | 44.1 | 2.98 | Ø 18 | 564 | 691 |
| C40 | 48.0 | 3.07 | Ø 14 | 544 | 728 |
| Specimen ID | Concrete Type | Cover Thickness | Longitudinal Reinforcement | |
|---|---|---|---|---|
| N & d 2 | ρeff | |||
| A1, A2 1 | C30 | 35 | 2 Ø14 | 0.616% |
| B | C30 | 35 | 2 Ø 22 | 1.52% |
| C | C30 | 35 | 2 Ø 18 | 1.03% |
| D | C30 | 25 | 2 Ø 14 | 0.616% |
| E | C30 | 45 | 2 Ø 14 | 0.616% |
| F | C20 | 35 | 2 Ø 14 | 0.616% |
| G | C40 | 35 | 2 Ø 14 | 0.616% |
| Specimen ID | A1 | A2 | B | C | D | E | F | G |
|---|---|---|---|---|---|---|---|---|
| The first cracking load | 30 | 30 | 26 | 30 | 32 | 34 | 30 | 34 |
| The second cracking load | 46 | 44 | 44 | 44 | 46 | 46 | 48 | 48 |
| Parameter | ws,max (mm) | τl | αcr | Es (MPa) | cs (mm) | deq (mm) | b (mm) | h (mm) |
|---|---|---|---|---|---|---|---|---|
| Value | 0.3 | 1.5 | 1.9 | 2 × 10⁵ | 33, 43, 53 | 14, 18 | 200 | 300 |
| Specimen ID | A1 | A2 | C | D | E | F | G |
|---|---|---|---|---|---|---|---|
| ε (×10−6) | 1700.9 | 1691.2 | 1617.5 | 1851.4 | 1600.1 | 1591.2 | 1796.9 |
| σa (MPa) | 340.2 | 338.2 | 323.5 | 370.3 | 320.0 | 318.2 | 359.4 |
| σsq (MPa) | 341.4 | 341.4 | 328.5 | 366.4 | 321.0 | 314.3 | 363.3 |
| Beam | Load (kN) | αcr | ftk (MPa) | As (mm) | ρte(%) | c (mm) | deq (mm) | hc (mm) |
|---|---|---|---|---|---|---|---|---|
| S1-1 | 128 | 1.9 | 3.0 | 695.9 | 1 | 20 | 10 | 213.5 |
| S1-2 | 110 | 776.8 | 14 | 236.6 | ||||
| S1-4 | 52 | 760.0 | 22 | 166.0 |
| Beam | Load (kN) | w0max (mm) | h0c (mm) | hc (mm) | Variation (%) |
|---|---|---|---|---|---|
| S1-1 | 128 | 0.281 | 213.5 | 219.1 | 2.6 |
| S1-2 | 110 | 0.468 | 236.6 | 228.8 | 3.4 |
| S1-4 | 52 | 0.050 | 166.0 | 162.2 | 2.3 |
Publisher’s Note: MDPI stays neutral with regard to jurisdictional claims in published maps and institutional affiliations. |
© 2021 by the authors. Licensee MDPI, Basel, Switzerland. This article is an open access article distributed under the terms and conditions of the Creative Commons Attribution (CC BY) license (https://creativecommons.org/licenses/by/4.0/).
Share and Cite
Li, Y.; Zhang, J.; Guan, Z.; Chen, Y. Experimental Study on the Correlation between Crack Width and Crack Depth of RC Beams. Materials 2021, 14, 5950. https://doi.org/10.3390/ma14205950
Li Y, Zhang J, Guan Z, Chen Y. Experimental Study on the Correlation between Crack Width and Crack Depth of RC Beams. Materials. 2021; 14(20):5950. https://doi.org/10.3390/ma14205950
Chicago/Turabian StyleLi, Yue, Juhui Zhang, Zhongguo Guan, and Youliang Chen. 2021. "Experimental Study on the Correlation between Crack Width and Crack Depth of RC Beams" Materials 14, no. 20: 5950. https://doi.org/10.3390/ma14205950
APA StyleLi, Y., Zhang, J., Guan, Z., & Chen, Y. (2021). Experimental Study on the Correlation between Crack Width and Crack Depth of RC Beams. Materials, 14(20), 5950. https://doi.org/10.3390/ma14205950