Low-Velocity Impact Experiments and Modeling of TRC Skin-Aerated Concrete Core Sandwich Composites


Abstract
1. Introduction
2. Materials and Methods
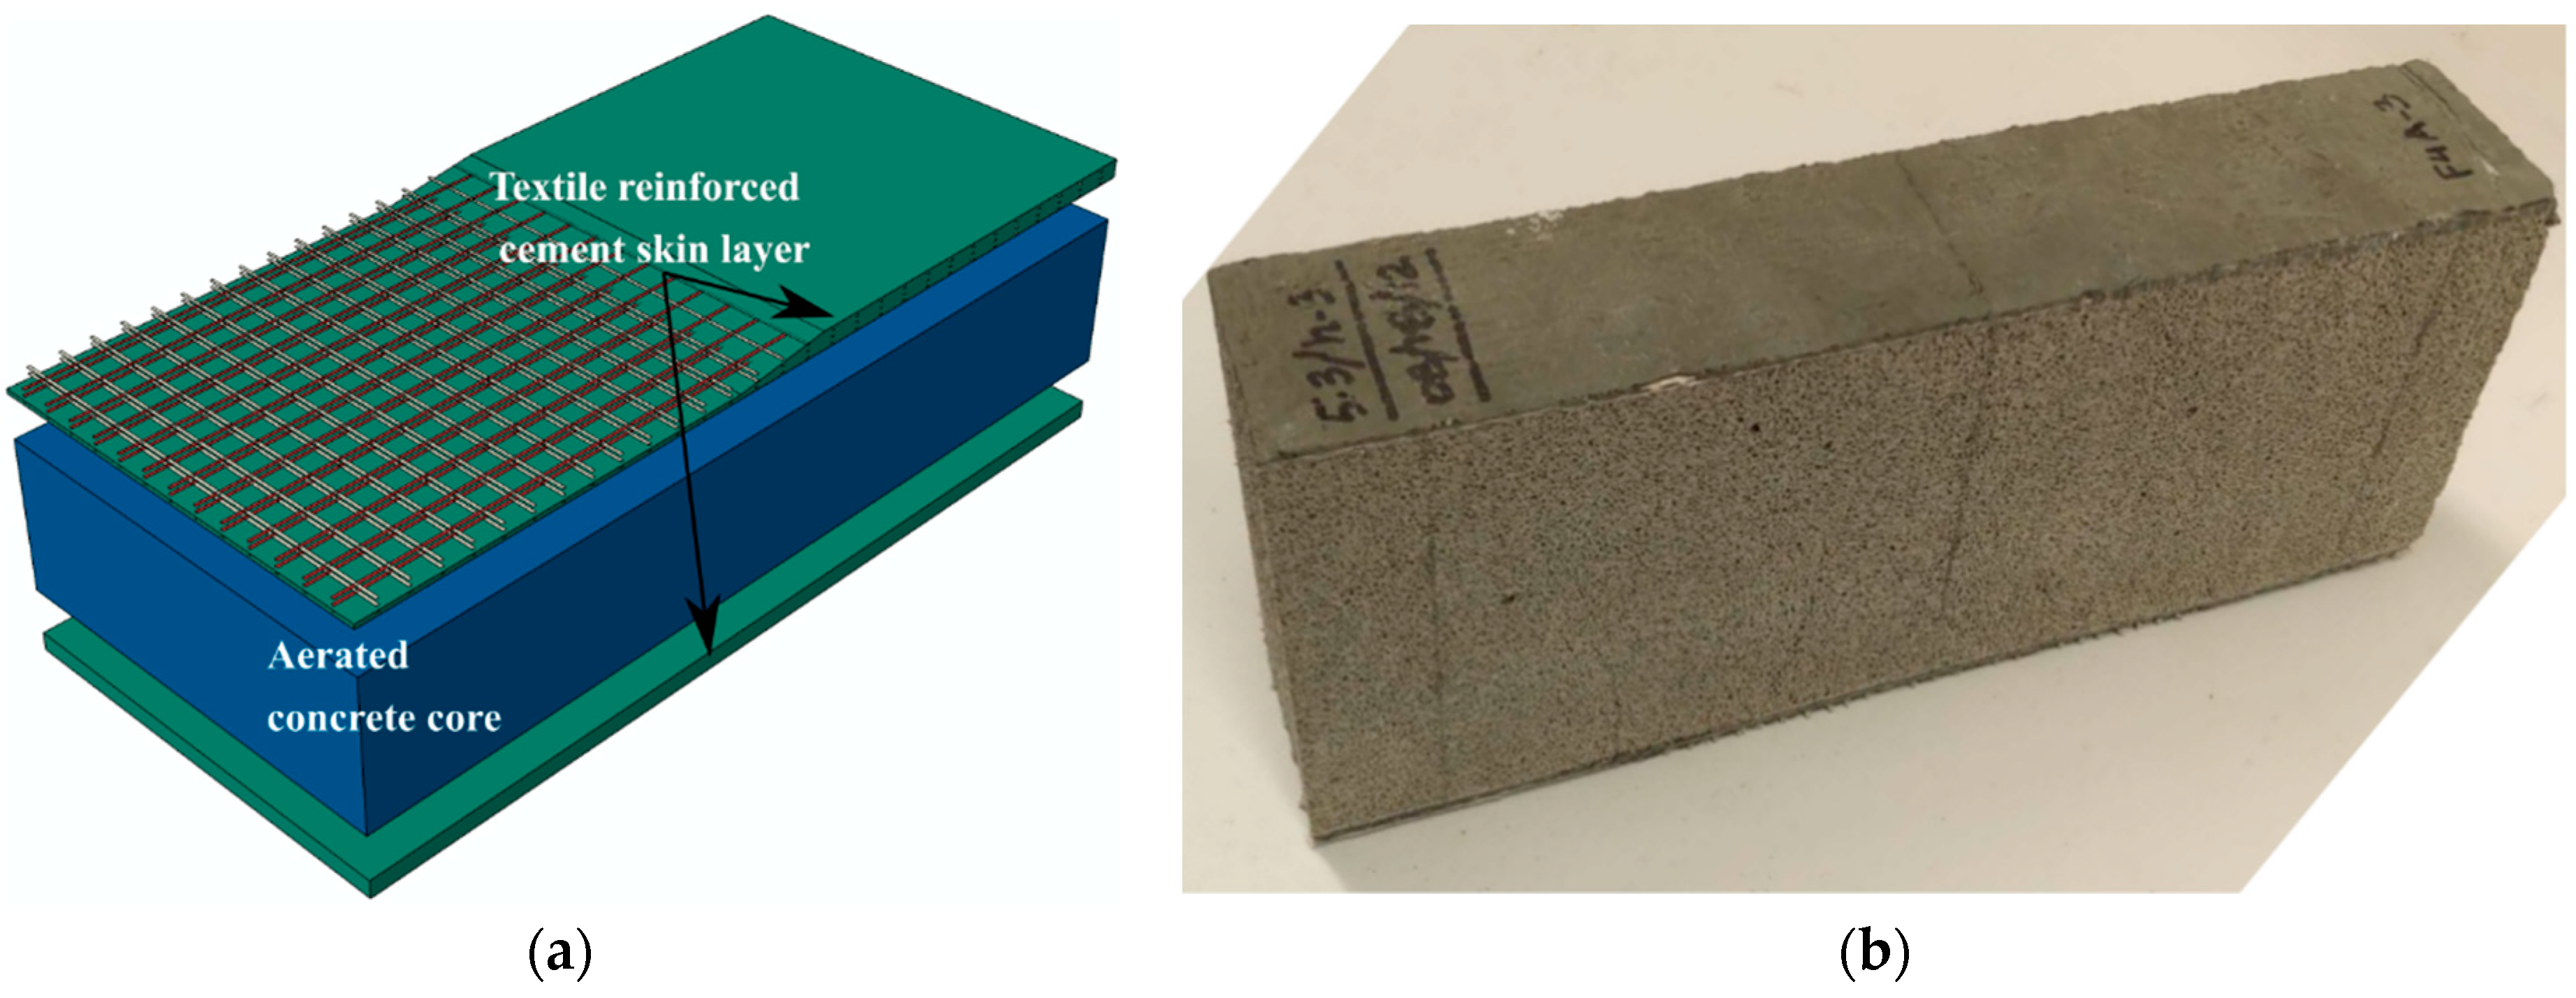
2.1. Sample Preparation
2.2. Static and Impact Tests
2.3. Digital Image Correlation (DIC) Measurement
3. Results
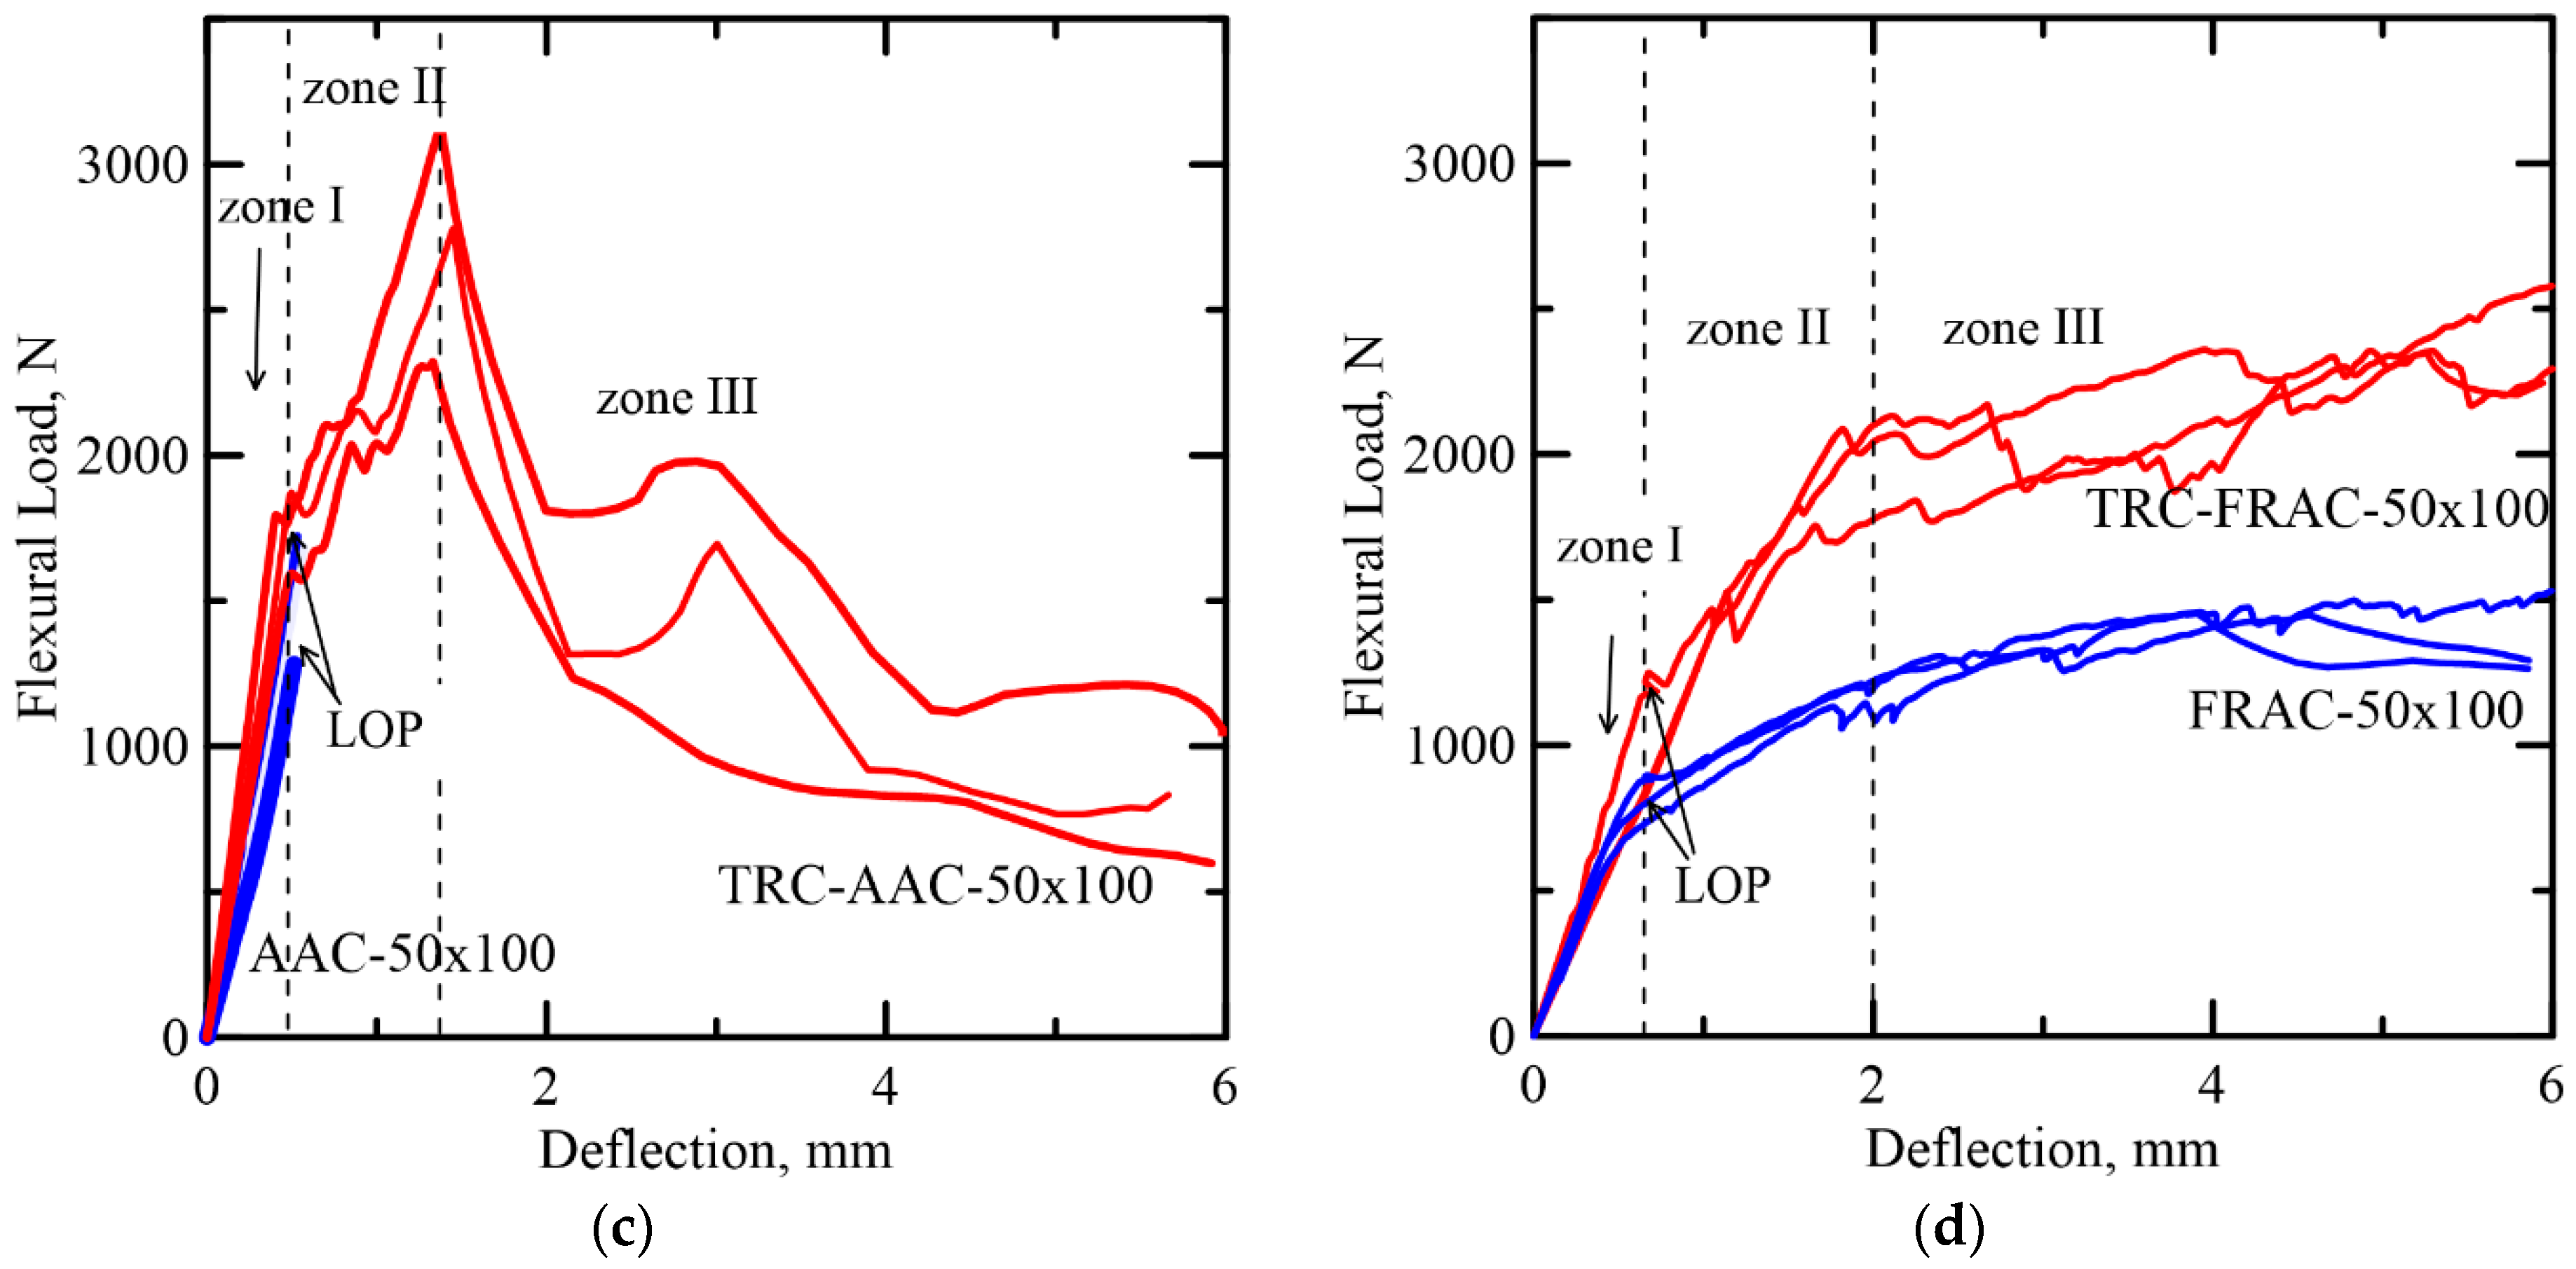
3.1. Static Tests
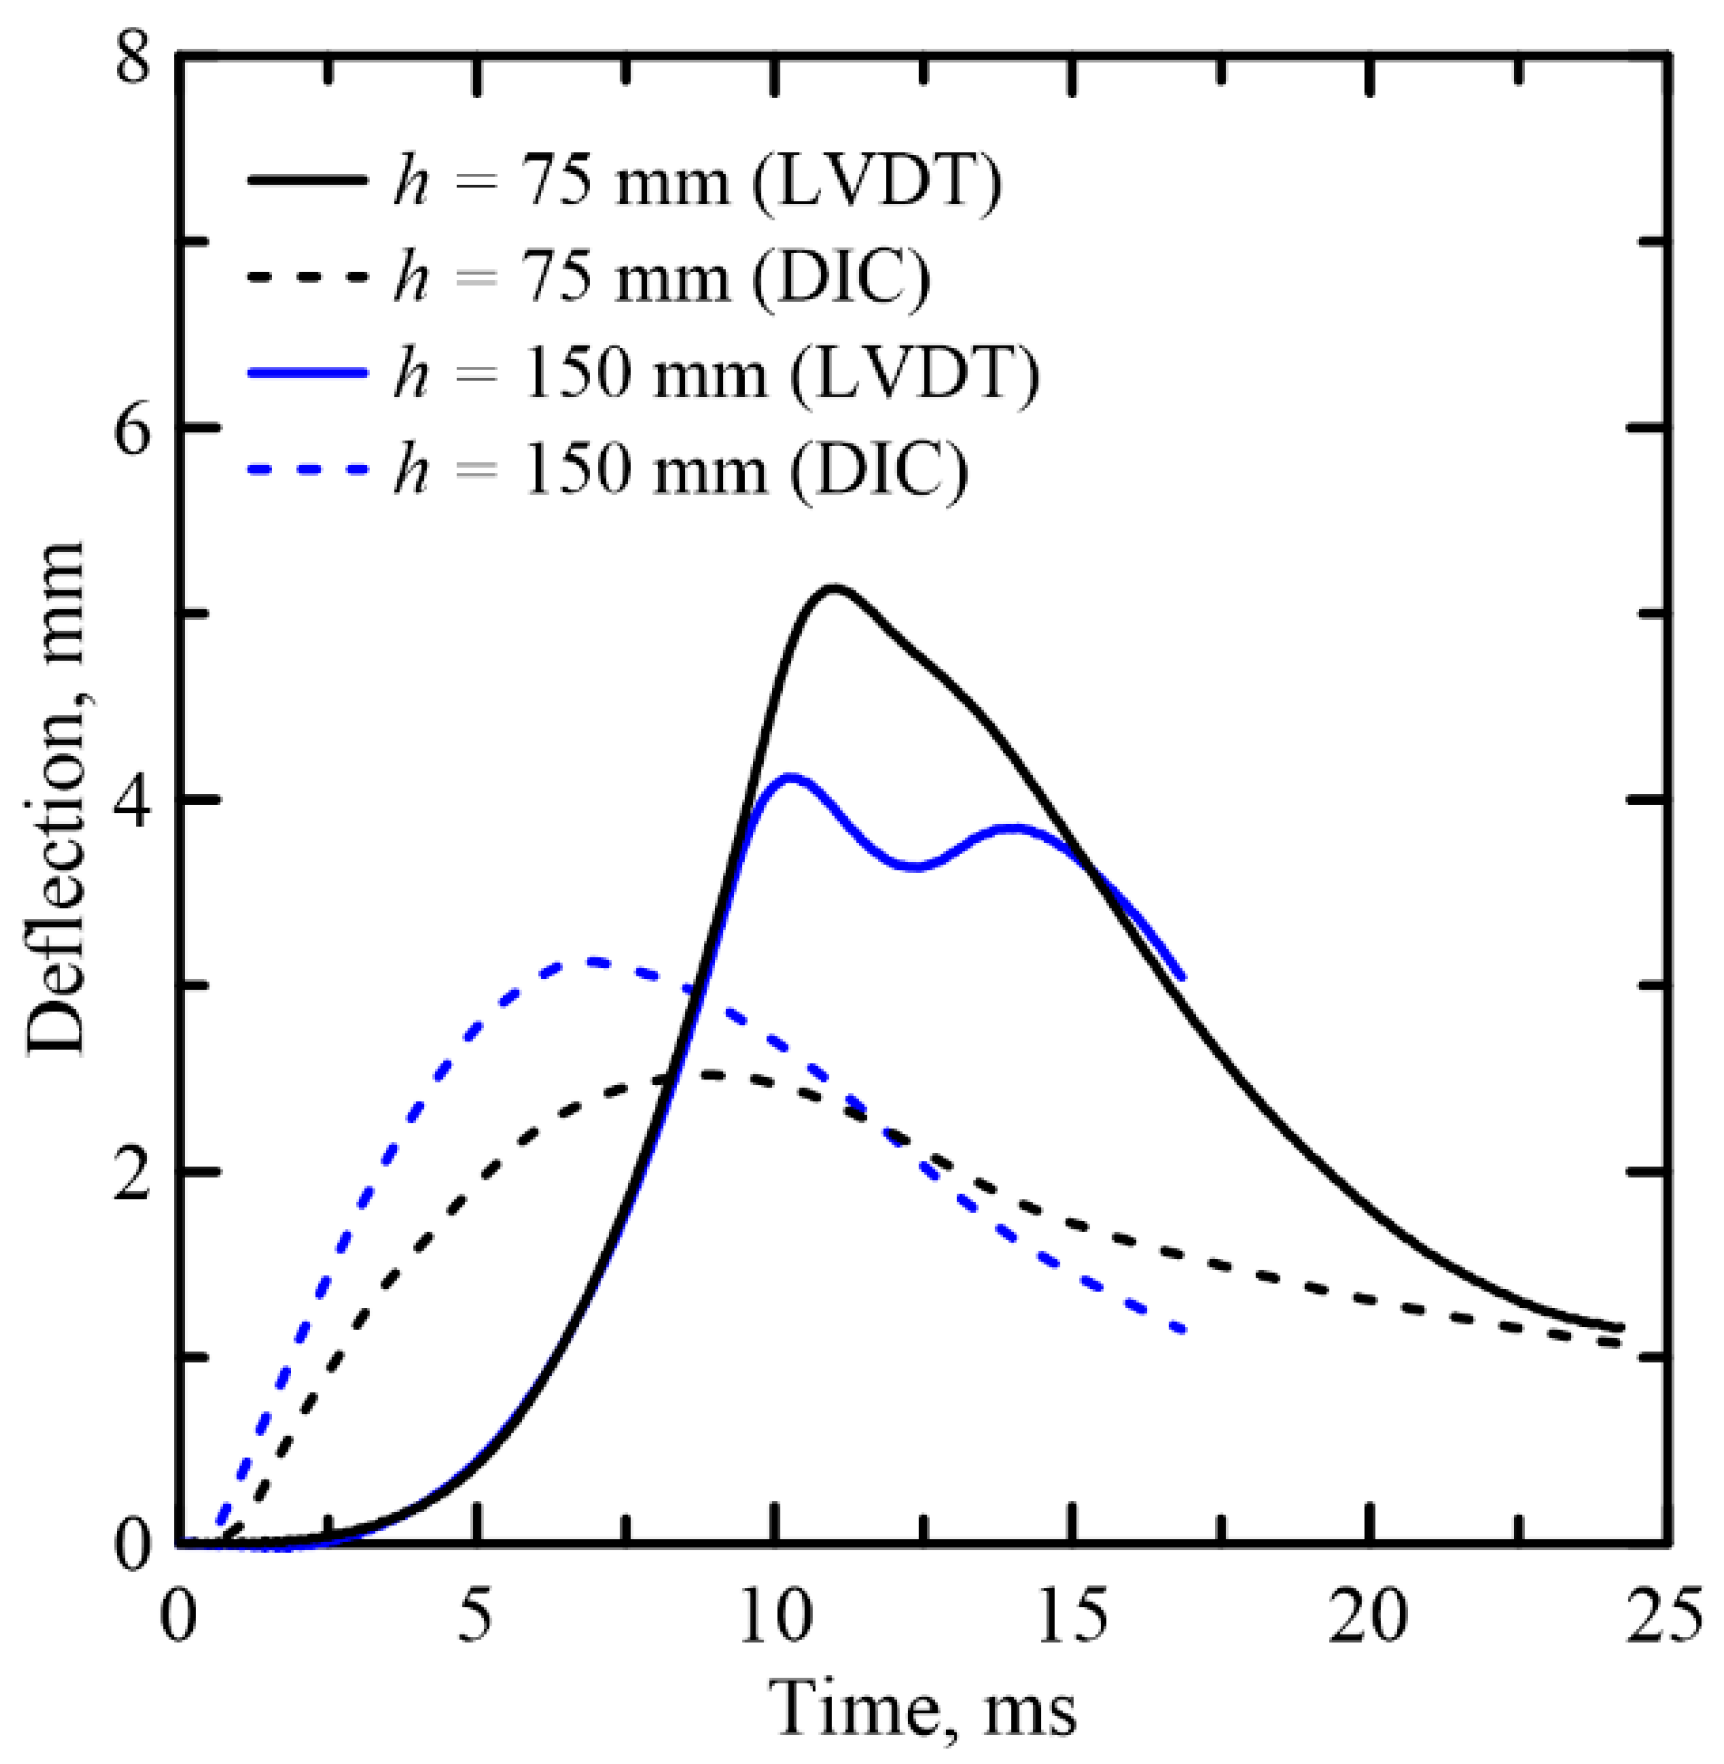
3.2. Comparison of Deflection Measurement with DIC Approach
3.3. Impact Process Analysis
3.4. Dynamic Response
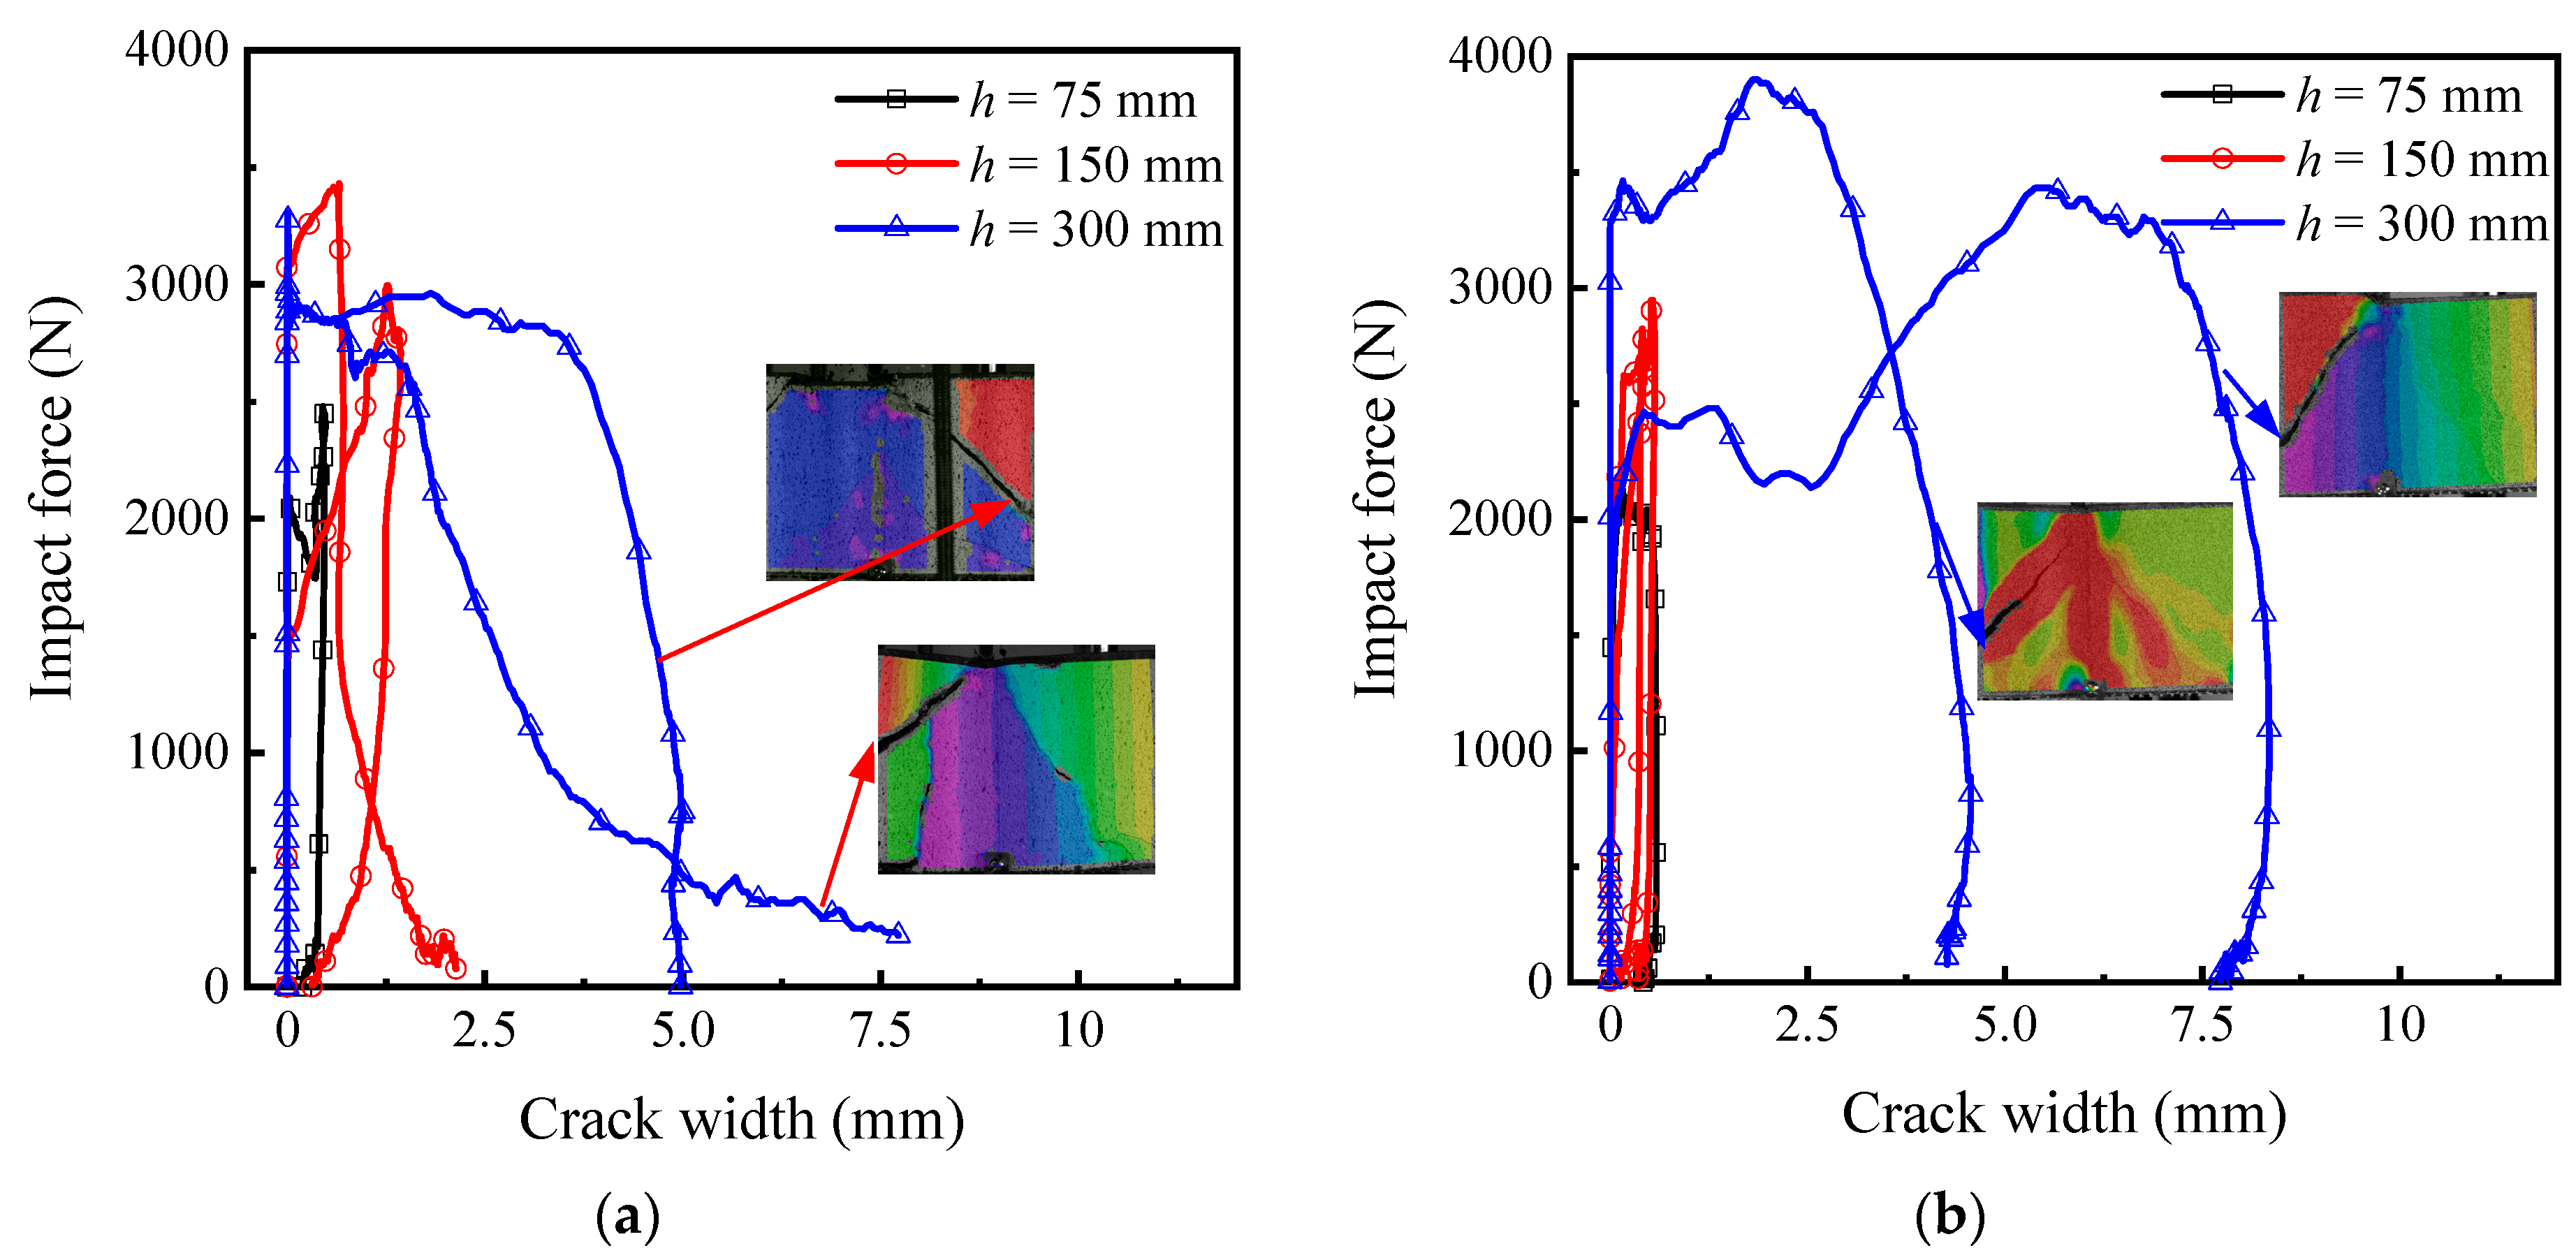
3.5. Failure Modes
4. Flexural Modeling of Sandwich Response
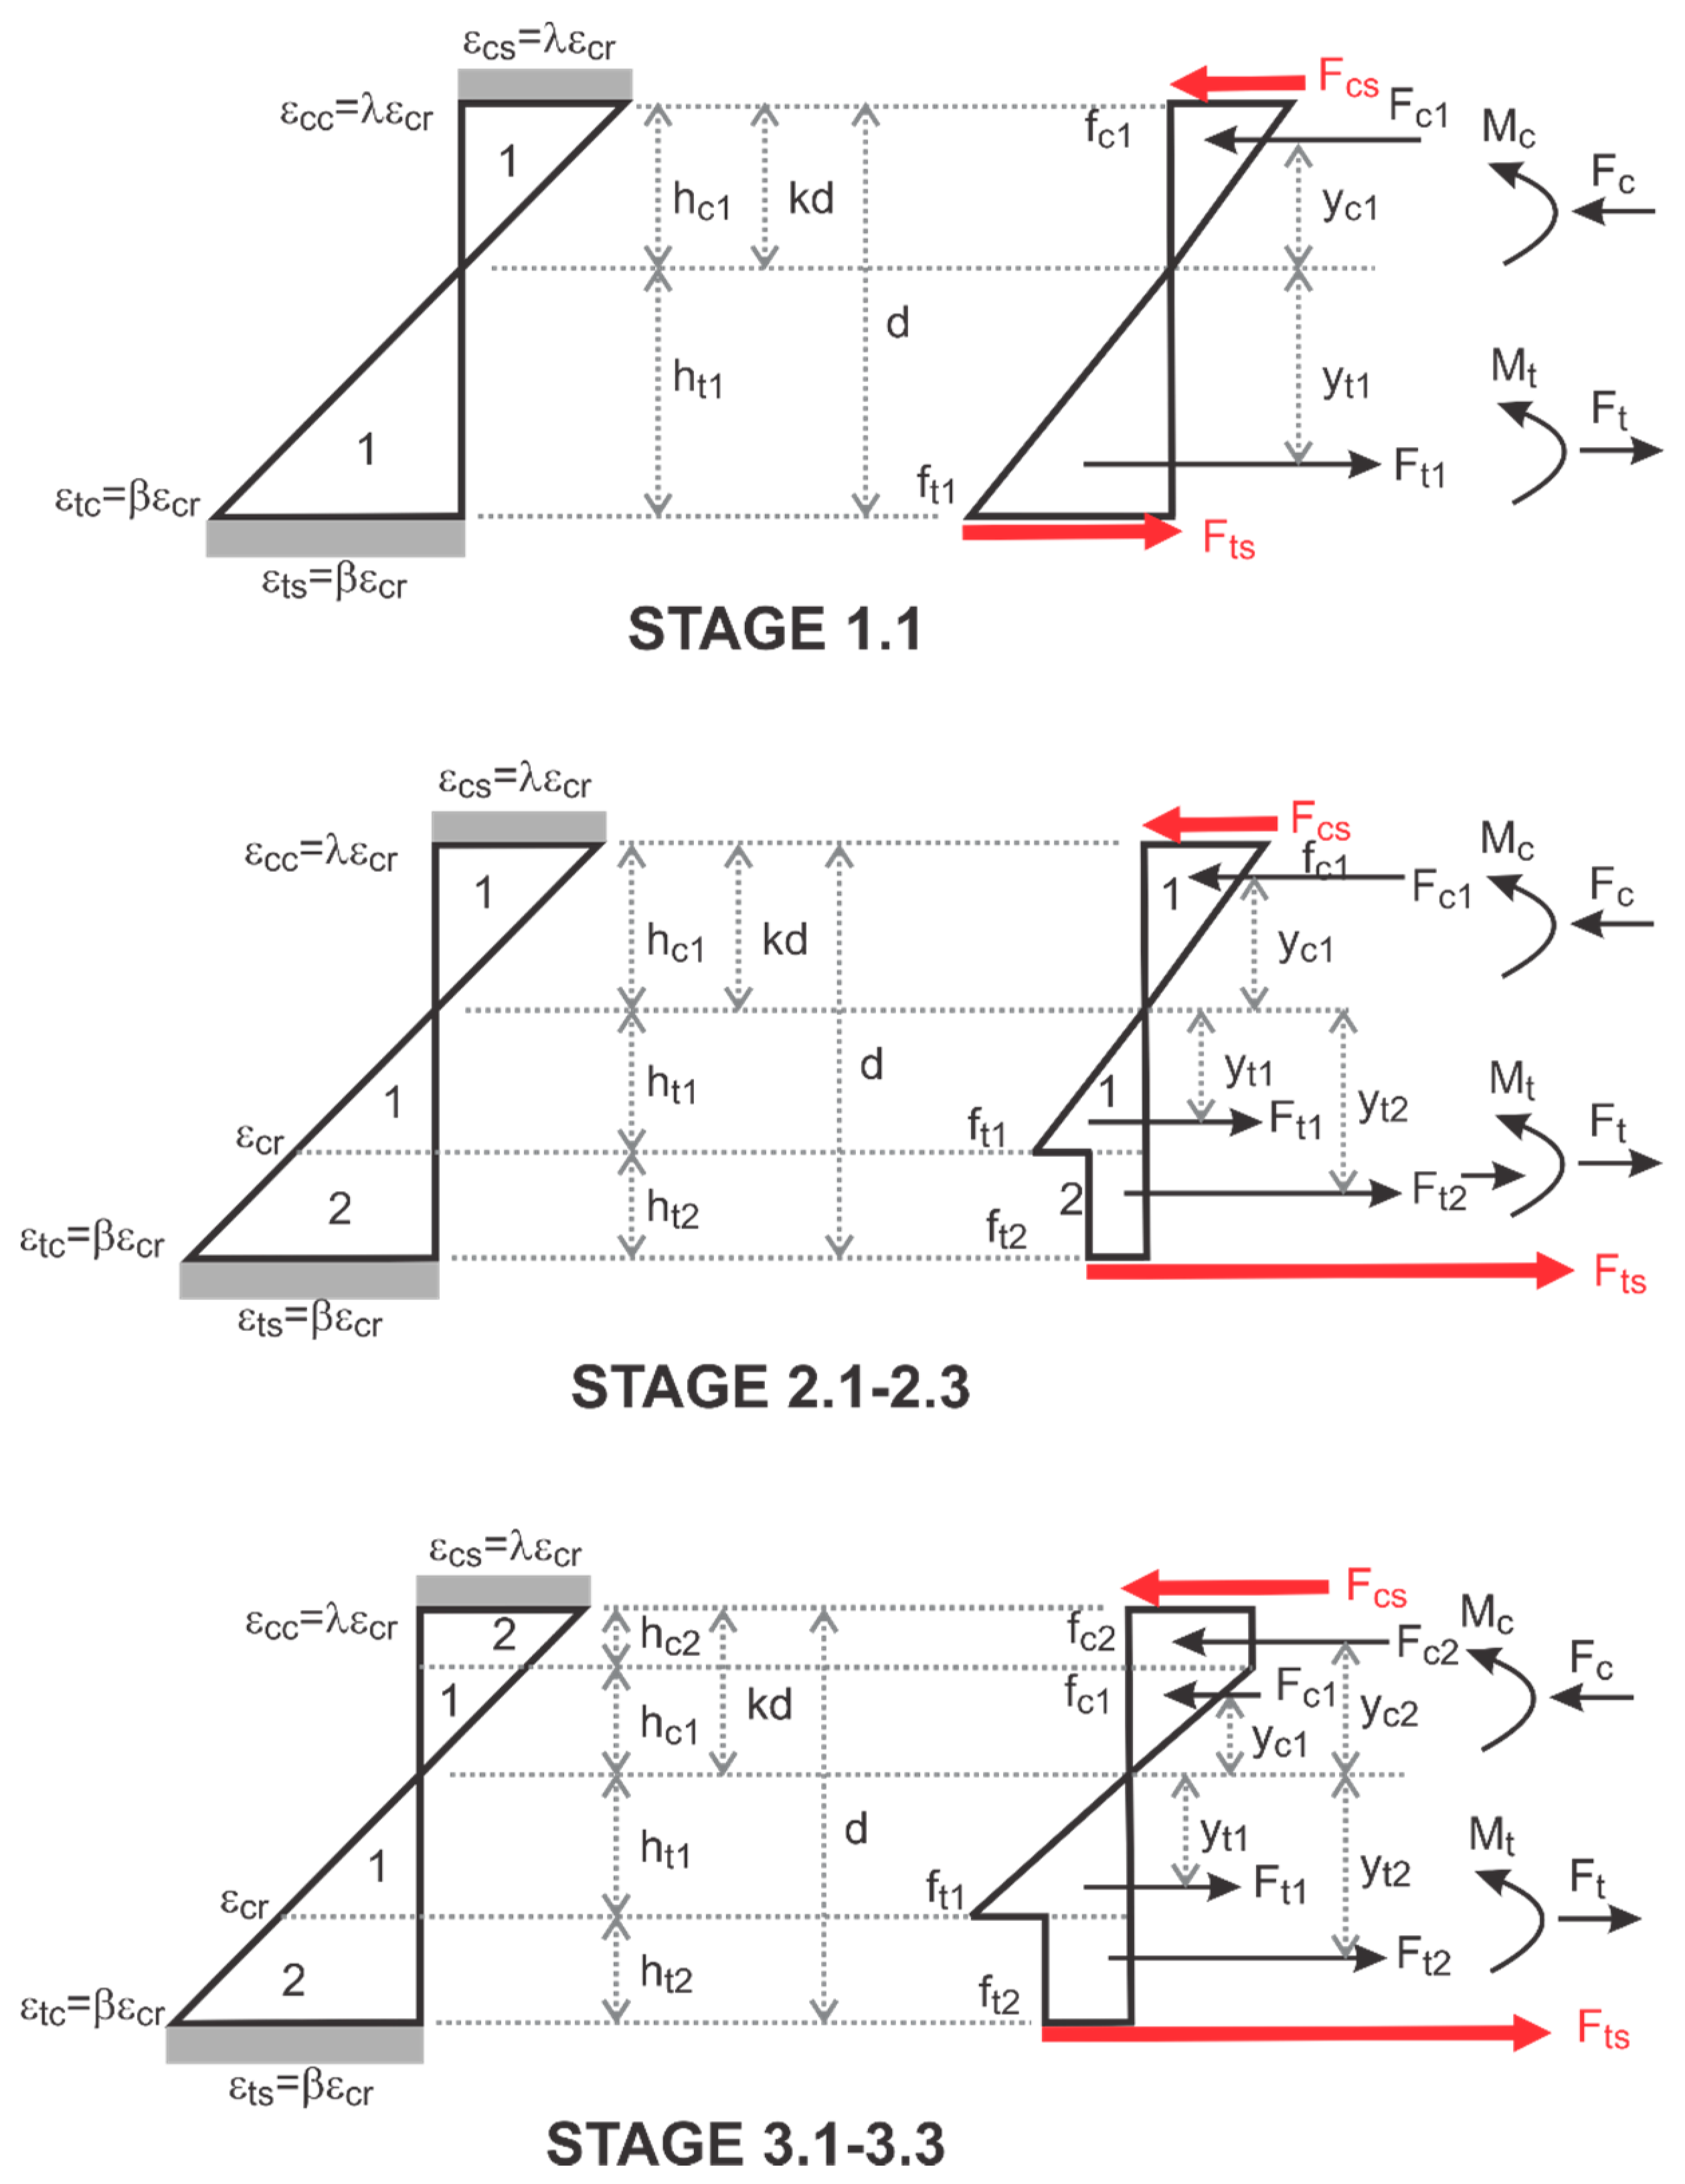
4.1. Idealized Constitutive Relations of Core and Skin and Stress Distributions
4.2. Moment–Curvature Response of the Sandwich Sections
4.3. Parameter Estimation From Experimental Data
4.4. Model Validation with Experimental Sandwich Composites
4.5. Simulation of Flexural Impact Response
5. Conclusions
- The addition of TRC layers significantly increased the toughness of AAC sandwich panels by a factor of 22 and 18 for specimen depths of 50 and 100 mm, respectively, as compared to plain AAC. At deflection limit of 5 mm, the toughness of TRC-FRAC increased by a factor 12 and 2, for specimen depths of 50 and 100 mm, respectively, when compared to plain FRAC specimens.
- In high energy events, the shear failure mode dominated the sandwich response, with the diagonal tension cracks defining the ultimate strength point. The tension TRC skin carries a significant amount of load and provides the strength and ductility to the composite. The damage mechanism of the sandwich composite is characterized by saturated lateral cracks and localized spalling in the TRC skin, as well as debonding between the textile and matrix layers within the skin.
- Increase in drop height from 75–300 mm correlated with an increase in the dynamic flexural strength and toughness, which increased from of 2–8 MPa and 4–21 J for TRC-FRAC, respectively. Whereas for the similar range of drop height the increase in flexural strength and toughness for TRC-AAC increase from 2–9 MPa and 3–26 J, respectively.
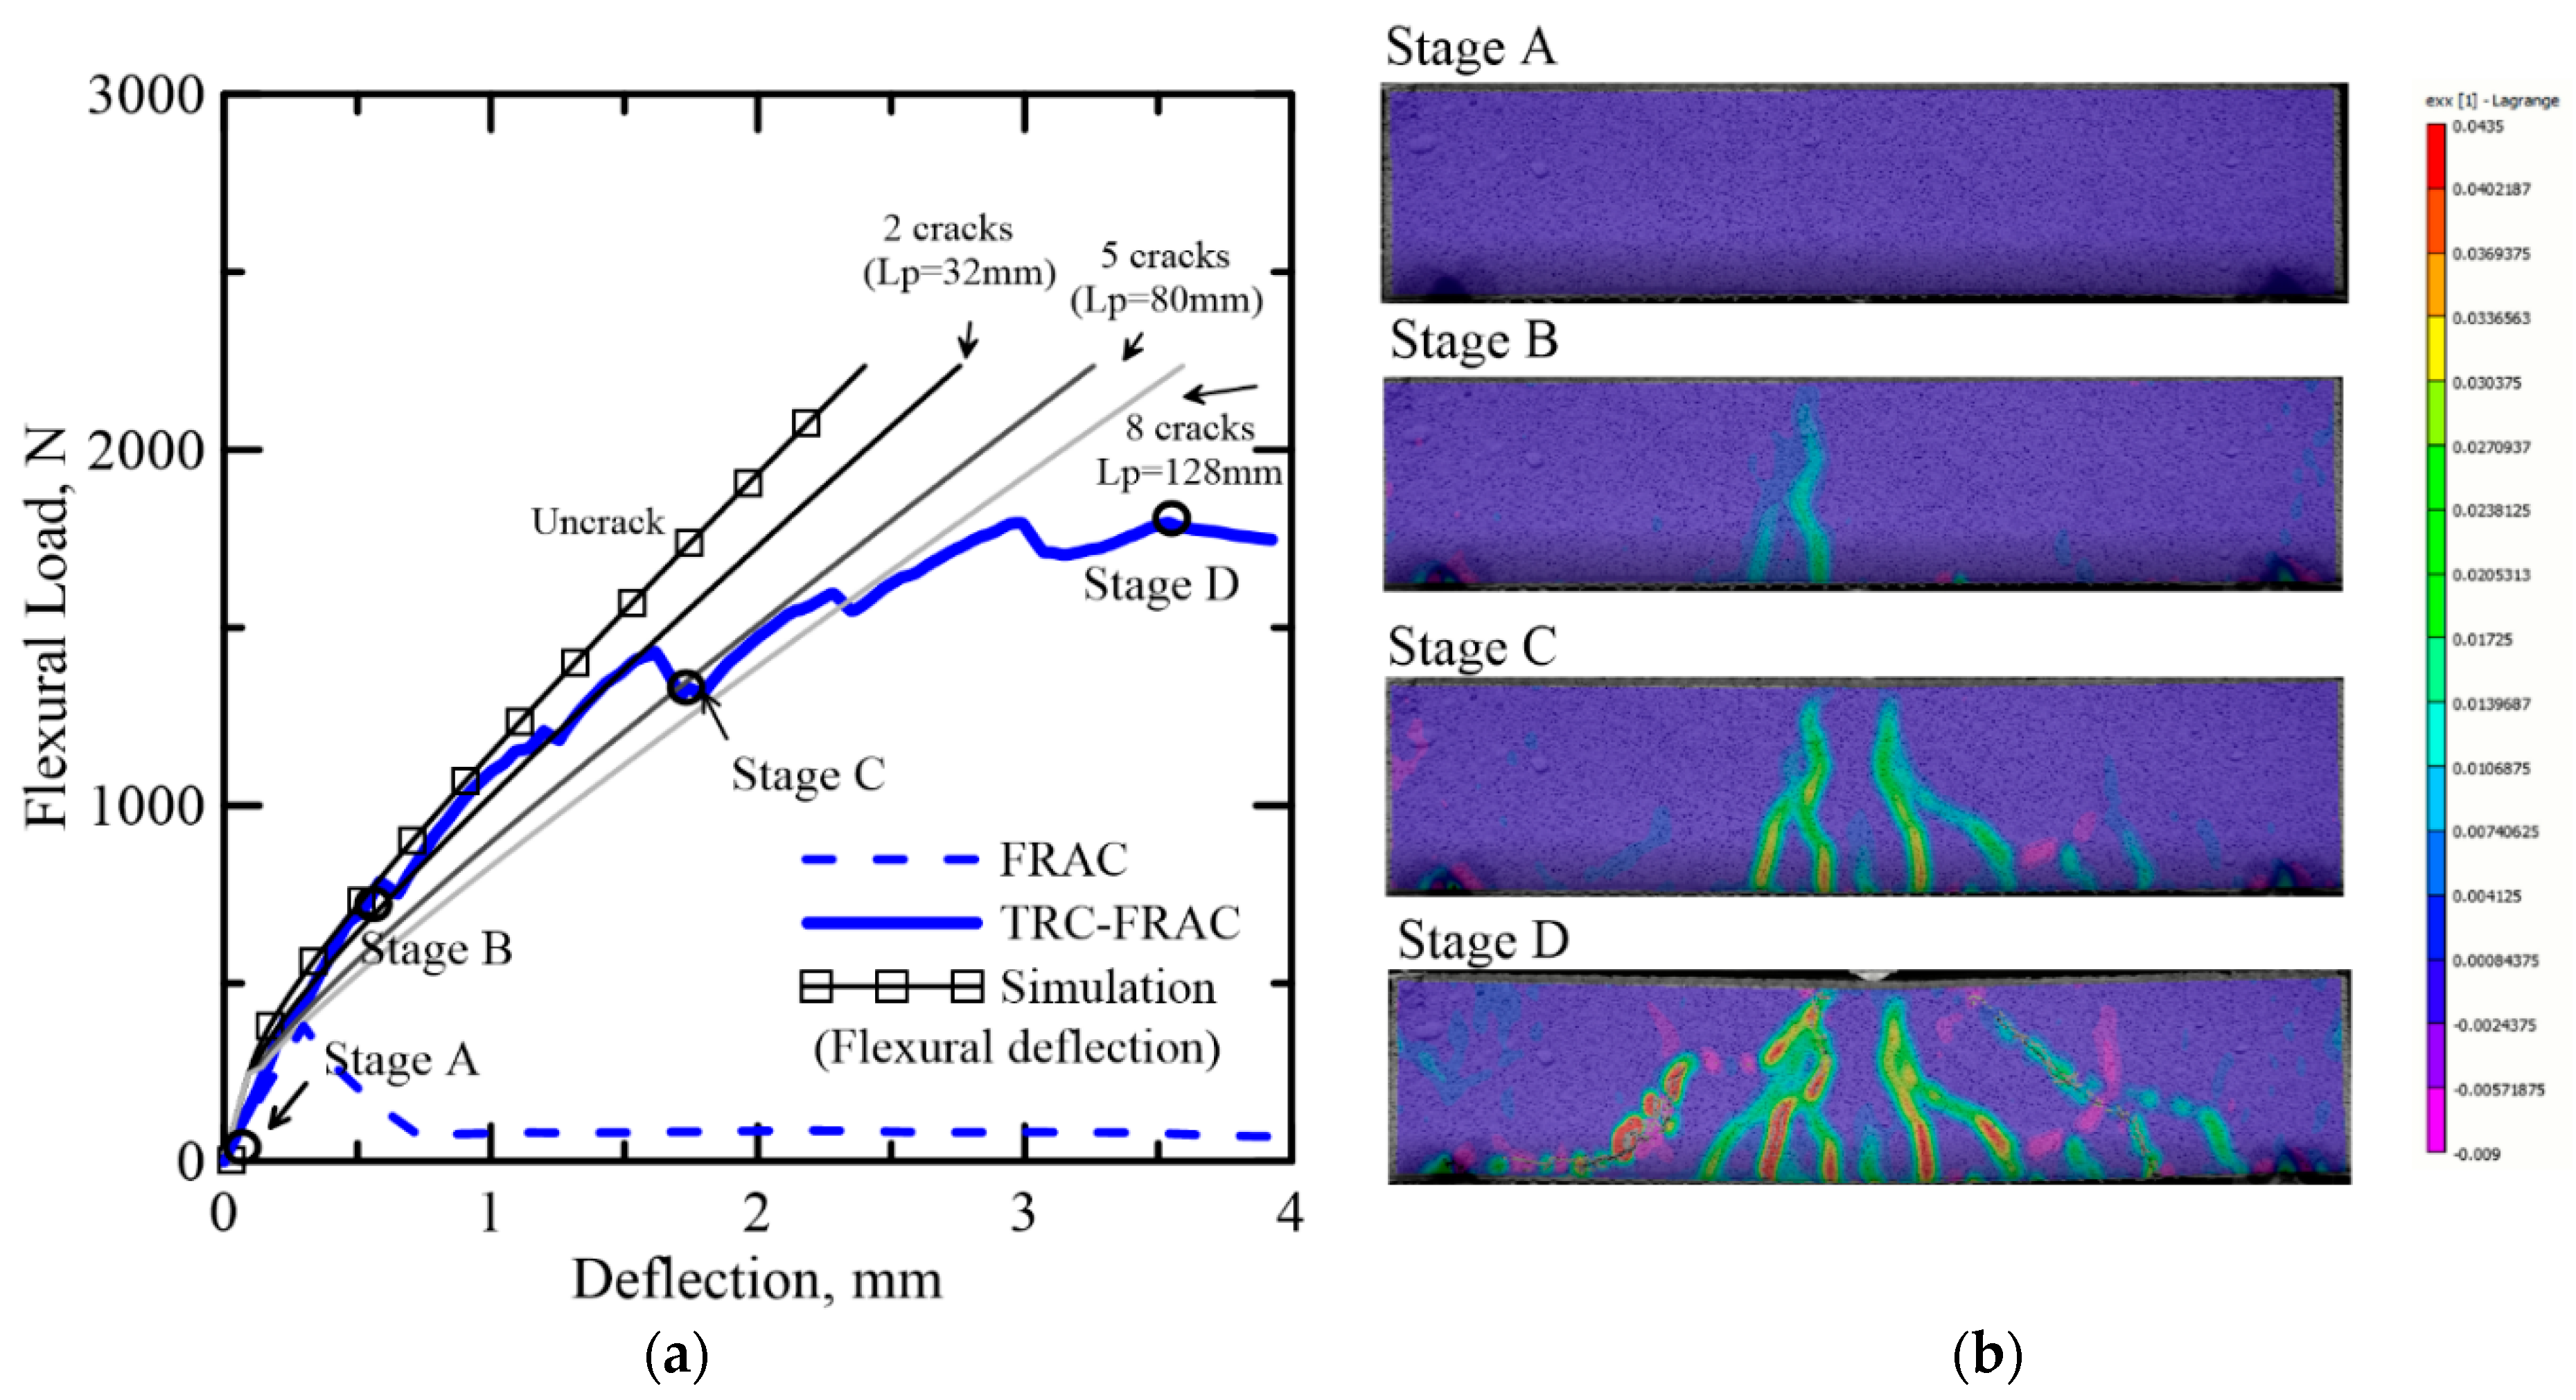
- The simulation of flexural response by the proposed model correlated with the DIC deflection measurements. The difference between the LVDT and DIC was due to three main parameters: (a) frequency response of the signals, (b) spurious deformation of the mechanical measurement of the displacement, and (c) differential displacement by DIC vs. global displacement by LVDT.
- The interaction of the material properties in terms of strain capacity and stiffness of each phase can be addressed by the parametric model and used for the optimization of the composite property.
- Simulation of the flexural response depends on the length of localization zone, which is used to match the sequence of cracking obtained from the DIC analysis.
- The shear failure criteria is an important aspect of the core failure mode.
Author Contributions
Funding
Institutional Review Board Statement
Informed Consent Statement
Data Availability Statement
Conflicts of Interest
References
- O’Hegarty, R.; Kinnane, O. Review of precast concrete sandwich panels and their innovations. Constr. Build. Mater. 2020, 233, 117145. [Google Scholar] [CrossRef]
- ACI 122R-02. Guide to Thermal Properties of Concrete and Masonry Systems; American Concrete Institute: Farmington Hills, MI, USA, 2002; pp. 1–21. [Google Scholar]
- Bonakdar, A.; Babbitt, F.; Mobasher, B. Physical and mechanical characterization of Fiber-Reinforced Aerated Concrete (FRAC). Cem. Concr. Compos. 2013, 38, 82–91. [Google Scholar] [CrossRef]
- Karakurt, C.; Kurama, H.; Topçu, I.B. Utilization of natural zeolite in aerated concrete production. Cem. Concr. Compos. 2010, 32, 1–8. [Google Scholar] [CrossRef]
- ASTM C-1693. Standard Specification for Precast Autoclaved Aerated Concrete (AAC) Wall Construction Units; ASTM International: West Conshohocken, PA, USA, 2009. [Google Scholar]
- Roels, S.; Sermijn, J.; Carmeliet, J. Modelling unsaturated moisture transport in autoclaved aereted concrete: A microstructural approach. In Proceedings of the 6th Nordic Symposium on Building Physics (NSB 2002), Trondheim, Norway, 17–19 June 2002. [Google Scholar]
- Budaiwi, I.M.; Abdou, A.; Al-Homoud, M. Variations of Thermal Conductivity of Insulation Materials Under Different Operating Temperatures: Impact on Envelope-Induced Cooling Load. J. Arch. Eng. 2002, 8, 125–132. [Google Scholar] [CrossRef]
- ACI 523.2R. Guide for Precast Cellular Concrete Floor, Roof, and Wall Units; American Concrete Institute: Farmington Hills, MI, USA, 1996. [Google Scholar]
- Yu, Q.L.; Spiesz, P.; Brouwers, H.J.H. Development of cement-based lightweight composites – Part 1: Mix design methodology and hardened properties. Cem. Concr. Compos. 2013, 44, 17–29. [Google Scholar] [CrossRef]
- Gibson, L.J.; Ashby, M.F. Cellular Solids; Cambridge University Press: Cambridge, UK, 1997; ISBN 9780521499118. [Google Scholar]
- Narayanan, N.; Ramamurthy, K. Structure and properties of aerated concrete: A review. Cem. Concr. Compos. 2000, 22, 321–329. [Google Scholar] [CrossRef]
- ACI 523.4R. Guide for Design and Construction with Autoclaved Aerated Concrete Panels; American Concrete Institute: Farmington Hills, MI, USA, 2009. [Google Scholar]
- Dey, V.; Bonakdar, A.; Mobasher, B. Low-velocity flexural impact response of fiber-reinforced aerated concrete. Cem. Concr. Compos. 2014, 49, 100–110. [Google Scholar] [CrossRef]
- Mobasher, B. Mechanics of Fiber and Textile Reinforced Cement Composites; Informa UK Limited: London, UK, 2011; p. 480. [Google Scholar]
- Alberti, M.G.; Enfedaque, A.; Gálvez, J.; Agrawal, V. Reliability of polyolefin fibre reinforced concrete beyond laboratory sizes and construction procedures. Compos. Struct. 2016, 140, 506–524. [Google Scholar] [CrossRef]
- Metelli, G.; Bettini, N.; Plizzari, G. Experimental and numerical studies on the behaviour of concrete sandwich panels. Eur. J. Environ. Civ. Eng. 2011, 15, 1465–1481. [Google Scholar] [CrossRef]
- Salmon, D.C.; Einea, A.; Tadros, M.K.; Culp, T.D. Full Scale Testing of Precast Concrete Sandwich Panels. ACI Struct. J. 1997, 94, 354–362. [Google Scholar]
- Shams, A.; Hegger, J.; Horstmann, M. An analytical model for sandwich panels made of textile-reinforced concrete. Constr. Build. Mater. 2014, 64, 451–459. [Google Scholar] [CrossRef]
- Vervloet, J.; Tysmans, T.; El Kadi, M.; De Munck, M.; Kapsalis, P.; Van Itterbeeck, P.; Wastiels, J.; Van Hemelrijck, D. Validation of a Numerical Bending Model for Sandwich Beams with Textile-Reinforced Cement Faces by Means of Digital Image Correlation. Appl. Sci. 2019, 9, 1253. [Google Scholar] [CrossRef]
- Cuypers, H.; Wastiels, J. Analysis and verification of the performance of sandwich panels with textile reinforced concrete faces. J. Sandw. Struct. Mater. 2011, 13, 589–603. [Google Scholar] [CrossRef]
- Cuypers, H.; Van Ackeren, J.; Belkassem, B.; Wastiels, J. Impact Resistance of Load Bearing Sandwich Elements with Textile Reinforced Concrete Faces. In Proceedings of the 13th European Conference on Composite Materials, KTH Royal Institute of Technology, Stockholm, Sweden, 2–5 June 2008. [Google Scholar]
- Colombo, I.G.; Colombo, M.; Di Prisco, M. Precast TRC sandwich panels for energy retrofitting of existing residential buildings: Full-scale testing and modelling. Mater. Struct. 2019, 52, 104. [Google Scholar] [CrossRef]
- Colombo, I.G.; Colombo, M.; Di Prisco, M. Bending behaviour of Textile Reinforced Concrete sandwich beams. Constr. Build. Mater. 2015, 95, 675–685. [Google Scholar] [CrossRef]
- Aveston, J. The Properties of Fibre Composites. In Conf. Proc. National Physical Laboratory; Paper I; IPC Science and Technology Press Ltd.: New York, NY, USA, 1971; p. 15. [Google Scholar]
- Aveston, J.; Kelly, A. Tensile first cracking strain and strength of hybrid composites and laminates. Philos. Trans. R. Soc. London. Ser. A Math. Phys. Sci. 1980, 294, 519–534. [Google Scholar] [CrossRef]
- Djamai, Z.I.; Bahrar, M.; Salvatore, F.; Larbi, A.S.; El Mankibi, M. Textile reinforced concrete multiscale mechanical modelling: Application to TRC sandwich panels. Finite Elements Anal. Des. 2017, 135, 22–35. [Google Scholar] [CrossRef]
- Turon, A.; Camanho, P.P.; Costa, J.; Dávila, C. A damage model for the simulation of delamination in advanced composites under variable-mode loading. Mech. Mater. 2006, 38, 1072–1089. [Google Scholar] [CrossRef]
- Wu, Y.; Wan, Y. The low-velocity impact and compression after impact (CAI) behavior of foam core sandwich panels with shape memory alloy hybrid face-sheets. Sci. Eng. Compos. Mater. 2019, 26, 517–530. [Google Scholar] [CrossRef]
- Fam, A.; Sharaf, T.; Sadeghian, P. Fiber Element Model of Sandwich Panels with Soft Cores and Composite Skins in Bending Considering Large Shear Deformations and Localized Skin Wrinkling. J. Eng. Mech. 2016, 142, 04016015. [Google Scholar] [CrossRef]
- Dey, V.; Zani, G.; Colombo, M.; Di Prisco, M.; Mobasher, B. Flexural impact response of textile-reinforced aerated concrete sandwich panels. Mater. Des. 2015, 86, 187–197. [Google Scholar] [CrossRef]
- Soranakom, C.; Mobasher, B. Modeling of tension stiffening in reinforced cement composites: Part I. Theoretical modeling. Mater. Struct. 2010, 43, 1217–1230. [Google Scholar] [CrossRef]
- Zhu, D.; Gencoglu, M.; Mobasher, B. Low velocity flexural impact behavior of AR glass fabric reinforced cement composites. Cem. Concr. Compos. 2009, 31, 379–387. [Google Scholar] [CrossRef]
- Sutton, M.; Wolters, W.; Peters, W.; Ranson, W.; McNeill, S. Determination of displacements using an improved digital correlation method. Image Vis. Comput. 1983, 1, 133–139. [Google Scholar] [CrossRef]
- Bruck, H.A.; McNeill, S.R.; Sutton, M.A.; Peters, W.H. Digital image correlation using Newton-Raphson method of partial differential correction. Exp. Mech. 1989, 29, 261–267. [Google Scholar] [CrossRef]
- Koerber, H.; Xavier, J.; Camanho, P. High strain rate characterisation of unidirectional carbon-epoxy IM7-8552 in transverse compression and in-plane shear using digital image correlation. Mech. Mater. 2010, 42, 1004–1019. [Google Scholar] [CrossRef]
- Dias-Da-Costa, D.; Valença, J.M.D.A.; Carmo, R.D. Curvature assessment of reinforced concrete beams using photogrammetric techniques. Mater. Struct. 2013, 47, 1745–1760. [Google Scholar] [CrossRef]
- Gao, G.; Huang, S.; Xia, K.; Li, Z. Application of Digital Image Correlation (DIC) in Dynamic Notched Semi-Circular Bend (NSCB) Tests. Exp. Mech. 2015, 55, 95–104. [Google Scholar] [CrossRef]
- Destrebecq, J.-F.; Toussaint, E.; Ferrier, E. Analysis of Cracks and Deformations in a Full Scale Reinforced Concrete Beam Using a Digital Image Correlation Technique. Exp. Mech. 2010, 51, 879–890. [Google Scholar] [CrossRef]
- Shams, A.; Horstmann, M.; Hegger, J. Experimental investigations on Textile-Reinforced Concrete (TRC) sandwich sections. Compos. Struct. 2014, 118, 643–653. [Google Scholar] [CrossRef]
- Mobasher, B.; Peled, A.; Pahilajani, J. Distributed cracking and stiffness degradation in fabric-cement composites. Mater. Struct. 2006, 39, 317–331. [Google Scholar] [CrossRef]
- Soranakom, C.; Mobasher, B. Closed-Form Solutions for Flexural Response of Fiber-Reinforced Concrete Beams. J. Eng. Mech. 2007, 133, 933–941. [Google Scholar] [CrossRef]
- Pleesudjai, C. Generalized Modeling and Experimental Validation of Flexural Response in Cement Based Composites; Arizona State University: Tempe, AZ, USA, 2021. [Google Scholar]
- Yao, Y.; Aswani, K.; Wang, X.; Mobasher, B. Analytical displacement solutions for statically determinate beams based on a trilinear moment–curvature model. Struct. Concr. 2018, 19, 1619–1632. [Google Scholar] [CrossRef]
- Soranakom, C.; Mobasher, B. Correlation of tensile and flexural responses of strain softening and strain hardening cement composites. Cem. Concr. Compos. 2008, 30, 465–477. [Google Scholar] [CrossRef]
- Mobasher, B.; Bakhshi, M.; Barsby, C. Backcalculation of residual tensile strength of regular and high performance fiber reinforced concrete from flexural tests. Constr. Build. Mater. 2014, 70, 243–253. [Google Scholar] [CrossRef]
- Mantari, J.; Oktem, A.S.; Soares, C.G. A new higher order shear deformation theory for sandwich and composite laminated plates. Compos. Part B: Eng. 2012, 43, 1489–1499. [Google Scholar] [CrossRef]
- Lee, J.-H.; Kang, S.-H.; Ha, Y.-J.; Hong, S.-G. Structural Behavior of Durable Composite Sandwich Panels with High Performance Expanded Polystyrene Concrete. Int. J. Concr. Struct. Mater. 2018, 12, 21. [Google Scholar] [CrossRef]
- Di Prisco, M.; Plizzari, G.; Vandewalle, L. Fibre reinforced concrete: New design perspectives. Mater. Struct. 2009, 42, 1261–1281. [Google Scholar] [CrossRef]
- Ulzurrun, G.; Zanuy, C. Flexural response of SFRC under impact loading. Constr. Build. Mater. 2017, 134, 397–411. [Google Scholar] [CrossRef]
- Suaris, W.; Shah, S.P. Strain-rate effects in fibre-reinforced concrete subjected to impact and impulsive loading. Composites 1982, 13, 153–159. [Google Scholar] [CrossRef]


| Designation | Skin | Core Material | Dimensions, mm |
|---|---|---|---|
| TRC-FRAC | 2-ARG | FRAC |
|
| TRC-AAC | 2-ARG | AAC |
|
| ID | Drop Height | Potential Energy [39] | Strain Rate [39] | Max Impact Force | Flexural Strength | Deflection at Max Force | Max Deflection | Toughness |
|---|---|---|---|---|---|---|---|---|
| mm | J | sec−1 | N | MPa | mm | mm | J | |
| TRC-AAC-A | 75 | 10.4 | 5 | 1690 | 7.2 | 1.52 | 12.8 | 8.77 |
| 150 | 20.9 | 1 | 2117 | 9.3 | 3.96 | 14.42 | 25.82 | |
| TRC-FRAC-A | 75 | 10.4 | 0.6 | 1946 | 8.1 | 1.12 | 9.89 | 9.75 |
| 150 | 20.9 | 18 | 1653 | 6.7 | 0.77 | 19.3 | 16.95 | |
| TRC-AAC-B | 75 | 10.4 | 0.1 | 2363 | 2.5 | 1.88 | 1.90 | 3.22 |
| 150 | 20.9 | 0.7 | 3213 | 3.7 | 3.86 | 4.05 | 8.26 | |
| 300 | 41.8 | 3.1 | 3112 | 3.5 | 5.20 | 7.85 | 19.3 | |
| TRC-FRAC-B | 75 | 10.4 | 0.2 | 2137 | 2.3 | 1.03 | 2.52 | 4.51 |
| 150 | 20.9 | 0.5 | 2886 | 3.2 | 3.15 | 3.27 | 6.87 | |
| 300 | 41.8 | 3.0 | 3442 | 3.9 | 6.05 | 8.02 | 20.6 |
| a | ||||||||||||||
|---|---|---|---|---|---|---|---|---|---|---|---|---|---|---|
| Core | E MPa | εcr με | μ | βult | γcc | ωcc,1 | ||||||||
| AAC | 108 | 1040 | 0 | 30 | 64 | 0.8 | ||||||||
| FRAC | 108 | 1040 | 1 | 30 | 48 | 0.6 | ||||||||
| b | ||||||||||||||
| γts | βts,1 | βts,2 | βts,ult | ηts,1 | ηts,2 | γcs | ωcs,1 | ηcs,1 | ||||||
| 17 | 1.2 | 1.2 | 24 | 1 | 0.46 | 17 | 1.2 | 0.46 | ||||||
| Ets MPa | εts,1 με | εts,2 με | εts,ult με | Ets,1 MPa | Ets,2 MPa | Ecs MPa | Εcs,1 με | Ecs,1 MPa | ||||||
| 1885 | 1264 | 1264 | 25,000 | 1885 | 868 | 1885 | 1264 | 868 | ||||||
| Ref. Data | Tensile Parameters | Maximum Tensile Strength (MPa) | Tensile Toughness (MPa × 10−3) | |||
|---|---|---|---|---|---|---|
| E (MPa) | εcr (με) | μ | βtu | |||
| TRC-AAC | ||||||
| Drop height 75 mm | 162 | 2080 | 0 | 24 | 0.34 | 3.2 |
| Drop height 150 mm | 148 | 2080 | 0 | 43 | 0.31 | 8.0 |
| Drop height 300 mm | 148 | 2080 | 0 | 63 | 0.31 | 10.0 |
| TRC-FRAC | ||||||
| Drop height 75 mm | 162 | 2080 | 0.33 | 30 | 0.33 | 15.8 |
| Drop height 150 mm | 175 | 2080 | 0.33 | 40 | 0.36 | 20.7 |
| Drop height 300 mm | 202 | 2080 | 0.33 | 50 | 0.42 | 29.8 |
Publisher’s Note: MDPI stays neutral with regard to jurisdictional claims in published maps and institutional affiliations. |
© 2021 by the authors. Licensee MDPI, Basel, Switzerland. This article is an open access article distributed under the terms and conditions of the Creative Commons Attribution (CC BY) license (http://creativecommons.org/licenses/by/4.0/).
Share and Cite
Pleesudjai, C.; Li, A.; Dey, V.; Mobasher, B. Low-Velocity Impact Experiments and Modeling of TRC Skin-Aerated Concrete Core Sandwich Composites. Materials 2021, 14, 390. https://doi.org/10.3390/ma14020390
Pleesudjai C, Li A, Dey V, Mobasher B. Low-Velocity Impact Experiments and Modeling of TRC Skin-Aerated Concrete Core Sandwich Composites. Materials. 2021; 14(2):390. https://doi.org/10.3390/ma14020390
Chicago/Turabian StylePleesudjai, Chidchanok, Anling Li, Vikram Dey, and Barzin Mobasher. 2021. "Low-Velocity Impact Experiments and Modeling of TRC Skin-Aerated Concrete Core Sandwich Composites" Materials 14, no. 2: 390. https://doi.org/10.3390/ma14020390
APA StylePleesudjai, C., Li, A., Dey, V., & Mobasher, B. (2021). Low-Velocity Impact Experiments and Modeling of TRC Skin-Aerated Concrete Core Sandwich Composites. Materials, 14(2), 390. https://doi.org/10.3390/ma14020390