Abstract
With the premise of investigating mechanical properties, the thermal conductivity of autoclaved aerated concrete (AAC) is a key index of self-insulation block walls for building energy conservation. This study focused on the effect of pore structures on the mechanical performance and thermal conductivity of AAC with the comparison of AAC base materials. Different kinds of AAC and their base materials were prepared and experimentally investigated. While maintaining a consistent mix proportion of the AAC base material, the pore structure of AAC was changed by the dosage of aluminum power/paste, foam stabilizer, and varying the stirring time of aluminum paste. The steam curing systems of AAC and the base material were determined based on SEM (Scanning Electronic Microscopy) and XRD (X-ray Diffraction) tests. With almost the same apparent density, the pore size decreased with the increasing content of foam stabilizer, and the mixing time of aluminum paste and foam stabilizer has a great influence on pore size. The thermal conductivity test and compressive test results indicated that that pore size had an effect on the thermal conductivity, but it had little effect on the compressive strength, and the thermal conductivity of sand aeration AAC was 8.3% higher than that of fly ash aeration AAC; the compressive strength was 10.4% higher, too. With almost the same apparent density, the regression mathematical model indicates that the thermal conductivity of AAC increased gradually with the increase of pore size, but it had little effect on the compressive strength. From the test results of basic mechanical properties, the mechanical model of cubic compressive strength, elastic modulus, axial compressive strength, and splitting tensile strength was obtained. The proposed stress–strain relationship model could well describe the relationship of AAC and the base material at the rising section of the curve.
1. Introduction
As an energy-saving building material with good performances of lightweight and thermal insulation, autoclaved aerated concrete (AAC) has been widely used in building structures as the filling walls or the load-bearing walls [1,2,3,4]. With a premise of required strength and density, AAC should be produced with lowest thermal conductivity to be used as the enveloped self-insulation block walls [4,5,6,7].
AAC is a kind of two-phase porous material composed of continuous solid phase (cement matrix) and discrete gas phase (air pore). The pores in aerated concrete are composed of macro pores and micro pores. The macro pores are formed by the gas overflow after the addition of the gas generation agent; the shape is spherical or nearly spherical, and the pore diameter is basically among 0.5–2 mm. In the range of a few tenths of a millimeter to a few millimeters, the micro pores exist in the wall of the macro pores. The porosity of AAC is generally 70–80%, in which the porosity caused by hydrogen generated by the chemical reaction of aluminum paste in alkali solution accounts for about 45–55%, which is macro porosity; the capillary left by water evaporation accounts for about 20–40%. For AAC, the macro pores are bigger and there are many more than the ordinary concrete, which has a great influence on the strength and thermal conductivity of concrete [8,9].
It is known that the thermal performance of AAC relates to the porosity: the larger the porosity, the lower the thermal conductivity, which is greatly affected by the addition of an Al component, because the air pore is mainly made of aluminum powder [7,8,9,10,11,12,13,14]. By using Al powder, Al paste and highly dispersed Al particles, different pore shapes of AAC can be generated. Some researchers used industrial waste instead of aluminum powder as a gas generation agent [15,16], which was aluminum waste or municipal solid waste incineration bottom ash. The gas generation mechanism was similar to aluminum powder, but the AAC density was relatively big, which was just as an exploratory study of aluminum powder replacement. Esmaily [17] used alkali-activated slag in the place of usual cementitious materials in the production of AAC. The substitution altered the autoclave curing stage by steam curing in the AAC production process, and since the AAC density was big, the thermal conductivity would be large. However, with the same volume density, no research has examined the effect of aeration methods on the pore shape of AAC nor the effect of pore structure on the thermal conductivity of AAC. Except the mathematical analysis made by Li [18] to investigate the effect of pore form on the thermal conductivity of AAC, less attention was paid to the effect of pore structure characterized by diameter, size, and distribution [19], which limits the technical development of AAC with ideal thermal insulation.
To intensively study the forming mechanisms of the pores and the heat transfer characteristics of AAC, researches on the base material is valuable, which consists of the hydration products made of the same mix proportion of AAC without the addition of an aerating agent. The base materials and AAC with different dosages of cement, lime, water, and sand were experimentally studied without considering the autoclaved curing in the manufacturing process by Richard [20]. Chalermphan [21] presented the base material mixes cured in water and air for 3, 7, and 28 days. Chen [22] has pointed out that high steam pressure curing can significantly reduce the reaction time and obtain products with high compressive strength. Isu [23] pointed out that the content of quartz in sand was directly proportional to the strength of AAC due to the higher reaction of quartz with calcium oxide.
At present, the research results showed that the porosity has a great influence on the strength of AAC, but the influence of pore size and pore shape on the strength is generally not considered. For ordinary concrete, some researchers have also studied the influence of pore size distribution and pore morphology on the strength [24,25], but all of them focused on the study of cementitious pores or capillary pores; macro pores were not mentioned.
From the perspective of micro size, the composition of porous concrete is mainly its macro pore structure and pore wall. The thermal and mechanical performance of porous concrete can be affected by the pore size, pore distribution, pore shape, and the connectivity of pores. Commonly used thermal conductivity models include the parallel series model, Maxwell Eucken model, effective medium theory model, Levy model, etc. These models can calculate the effective thermal conductivity of porous concrete by using the thermal conductivity of two phases in porous concrete, i.e., cement aggregate and air phase, and the corresponding volume fraction, but they could not provide information about the pore structure of porous concrete nor accurately predict the thermal conductivity of porous concrete [26].
In this paper, the AAC and the base material with different mix proportions were produced. AAC with different pore sizes but the same porosity was produced by changing the content of foam stabilizer and the stirring time of aluminum paste. The porosity and pore size of AAC were characterized by SEM testing, XRD (X-ray Diffraction) testing, and Lee’s Bottle Method test methods. The compositions of crystal were observed by XRD. The thermal conductivity of AAC and the base materials with different grades and pores were tested; then, the relationship between the porosity/thermal conductivity and the apparent density was obtained, and the relationship between the pore diameter and thermal conductivity was obtained. At last, the basic mechanic properties were tested, such as cubic strength, axial compressive strength, elastic modulus, splitting tensile strength, and flexural strength. As a series of studies, for comparative analysis, the macroscopic mechanical properties and thermal conductivity of AAC and its masonry were studied in Ref. [27].
2. Specimens Preparation
2.1. Constituent Materials
The raw materials of AAC base material—including sand, fly ash, cement, lime, gypsum, and water—the composition of AAC, and the base materials are shown in Table 1. The aluminum paste and foam stabilizer were used for AAC. Yellow River sand was used for B04 AAC and the base material, which was grinded with a cylindrical ball mill and sieved, passing a mesh of 0.075 mm with the residue of 14.3%. Quartz sand was used for B06S AAC and the base material, because quartz sand for AAC had higher purity and strength, which passed through a mesh of 0.075 mm with the residue of 18.1%.

Table 1.
Composition of autoclaved aerated concrete (AAC) and base materials.
The main function of fly ash in AAC is to provide SiO2 and Al2O3, which plays an important role in the static stopping process. The fly ash used in this paper was produced by Guodian Xingyang Coal Electricity Integration Co., Ltd., Zhengzhou, China. After being sieved by a mesh of 0.075 mm, the residue was 14.3%, and the ignition loss was 3.1%.
Cement is the main calcareous material in AAC. Grade 42.5 ordinary silicate cement was used in this paper; after being sieved by a mesh of 0.08 mm, the residue was 2.3%. The cement was produced by Cement Plant of China Great Wall Aluminum Co., Ltd., Zhengzhou, China.
Lime is the main calcareous material in AAC and mainly provides the effective calcium oxide. It reacted with SiO2 and Al2O3 in siliceous materials under hydrothermal conditions to form hydrated calcium silicate and then built the strength of AAC. At the same time, the alkaline environment due to lime hydration also provides the condition of gas generation for aluminum paste. The reaction formula is:
Lime hydration gives off a lot of heat, which provides a heat source for AAC slurry to guarantee the fully aeration of aluminum paste and raises the body temperature up to 80–90 °C during the hardening stage to promote the rapid increase of strength. However, the hydration reaction of lime increases the volume by about 44%, and the expansion of lime volume mainly occurs within 30 min after the beginning of hydration. During this period, if the control is improper, the green body with certain strength will lose plasticity, crack, and even be destroyed In this study, the material was passed through a mesh of 0.075 mm with a residual of 11.7%, the lime hydration time was 16 min with a temperature of 81.5 °C, and the effective calcium content was 72.5%.
Desulfurized gypsum used in the test was provided by Guodian Xingyang Coal Electricity Integration Co., Ltd., Zhengzhou, China. The main functions of gypsum in AAC are to regulate the aeration process by participating in the hydrothermal reaction, provide the strength, reduce the shrinkage, and improve the frost resistance of AAC.
In an alkaline environment, aluminum paste can react with water continuously to generate hydrogen until the aluminum paste runs out. In AAC, the alkaline environment is provided by Ca(OH)2. The reaction formula can be written as:
As a gas generator for AAC, aluminum paste has advantages of less dust, non-static electricity, anti-humidity, and a certain diameter role in stabilizing the pores; in comparison, dry aluminum powder produces more gas and smaller pore size. For ordinary AAC, aluminum paste was usually used in the production, and the aluminum paste used in this study was market-supplied, the solid content was 65%, the fineness was 8.94%, and the gas generation time was 17 min.
A surface-active foam stabilizer is used to reduce the surface tension of liquid water and increase the mechanical strength of the pore wall. It is the soluble oil made up of water, triethanolamine, and oleic acid in the ratio of 3.6:3:1 at room temperature. When aluminum paste releases hydrogen in slurry, the bubbles are wrapped by liquid film, and a large number of new surfaces are added to the system. Due to the extremely unstable system, the bubbles can be easily broken down; increasing the mechanical strength of the bubble film can prevent bubble rupture.
2.2. Preparation of Base Materials
Table 2 presents the mix proportions of one liter of AAC base materials. The dosages of sand, fly ash, cement, lime, gypsum, and water were changed to make different AAC base materials.
Table 2.
Mixing proportion of raw materials of AAC base material.
Since the static stop stage will directly affect the hardening degree of the green base material [28,29], three different autoclave curing systems were used for base materials to find the most suitable autoclave curing system.
The first kind of autoclave curing system adopted the same static stop and autoclave system as the AAC; that is, when the slurry had a certain strength after stopping in the grinding tool for 3 h, it was put into the autoclave for curing. The pressure in the autoclave was 1 MPa, the temperature was 185 °C, and the autoclave curing time was 9 h. The test block was found to be cracked after leaving the barrel. The reason was that the base material was different from the AAC, which had a large number of pores on the surface, and the base material was denser than the AAC. When the high-pressure steam entered the interior of the base material, the internal air flow was not smooth, and the strength of the base material was low at this time, which was not enough to resist the pressure of the steam, so it eventually led to the cracking of the base material.
The second kind of autoclave system injected the stirred slurry into the mold and then cured it for 7 days naturally. After it had a certain strength, it was put into the autoclave for curing. The pressure in the autoclave was 1 MPa, the temperature was 185 °C, and the curing time was 9 h. It was found that cracks still existed on the surface of the base material after leaving the mold, but compared with the test block made by the first autoclave curing system, the cracks of the tested block were mostly small cracks. The reason was that in addition to providing calcareous materials and an alkaline environment, the lime in the raw materials would react with water to release a lot of heat and cause the slurry expansion. Although lime was conducive to the gas generation of aluminum powder/paste and the forming of a green body, the base material did not need the gas generation; the reaction of lime and water made the internal temperature rise and caused the volume expansion of the base material in the state of natural curing, leading to a large number of small cracks in the base material before autoclave curing. Finally, it led to the cracks of the base material after leaving the mold.
In the third type of autoclave maintenance system, the lime hydration was completed by mixing with water for 30 min, and the calcium hydroxide slurry was admixed. After that, other materials were evenly mixed. The stirred slurry was injected into the mold and cured naturally for 7 days to get a certain strength for further autoclave curing in the autoclave. The pressure in the autoclave was 1.0 MPa, the temperature was 185 °C, and the curing time was 9 h. No cracks were found on the surface of the base material test block after leaving the mold.
Finally, the third base material maintenance system was adopted in this paper.
2.3. Preparation of AAC
Based on the mix proportion of AAC base materials, the aluminum paste and foam stabilizer were admixed for AAC. Table 3 presents the mix proportions for one liter of AAC slurry. Considering the effect of AAC density on thermal conductivity, the amount of aluminum paste was different in B05 and B06FA AAC. To ensure the pore integrity of B05 AAC, a certain amount of foam stabilizer was added. To investigate the influence of material composition on thermal conductivity, B06FA fly ash AAC and B06S quartz sand AAC were tested, respectively. In order to study the effect of pores on AAC, based on the repeated tests, for B04 AAC, the dosage of foam stabilizer was changed, and the stirring time after pouring uniform aluminum paste into the slurry was selected as 10, 20, 30, 40, and 50 s, respectively. In order to produce more gas and create a smaller pore size in AAC, dry aluminum powder was used in this study. The required aluminum paste was 48 g for 60 L B04 AAC; replacing the gas generator with dry aluminum powder, only 28 g was needed. This is due to the more than 98% content of metal aluminum and 89% content of active aluminum in dry aluminum powder compared to 70% content of metal aluminum and 85% content of active aluminum in aluminum paste [30], so the content of metal aluminum and active aluminum in aluminum powder is higher than that in aluminum paste.
Table 3.
Mixing proportion of raw materials of AAC.
In the main autoclave maintenance system of AAC, the static stopping time of slurry was about 3 h, the pressure in the autoclave was 1.0 MPa, the temperature was 185 °C, and the curing time was 9 h.
3. Test Methods
3.1. Pore Structure and Composition
XRD test: The powder samples (particle size ≤ 20 μm) of AAC and base materials were tested by Smartlab9 intelligent X-ray diffractometer of Tokyo, Japan.
SEM test: The sample size was 1 cm × 1 cm × 0.5 cm, which was measured by the FEI Inspect F50 field emission electron scanning microscope (FESEM), Portland, Oregon, USA.
3.2. Porosity
Apparent density and real density were measured in this test. Apparent density was measured with a ruler, the volume of the specimens was obtained, and then the mass of the specimens was accurately weighed; the apparent density was the mass divided by the volume.
The real density test steps in this paper were determined with reference to the method described in the Chinese standard GB/T208-2014 [31]. The AAC specimens were ground into powder (particle size less than 0.2 mm) and baked in an oven at 105 °C until constant weight. Then, the real densities of four kinds of AAC and base materials were measured by 25 mL of Lee’s bottle. The porosity is calculated by Equation (3).
where P is porosity, ρ is true density, and ρ0 is apparent density.
3.3. Thermal Conductivity
The thermal conductivity was determined in accordance with the Chinese standard GB/T10294 [32]. The test AAC specimen size was 300 mm × 300 mm × 33 mm, and there were three test pieces in each group. The test equipment was a IM-DRY3001-I thermal conductivity tester manufactured by The Impal Measurement and Control Equipment Co., Ltd., Tianjin, China.
3.4. Basic Mechanical Property
The mechanical properties were tested in accordance with the Chinese standard GB11969 [33]. The base material is prepared in the molds with dimension of 100 mm × 100 mm × 100 mm, 100 mm × 100 mm × 300 mm and 100 mm × 100 mm × 400 mm. The AAC specimens were dry sawed by machine from the finished products as presented in Figure 1, and a Mj45t push table band saw produced by Jinan nasno Industrial Test System Co., Ltd. Jinan, China was used.
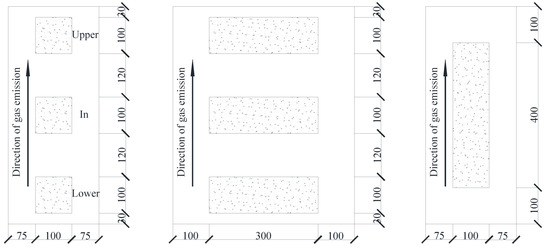
Figure 1.
Sawing diagram of AAC specimen. (Units in mm).
The blocks with dimensions of 100 mm × 100 mm × 100 mm were tested for cubic compressive strength and splitting tensile strength. Those with dimensions of 100 mm × 100 mm × 300 mm were tested for axial compressive strength and modulus of elasticity. Those with dimensions of 100 mm × 100 mm × 400 mm were tested for flexural strength. There were three test specimens in each group.
All the mechanical tests were performed on the same machine. For the tests of elastic modulus, the micrometers with accuracy of 0.001 mm were used to measure the compressive deformation, as presented in Figure 2. The measured elastic modulus of AAC and the base material refers to the secant modulus of loading when the stress is 40% of the axial compressive strength.
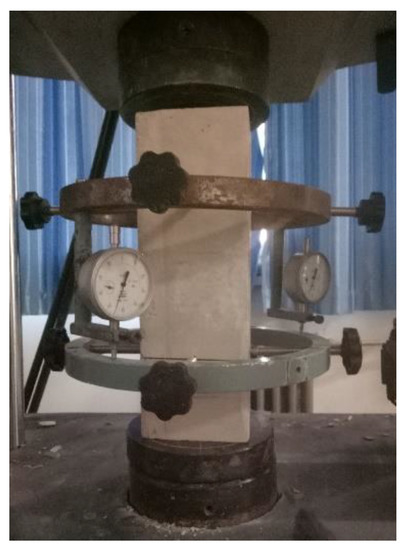
Figure 2.
Elastic modulus test of prism.
The splitting tensile strength test device is shown in Figure 3. The flexural strength loading device is shown in Figure 4. In both of these tests, the load was applied continuously at the speed of 0.20 ± 0.05 kN/s until the specimen was damaged.

Figure 3.
Test device of splitting tensile strength.

Figure 4.
Flexural strength loading device. (Units in mm).
4. Pore Structures
4.1. Compositions Observed by SEM and XRD
The SEM images of B04, B05, B06FA, and B06S AAC are shown in Figure 5. In the figure, the form and strength of hydration products of AAC with different mix proportion are compared. It can be seen that tobermorite in B04 AAC was mainly needle-like, mainly lapped together, about 1–2 μm long, with less hydration products, more pores, and the lowest strength; tobermorite in B05 and B06FA AAC was willow-like, 1 μm wide, and 2–3 μm long, and the crystal form of the hydration product was well developed. Compared with B04 AAC, there were more hydration products in B05 AAC; the hydration products of B06FA were interlaced to form a whole body with relatively high strength. Tobermorite in B06S AAC was sheet-like and about 2 μm long, the hydration products were cross-linked with each other, forming a dense network structure with the highest mechanical strength.
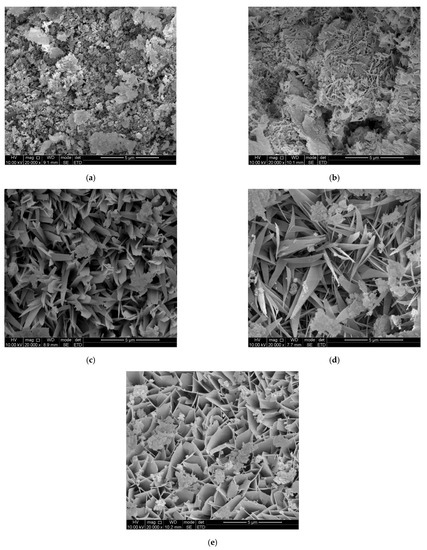
Figure 5.
Hydration products of AAC and base material: (a) base material; (b) B04 AAC; (c) B05 AAC; (d) B06FA AAC; (e) B06S AAC.
From the XRD analysis of B04, B05, B06FA, and B06S AAC, quartz, tobermorite, hydrated garnet, and C-S-H were found in the base material, which were basically consistent with the crystals in AAC (Figure 6). Therefore, the hydration of the base material had been completed, and the autoclave maintenance system of the base material was reasonable. For four groups of AAC, the mix ratio was different, the hydration products produced were different, but the same mix ratio of the AAC and base material was almost the same. The hydration products of B04, B06S AAC, and the base material were mainly tobermorite and C-S-H gel. In addition to the hydration products, there was a lot of SiO2 in the crystal phase. As a result of the presence of fly ash in the mix proportion, B05, B06FA, and the FA base material were mainly composed of tobermorite, hydrated garnet, and C-S-H gel and SiO2; the tobermorite and hydrated garnet had higher content than the C-S-H gel.

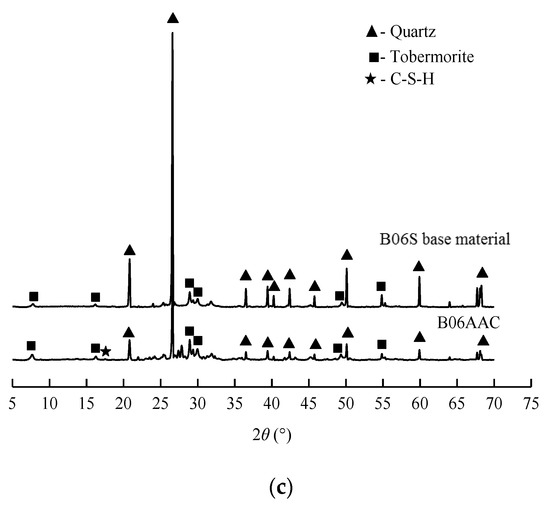
Figure 6.
XRD (X-ray Diffraction) diffraction spectrum of AAC and base material: (a) B04 AAC and base material; (b) B05 and B06FA AAC and base material; (c) B06S AAC and base material.
4.2. Effect of Foam Stabilizer Content and Stirring Time on Pore Size
For B04 AAC, through the binarization method of AAC cross-section images, the matrix information of binary image in MATLAB was imported into Excel by using the command xlswrite(). In the Excel table, a cell represented a pixel, when the median value of the cell was 0, it represented pores, and the value of 1 represented a pore wall. The number of 0s was counted, and the porosity could be calculated. Then, VBA (Visual Basic for Applications) in Excel was used to write the macro, which could realize the one key operation when calculating the area information of a single pore. So, the pore size and quantity of the AAC surface were counted [34].
The average diameter size of each sample is presented in Table 4 and Table 5. The pore diameter is the weighted average of the pore diameter and number, which can be calculated by Equation (4).
where Di is the pore diameter, N is the number of the pores in 20 mm × 20 mm area section of AAC, and Deq is the average pore diameter.
Table 4.
Relationship between pores size, thermal conductivity, and compressive strength affected by foam stabilizer.
Table 5.
Relationship between pore size, thermal conductivity, and compressive strength affected by stirring time.
The test results show that the amount of foam stabilizer is inversely proportional to the pore diameter of AAC. This is due to the gradually expanded air foams generated by aluminum powder/paste with the increase of temperature caused by lime hydration. The foam stabilizer could alleviate the expansion of the air bubbles to a certain extent and ultimately reduce the pore size [35]. When the aluminum powder/paste was poured into the slurry, the pore size decreased with the increase of stirring time. The non-uniform presence of aluminum powder/paste in the slurry due to shorter stirring time would affect the final pore size. However, the stirring time should not be too long, nor will the aluminum powder/paste form pores after gas generation, which would lead to insufficient gas generation and increase the apparent density. From Figure 7 and Figure 8, the pore size distribution by controlling the amount of foam stabilizer is more effective than by stirring time.

Figure 7.
Influence of foam stabilizer content on pore diameter.

Figure 8.
Influence of stirring time on pore diameter.
From Table 5, aluminum powder instead of aluminum paste has no obvious effect on the performance of pores, but in the process of gas generation, it is found that the stirring time required for aluminum powder gas generation is shorter, and the reaction is more intense.
4.3. Porosity
The test results of porosity are shown in Table 6, which shows that the porosity of AAC increases with the decrease of apparent density. The base material also contains a certain amount of small pores. The porosity of AAC has exceeded 70%, and the porosity of the base material has exceeded 50%.
Table 6.
Test results of porosity of AAC and base material.
5. Thermal Conductivity Affected by Pores
5.1. Affected by Porosity and Apparent Density
By thermal conductivity test of the base material, the thermal conductivity of the B04 base material was 0.2358 W/(m·K), that of the B05 and B06FA base material was 0.2506 W/(m·K), and that of the B06S base material was 0.3102 W/(m·K).
The thermal conductivity and compressive strength of the AAC are presented in Table 7. With almost the same apparent density and porosity, the thermal conductivity of sand aeration AAC is 8.3% higher than that of fly ash aeration AAC, and the compressive strength is 10.4% higher, too. It is possible that the strength of sand aeration AAC is higher than that of fly ash hydration products, which leads to the higher strength of sand aeration AAC; meanwhile, the strength of sand is denser than that of fly ash hydration products, resulting in a high thermal conductivity of sand aeration AAC.
Table 7.
Thermal conductivity and compressive strength of AAC.
The relationships of thermal conductivity with apparent density and porosity of AAC are presented in Figure 9 and Figure 10. With the decrease of apparent density, the porosity of AAC increases, and the corresponding thermal conductivity decreases. By linear regression, the equations can be obtained as follows
where Ke is the thermal conductivity.
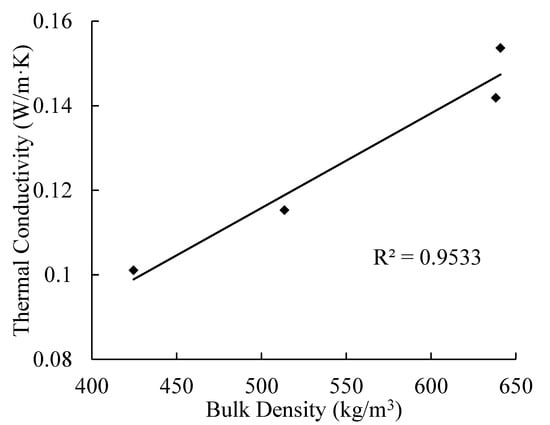
Figure 9.
Relationship between thermal conductivity and density.

Figure 10.
Relationship between thermal conductivity and porosity.
5.2. Affected by Pore Diameter
For B04 AAC, the test results of the pore diameter and thermal conductivity are presented in Table 4 and Table 5. The pore diameter is the weighted average value of the pore diameter and numbers. As the volume of each test specimen is almost the same, the influence of apparent density on thermal conductivity can be neglected.
The relationship between the pore size and thermal conductivity is shown in Figure 11. The thermal conductivity of AAC increases gradually with the increase of pore size; when the pore size is 0.45 mm, the thermal conductivity increases by about 23% compared with that of 0.35 mm. This is because at the same porosity, the smaller the pore size, the more the number of pores, the path of heat transfer is increased, and the heat transfer efficiency is reduced [36]. The relation can be expressed as Equation (7).
where d is the pore diameter.
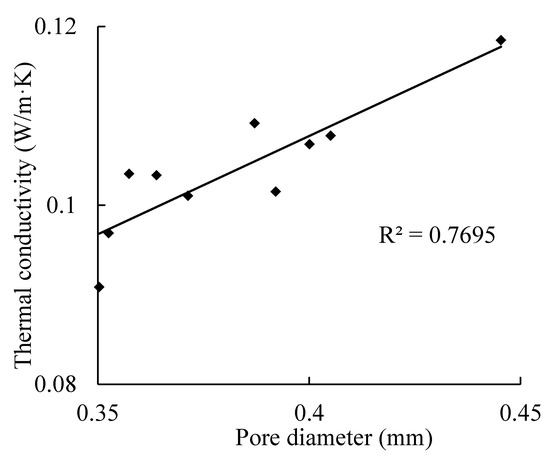
Figure 11.
Relationship between pore diameter and thermal conductivity.
6. Cubic Compressive Strength Affected by Pores
6.1. Affected by Porosity and Apparent Density
For AAC, at the initial stage of loading, the specimens were in the stage of elastic loading, and there were no obvious cracks. When the load continued to increase to about 50% of the ultimate value, one or more longitudinal short cracks appeared in the longitudinal plane of the specimen. With the continuous development of the short cracks, long cracks formed, and at last, the specimen was destroyed.
Compared with the ordinary concrete, the failure mode of AAC specimens had no obvious “X” cracks in the center. As a result of the low strength of the block, the cracks appeared irregular (Figure 12).

Figure 12.
Failure mode of AAC cubic compression: (a) vertical crack, (b) oblique crack, (c) corner crack.
For the base material, when the base material was initially loaded, no cracks were found on the surface. With the increase of load, cracks appeared on the surface of the central part of the specimen height. As the load continued to increase, cracks developed inward. A slight splitting sound was emitted. When approaching the damage, a sound could be heard, and the specimen was damaged (Figure 13).

Figure 13.
Failure mode of base material cubic compression: (a) “X” type crack, (b) corner crack, (c) irregular crack.
The failure modes of the base material were similar to those of the ordinary concrete; the central part of the crack was “X” type. Most failure modes of the base material were longitudinal splitting failure, which reflected that the lateral expansion of the block was not obvious; this may be related to the rapid release of energy inside the test block.
The test results of cubic compressive strength of AAC and base materials are shown in Table 8.
Table 8.
Test result of cubic compressive strength of AAC and base material.
Comparing the strength and apparent density of AAC, the relationship between apparent density and compressive strength is obtained by fitting the average values of each group of data in Table 8, and the fitting result is shown in Equation (8).
From Figure 14, the strength of AAC increases with the increase of apparent density.
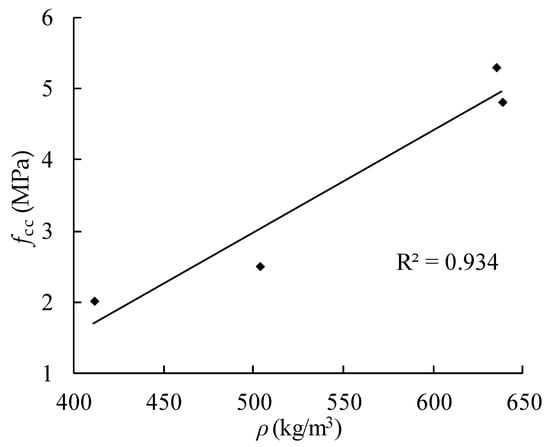
Figure 14.
Relationship between cubic compressive strength and apparent density of AAC.
From Table 8, the strength of AAC is lower than that of base materials. This is because the existence of pores greatly reduces the strength of AAC. Compared with B05 and B06FA AAC, under the same other conditions, the apparent density and cubic compressive strength decrease with the increase of aluminum paste content.
The compressive strength of AAC, compressive strength of the base material, and the porosity in Table 6 and Table 8 were fitted with the Ryshkewich formula (Equation (9)), and the result is shown in Equation (10).
where σ is the strength of materials with porosity P, MPa; σ0 is the base material strength, MPa; and B is empirical constant.
where fcc is the compressive strength of AAC, MPa; f0cc is the compressive strength of the base material, MPa; P1 is the porosity difference between AAC and the base material.
Comparisons between calculated and test values of compressive strength are shown in Table 9. In the table, the average ratio of the test value to the calculated value is 1.01, and the coefficient of variation is 0.253, which shows that Equation (10) could reflect the relationship between compressive strength and porosity of AAC.
Table 9.
Comparison of calculated and tested values of compressive strength with different porosity.
6.2. Affected by Pore Diameter
For B04 AAC, with almost the same apparent density, the test results of pore diameter and cubic compressive strength are presented in Table 4 and Table 5, and the relationship between them is shown in Equation (11) and Figure 15. From the figure, the compressive strength of the cube increases slightly with the increase of the pore size; when the pore size is 0.45 mm, the compressive strength increases about 7% compared with that of 0.35 mm, but the increase is not so big as that of the pore size on the thermal conductivity (Figure 11), and the data discreteness is big, which shows that pore size has little effect on the compressive strength.
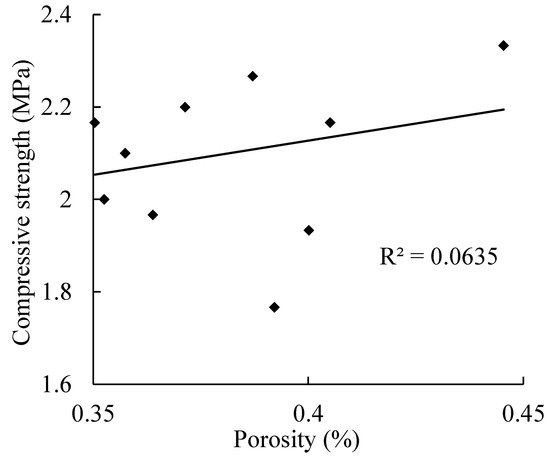
Figure 15.
Relationship between pore diameter and cubic compressive strength of AAC.
7. Basic Mechanical Properties of AAC and Base Material
7.1. Compressive Properties
7.1.1. Axial Compressive Properties
Figure 16 shows the axial compressive failure modes of AAC and the base material. The failure modes of AAC can be classified into two categories. (1) The first is longitudinal splitting failure: when the specimen was initially stressed, there was no obvious crack on the surface. With the increase of load, short cracks appeared on the surface of the specimen. With the continuous increased load, the cracks extended, and sometimes, crack branches appeared at a certain position, showing Y-type or inverted Y-type (as shown in Figure 16a,b), or there was only one main crack. (2) Due to the low strength of the specimen, internal defects, and uneven surface cutting defects, oblique cracks were formed under the load (as shown in Figure 16c). For the base material, the strength was higher than AAC, which was close to the strength of ordinary concrete, while the size of the coarse aggregate was small, and the defects between the aggregate and cement stone were small, and there were no major interface defects; once cracks appeared, the energy was released rapidly, and the specimen suddenly broke down (as shown in Figure 16d).

Figure 16.
Failure mode of AAC and base material prism under axial compressive load: (a) AAC mode 1; (b) AAC mode 2; (c) AAC mode 3; (d) base material mode.
The results of axial compressive strength test are shown in Table 10.
Table 10.
Test result of axial compressive strength of AAC and base material.
In Table 10, the axial compression ratio between the axial strength and cubic strength of AAC is bigger than 0.9. For ordinary concrete, the ratio is about 0.7, the difference is due to the loose material of AAC and the limited restriction of friction resistance between the specimen and upper/lower compression plates, which makes the cubic compressive strength less improved than that of the prism. For base materials, the ratio is lower than AAC, but it is also bigger than ordinary concrete, which is because the strength of the base material is bigger than that of AAC and lower than that of ordinary concrete; the friction resistance is between the both materials.
7.1.2. Elastic Modulus under Compression
The test results of elastic modulus of AAC and base material are shown in Table 11.
Table 11.
Test results of elastic modulus of AAC and base material.
From Table 11, the elastic modulus of AAC and the base material increase with the increase of apparent density, and for AAC, it is smaller than that of the base material. The relationship between the elastic modulus of AAC and the axial compressive strength can be calculated by Equation (12).
where E is the elastic modulus of AAC, MPa; and f is the axial compressive strength of AAC, MPa.
7.1.3. Stress–Strain Relationship
The stress–strain relationship of the specimens was tested. The obtained stress–strain relationship and fitting curve are shown in Figure 17 and Figure 18.

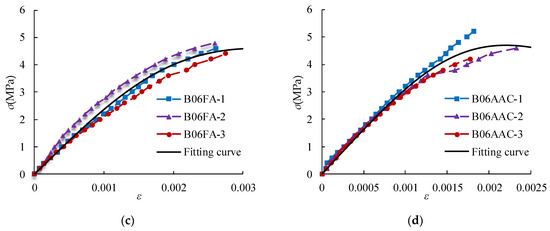
Figure 17.
Stress–strain relationship and fitting curve of AAC: (a) B04; (b) B05; (c) B06FA; and (d) B06S.

Figure 18.
Stress–strain relationship and fitting curve of base material: (a) B04; (b) B06FA; (c) B06S.
From Figure 17, the stress–strain curves are an approximately straight line when the stress σ ≤ 0.4 σmax. Then, the stress increases, and the strain increases rapidly. When the stress approaches the failure load, the plastic deformation increases significantly. When the stress increases to the maximum value, the specimen is immediately damaged. For the base material, when σ ≥ 0.3 σmax, cracks appear on the surface of the specimen. Then, the stress increases, and the strain increases gradually. When the stress increases to the maximum value, the specimen suddenly breaks down.
The model proposed by A. Madan is used to establish the stress–strain curve relationship for AAC [37,38,39] (Equations (13) and (14)).
where f is the axial compressive strength (MPa), ε0 is the average peak strain (Table 11), Em is the average elastic modulus (MPa), Esec is the ratio of axial compressive strength to peak strain, and γ is a dimensionless number.
7.2. Tensile Properties
For AAC, there was no obvious crack on the surface of the specimens during the initial loading. With the increased load, the loading steel bars were pressed into the specimens; when approaching the limit load of the specimens, the specimens suddenly split into two halves, and the sound of brittle fracture was emitted (Figure 19a). For base material, the splitting failure is faster, and the reaction is more intense (Figure 19b).

Figure 19.
Failure pattern of splitting tensile strength: (a) AAC; (b) base material.
The calculation of splitting tensile strength is shown in Equation (15). The test results are shown in Table 12.
where fts is the splitting tensile strength, MPa; P2 is the failure load, N; A2 is the split surface area, mm2.
Table 12.
Test result of splitting tensile strength of AAC and base material.
According to the analysis of the splitting tensile strength test results of AAC, the splitting tensile strength increases with the grade of AAC, and the relationship between splitting tensile strength and cubic compressive strength can be calculated by Equation (16).
where fts is the splitting tensile strength, MPa; α is the regression coefficient—for AAC, α = 0.177, for base material, α = 0.132.
For ordinary concrete, the parameter α in Equation (16) is 0.19; for AAC, which is close to that of the ordinary concrete, but for the base material, the relationship has a bigger difference. The first reason is that the number of groups is small and the dispersion is large, while the second reason may be that the brittleness of the base material reduces the plastic fracture energy of the material [40,41].
7.3. Flexural Properties
When the load was applied initially, there was no obvious change in the specimen. When the maximum load was reached, the specimen suddenly broke into two parts. The test results of flexural strength are shown in Table 13. From the table, according to the formula form in Refs. [42,43], the relationship between flexural strength and cubic compressive strength can be calculated by Equation (17).
where ff is the flexural strength, MPa; β is the regression coefficient—for AAC, β = 0.264, for the base material, β = 0.298.
Table 13.
Test result of flexural strength of AAC and the base material.
The data of flexural strength are fewer and more discrete; only approximate regression data are given in this paper.
8. Conclusions
In this paper, the preparation of AAC with different pore sizes was produced, and through many trial tests, the manufacturing method of the base material was established. Then, the related tests of the pore structure on heat transfer and mechanical properties of AAC were carried out. The conclusions could be drawn as follows:
- (1)
- The maintenance system of the base material was determined, the stirred slurry was injected into the mold and cured naturally for 7 days to get a certain strength for further autoclave curing in the autoclave, which was a key step in the process of making the base material. From the XRD and SEM analysis of AAC, the hydration of the base material had been completed, and the autoclave maintenance system of the base material was reasonable. The properties of base material would be benefit in the meso-scale research and numerical simulation of AAC.
- (2)
- In the test, there were two ways to change the size of the pore size in AAC: by changing the stabilizer content and stirring time. The amount of foam stabilizer was inversely proportional to the pore size of AAC. The pore size distribution by controlling the amount of foam stabilizer was more regular than that by stirring time.
- (3)
- With almost the same apparent density and porosity, the thermal conductivity of sand aeration AAC is 8.3% higher than that of fly ash aeration AAC, and the compressive strength is 10.4% higher, too. With the decrease of apparent density, the porosity of AAC increased, and the corresponding thermal conductivity decreased.
- (4)
- With almost the same apparent density, when the pore size was 0.45 mm, the thermal conductivity increased about 23% compared with that of 0.35 mm, but the compressive strength only increased about 7% compared with that of 0.35 mm, which means that pore size has an effect on thermal conductivity, but has it little effect on compressive strength.
- (5)
- The basic mechanical properties of AAC and the base material were tested, and the research could provide the mechanical properties relationship between the base material and AAC. From the test results, the cubic compressive strength decreased with the increase of porosity, and the relationship between them was obtained by regression analysis; the elastic modulus was proportional to the axial compressive strength; the proposed stress–strain relationship model could well describe the relationship of AAC and base material at the rising section of curve; splitting tensile strength and flexural strength could be obtained according to the existing concrete formula.
Author Contributions
Methodology, G.C. and F.L.; data curation, P.J.; formal analysis, Z.S.; software, J.G.; writing—review and editing, G.C.; funding acquisition, G.C. and F.L. All authors have read and agreed to the published version of the manuscript.
Funding
The study was financially supported by the Industry-University-Research Cooperation Project of Henan Province, China (152107000040), the Key Scientific Research Projects in Universities of Henan, China (19A560012), the Science and Technology Plan of Zhengzhou City, Henan Province, China (153PXXCY183), and the Key Scientific and Technological Research Projects of Henan, China (192102310017 and 212102310272).
Institutional Review Board Statement
Not applicable.
Informed Consent Statement
Not applicable.
Data Availability Statement
Data is contained within the article.
Acknowledgments
The authors of this paper would like to say thanks to Shunbo Zhao for his guidance as the leader of research team.
Conflicts of Interest
The authors declare no conflict of interest.
References
- Qu, X.L.; Zhao, X.G. Previous and present investigations on the components, microstructure and main properties of autoclaved aerated concrete—A review. Constr. Build. Mater. 2017, 135, 505–516. [Google Scholar] [CrossRef]
- Narayanan, N.; Ramamurthy, K. Structure and properties of aerated concrete: A review. Cem. Concr. Compos. 2000, 22, 321–329. [Google Scholar] [CrossRef]
- Ministry of Housing and Urban-Rural Construction of the People’s Republic of China. Technical Specification for Application of Autoclaved Aerated Concrete; JGJ/T17-2008; China Building Industry Press: Beijing, China, 2008.
- Liu, Y.; Chen, G.L.; Wang, Z.P.; Chen, Z.; Gao, Y.J.; Li, F.L. On the seismic performance of autoclaved aerated concrete self-insulation block walls. Materials 2020, 13, 2942. [Google Scholar] [CrossRef] [PubMed]
- Ministry of Housing and Urban-Rural Construction of the People’s Republic of China. Technical Specification for Application of Self-insulation Concrete Compound Block Walls; JGJ/T323-2014; China Building Industry Press: Beijing, China, 2014.
- Department of Housing and Urban Rural Development of Henan Province. Technical Specification for the System of Self-Insulation Block Walls; DBJ41/T100-2015; Department of Housing and Urban Rural Development of Henan Province: Zhengzhou, China, 2015. [Google Scholar]
- Li, F.L.; Zhao, S.B.; Liang, N.; Chen, G.L. Reinforced Concrete Wall Composited with Internal Insulation Layer; China Water Power Press: Beijing, China, 2017; Volume 1, pp. 23–41. [Google Scholar]
- Ramamurthy, K.; Kunhanandan Nambiar, E.K.; Indu Siva Ranjani, G. A classification of studies on properties of foam concrete. Cem. Concr. Compos. 2009, 31, 388–396. [Google Scholar] [CrossRef]
- Peng, J.Z. Study on the Forming, Characterization and Effection of Autoclaved Aerated Concrete Pores. Ph.D. Thesis, Chongqing University, Chongqing, China, 2011. [Google Scholar]
- Fomina, E.V.; Chulenyov, A.S.; Kozhukhova, N.I. Properties control in autoclave aerated concrete by choosing of pore forming AL-agent. Mater. Sci. Eng. 2018, 365, 321–329. [Google Scholar] [CrossRef]
- Lekūnaitė-Lukošiūnė, L.; Balčiūnas, G.; Kligys, M. Influence of micro additives on macrostructure of autoclaved aerated concrete. Int. J. Eng. Sci. Invent. 2017, 6, 72–79. [Google Scholar]
- Hamad, A.J. Materials, production, properties and application of aerated lightweight concrete: Review. J. Mater. Sci. Eng. 2014, 2, 152–157. [Google Scholar] [CrossRef]
- Hu, X.P.; Li, X.Y.; Han, B.Q.; Deng, Q.Y. Characterization of thermal behavior of foamed concrete by GEM equation. B. Chin. Geram. Soc. 2014, 33, 2597–2603. [Google Scholar]
- Song, Y.M.; Guo, C.C.; Qian, J.S.; Ding, T. Effect of the Ca-to-Si on the properties of autoclaved aerated concrete containing coal fly ash from circulating fluidized bed combustion boiler. Constr. Build. Mater. 2015, 83, 136–142. [Google Scholar] [CrossRef]
- Liu, Y.Q.; Leong, B.S.; Hu, Z.T.; Yang, E.H. Autoclaved aerated concrete incorporating waste aluminum dust as foaming agent. Constr. Build. Mater. 2018, 148, 140–147. [Google Scholar]
- Yang, E.H.; Liu, Y.Q.; Chen, Z.T. Environmental sustainability through recycling incineration bottom ash for the production of autoclaved aerated concrete. Key Eng. Mater. 2015, 650, 51–70. [Google Scholar] [CrossRef]
- Esmaily, H.; Nuranian, H. Non-autoclaved high strength cellular concrete from alkali activated slag. Constr. Build. Mater. 2012, 26, 200–206. [Google Scholar] [CrossRef]
- Li, H.D.; Zeng, Q.; Xu, S.L. Effect of pore shape on thermal conductivity of partially saturated cement-based porous composites. Cem. Concr. Compos. 2017, 81, 87–96. [Google Scholar] [CrossRef]
- Zhu, M.; Wang, F.G.; Zhang, X.L.; Wang, F.Z. Research on the relationship between pore structure and thermal conductivity of foamed concrete. J. Wuhan Univ. Technol. 2013, 35, 20–25. [Google Scholar]
- Cabrillac, R.; Fiorio, B.; Beaucour, A.L.; Dumontet, H.; Ortola, S. Experimental study of the mechanical anisotropy of aerated concretes and of the adjustment parameters of the introduced porosity. Constr. Build. Mater. 2006, 20, 286–295. [Google Scholar] [CrossRef]
- Narattha, C.; Thongsanitgarn, P.; Chaipanich, A. Thermogravimetry analysis, compressive strength and thermal conductivity tests of non-autoclaved aerated Portland cement-fly ash-silica fume concrete. J. Therm. Anal. Calorim. 2015, 122, 11–20. [Google Scholar] [CrossRef]
- Chen, Y.L.; Chang, J.E.; Lai, C.Y.; Chou, M.I.M. A comprehensive study on the production of autoclaved aerated concrete: Effects of silica-lime-cement composition and autoclaving conditions. Constr. Build. Mater. 2017, 152, 622–629. [Google Scholar] [CrossRef]
- Isu, N.; Teramura, S.; Ishida, H.; Mitsuda, T. Influence of quartz particle size on the chemical and mechanical properties of autoclaved aerated concrete (II) fracture toughness, strength and micropore. Cem. Concr. Res. 1995, 25, 249–254. [Google Scholar] [CrossRef]
- Arandigoyen, M.; Alvarez, J.I. Pore structure and mechanical properties of cement-lime mortars. Cem. Concr. Res. 2007, 37, 767–775. [Google Scholar] [CrossRef]
- Jin, N.G.; Jin, X.Y.; Guo, J.F. Relationship modeling of pore structure and strength of concrete. J. Zhejiang Univ. Eng. Sci. 2005, 39, 1680–1684. [Google Scholar]
- Li, X.Y.; Zhao, X.L.; Guo, X.Y.; Guo, L.Q. Investigations on thermal conductivity models of foamed concrete. Build. Sci. 2010, 26, 69–73. [Google Scholar]
- Li, F.L.; Chen, G.L.; Zhang, Y.Y.; Hao, Y.C.; Si, Z.K. Fundamental properties and thermal transferability of masonry built by autoclaved aerated concrete self-Insulation blocks. Materials 2020, 13, 1680. [Google Scholar] [CrossRef] [PubMed]
- Peng, J.Z. A review on pore structure and properties of autoclaved aerated concrete. Mater. Rev. 2013, 27, 103–107. [Google Scholar]
- Guo, X.L.; Song, M. Development on pore structure and characterization of autoclaved aerated concrete. Mater. Rev. 2018, 32, 440–445. [Google Scholar]
- National Development and Reform Commission. Aluminum Pastes for Aerated Concrete; JC/T407–2008; China Building Industry Press: Beijing, China, 2008.
- General Administration of Quality Supervision, Inspection and Quarantine of the People’s Republic of China. Test Method for Determining Cement Density; GB/T208-2014; China Standard Press: Beijing, China, 2014.
- General Administration of Quality Supervision, Inspection and Quarantine of the People’s Republic of China. Thermal Insulation Determination of Steady-State Thermal Resistance and Related Properties Guarded Hot Plate Apparatus; GB/T 10294-2008; China Standard Press: Beijing, China, 2008.
- General Administration of Quality Supervision of the People’s Republic of China. Test Methods of Autoclaved Aerated Concrete; GB11969-2008; Standards Press of China: Beijing, China, 2008. [Google Scholar]
- Li, P.; Jing, P.F.; Geng, J.Y.; Chen, G.L. Numerical simulation of equivalent thermal conductivity of autoclaved aerated concrete. J. North China Univ. Water Resour. Hydropower 2018, 39, 91–96. [Google Scholar]
- Zhao, H.K.; Xiao, W.Q. The surfactant is making progress on the mechanism of foam stabilization. Appl. Chem. Ind. 2019, 48, 1167–1171. [Google Scholar]
- Jin, H.Q.; Yao, X.L.; Fan, L.W.; Xu, X.; Yu, Z.T. Experimental determination and fractal modeling of the effective thermal conductivity of autoclaved aerated concrete: Effects of moisture content. Int. J. Heat Mass Tran. 2016, 92, 589–602. [Google Scholar] [CrossRef]
- Madan, A.; Reinborn, A.M. Modeling of masonry infill panels for structural analysis. Concrete 1997, 12, 1295–1302. [Google Scholar] [CrossRef]
- Chen, G.L. Study on Static and Dynamic Mechanical Behavior of Concrete Perforated Brick Masonry Structures. Ph.D. Thesis, Tongji University, Shanghai, China, 2010. [Google Scholar]
- Guo, Z.H. Strength and Deformation of Concrete-Test Basis and Constitutive Relation; Tsinghua University: Beijing, China, 1997; Volume 1, pp. 31–35. [Google Scholar]
- Şahin, Y.; Köksal, F. The influence of matrix and steel fibre tensile strengths on the fracture energy of high-strength concrete. Constr. Build. Mater. 2011, 25, 1801–1806. [Google Scholar] [CrossRef]
- Yin, J.; Zhou, S.Q. A contrastive study of direct tensile strength and splitting tension strength of high performance concrete. J. Changsha Railw. Univ. 2011, 19, 25–29. [Google Scholar]
- American Concrete Institute. Building Code Requirements for Structural Concrete and Commentary; ACI 318-19; American Concrete Institute: Farmington Hill, MI, USA, 2019. [Google Scholar]
- Xiao, J.Z.; Li, J.B.; Zhang, C. On relationships between the mechanical properties of recycled aggregate concrete: An overview. Mater. Struct. 2006, 39, 655–664. [Google Scholar] [CrossRef]
Publisher’s Note: MDPI stays neutral with regard to jurisdictional claims in published maps and institutional affiliations. |
© 2021 by the authors. Licensee MDPI, Basel, Switzerland. This article is an open access article distributed under the terms and conditions of the Creative Commons Attribution (CC BY) license (http://creativecommons.org/licenses/by/4.0/).