Review

Properties and Classification of Diamond-Like Carbon Films

1
Institute of Innovative Research, Tokyo Institute of Technology, 4259 Nagatsuta, Midori-ku, Yokohama, Kanagawa 226-8503, Japan
2
NANOTEC Corp., Nanotechno-Plaza, 4-6, Kashiwa-Inter-minami, Kashiwa City, Chiba 277-0874, Japan
3
Laboratory of Advanced Science and Technology for Industry, University of Hyogo, 3-1-2 Koto, Kamigori, Ako District, Hyogo 678-1205, Japan
4
Department of Mechanical Engineering, Tokyo Institute of Technology, 2-12-1, O-okayama, Meguro-ku, Tokyo 152-8550, Japan
5
Nippon Itf Inc., 575 Kuzetonoshiro-cho, Minami-ku, Kyoto 601-8205, Japan
6
Department of Electrical and Electric Engineering, Tokyo Denki University, 5 Senju Asahi-cho, Adachi-ku, Tokyo 120-8551, Japan
7
Advanced Manufacturing Research Institute, National Institute of Advanced Industrial Science and Technology, 1-1-1 Umezono, Tsukuba, Ibaraki 305-8560, Japan
8
Hitachi Automotive Systems Ltd., 4-7-1 Onna, Atsugi, Kanagawa 243-8510, Japan
9
Materials Function Engineering Group, Nagaoka University of Technology, 1603-1, Kamitomioka Nagaoka, Niigata 940-2188, Japan
*
Author to whom correspondence should be addressed.
Materials 2021, 14(2), 315; https://doi.org/10.3390/ma14020315
Submission received: 21 November 2020 / Revised: 2 January 2021 / Accepted: 6 January 2021 / Published: 9 January 2021
(This article belongs to the Special Issue DLC (Diamond-Like Carbon) Film Formation and Application)

Abstract

:
Diamond-like carbon (DLC) films have been extensively applied in industries owing to their excellent characteristics such as high hardness. In particular, there is a growing demand for their use as protective films for mechanical parts owing to their excellent wear resistance and low friction coefficient. DLC films have been deposited by various methods and many deviate from the DLC regions present in the ternary diagrams proposed for sp3 covalent carbon, sp2 covalent carbon, and hydrogen. Consequently, redefining the DLC region on ternary diagrams using DLC coatings for mechanical and electrical components is urgently required. Therefore, we investigate the sp3 ratio, hydrogen content, and other properties of 74 types of amorphous carbon films and present the classification of amorphous carbon films, including DLC. We measured the sp3 ratios and hydrogen content using near-edge X-ray absorption fine structure and Rutherford backscattering-elastic recoil detection analysis under unified conditions. Amorphous carbon films were widely found with nonuniform distribution. The number of carbon atoms in the sp3 covalent carbon without bonding with hydrogen and the logarithm of the hydrogen content were inversely proportional. Further, we elucidated the DLC regions on the ternary diagram, classified the amorphous carbon films, and summarized the characteristics and applications of each type of DLC.

1. Introduction

Diamond-like carbon (DLC) films are a kind of amorphous carbon film, wherein both the σ and π bonds due to sp3 and sp2 hybrid orbitals constituting diamond and graphite, respectively, are the carbon skeletons [1,2,3,4]. Aisenberg and Chabot conducted a series of experiments to fabricate diamond films using a carbon ion beam and confirmed the formation of diamond-like amorphous carbon films, known as diamond-like carbon. This marked the beginning of DLC research [5].
DLC films feature high hardness, high wear resistance, low friction coefficient, high insulation, high chemical stability, high gas barrier properties, high anti-burning properties, high biocompatibility, and high infrared permeability. DLC films with flat surfaces can be synthesized at low temperature (~200 °C). Hence, they have a wide range of applications [6,7,8], such as electric and electronic equipment (e.g., hard disks, video tapes, integrated circuits), cutting tools (e.g., drills, end mills, razors), molds (e.g., optical parts, injection molding), automotive parts (e.g., piston rings, cam-related parts, clutch plates, pumps, injectors), optical components (e.g., lenses), plastic bottle oxygen barrier films, sanitary equipment (faucets), windows, bathtub mirrors, and decorative items. Their demand as protective films for automotive parts is rapidly increasing, particularly due to their excellent wear resistance and low friction coefficient properties [9].
The ratio of sp3 to sp2 binding in DLC ranges from ~10% to ~90%. Moreover, the hydrogen content in DLC varies from 0 to 50 at%. Robertson et al. proposed a ternary diagram [10] of sp3 carbon, sp2 carbon, and hydrogen targeting DLC films with large chemical bonding and compositional variations, which provides the understanding of DLC existence regions in the sp3 bond, sp2 bond, and hydrogen content axes. The diagram was constructed using 28 sets of experimental data referenced by Robertson et al. All the samples were evaluated by nuclear magnetic resonance (NMR) and elastic recoil detection analysis (ERDA). Jacob et al. proposed a fully constrained network model [11,12] on this ternary diagram to demonstrate the degree of clustering of the sp2 phase shown as a region. Furthermore, the DLC film is classified based on the sp3 ratio and hydrogen content cited by 19 studies [13]. Bewilogua et al. [14] and Reinke et al. [15] strengthened the diagrams by adding experimental data on the sp3 ratio of hydrogenated amorphous carbon films obtained from Fourier-transform infrared spectroscopy (FTIR) spectra and confirmed that hydrocarbon films can be classified into two types, regardless of the production method. Zhang et al. created a ternary diagram comprising nanocrystalline graphite, a fused aromatic ring, and olefinic chain clusters from a survey of the Raman spectra of many DLC films; further, they classified DLC primarily based on the morphology characterized by the presence of sp2 carbons [16].
To date, Vetter investigated and detailed the addition of various additives (e.g., Si, F, B, Ti, Al, Mo, Co, Fe, Ni, Cu, W, Zr, Ag, Au, H, and N) in DLC films. Notably, the static contact angle of a water droplet and electric properties of DLC vary significantly, depending on the type and concentration of the third element added [17]. The film structure forms a mixing layer, which lowers the sp3 ratio near the substrate or forms an intermediate layer. The amorphization trajectory of the sp2 phase clustering, which ranges from crystalline graphite to amorphous carbon, has been explained by a model that changes from nanocrystalline graphite with a cluster size of ≥2 nm to a fused aromatic ring of ≤2 nm and further converts it into olefin-chain nanoclusters [18,19]. The hydrogen content in DLC films significantly impacts both the hardness and friction coefficient. Furthermore, the friction coefficient of DLC films grown using raw material gas with a very high hydrogen/carbon ratio (e.g., 10) is typically very low (μ = 0.003), whereas that of DLC films without hydrogen is very high (μ = 0.65) [20].
Amorphous carbon films containing DLC films are synthesized by various methods such as chemical vapor deposition (CVD), which includes plasma-enhanced CVD [21,22,23,24,25,26,27,28,29], electron cyclotron resonance (ECR) plasma CVD [30], plasma-based ion implantation and deposition (PBII&D) [31,32], and physical vapor deposition, which includes ionized evaporation [33], sputtering [34,35], unbalanced magnetron sputtering (UBMS) [36,37], ECR sputtering [38,39], high-power impulse magnetron sputtering (HiPIMS) [40,41], filtered cathodic vacuum arc (FCVA) [42,43,44,45], ion-beam deposition (IBD) [5,46,47,48], arc ion plating (AIP) [49,50], pulsed laser deposition (PLD) [51], and laser arc deposition [52,53]. Many of the DLC films produced by these methods have deviated from the DLC regions on the ternary diagrams reported to date. Therefore, redefining the DLC region on the ternary diagram, which uses DLC coatings for mechanical and electrical components, is urgently required in academia and industries. In fact, Germany made a national effort to standardize the carbon films and published the German standard VDI2840 in 2005 [54].
Therefore, in this study, 74 types of amorphous carbon films were collected, and the sp3 ratios and hydrogen contents of the films were evaluated. Importantly, the properties of the amorphous carbon films were each evaluated using a single near-edge X-ray absorption fine structure (NEXAFS) for the sp3 ratio analysis, a single 13C NMR for the sp3 ratio analysis, and a single Rutherford backscattering spectroscopy-ERDA (RBS-ERDA) for the hydrogen content analysis, to eliminate errors due to differences in the equipment and measurement conditions. The DLC regions were clarified on the ternary diagram based on the measured data. Subsequently, the amorphous carbon films containing DLC were classified.
The effects of sp3 ratio and hydrogen content on various properties of amorphous carbon were clarified by comparing and investigating the results of the sp3 ratio and hydrogen content obtained by RBS-ERDA with those of the density, refractive index, extinction coefficient, nano-indentation hardness, visible light Raman spectrum, ultraviolet light Raman spectrum, static water-drop contact angle, and corrosion properties (Section 3). Finally, the type of DLC film and its application fields were described based on the classification results and characteristic evaluation of amorphous carbon films.

2. Method of Characterization

2.1. Density and Film Thickness

The true densities were measured by X-ray reflection (XRR). The X-ray diffractometer used was a centralized optical XRD device (MACscience, M03XHF MXP3). The target and power of the X-ray tube were Cu and 1.6 kW, respectively. The sample thickness was ~100 nm, using a sample formed with amorphous carbon on a strip-shaped p-type Si (100) substrate (5 mm × 10 mm × 0.38 mm).

2.2. Hydrogen Content

RBS-ERDA was measured using the static direct current ion beam accelerator at Nagaoka University of Technology. The amorphous carbon film was ~100 nm thick, and an amorphous carbon film was formed on the strip-shaped p-type Si substrate (5 mm × 10 mm). The incident energy of helium ions was 2500 keV for both RBS and ERDA. RBS measurements were performed at an incident angle (θ1) of 72.0°, exit angle (θ2) of −12.0°, and scattering angle (θ) of 96°. ERDA was measured under the following conditions: θ1 = 72.0°, θ2 = 78.0°, and θ = 186°. Grill et al. proposed that approximately 1/2 to 1/3 of the hydrogen in amorphous carbon films is nonbonded hydrogen [55,56]. It is also reported that thermal decomposition of amorphous carbon starts at about 600 K [57].

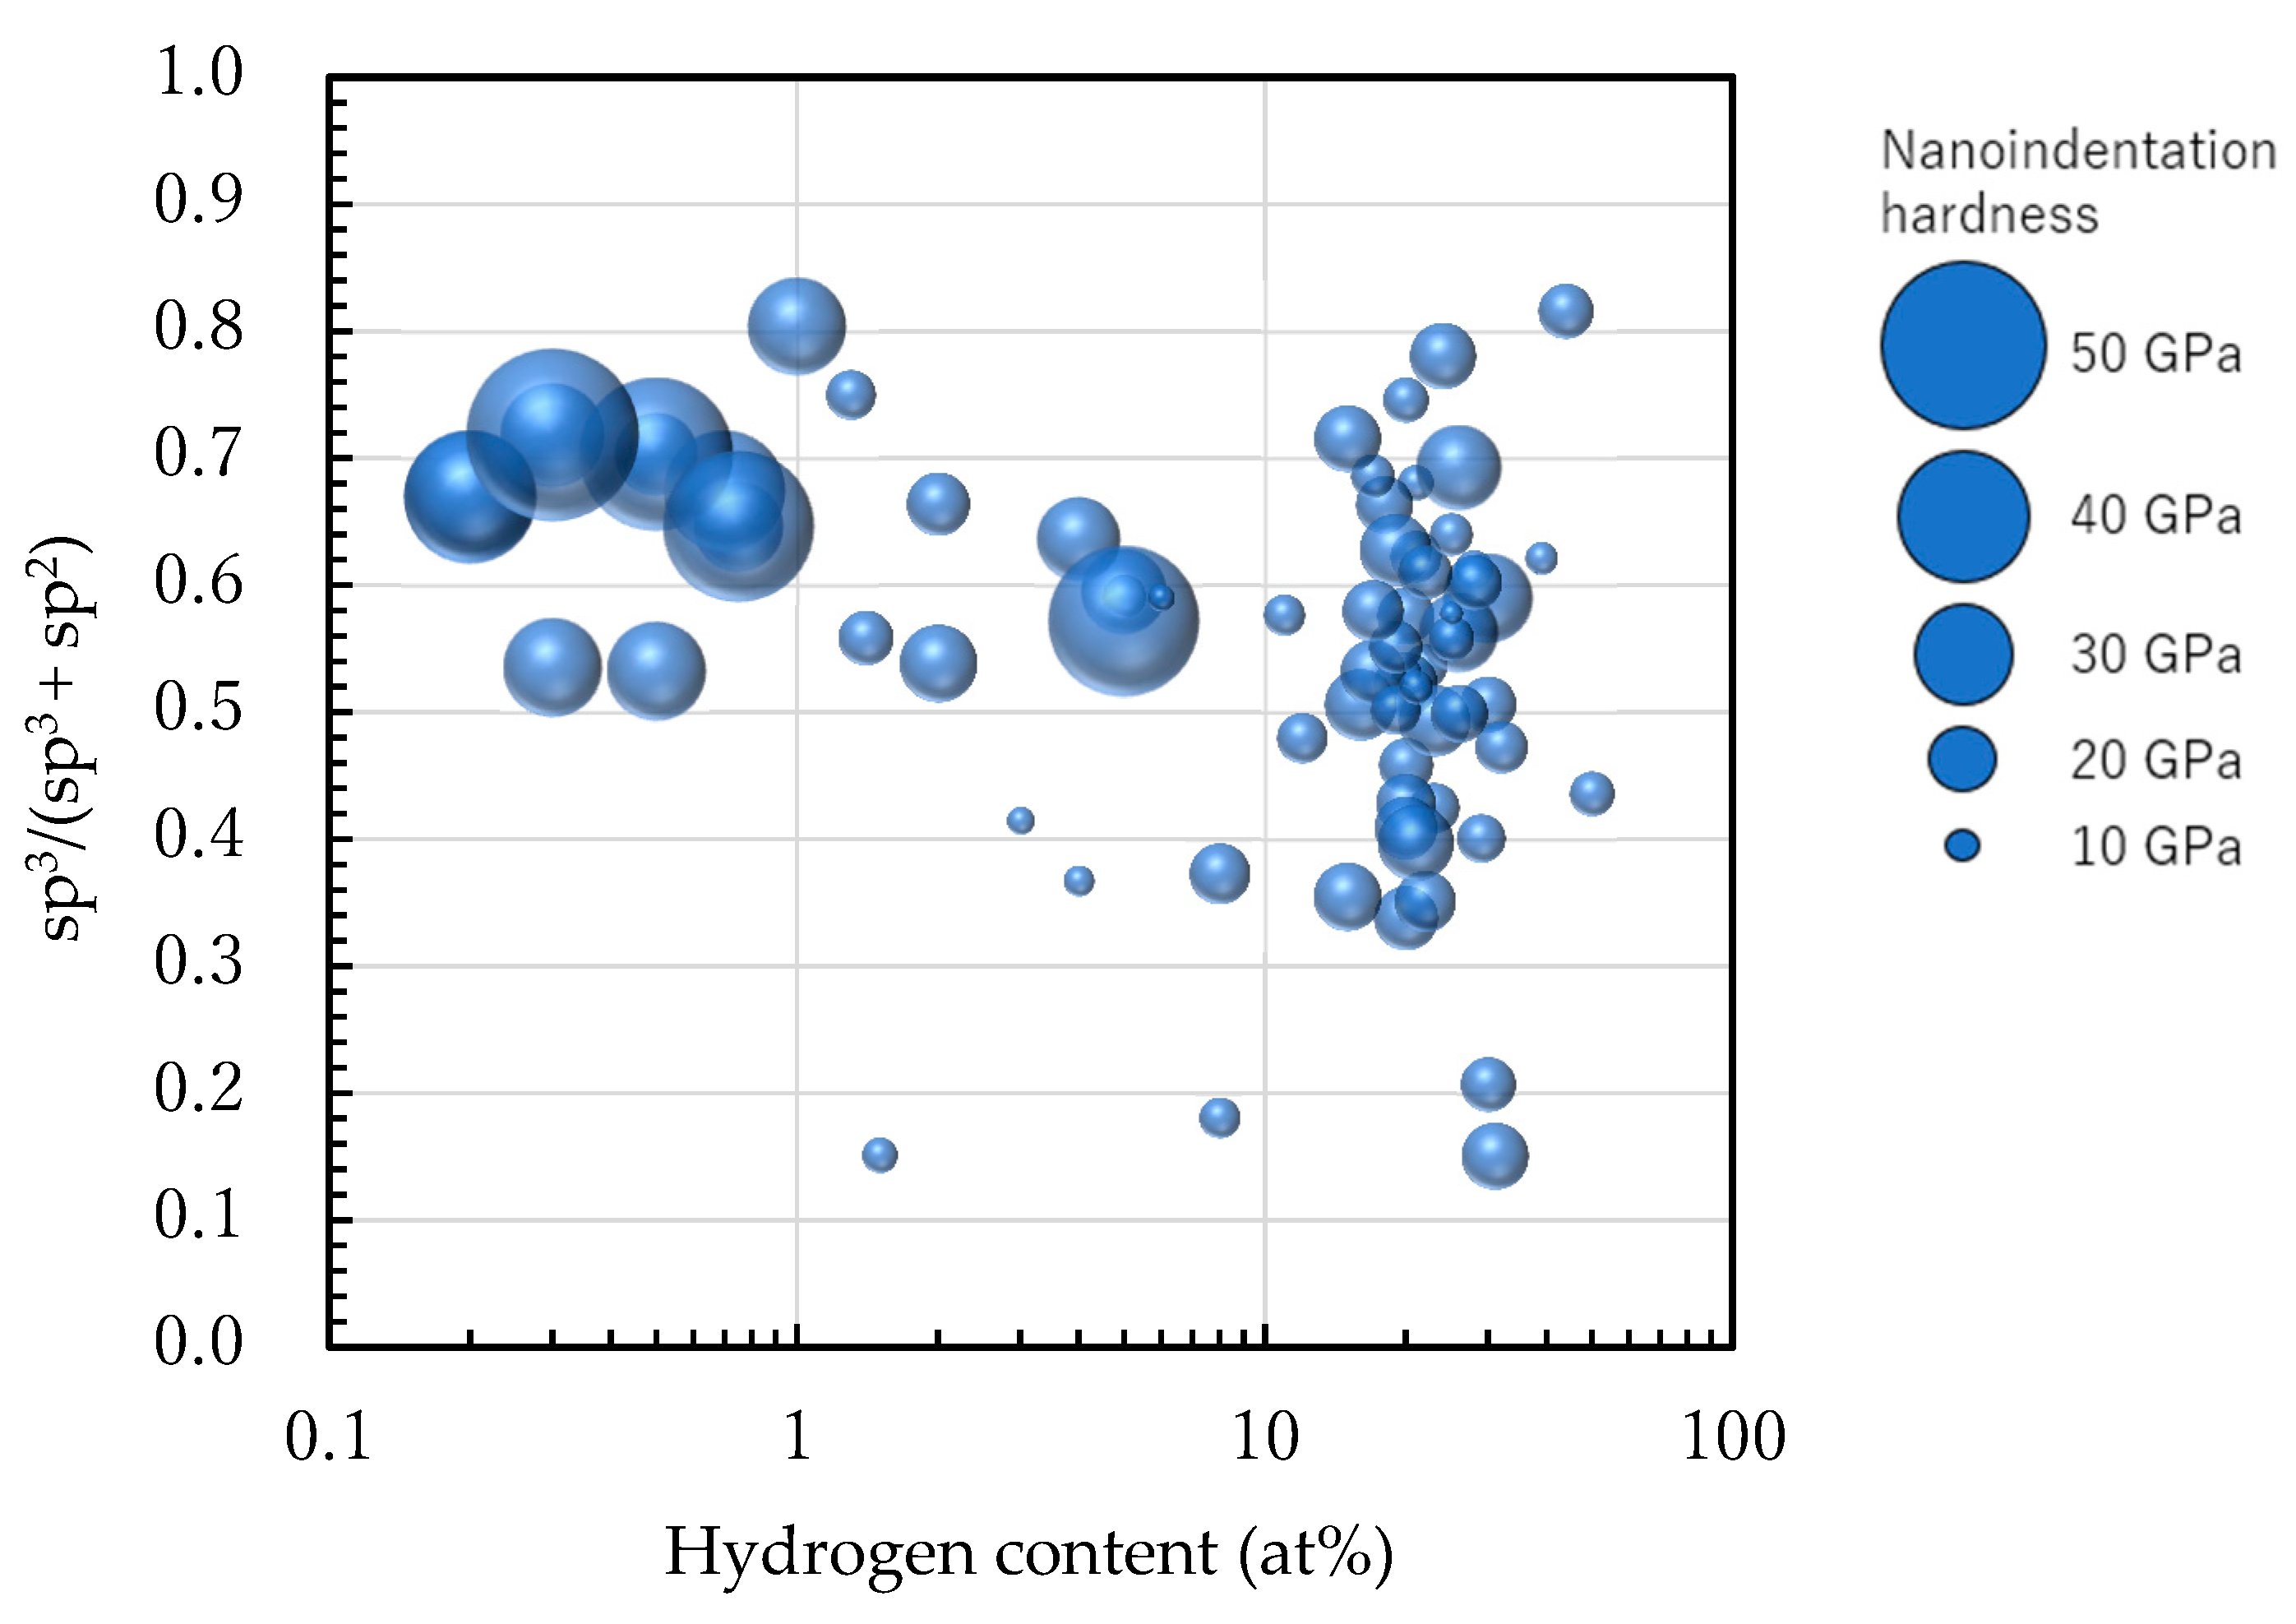
2.3. sp3/(sp2 + sp3) Structure (sp3 Ratio)

Unlike diamond and graphite, amorphous carbon films exhibited amorphous structures with no definite crystal structure. When considering this in terms of the local structure at the atomic level, carbon atoms with sp3 and sp2 hybrid orbitals corresponding to the diamond and graphite structures, respectively, were supposedly mixed in the amorphous carbon. NEXAFS using synchrotron radiation exhibited high resolution and utilized the unoccupied state. Hence, the peaks derived from sp2 could be monitored separately from the peaks derived from sp3, thereby enabling determination of the sp3 ratio with high accuracy [58]. The sp3 ratio could be analyzed even when Si was introduced in DLC, and detailed studies have been conducted [59]. A series of FTIR measurements was performed to estimate the sp3 ratios of DLC films. However, films with a high hydrogen content have large errors [60]; therefore, FTIR data were not used when examining the classification.
Figure 1 shows the carbon-atom K-edge NEXAFS spectra of DLC films deposited by ion plating. The photoelectrons produced by direct photoionization were included above 290 eV because the ionization energy of carbon is 290 eV. The broad peaks present at 290–310 eV reflected the Auger electrons originating from the C 1s → σ* resonant Auger electron emission process, whereas those at ~285.4 eV indicated transitions originating from the 1s → π* resonant Auger electron emission process. σ orbitals exhibited an electron distribution on the bond axis, whereas π orbitals had a bond axis as the node and had no electron distribution. Hence, the energy of the π orbital was insensitive to distance between nuclei and observed separately as a sharp peak. The sp3 ratio was determined from the NEXAFS spectrum by obtaining the value, where the peak area (Iπ) of 1s → π* was divided by the area (Iall) of the entire spectrum (Iπ/Iall). Similarly, Iπ/Iall was calculated using graphite as the standard substance with 100% sp2 composition. The peak derived from the sp2 hybrid orbital was observed separately, which is a major feature of the NEXAFS measurement method, and the sp3 ratio was determined with high accuracy and certainty. The absolute value of sp3 ratio was determined using appropriate reference samples to calculate the relative ratio to the reference sample. The partial electron yield (PEY) mode [61] was used in the NEXAFS measurement. Therefore, -CHn (n = 1–3) was included in the peak of C 1s → σ* together with -C; however, as C-H is observed at 287 eV [62,63,64] or 287.5 eV [65], C-H was not included in the sp3 ratio in this NEXAFS analysis.
In this study, highly oriented pyrolytic graphite (HOPG, grade SPI-2) manufactured by SPI was used as the reference material. The amorphous carbon film was ~100 nm thick. The measurement was conducted using the total electron yield method on a soft X-ray spectroscopic beamline (BL05B) of the NewSUBARU synchrotron radiation facility owned by the University of Hyogo. The sample was fixed at 54.7° (magic angle) with respect to the incident light, and the energy resolution was determined to be 275–330 eV at a full-width at half-maximum (FWHM) of 0.5 eV. The incident light energy was calibrated using the π-peak of HOPG (285.38 eV), and all the samples were analyzed under the same conditions. The measured sp3 ratios of amorphous carbon films were widely distributed between 0.15 and 0.82, with an average of 0.55.
The sp3 ratio of part of the samples was measured by 13C NMR and compared with the sp3 ratio measured by NEXAFS. The NMR method was not influenced by hydrogen and is a suitable method for accurately determining the sp3(C)/(sp3(C) + sp2(C)) ratio, which is the ratio of carbon atoms that are tetrahedrally coordinated in amorphous carbon [66]. Measurements were conducted using a magnetic field of 500 MHz, dipolar decoupling in magic-angle spinning, sample tube diameter of φ 3.2 mm, and rotational speed of 20 kHz. The sp3(C)/(sp3(C) + sp2(C)) ratio (sp3(C) ratio) was then estimated from the NMR spectrum by forcibly peak-separating sp3(C) and sp3(H), which is a C-C σ bond due to the sp3 hybrid orbital, wherein at least one hydrogen atom is coordinated to the carbon atom.

2.4. Refractive Index, Extinction Coefficient, and Optical Band Gap

The amorphous carbon films with ~500 nm deposited on the surface of a 10 mm × 10 mm p-type Si substrate were evaluated. The ellipsometer used the HORIBA Jobin Yvon UVISEL-2617K and the included software Delta Psi 2 for Windows 9x/NT 4/2000/XP, Delta Psi 2 version 2 2.4. Measurements were conducted in air at room temperature (22 °C) using an Xe lamp as the excitation light (beam diameter: <2 mm) and incident angle of 70°. Measurements were conducted at 0.02 eV increments in the photon energy range of 1.5–40 eV. The Tauc–Lorentz model was used for the analysis, and the optical constants were obtained.

2.5. Nano-Indentation Hardness

The substrate hardness can influence the measurement results due to the large indentation depth of the indenter when conducting conventional Vickers microhardness or Knoop hardness tests on the film, although the hardness of the thin film itself may not be known. The indentation depth should generally be reduced to ≤10% of the film thickness to suppress the influence of the substrate hardness. Consequently, the nano-indentation method was developed, thus enabling measurement of the hardness of thin films with thicknesses ≤1 μm. A nano-indentation method (ISO14577 [67]) was subsequently drafted in 2002, and has since been recognized worldwide. The nano-indentation method was used for continuously measuring the indentation load and depth of the indenter, from which the hardness and Young’s modulus were calculated from the indentation depth and load curves, rather than from the microscope image.
The state of the diamond indenter was first confirmed using molten quartz glass before the test. Measurements were performed under the following conditions after calibrating using the calibration method of the testing machine. The diamond indenter used was a modified Berkovich indenter (apex angle: 64.27°). The amorphous carbon film was ~500 nm thick.
  • Load: The maximum load was set at 1.0 mN.
  • Load application speed: 2.0 mN/min.
  • Test atmosphere: Atmospheric and room temperature. The temperature was maintained within 20 ± 2 °C.
  • Indentation hardness (HIT) was calculated from the projected contact area (Ap) and the maximum load (Fmax) using the following equation (see ISO14577):
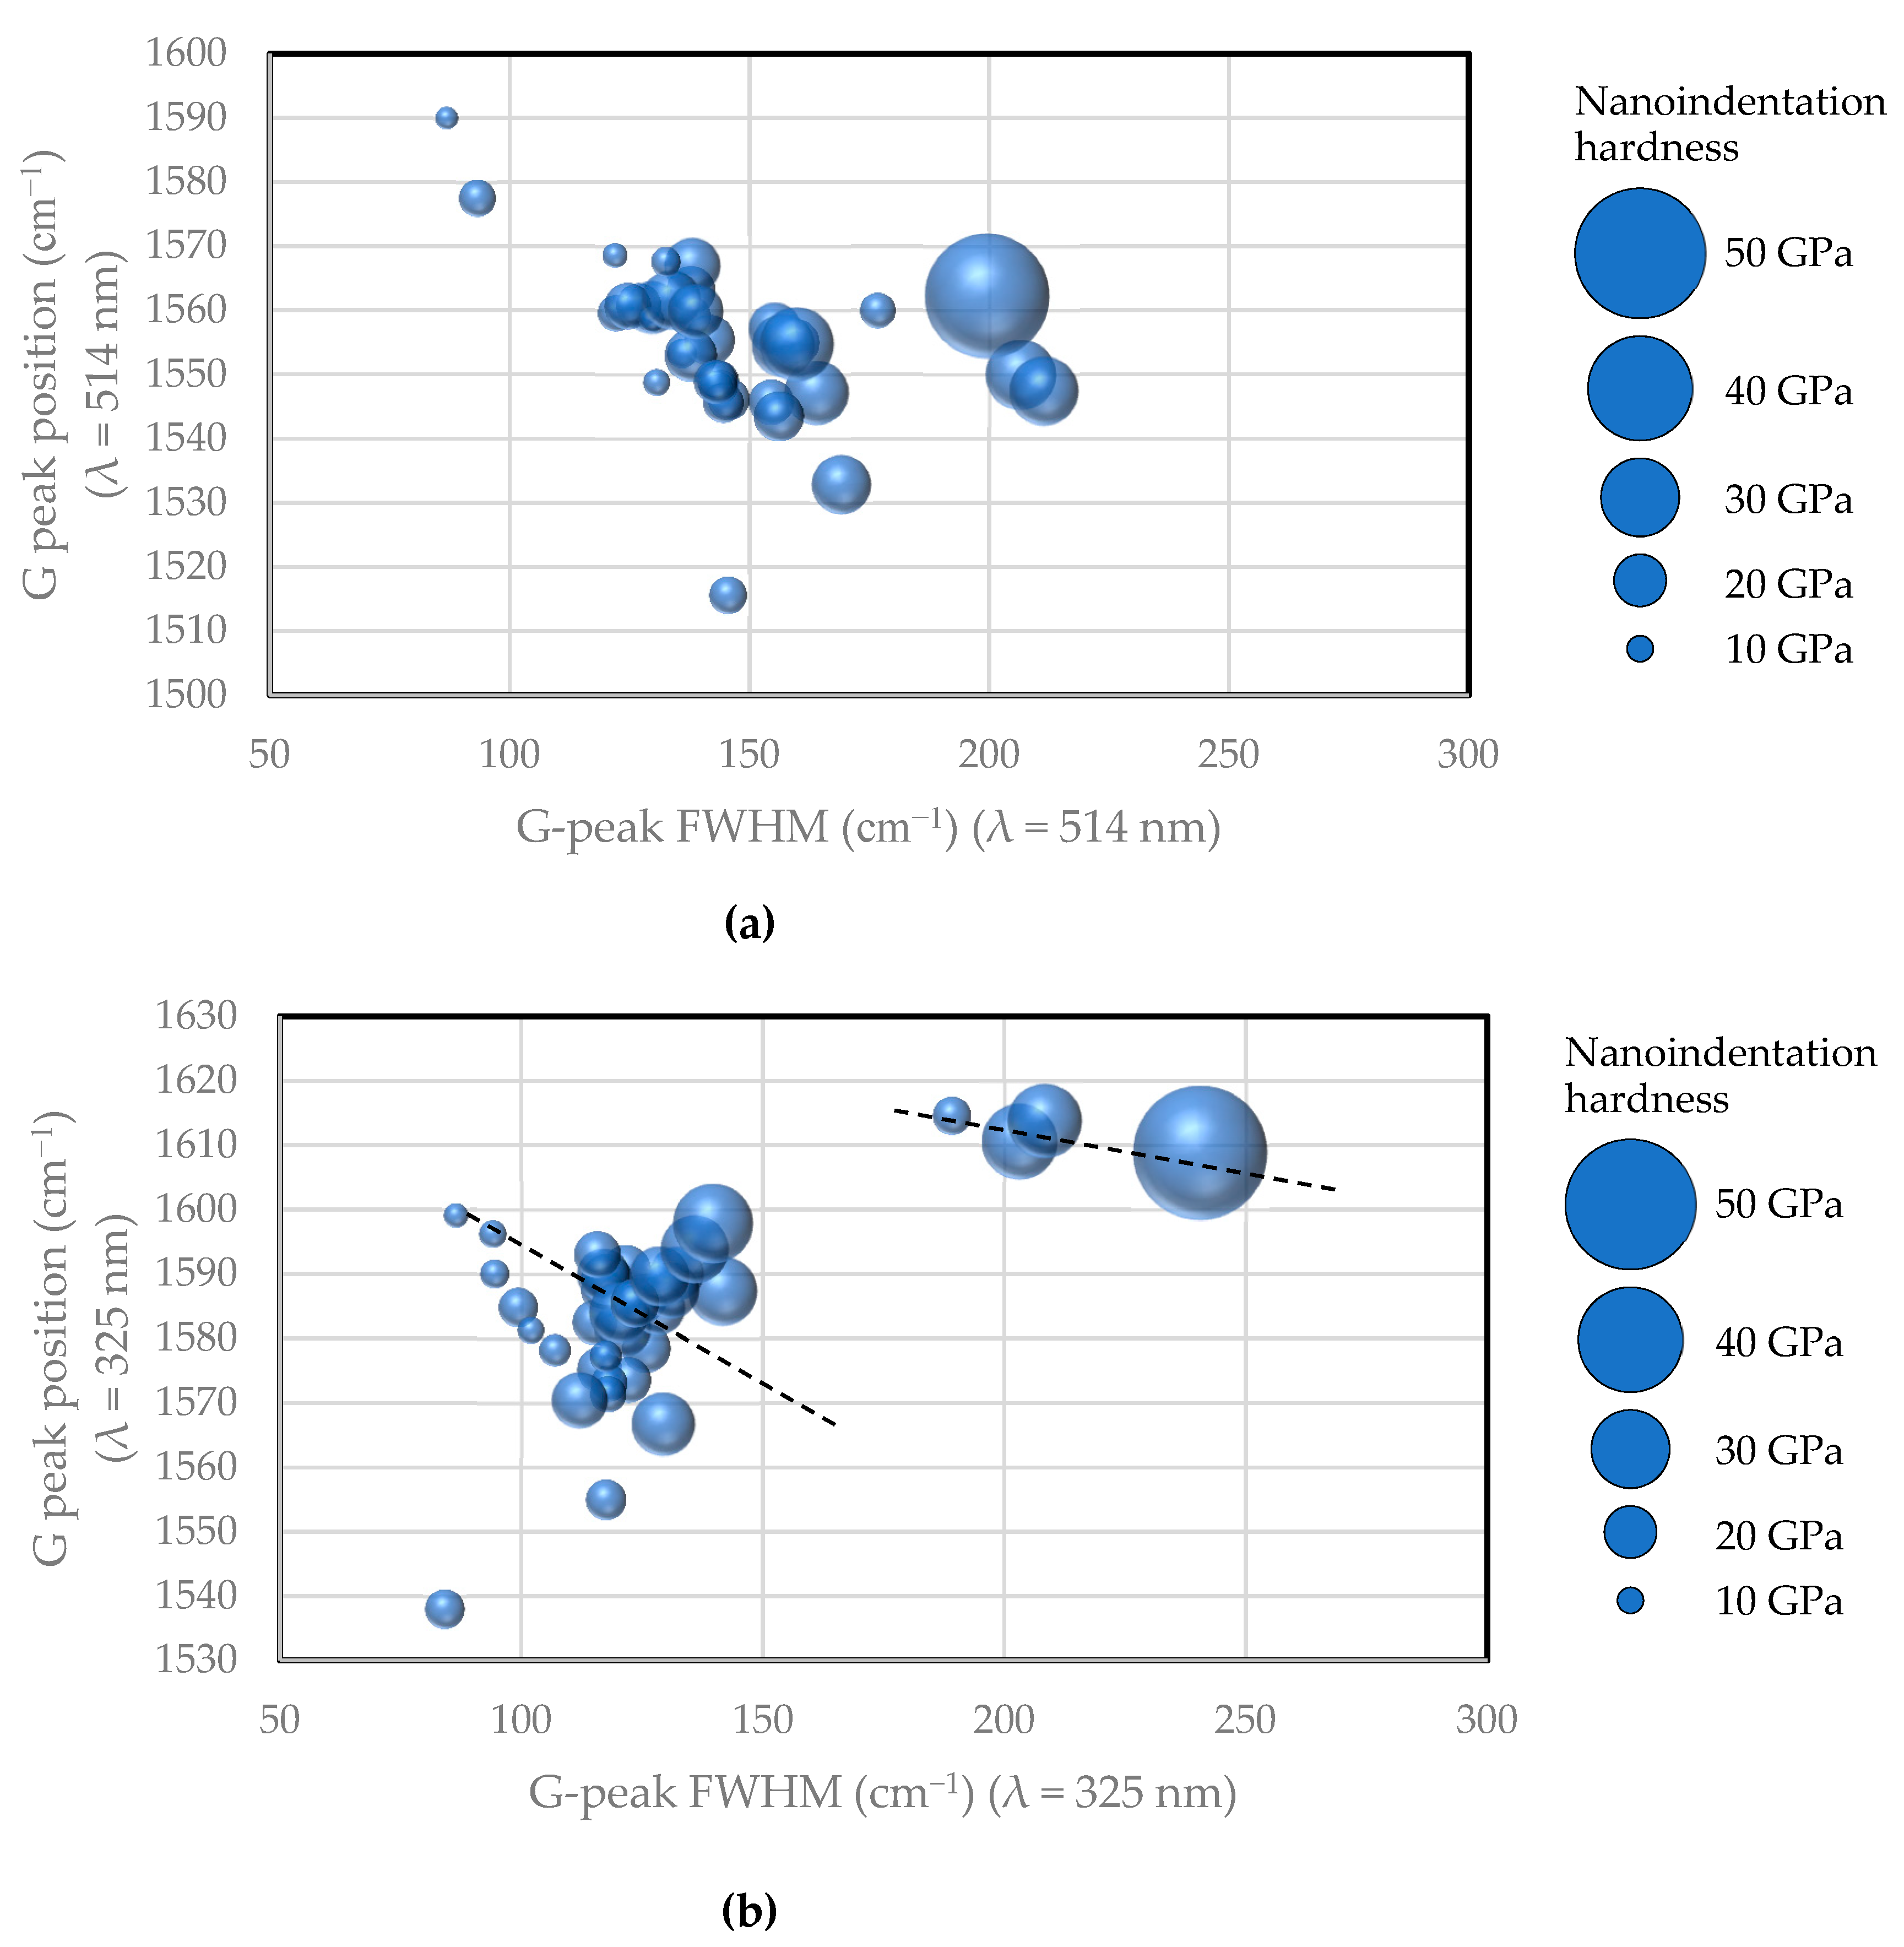
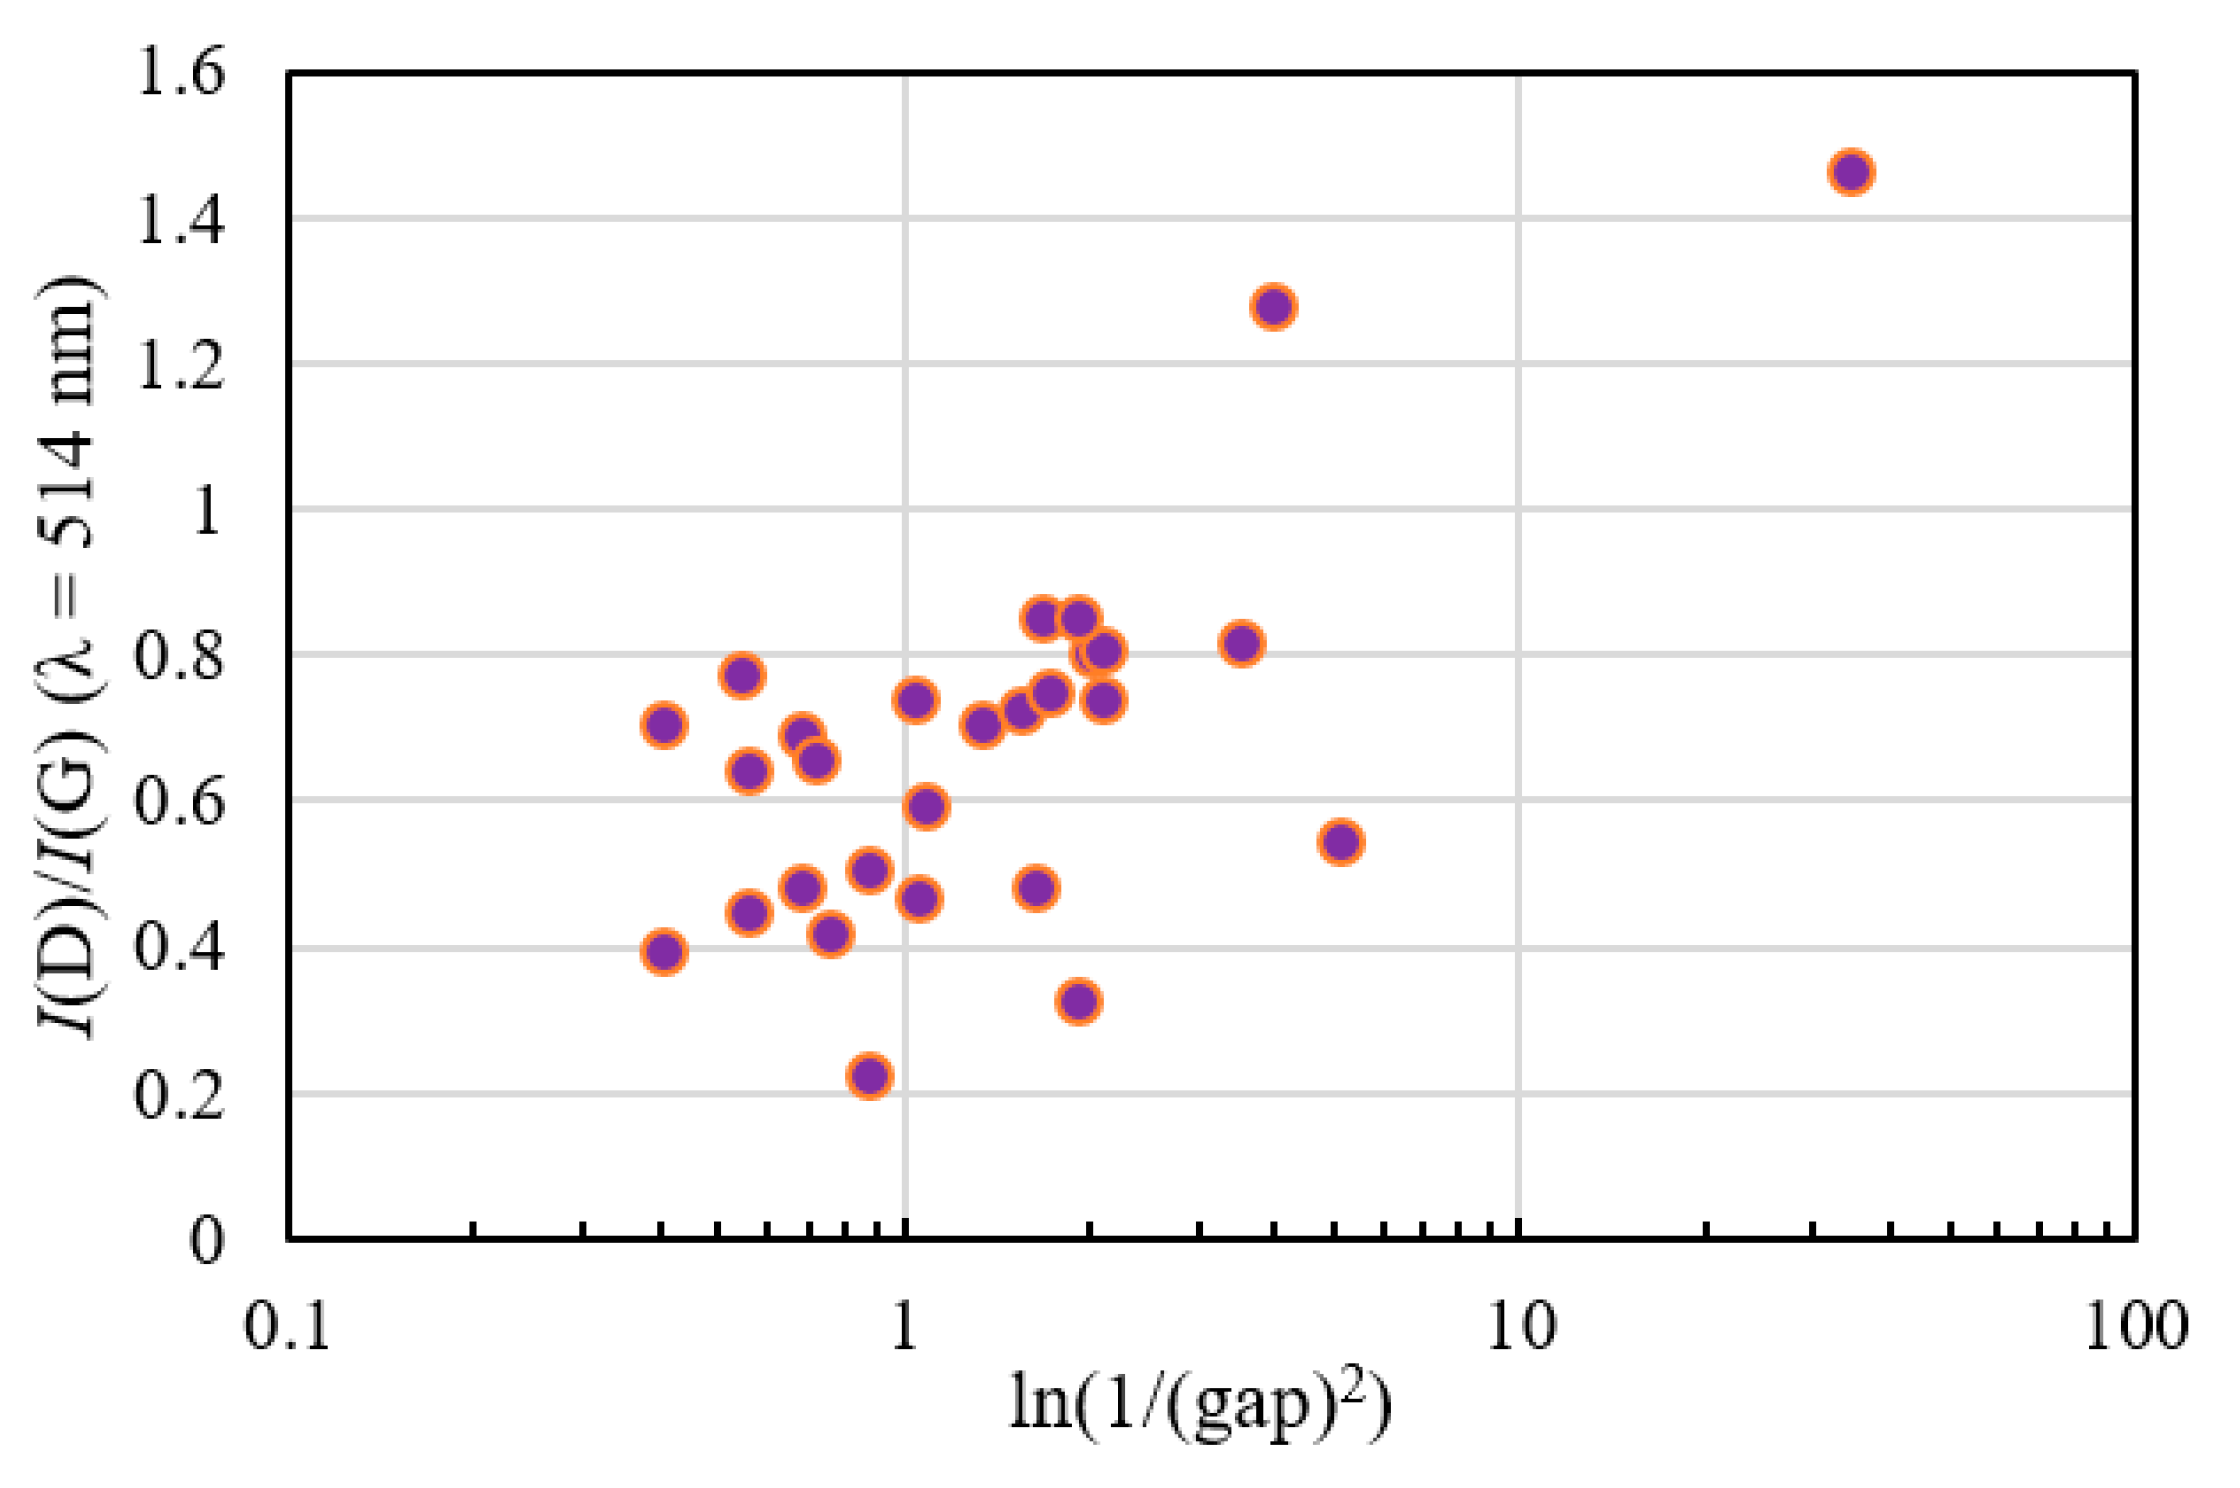
H IT = F max A p

2.6. Raman Spectrum

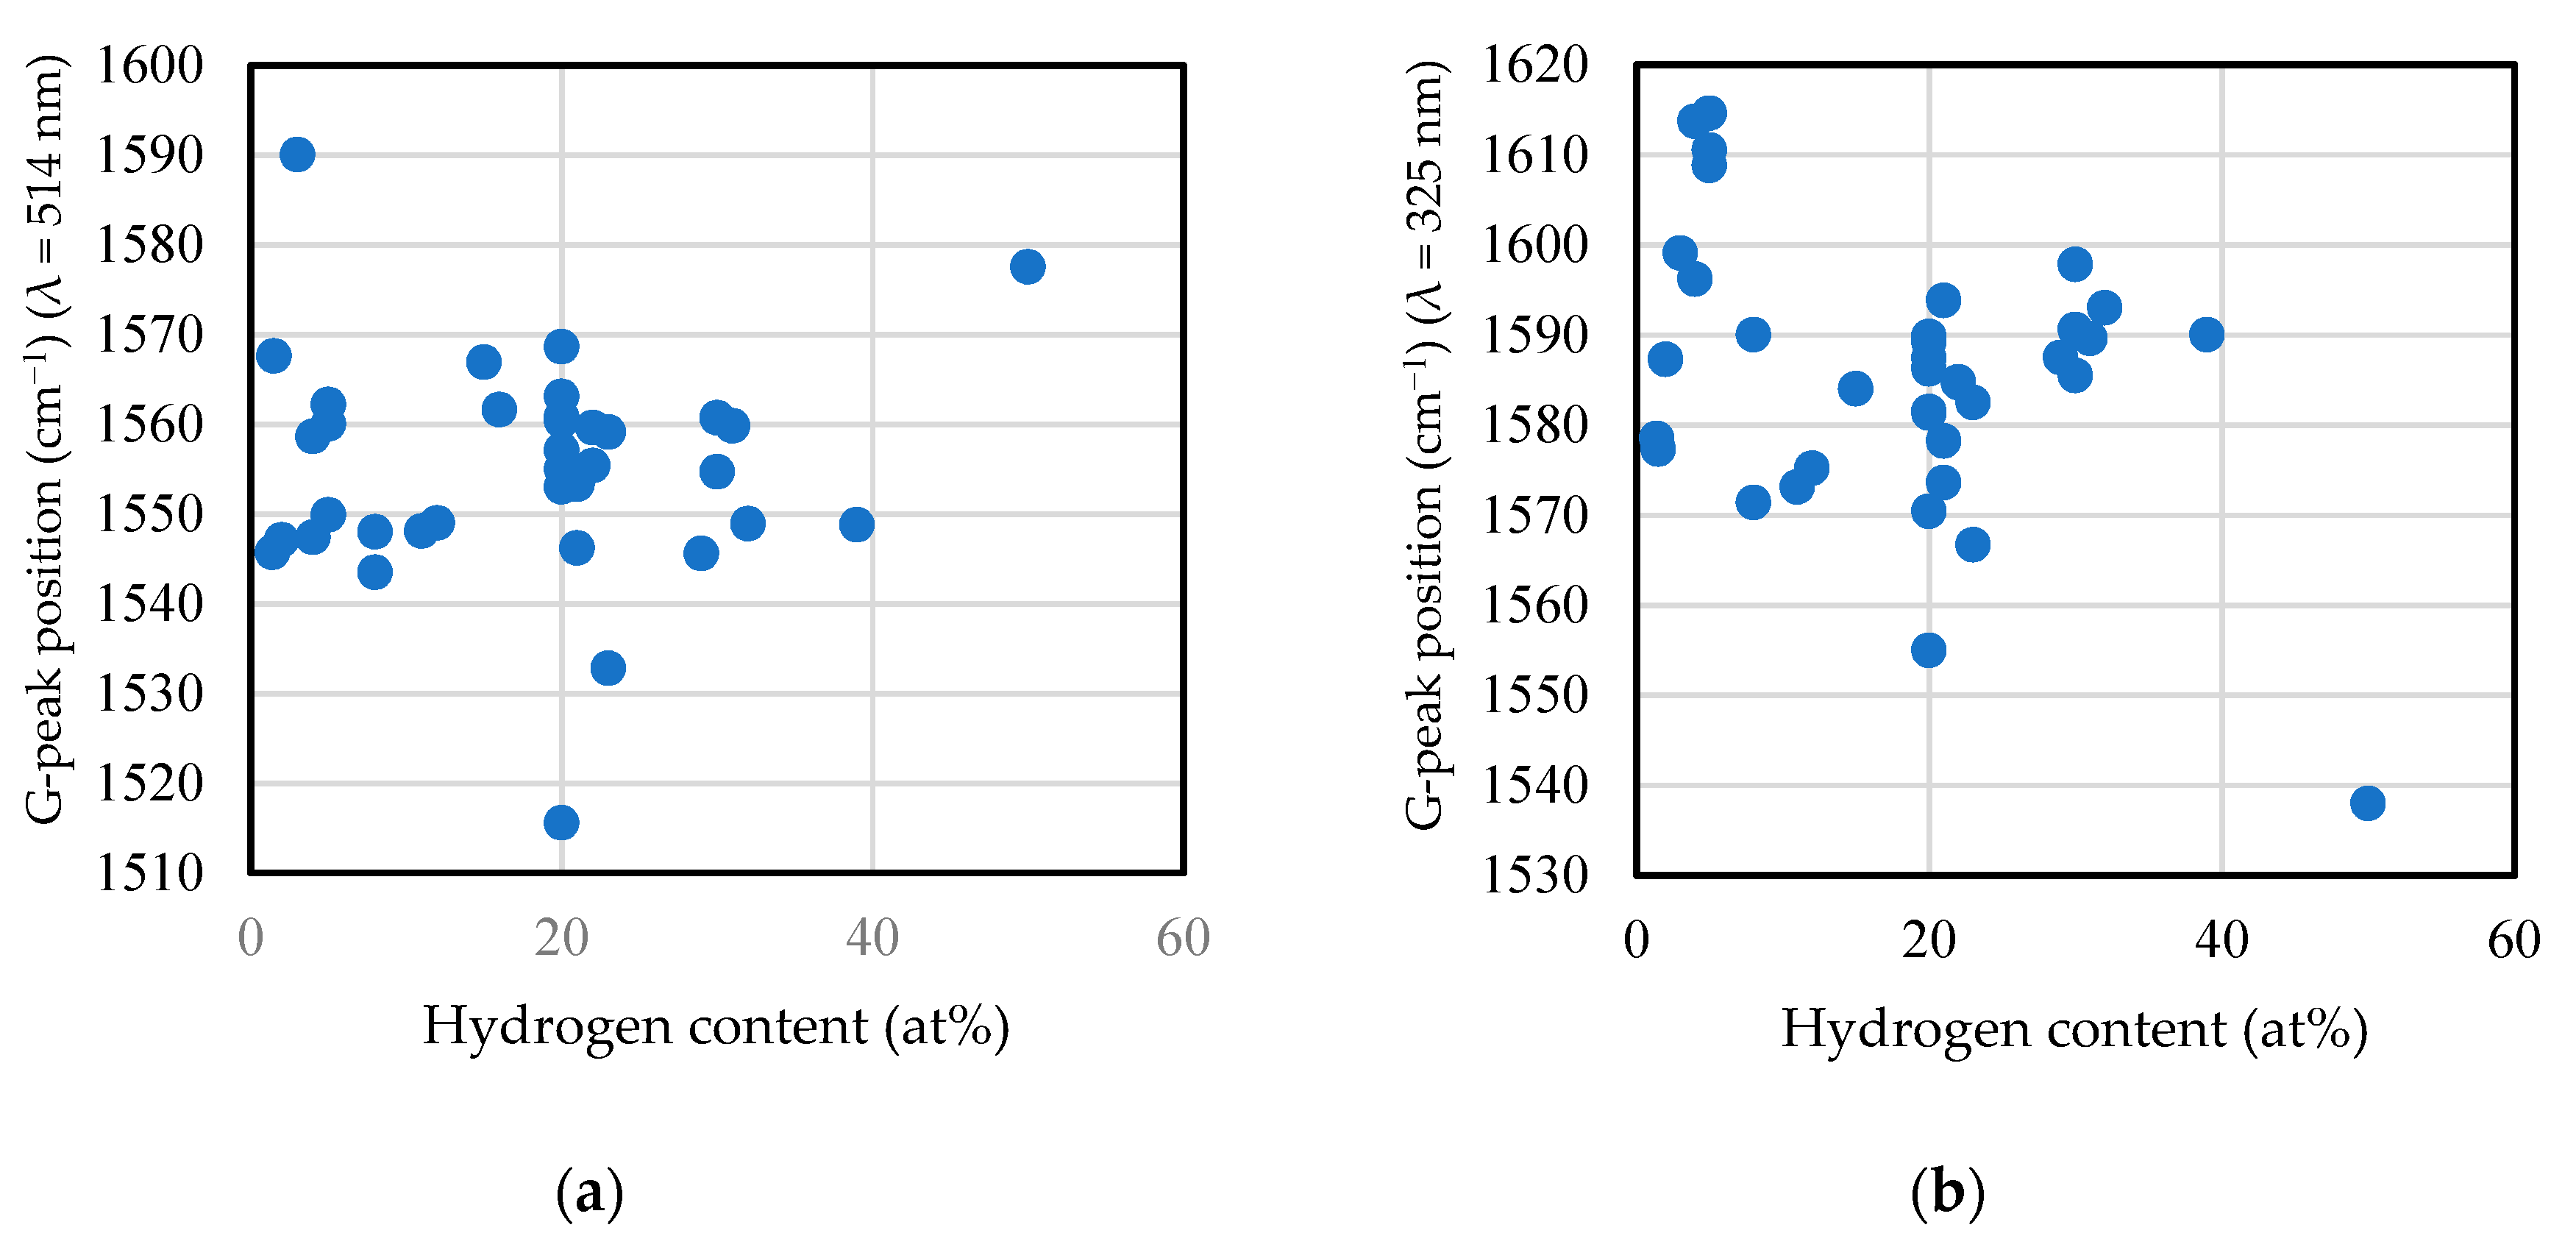
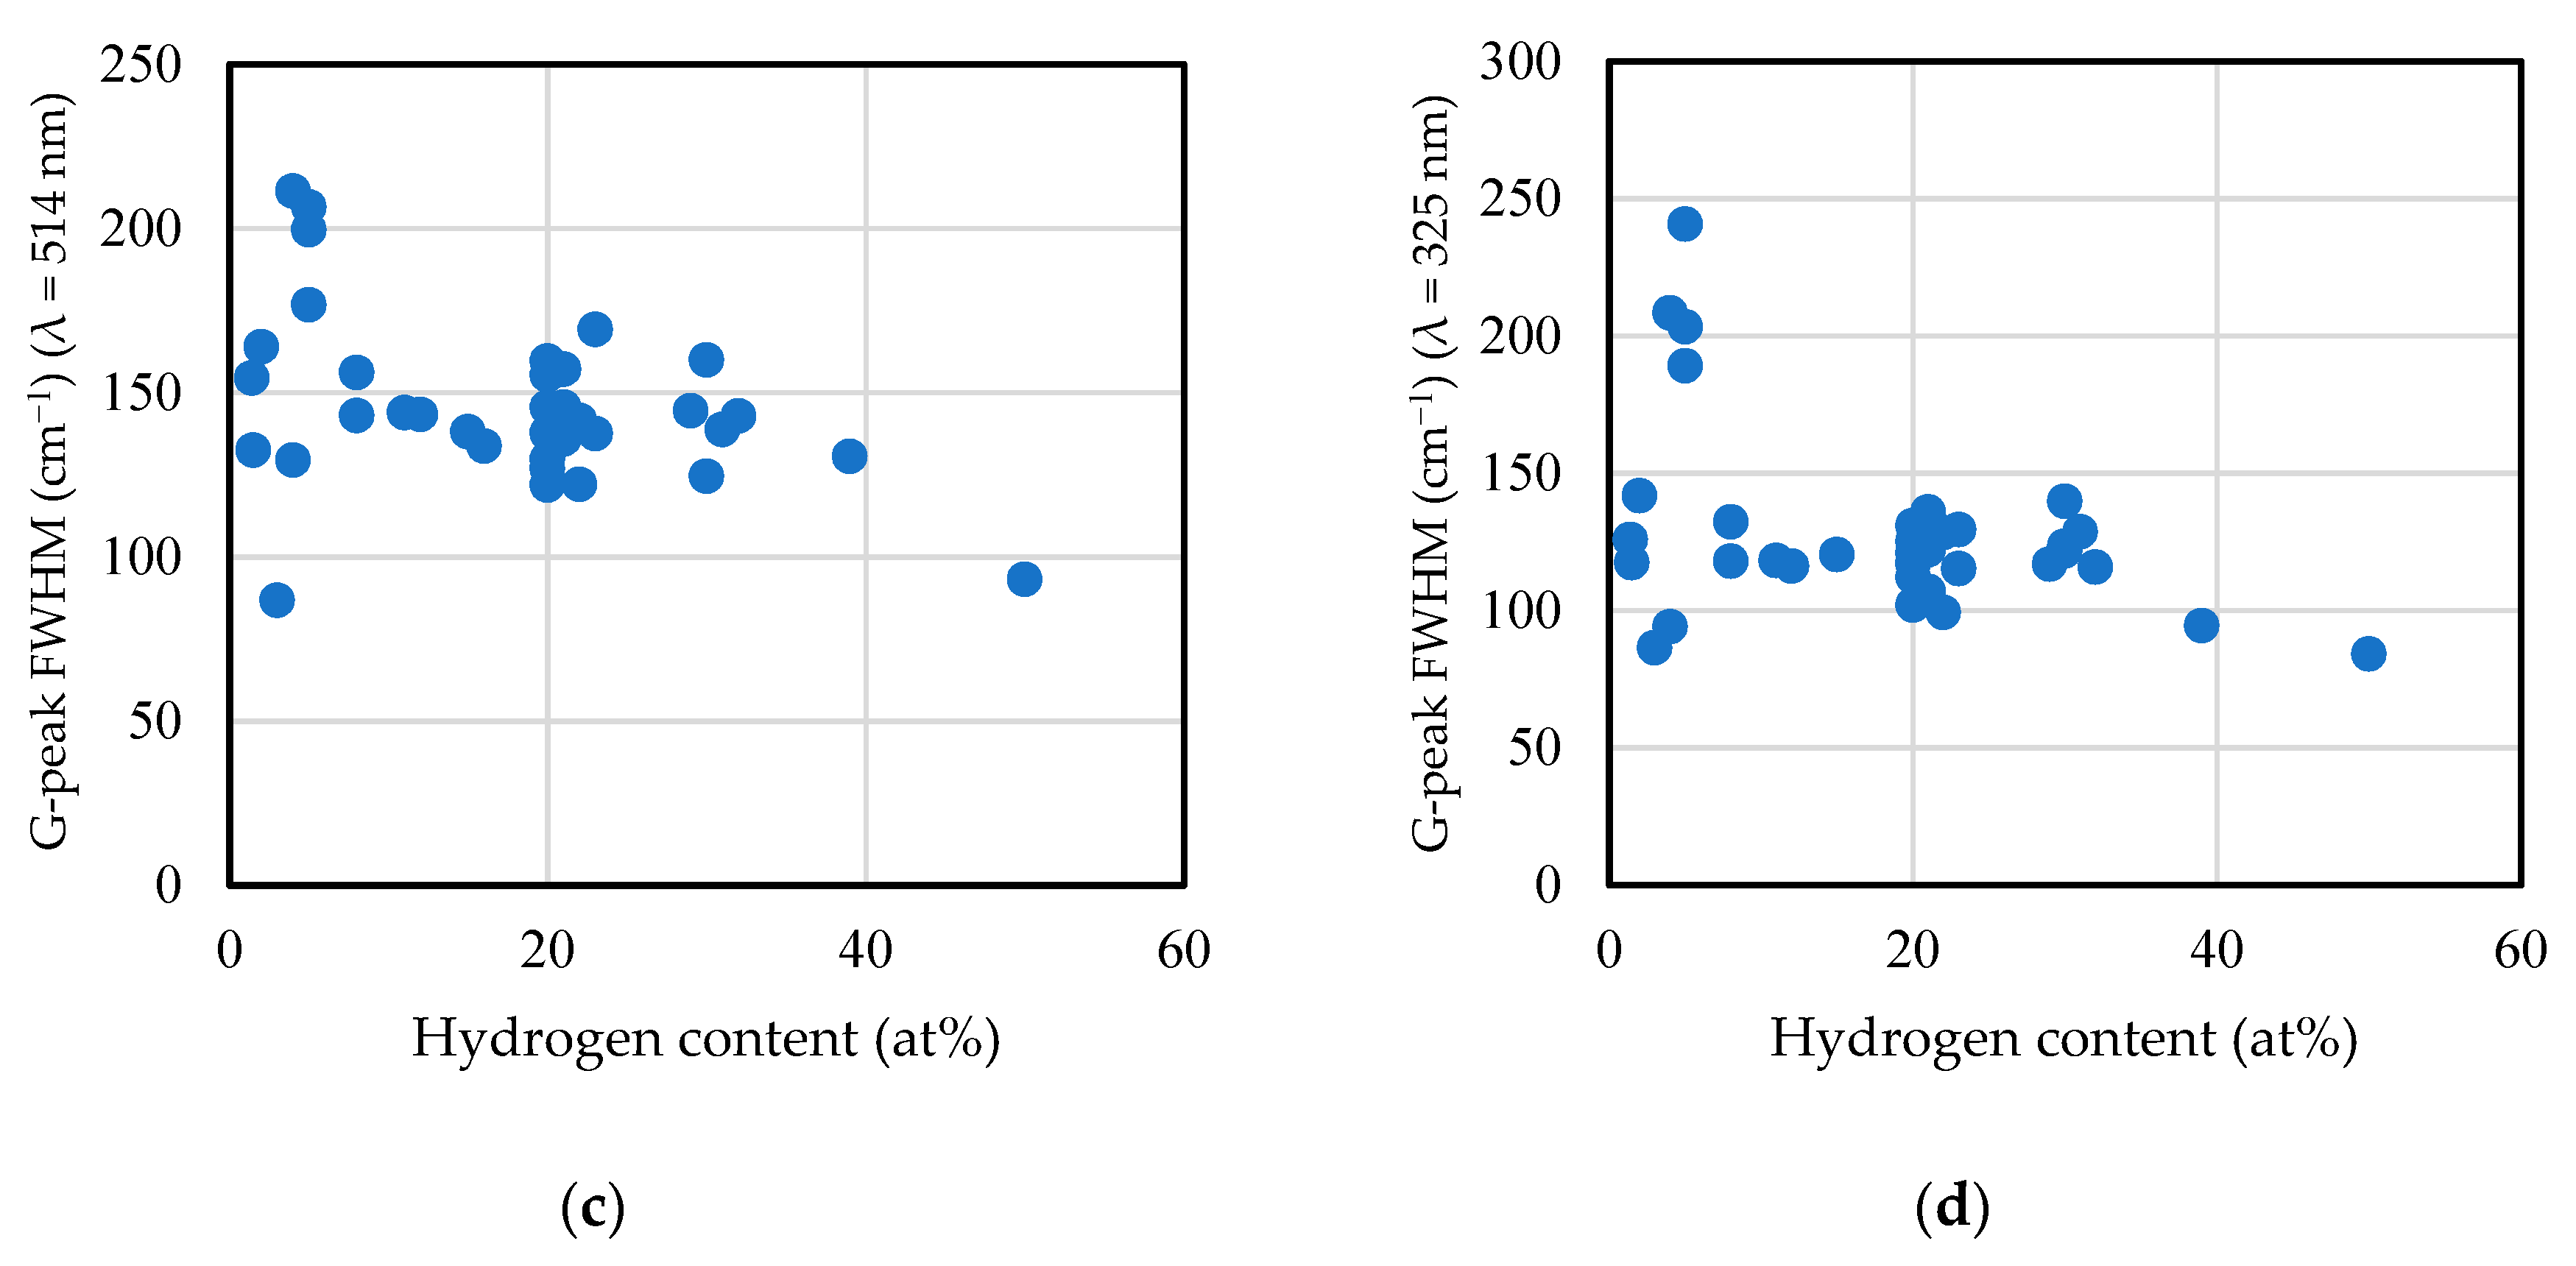
2.6.1. Visible Raman Scattering Spectroscopy

The evaluated samples were amorphous carbon films (~500 nm) deposited on the surface of a 10 mm × 10 mm × 0.38 mm p-type Si (100) substrate. Measurements were conducted using the HORIBA Jobin Yvon LabRam Infinity and the attached software LabSpec for Windows 95, LabSpec version 3.10C. The measurements were conducted in air at 20 °C using an Ar ion laser (wavelength: 514.527 nm; beam diameter: 100 μm; output: 10 mW) for the excitation light, wavelength range of 800–2000 cm−1, and diffraction grating of 1800 lines/mm. The average value was calculated with a data recording time of 3 s and number of accumulations of 50 times. The peak top wavenumbers of the Graphitic (G) and Disorder (D) bands, FWHMs, and peak intensities were calculated from the obtained spectra.

2.6.2. Ultraviolet Raman Scattering Spectroscopy

The samples that were evaluated were similar to those of visible Raman scattering spectroscopy. Measurements were conducted using the HORIBA Jobin Yvon LabRam HR-800 and the attached software LabSpec for Windows 9x/NT 4/2000/XP. Measurements were conducted in air at 22 °C, using a He–Cd laser (wavelength: 325 nm; beam diameter: 100 μm; output: 2 mW) as the excitation light, wavelength range of 800–2000 cm−1, and diffraction grating of 2400 lines/mm. The average value was calculated with a data recording time of 100 s and number of accumulations of two times. The peak top wavenumbers of the G and D bands, the peak top wave number of the D band, FWHMs, and peak intensities were determined from the obtained spectra. In general, the intensity of the D band weakened compared with the results of visible Raman scattering spectroscopy.

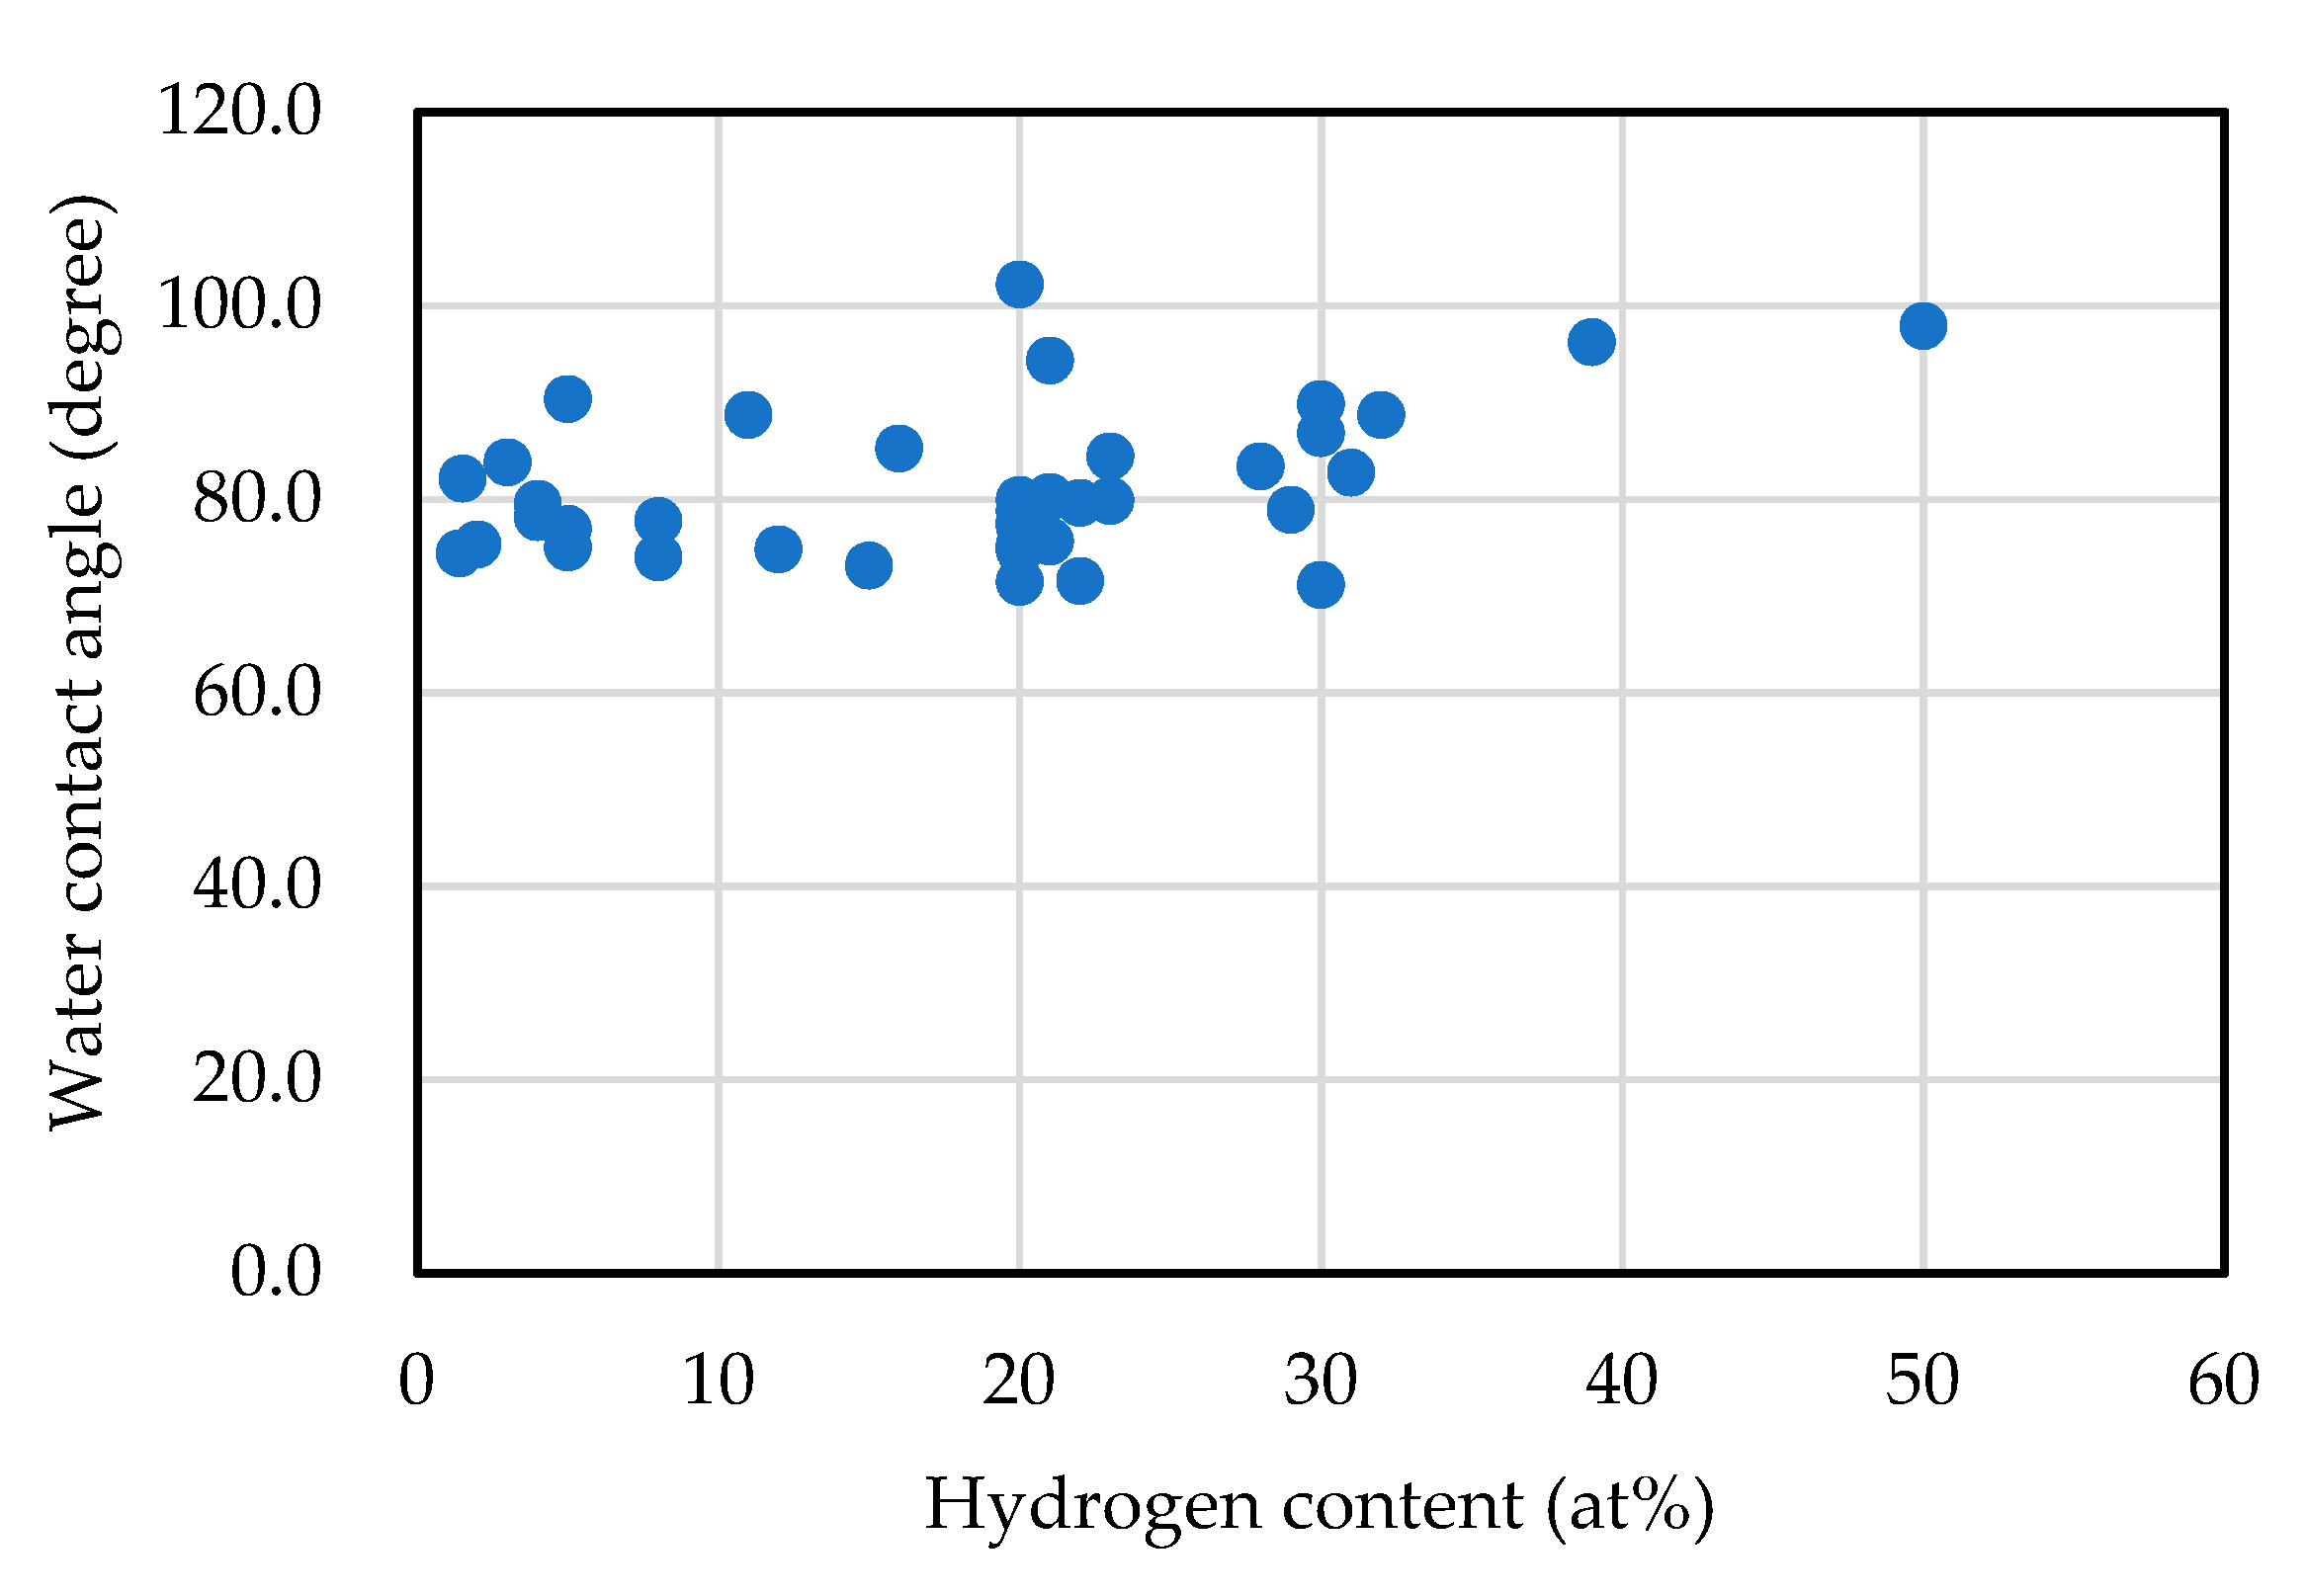
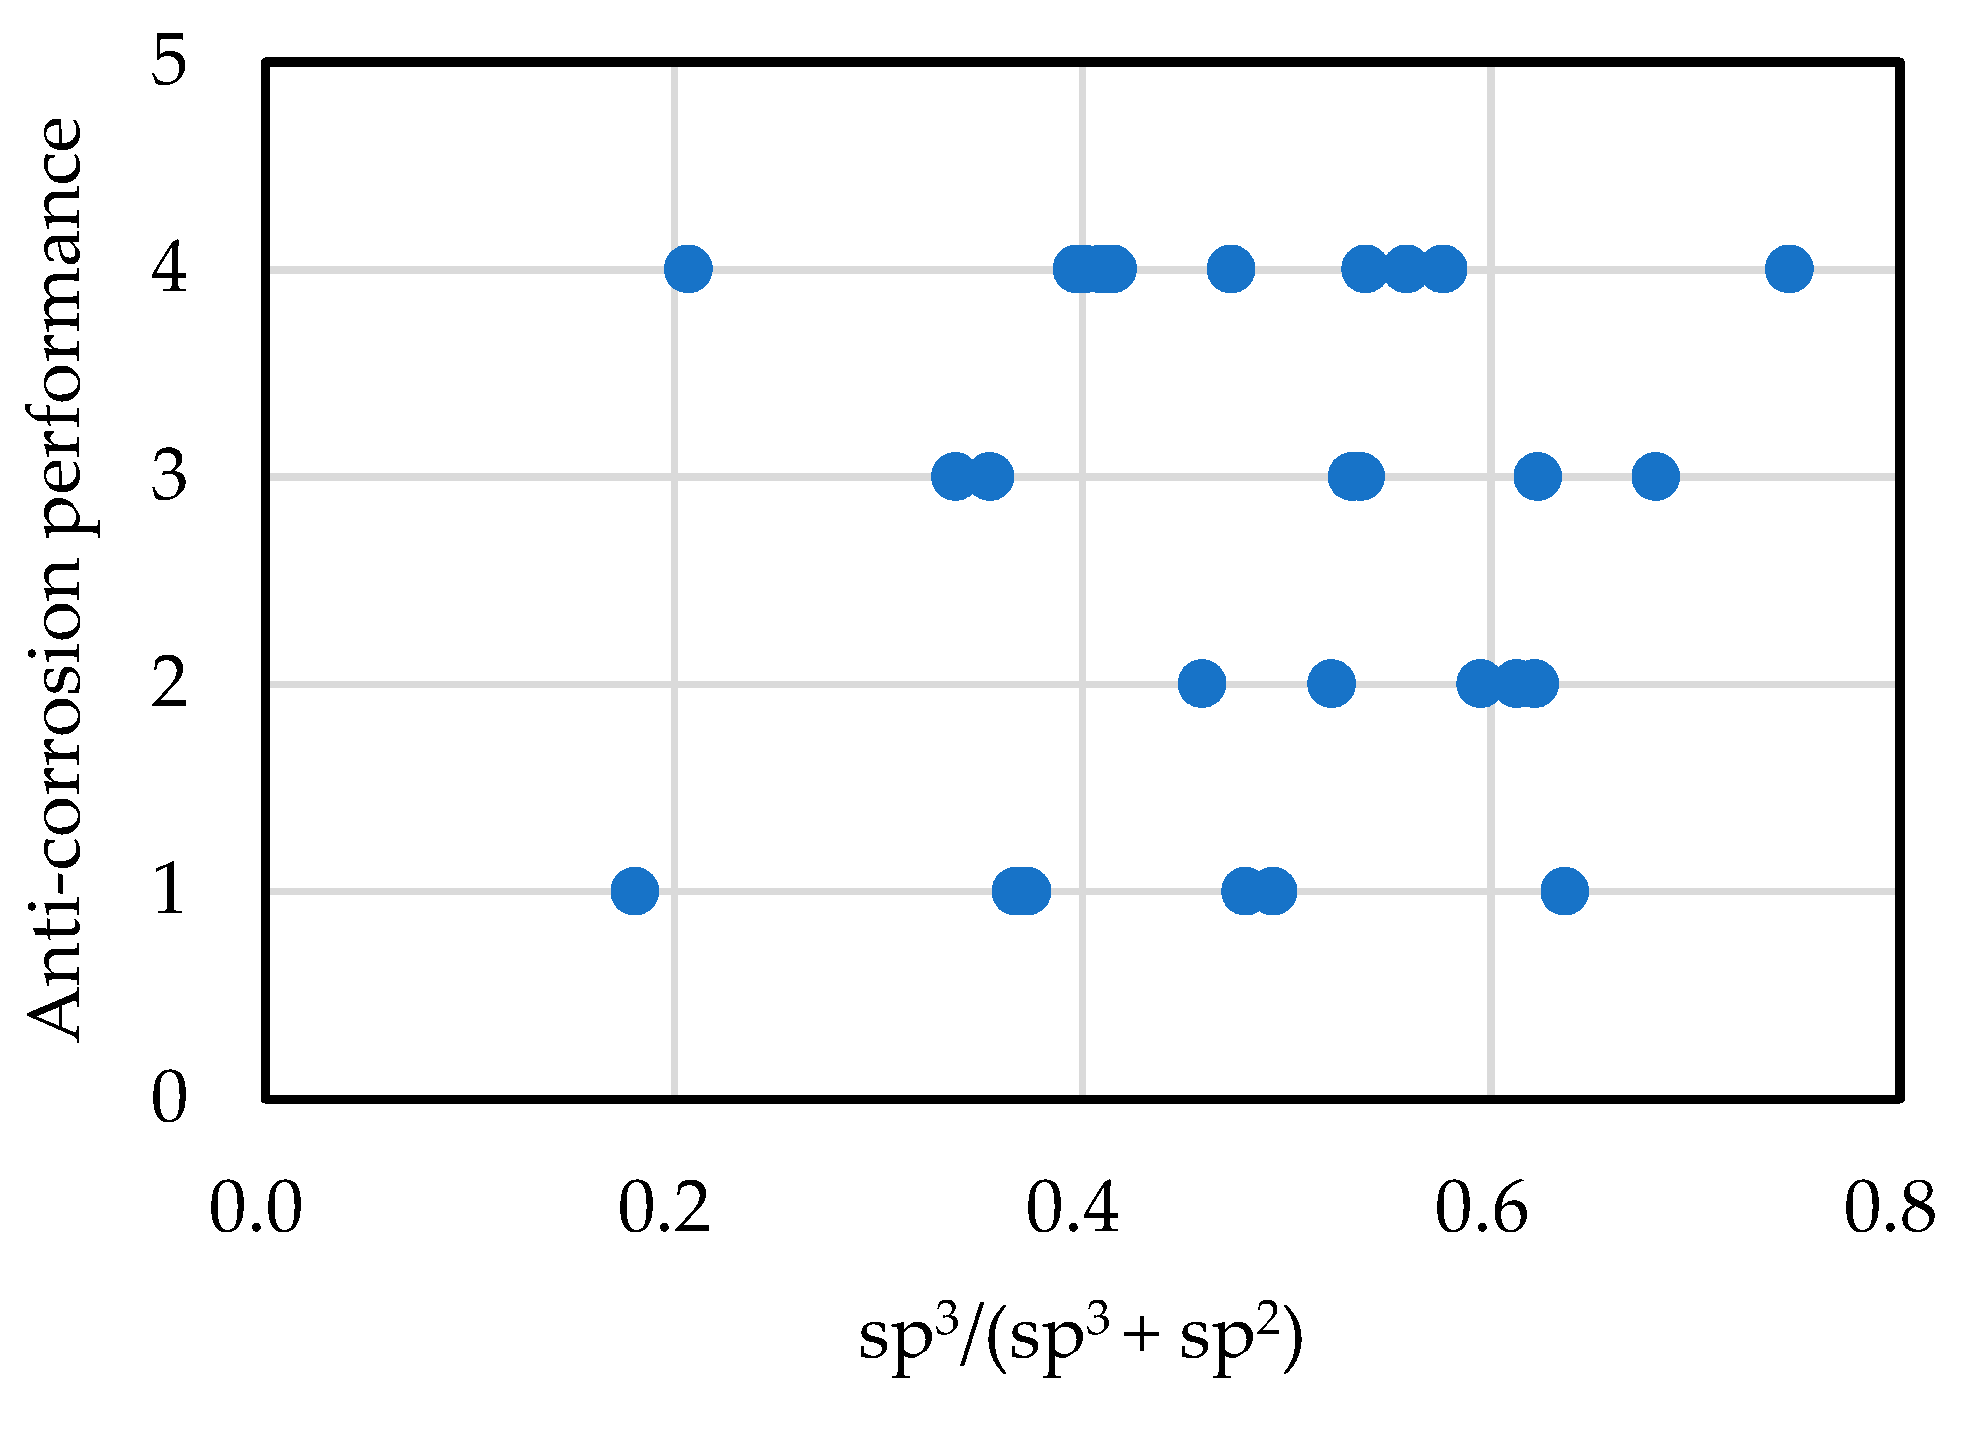
2.7. Static Contact Angle of Water Drop and Corrosion Characteristics

The static contact angle of water droplets and acid corrosion resistance were calculated to evaluate the chemical properties of amorphous carbon films. The static water droplet contact angle was measured with the conditions shown in Table 1 using a KRUSS DSA 10-MK2 drop shape analyzer (DSA) for Windows 9x/NT 4/2000 DSA version 1.70.0.81. This was calculated 10 times for one water droplet (once per second), and its average value was then calculated.
Acid corrosion resistance was also evaluated using the corrosion test with concentrated nitric acid. Graphite reacted with nitric acid to produce mellitic acid [68]. Thus, etching should be easier with more graphite components. Hence, we conducted corrosion experiments on the amorphous carbon films. The evaluated samples were amorphous carbon films (~500 nm) deposited on the surface of a 10 mm × 10 mm × 0.38 mm p-type Si (100) substrate. The concentration of concentrated nitric acid used was 60%. Si substrates on which the amorphous carbon films were deposited were heated on a hot plate (100 °C, 5 min). Then, 5 μL HNO3 (13.1 M) was dropped onto an amorphous carbon film and heated until it evaporated and disappeared (reference: ~5–5.5 min; there were differences among the films, and films with higher corrosion resistance had longer evaporation times). The substrate was then transferred onto an aluminum plate and cooled down. Surface observations were conducted using an optical microscope using 10× and 50× objective lenses. The corrosion resistance was qualitatively evaluated with the disappeared and unchanged films as 1 and 4, respectively.

3. Analysis and Testing Results

Table 2 lists the analysis and test results of 35 types of PVD-deposited films and 39 types of CVD-deposited films for a total of 74 types of amorphous carbon films obtained in this study. Deposition methods are disclosed for 40 types of films; however, the methods are not clear in 20 types of CVD-grown films and 14 types of PVD-grown films. The true density of the films ranged from 1.09 to 3.15 g/cm3, with mean values of 1.86 and 2.37 g/cm3 for the CVD and PVD films, respectively, and an overall mean value of 2.07 g/cm3. The hydrogen composition ranged from 0.2 to 50 at% with an average of 16.2 at%. The hydrogen content was concentrated at ~20 at% in the film containing hydrogen. In addition, the refractive index (n) and extinction coefficient at 596 nm had ranges of 1.21–3.20 and 0–0.85, respectively. The optical band gap ranged from 0.17 to 1.78 eV with an average of 0.96 eV. The nano-indentation hardness was distributed between 0.83 and 54 GPa, with means of 16.2 and 25.5 GPa for the CVD and PVD films, respectively.
Carbon films were successfully analyzed utilizing Raman scattering spectroscopy during the early stage of the vapor phase synthesis of diamond [69]. Diamond and graphite had sharp peaks at 1333 and 1580 cm−1, respectively [70,71], whereas the amorphous carbon had broad peaks near 1500 cm−1. The D peak at ~1355 cm−1, which is characteristic of amorphic carbon, was the breathing mode of A1g symmetry due to phonons near the K zone boundary [72]; this has been thoroughly discussed in terms of the phonon dispersion [73]. In addition, the relationship between Raman spectroscopy and the physical properties of the film has been examined, e.g., the G-peak position decreases by a magnitude of one as the sp3 ratio increases, and then, it increases with a minimum sp3 ratio of ~20%; further, the Young’s modulus of the film is proportional to the G-peak dispersion [19,74,75,76]. In addition, the FWHM of the G peak increases when the grain size of sp2 decreases [77]. In UV Raman spectroscopy, the T peak due to the oscillation of the sp3 bond of C-C was found near 1060 cm−1 [78,79]. Table 3 lists the results of the visible and ultraviolet Raman spectroscopy analyses obtained herein. The T peak in the UV Raman spectroscopy was not considered herein, because clear waveform separation could not be achieved in many samples.
Figure 2 shows the relationship between the sp3 ratio obtained by NEXAFS and the I(D)/I(G) ratio obtained by visible and UV Raman spectroscopy. As described in previous studies [73], the sp3 ratio decreased with the I(D)/I(G) ratio, and the correlation coefficients were −0.474 and −0.517 for visible and ultraviolet Raman spectroscopy, respectively. UV Raman scattering spectroscopy had a higher correlation with the sp3 ratio than that with visible Raman scattering spectroscopy.
Next, Figure 3 shows the relationship between the G-peak position and G-peak FWHM from visible Raman and UV Raman spectroscopy, with nano-indentation hardness shown as bubble diameters. The results of visible Raman spectroscopic analysis in (a) reveal that the G-peak position tends to shift to the short-wavenumber side as the G-peak FWHM increases as a whole, whereas the hardness of the film typically increases when the G-peak FWHM and G-peak position increase. The results of UV Raman spectroscopy in (b) seem to show a tendency that the wavenumber of the G peak shifts to the long-wavenumber side with increasing FWHM; however, the G-peak position shifts to the short-wavenumber side as the G-peak FWHM increases, as observed in visible Raman spectroscopy. The four samples with the G-peak FWHM located at ≥175 cm−1 differed from the other samples. These four samples were tetrahedral amorphous carbon (ta-C) films prepared by the PVD method. The ta-C analyzed using UV Raman spectroscopy was distinct from the other films analyzed using visible Raman spectroscopy in terms of the G-peak position and G-peak FWHM plane. Both visible and UV Raman spectroscopy revealed that the hardness of the film was larger when the FWHM and G-peak positions were larger.
Figure 4 shows the variation in static water-drop contact angle of an amorphous carbon film with the hydrogen content. The static water-drop contact angle of diamond is 95.4° at the hydrogen termination, 0° at the oxygen termination, and 86° at (0001) of graphite. By contrast, the measured contact angle of the amorphous carbon film is widely distributed from 71° to 102°. Based on the figure, the water droplet contact angle and hydrogen concentration were weakly correlated, with a correlation coefficient of 0.40. For example, a large static water droplet contact angle of ~130° was reported in films with added fluoride [80]. The surface properties including the static water droplet contact angle were more influenced by the introduction of a third element or surface post-treatment [81,82,83], rather than the sp3 ratio and hydrogen content of the amorphous carbon itself.
Then, we investigated the relationship between the acid corrosion resistance of the amorphous carbon film and sp3 ratio. Acid corrosion resistance was evaluated on a four-point scale. Films with an evaluation value of 1 revealed no acid corrosion resistance, primarily due to peeling of the film. By contrast, films with evaluation values of 2 and 3 exhibited partial corrosion, whereas films with an evaluation level of 4 exhibited no corrosion. Figure 5 shows the typical microscopic images of the samples with an evaluation value of 1–4. Partial corrosion was observed in level 3. Numerous corrosion pits were observed in level 2. The film almost disappeared in level 1.
Figure 6 depicts the relationship between corrosion resistance and the sp3 ratio. Large sp3 ratios are expected to suppress film corrosion from mellite reactions and increase corrosion resistance, but there was virtually no relationship between the sp3 ratio and corrosion resistance in practice. Corrosion resistance appears to be closely related to pinholes [84], micrometric growth defects [85], and dusts [86]. Notably, increasing the sp3 ratio and density during film application does not always result in improvements.
Figure 7 depicts the measurement results of the optical band gap and the relationships with the sp3 ratio of NEXAFS (a) and hydrogen content (b). The optical band gap is plotted between 0.17 and 1.78 eV, in good agreement with 1.5–1.9 eV [87] and 1.6–2.1 eV [88] in the previous study. The correlation coefficients were 0.258 and 0.402, respectively. The relationship between the optical band gap and the sp3 ratio was small, and there was a correlation with the hydrogen content. The correlation with the sp3 ratio was low because there were films with large amounts of hydrogen, even in high-sp3-ratio films. Figure 8 shows the relationship between the I(D)/I(G) ratio of each film derived from the visible Raman spectroscopic analysis and logarithm of the reciprocal of the band gap squared. The I(D)/I(G) ratio tended to decrease with the optical band gap. The offset was around 0.1–0.2, in good agreement with the previous work [19].

4. sp3 Ratio-Hydrogen Content-Based Classification of Amorphous Carbon

4.1. Classification of Amorphous Carbon

Figure 9 shows the NEXAFS spectra of various amorphous carbon films. The film in sample 65 exhibited a high sp3 peak, as observed in Figure 9a. The films in Figure 9b–e exhibited different hydrogen contents but had roughly equivalent NEXAFS spectra at an sp3 ratio of ~60%, thereby enabling the estimation of the sp3 ratio. Figure 9f depicts a film with a large hydrogen content (38 at%), but its spectrum is clear, and the sp3 ratio can be calculated; the sp3 ratio can be evaluated by NEXAFS, even if the hydrogen content changes. Therefore, the characteristics of amorphous carbon films can be organized using the NEXAFS-based sp3 ratio and hydrogen content as parameters. In Figure 10, the vertical and horizontal axes are the NEXAFS-based sp3 ratio and the hydrogen content (on a logarithmic scale), respectively. Further, the nano-indentation hardness is shown in terms of the bubble diameter. Films with large sp3 ratios and small hydrogen content exhibit large nano-indentation hardness values. The hardness was 10–25 GPa when the hydrogen content exceeded 10 at%. The nano-indentation hardness was not significantly high in regions with high hydrogen content, even when the sp3 ratio was large. Thus, it was difficult to predict the properties of amorphous carbon by estimating the sp3 ratio using NEXAFS, X-ray photoelectron spectroscopy (XPS) [89,90,91], and electron energy-loss near-edge structure [92]. Importantly, the estimation of hydrogen content played a crucial role in characterizing amorphous carbon. Further, the hard DLC films comprised small graphite clusters linked to a random network reinforced by high-density tetrahedrally coordinated carbon atoms [93]. The introduction of hydrogen resulted in a decreased number of tetrahedrally coordinated carbon atoms and decreased hardness.
Figure 11 shows the classification of amorphous carbon films by making similar plots on a ternary diagram. Although this classification was similar to that summarized by Robertson et al. [10], we achieved a clearer classification using data from 74 types of amorphous carbon analyzed in a single series by the same analyzer. In general, ta-C films are presumably free of hydrogen or have minimal amounts because, by definition, the tetrahedral structure predominantly contains σ bonds. Therefore, ta-C was considered the region where the sp3 ratio exceeded 50% and the hydrogen content was <~5 at%. Further, a-C was classified as the region where the sp3 ratio and hydrogen content were ≤50% and ≤5 at%, respectively. Figure 10 also depicts a clear separation between ta-C and a-C in terms of the nano-indentation hardness. The large region with an sp3 ratio and hydrogen content of <50% and >5 at%, respectively, was labeled as a-C:H if a large amount of hydrogen was introduced into a-C. Regions where hydrogen was introduced into ta-C could be expressed as ta-C:H in a manner similar to that of a-C:H. These four regions are all DLC, which may be classified as polymer-like carbon films in the cases where the hydrogen content is high (>~40 at%) and a linear chain structure is dominant. These films also exhibit small hardness values. However, there are also films with hardness values >9 GPa, even when the hydrogen contents exceed 40 at%. These films did not adopt a linear structure and were considered as a-C:H or ta-C:H.
Interestingly, a gap (5–20 at%) existed where the hydrogen content was not uniformly distributed. Hence, there are very few films with hydrogen contents of 5–20%. Tetrahedral structures with sp3 bonds as the skeleton were stabilized without hydrogen, adopting a structure with an a-C:H ratio of 3–4:1 when hydrogen is introduced into the DLC. However, it is difficult to distinctly determine this structure as the hydrogen content in the sp3 and sp2 domains are expected to differ [94,95].
We examined whether to include nanodiamonds within the range of DLC. Nanodiamonds produced by plasma CVD are considered as films comprising diamond particles (particle size: 5–20 nm) [96]. The diamond particles in this film were clearly observed by electron microscopy. Although no sp3 domains were observed in the ta-C, it is difficult to classify both as the same type.
Nanodiamond particles synthesized by the explosion or detonation method also usually exhibited an amorphous carbon and graphite layer around the diamond particles [97], with a nanocomposite appearance. Meanwhile, the static high-pressure synthesis method also involved the synthesis of high-purity sintered bodies made from nanodiamonds with particle sizes of ~10–30 nm [98,99]. ta-C has an upper limit of ~90% for the sp3 ratio compared to nanodiamonds with a low percent of amorphous component. In fact, the formation of ta-C films with high sp3 ratios of 80–88%, 79–83%, and 90–85% has been reported using the FCVA, IBD, and PLD methods, respectively [100].

4.2. Use of NMR Measurement Results

The plots of amorphous carbon films in Figure 11 are consistent with many previously published DLC studies that quantify sp3 bonds between C−C σ bonds and take their ratio to π bonds. On the other hand, the result of comparing the sp3 ratio of NMR and NEXAFS shows that the ratio of 1s → σ * and 1s → π * peaks of NEXAFS without C-H is a little larger or smaller compared with the -C ratio of NMR [101]. The correlation between them depends on the amount of hydrogen. Therefore, the ratio of -C and sp3(C)/(sp3(C) + sp2(C)) ratio will be estimated by correcting the sp3 ratio of NEXAFS using the amount of hydrogen.
The ratio of C to tetrahedrally coordinated C without -CHn (n = 1–3) as well as C-H is determined in the NMR analysis shown in Table 2.
g ( sp 3 ( C ) ) = sp 3 ( C ) sp 3 ( C ) + sp 2 ( C )
Even one hydrogen bond prevents it from being counted as sp3(C). Cases where hydrogen is 1–3-coordinated to the relevant C atom results in it being analyzed separately as sp3 (CH). The sp3(C) ratio g(sp3(C)) indicates the proximity of the film to the diamond.
The correlation coefficient between the sp3 ratio from NEXAFS and the g (sp3(C)) measured from NMR was high (0.893). The NMR value was lower and higher than the NEXAFS value when the hydrogen content in the film was high and low, respectively.
Therefore, a logarithmic curve approximation using the least squares method was applied to estimate g(sp3(C)) with the tetrahedral carbon structure from the NEXAFS data. NMR also takes the value of sp3(C)/(sp3(C) + sp2(C)) in polyethylene structures, thus becoming zero. However, NEXAFS assumes a certain positive value that reflects C–H bonds but does not become zero. Therefore, the boundary condition was set to a hydrogen content of 66.7 at% and (NMR: sp3(C)/(sp3(C) + sp2(C))/(NEXAFS: sp3/(sp3 + sp2)) = 0. The hydrogen content of six samples considered in this correction are 0.2, 0.3, 0.5, 0.75, 6, and 22 at%. These six samples cover the important region in Figure 10 and Figure 11, including a-C, ta-C, and a-C:H. Therefore, the NEXAFS corrected value/NEXAFS measured value was set to R, and the hydrogen content at% was set to CH.
R = (−0.22412961)ln(CH) + 0.9507233
The sp3(C)/(sp3(C) + sp2(C)) value after NEXAFS correction and the sp3(C)/(sp3(C) + sp2(C)) value due to NMR yielded a correlation coefficient of 0.986, which is a valid approximation. Thus, it was possible to predict g(sp3(C)) from the NEXAFS value. This correction was used to replot the measurement results using the sp3(C)/(sp3(C) +sp2(C)) ratio as the vertical axis, as depicted in Figure 12. The horizontal axis is the hydrogen content on a logarithmic scale. sp3(C)/(sp3(C) + sp2(C)) tended to decrease linearly with increased hydrogen content and decreased film hardness.

5. DLC Characteristics and Applications

Figure 13 shows the measurement results of the nanoindentation hardness and the relationships with the sp3 ratio (a) and sp3(C) ratio modified by the correction value R (b). The correlation coefficients were 0.305 and 0.709, respectively. The relationship between the nanoindentation hardness and the sp3 ratio was not large, and there was a strong correlation with the sp3(C) ratio.
In Figure 3, the hardness of the film was larger when the FWHM and G-peak positions were larger. Figure 14 depicts the influence of the hydrogen content on the G-peak position and the G-peak FWHM measured by visible and UV light Raman spectroscopic analyses. G-peak position as well as G-peak FWHM tended to decrease with the hydrogen content. These results led us to the idea that the hydrogen content has a significant effect to decrease film hardness. In fact, the nanoindentation hardness tended to decrease with hydrogen content, as spshown in Figure 15. The correlation coefficient was −0.487.
Next, the disordered structure in the amorphous carbon film is discussed to check a parameter that affects the film hardness besides the hydrogen content. The disordered structure in amorphous carbon films has been discussed utilizing Raman scattering spectroscopy [2,19,102,103]. The grain size of sp2 La is given by
L a   ( nm ) = ( 2.4 × 10 10 ) λ i 4 ( I D I G ) 1
where λ i is the laser line wavelength (nm) [104]. Figure 16 shows the relations between sp3(C)/(sp3(C) + sp2(C)) (a), hydrogen content (b), and nanoindentation hardness (c) of amorphous carbon films and the grain size of sp2 La. The value of La is independent of the laser line wavelength; however, the value derived from the I(D)/I(G) value measured by λ = 514 nm is approximately fivefold larger than that derived from the I(D)/I(G) value measured by λ = 325 nm. The sp3(C) ratio has a positive correlation with La, whereas the hydrogen content shows a negative correlation with La. The correlation coefficients were 0.576 and −0.332, respectively. Further, nanoindentation hardness exhibits a weak and positive correlation with La, with a correlation coefficient of 0.134. As a summary of the discussion on the hardness of the amorphous carbon film, sp3(C) ratio has a strong positive correlation with nanoindentation hardness, followed by a moderate negative correlation with hydrogen content. The grain size of sp2 La has a positive correlation with hardness, but its effect is small compared to the sp3 (C) ratio and the hydrogen content.
The mechanical properties of amorphous carbon films containing DLC varied with the large changes in the sp3 (C) ratio; nevertheless, it is reasonable to classify the amorphous carbon films using not the sp3(C) ratio but the sp3 ratio, as the classification in Figure 11 is consistent with many previously published DLC studies. When plotting the film with sp3(C) ratio without -CHn(n = 1–3), there is no film in the H > 5 at% and sp3 > 50% regions, as shown in Figure 12. This result of classification would be incompatible with the previously published DLC studies.
Table 4 summarizes the characteristics of amorphous carbon films and its applications by associating the results obtained in this study with the classifications described in Section 4. ta-C is used for various components including mechanical parts, automotive parts, machining tools, cutting tools, metal molds, hard disk heads, infrared transmission protective films, low-dielectric-constant materials, and insulating materials due to its high hardness. ta-C:H is used for various components such as mechanical parts, automotive parts, metal molds, hard disks, magnetic tapes, optical element coatings, and scissors owing to its relatively high hardness and low friction coefficient. a-C is used for components such as optical element coating; and a-C:H is used for components such as mechanical parts, biomedical material coating, sealing materials, gas barrier coating, low-dielectric-constant materials, and insulating materials. PLC is exclusively utilized for gas barrier coatings.

6. Conclusions

The sp3 ratio, hydrogen content, and other properties of 74 types of carbon films were investigated to classify the amorphous carbon films containing DLC. The sp3 ratio and hydrogen content were measured using NEXAFS and RBS-ERDA, respectively, under unified conditions. The results demonstrated that amorphous carbon existed across a wide range in the ternary diagrams of sp2, sp3, and H. Amorphous carbon was then divided into four DLC regions and one PLC region. The group plotted in the region where the sp3 ratio exceeded 50% and the hydrogen content was <5 at% was classified as ta-C, whereas the group plotted in the region where the sp3 ratio was <50% and the hydrogen content was <5 at% was classified as a-C. ta-C:H was classified as the region where the sp3 ratio exceeded 50% and a high hydrogen content. a-C:H was classified as the region where hydrogen was introduced into a-C. These were the four DLC regions. It was more reasonable to classify these as polymer-like carbon films, rather than as DLC films, at high hydrogen content (40 at%) in the presence of a linear structure. The films that can still possess hardness values over 9 GPa, even when the hydrogen contents exceed 40 at%, can be classified as ta-C:H or a-C:H; however, there is no linear structure. The hydrogen contents in the 74 types of films were not uniformly distributed; there was a gap between ~5 and 20 at%. The number of tetrahedrally coordinated C atoms was inversely proportional to the logarithm of the hydrogen content. The densities were distributed from 1.09 to 3.32 g/cm3. The means of the CVD and PVD films were 1.86 and 2.37 g/cm3, respectively, whereas the overall mean was 2.07 g/cm3. The hydrogen composition was distributed from 0.2 at% to 50 at%. The mean (16.2%) was concentrated in the films containing hydrogen at ~20 at%. The refractive index at 596 nm was 1.21–3.20, and the extinction coefficient ranged from 0 to 0.85. The optical band gap ranged from 0.17 to 1.78 eV, with an average of 0.96 eV. The nano-indentation hardness was distributed between 0.83 and 54 GPa, with means of 16.2 and 25.5 GPa for the CVD and PVD films, respectively. High sp3 ratios were expected to suppress film corrosion due to mellite reactions for corrosion resistance; however, in practice, this was almost unrelated to the sp3 ratio. The nano-indentation hardness of the films was typically large in the regions where both the G-peak FWHM and the G-peak position in Raman spectroscopy were large. This tendency was similar for both visible and UV Raman spectroscopy. The sp3 (C) ratio has a strong positive correlation with nanoindentation hardness, followed by a moderate negative correlation with hydrogen content. The change in grain size of sp2 La caused by disorder has a positive correlation with hardness, but its effect is limited.
In summary, the DLC films were classified based on the experimental results, and their characteristics and applications were clarified. Part of this work has been used to internationally standardize carbon films including DLC without disclosing data and was published as ISO20523:2017 [105]. The findings of this study are expected to serve as a basis for deriving the sp3 ratios and hydrogen content at high precision using XPS and glow discharge optical emission spectroscopy, respectively. DLC can be classified as biocompatible materials [106] on the plane of the refraction index and extinction coefficient [33], which will further develop the understanding and industrial applications of DLC films.

Author Contributions

N.O. designed the content and wrote this review discussing with M.H., K.K., H.A., M.T., K.H., A.H., T.O., H.I., M.K. and H.S. All authors read and agreed to the published version of the manuscript.

Funding

This research has been supported by the international standardization program of the Japanese Ministry of Economy, Trade and Industry in 2006, and from 2009 to 2020. The collaborative research entitled “Industrial standardization of DLC films and their evaluation techniques”, “Standardization of evaluation method of DLC films”, “International standardization of carbon films”, “Standardization of classification and evaluation method of carbon films”, and “International standardization of evaluation of optical properties and adhesion strength of DLC films” has been performed in 2006, 2009–2011, 2012–2013, 2014–2016, and 2017–2020, respectively, in this program. A part of evaluation in this work has been performed by JSPS KAKENHI Grant Number 16H02406.

Institutional Review Board Statement

Not applicable.

Informed Consent Statement

Not applicable.

Data Availability Statement

No new data were created or analyzed in this study. Data sharing is not applicable to this article.

Acknowledgments

The authors would like to thank the researchers in the universities and the companies who provided DLC coating samples for this research project. Thanks are also due to the corresponding persons in the Japanese Ministry of Economy, Trade and Industry, NEDO, Mitsubishi Research Institute, Nomura Research Institute. The authors acknowledge N. Fujimori at EDP, Y. Mitsuda at the University of Tokyo, H. Kawarada at Waseda University, H. Nakamori and C. Spindler at Naonotec, A. Tanaka at Diamond-Like Carbon Industry Association, T. Suzuki at Nagaoka University of Technology, Y. Ohgoe at Tokyo Denki University, K. Matsuda, Y. Miwa and K. Inoue at Toray Research Center, Jan Gäbler at Fraunhofer IST, Uwe Beck at BAM, Jűrgen Becker at Oerlikon Balzers Coating Germany, Soo-Wohn Lee and Gyawali Gobinda at ISO TC107 committee, J. Winkler at Deutsches Institut für Normung (DIN), Kwang-Ryeol Lee at the Korea Institute of Science and Technology, H. Takikawa at Toyohashi University of Technology, T. Nakamura and A. Korenaga at the National Institute of Advanced Industrial Science and Technology (AIST), Y. Mabuchi at Utsunomiya University, Y. Hirata at Tokyo Institute of Technology, and all the researchers working on standardization of DLC in Industrial Technology Research Institutes in Japan for their fruitful discussions throughout this work. The authors would like to thank Y. Sakamoto at the Chiba Institute of Technology, M. Sakurai and Y. Wasai at HORIBA, F. Hichiri at Fischer Instruments, M. Suzuki at JTEKT, N. Fujimaki at SGS Japan, H. Mori at Toyota Research Institute, T. Ito at Elionix, T. Hosen at RHESCA, and K. Uematsu at Nagaoka University of Technology for their assistance as members of the DLC standardization committee of Japan New Diamond Forum.

Conflicts of Interest

The authors declare no conflict of interest.

References

  1. Robertson, J. Diamond-like amorphous carbon. Mater. Sci. Eng. 2002, R 37, 129–281. [Google Scholar] [CrossRef] [Green Version]
  2. Ferrari, A.C.; Robertson, J. Interpretation of Raman spectra of disordered and amorphous carbon. Phys. Rev. 2000, B 61, 14095–14107. [Google Scholar] [CrossRef] [Green Version]
  3. McKenzie, D.R. Tetrahedral bonding in amorphous carbon. Rep. Prog. Phys. 1996, 59, 1611–1664. [Google Scholar] [CrossRef]
  4. Erdemir, A.; Donnet, C. Tribology of diamond-like carbon films: Recent progress and future prospects. J. Phys. D Appl. Phys. 2006, 39, R311. [Google Scholar] [CrossRef]
  5. Aisenberg, S.; Chabot, R. Ion-beam deposition of thin films of diamondlike carbon. J. Appl. Phys. 1971, 42, 2953–2958. [Google Scholar] [CrossRef]
  6. Gupta, B.K.; Bhushan, B. Micromechanical properties of amorphous carbon coatings deposited by different deposition techniques. Thin Solid Film. 1995, 270, 391–398. [Google Scholar] [CrossRef]
  7. Neuville, S. New application perspective for tetrahedral amorphous carbon coatings. Sci. Connect. 2014, 8, 1–27. [Google Scholar] [CrossRef]
  8. Donnet, C.; Fontaine, J.; Le Mogne, T.; Belin, M.; Heau, C.; Terrat, J.P.; Vaux, F.; Pont, G. Diamond-like carbon-based functionally gradient coatings for space tribology. Surf. Coat. Technol. 1999, 120–121, 548–554. [Google Scholar] [CrossRef]
  9. Kano, M. Super low friction of DLC applied to engine cam follower lubricated with ester-containing oil. Tribo. Int. 2006, 39, 1682–1685. [Google Scholar] [CrossRef]
  10. Weiler, M.; Sattel, S.; Jung, K.; Ehrhardt, H.; Veerasamy, V.S.; Robertson, J. Highly tetrahedral, diamond-like amorphous hydrogenated carbon prepared from a plasma beam source. Appl. Phys. Lett. 1994, 64, 2797–2799. [Google Scholar] [CrossRef]
  11. Angus, J.C.; Jansen, F. Dense "diamondlike" hydrocarbons as random covalent networks. J. Vat. Sci. Technol. 1988, A 6, 1778–1782. [Google Scholar] [CrossRef]
  12. Angus, J.C. Diamond and diamond-like films. Thin Solid Film. 1992, 216, 126–133. [Google Scholar] [CrossRef]
  13. Jacob, W.; Muller, W. On the structure of thin hydrocarbon films. Appl. Phys. Lett. 1993, 63, 1771–1773. [Google Scholar] [CrossRef]
  14. Bewilogua, K.; Hofmann, D. History of diamond-like carbon films—From first experiments to worldwide applications. Surf. Coat. Technol. 2014, 242, 214–225. [Google Scholar] [CrossRef]
  15. Reinke, P.; Jacob, W.; Möller, W. Influence of the ion energy on the growth and structure of thin hydrocarbon films. J. Appl. Phys. 1993, 74, 1354–1361. [Google Scholar] [CrossRef]
  16. Zhang, L.; Wei, X.; Lin, Y.; Wang, F. A ternary phase diagram for amorphous carbon. Carbon 2015, 94, 202–213. [Google Scholar] [CrossRef]
  17. Vetter, J. 60 years of DLC coatings: historical highlights and technical review of cathodic arc processes to synthesize various DLC types, and their evolution for industrial applications. Surf. Coat. Technol. 2014, 257, 213–240. [Google Scholar] [CrossRef]
  18. Robertson, J. Diamond-like carbon. Pure Appl. Chem. 1994, 66, 1789–1796. [Google Scholar] [CrossRef]
  19. Ferrari, A.C.; Robertson, J. Raman spectroscopy of amorphous, nanostructured, diamond-like carbon, and nanodiamond. Philos. Trans. R. Soc. Lond. 2004, A 362, 2477–2512. [Google Scholar] [CrossRef]
  20. Erdemir, A. The role of hydrogen in tribological properties of diamond-like carbon films. Surf. Coat. Technol. 2001, 146–147, 292–297. [Google Scholar] [CrossRef]
  21. Hirakuri, K.K.; Minorikawa, T.; Friedbacher, G.; Grasserbauer, M. Thin film characterization of diamond-like carbon films prepared by r.f. plasma chemical vapor deposition. Thin Solid Film. 1997, 302, 5–11. [Google Scholar] [CrossRef]
  22. Caschera, D.; Cossari, P.; Federici, F.; Kaciulis, S.; Mezzi, A.; Padeletti, G.; Trucchi, D. Influence of PE-CVD parameters on the properties of diamond-like carbon films. Thin Solid Film. 2001, 519, 4087–4091. [Google Scholar] [CrossRef]
  23. Isono, Y.; Namazu, T.; Terayama, N.; Tanaka, T. Mechanical characterization of sub-micrometer Thick DLC Films by AFM Tensile Testing for Surface Modification in MEMS. Proc. IEEE Micro Electro. Mech. Syst. 2002, 431–434. [Google Scholar] [CrossRef]
  24. Kim, Y.T.; Cho, S.M.; Choi, W.S.; Hong, B.; Yoon, D.H. Dependence of the bonding structure of DLC thin film on the deposition condition of PECVD method. Surf. Coat. Technol. 2003, 169, 291–294. [Google Scholar] [CrossRef]
  25. Nakahigashi, T.; Tanaka, Y.; Miyake, K.; Oohara, H. Properties of flexible DLC film deposited by amplitude-modulated RF P-CVD. Tribo. Int. 2004, 37, 907–912. [Google Scholar] [CrossRef]
  26. Ohtake, N.; Saito, T.; Kondo, Y.; Hosono, S.; Nakamura, Y.; Imanishi, Y. Synthesis of Diamond-like Carbon Films by Nanopulse Plasma Chemical Vapor Deposition at Subatmospheric Pressure. Jpn. J. Appl. Phys. 2004, 43, L1406–L1408. [Google Scholar] [CrossRef]
  27. Ohana, T.; Nakamura, T.; Suzuki, M.; Tanaka, A.; Koga, Y. Tribological properties and characterization of DLC films deposited by pulsed bias CVD. Diam. Relat. Mater. 2004, 13, 1500–1504. [Google Scholar] [CrossRef]
  28. Nakanishi, K.; Mori, H.; Tachikawa, H.; Itou, K.; Fujioka, M.; Funaki, Y. Investigation of DLC-Si coatings in large-scale production using DC-PACVD equipment. Surf. Coat. Technol. 2006, 200, 4277–4281. [Google Scholar] [CrossRef]
  29. Fujimoto, S.; Ohtake, N.; Takai, O. Mechanical properties of silicon-doped diamond-like carbon films prepared by pulse-plasma chemical vapor deposition. Surf. Coat. Technol. 2011, 206, 1011–1015. [Google Scholar] [CrossRef]
  30. Seker, Z.; Ozdamar, H.; Esen, M.; Esen, R.; Kavak, H. The effect of nitrogen incorporation in DLC films deposited by ECR Microwave Plasma CVD. Appl. Surf. Sci. 2014, 314, 46–51. [Google Scholar] [CrossRef]
  31. Chen, J.Y.; Wang, L.P.; Fu, K.Y.; Huang, N.; Leng, Y.; Leng, Y.X.; Yang, P.; Wang, J.; Wan, G.J.; Sun, H.; et al. Blood compatibility and sp3/sp2 contents of diamond-like carbon (DLC) synthesized by plasma immersion ion implantation-deposition. Surf. Coat. Technol. 2002, 156, 289–294. [Google Scholar] [CrossRef]
  32. Flege, S.; Hatada, R.; Ensinger, W.; Baba, K. Improved adhesion of DLC films on copper substrates by preimplantation. Surf. Coat. Technol. 2014, 256, 37–40. [Google Scholar] [CrossRef]
  33. Hiratsuka, M.; Nakamori, H.; Kogo, Y.; Sakurai, M.; Ohtake, N.; Saitoh, H. Correlation between Optical Properties and Hardness of Diamond-Like Carbon Films. Solid Mech. Mater. Eng. 2013, 7, 187–198. [Google Scholar] [CrossRef] [Green Version]
  34. Bewilogua, K.; Wittorf, R.; Thomsen, H.; Weber, M. DLC based coatings prepared by reactive d.c. magnetron sputtering. Thin Solid Film. 2004, 447–448, 142–147. [Google Scholar] [CrossRef]
  35. Chen, S.-Y.; Ou, K.-L.; Huang, W.-C.; Chu, K.-T.; Ou, S.-F. Phase transformation of diamond-like carbon/silver composite films by sputtering deposition. Ceram. Int. 2013, 39, 2575–2580. [Google Scholar] [CrossRef]
  36. Fujimaki, S.; Kashiwase, H.; Kokaku, Y. New DLC coating method using magnetron plasma in an unbalanced magnetic field. Vacuum 2000, 59, 657–664. [Google Scholar] [CrossRef]
  37. Amanovn, A.; Watabe, T.; Tsuboi, R.; Sasaki, S. Fretting wear and fracture behaviors of Cr-doped and non-doped DLC films deposited on Ti–6al–4V alloy by unbalanced magnetron sputtering. Tribo. Int. 2013, 62, 49–57. [Google Scholar] [CrossRef]
  38. Kamijo, E.; Nakamura, T.; Tani, Y. AFM observations of DLC films prepared by the ECR sputtering method. Nucl. Instr. Methods Phys. Res. 1997, B 121, 110–115. [Google Scholar] [CrossRef]
  39. Pang, J.; Lu, W.; Xin, Y.; Wang, H.; He, J.; Xu, J. Plasma Diagnosis for Microwave ECR Plasma Enhanced Sputtering Deposition of DLC Films. Plasma Sci. Technol. 2012, 14, 172–176. [Google Scholar] [CrossRef]
  40. Münz, W.-D.; Schenkel, M.; Kunkel, S.; Paulitsch, J.; Bewilogua, K. Industrial Applications of HIPIMS. J. Phys. Conf. Ser. 2008, 100, 082001. [Google Scholar] [CrossRef]
  41. Evaristo, M.; Fernandes, F.; Cavaleiro, A. Room and High Temperature Tribological Behaviour of W-DLC Coatings Produced by DCMS and Hybrid DCMS-HiPIMS Configuration. Coatings 2020, 10, 319. [Google Scholar] [CrossRef] [Green Version]
  42. Xu, S.; Tay, B.K.; Tan, H.S.; Zhong, L.; Tu, Y.Q.; Silva, S.R.P.; Milne, W.I. Properties of carbon ion deposited tetrahedral amorphous carbon films as a function of ion energy. J. Appl. Phys. 1996, 79, 7234–7240. [Google Scholar] [CrossRef]
  43. Inaba, H.; Fujimaki, S.; Sasaki, S.; Hirano, S.; Todoroki, S.; Furusawa, K.; Yamasaka, M.; Shi, X. Properties of Diamond-Like Carbon Films Fabricated by the Filtered Cathodic Vacuum Arc Method. Jpn. J. Appl. Phys. 2002, 41, 5730–5733. [Google Scholar] [CrossRef]
  44. Takikawa, H.; Izumi, K.; Miyano, R.; Sakakibara, T. DLC thin film preparation by cathodic arc deposition with a super droplet-free system. Surf. Coat. Technol. 2003, 163–164, 368–373. [Google Scholar] [CrossRef]
  45. Kondo, S.; Liza, S.; Ohtake, N.; Akasaka, H.; Matsuo, M.; Iwamoto, Y. Mechanical characterization of segment-structured hydrogen-free a-C films fabricated by filtered cathodic vacuum arc method. Surf. Coat. Technol. 2015, 278, 71–79. [Google Scholar] [CrossRef]
  46. Weissmantel, C.; Reisse, G. Preparation of hard coatings by ionbeam methods. Thin Solid Film. 1979, 63, 315–325. [Google Scholar] [CrossRef]
  47. Akita, N.; Konishi, Y.; Ogura, S.; Imamura, M.; Hu, Y.H.; Shi, X. Comparison of deposition methods for ultra thin DLC overcoat film for MR head. Diam. Relat. Mater. 2001, 10, 1017–1023. [Google Scholar] [CrossRef]
  48. Roy, R.K.; Ahmed, S.F.; Yi, J.W.; Moon, M.-W.; Lee, K.-R.; Jun, Y. Improvement of adhesion of DLC coating on nitinol substrate by hybrid ion beam deposition technique. Vacuum 2009, 83, 1179–1183. [Google Scholar] [CrossRef]
  49. Oohira, K. Characteristics and Applications of DLC films. NTN Tech. Rev. 2009, 77, 90–95. [Google Scholar]
  50. Lan, R.; Ma, Z.; Wang, C.; Lu, G.; Yuan, Y.; Shi, C. Microstructural and tribological characterization of DLC coating by in-situ duplex plasma nitriding and arc ion plating. Diam. Relat. Mater. 2019, 98, 107473. [Google Scholar] [CrossRef]
  51. Panda, M.; Krishnan, R.; Krishna, N.G.; Amirthapandian, S.; Magudapathy, P.; Kamruddin, M. Tuning the tribological property of PLD deposited DLC-Au nanocomposite thin films. Ceram. Int. 2019, 45, 8847–8855. [Google Scholar] [CrossRef]
  52. Scheibe, H.-J.; Schultrich, B. DLC film deposition by Laser-Arc and study of properties. Thin Solid Film. 1994, 246, 92–102. [Google Scholar] [CrossRef]
  53. Wu, J.-B.; Chen, C.-Y.; Shin, C.-T.; Li, M.-Y.; Leu, M.-S.; Li, A.-K. Microstructure and physical properties of DLC films deposited by laser induced high current pulsed arc deposition. Thin Solid Film. 2008, 517, 1141–1145. [Google Scholar] [CrossRef]
  54. VDI 2840 Carbon Films—Basic Knowledge, Film Types and Properties; Verein Deuttscher Ingennieure: Dusseldorf, Germany, 2005.
  55. Grill, A.; Patel, V.V. Characterization of diamondlike carbon by infrared spectroscopy? Appl. Phys. Lett. 1992, 60, 2089–2091. [Google Scholar] [CrossRef]
  56. Grill, A.; Patel, V.V.; Meyerson, B.S. Optical and tribological properties of heat-treated diamond-like carbon. J. Mater. Res. 1990, 5, 2531–2537. [Google Scholar] [CrossRef]
  57. Jacob, W.; Dürbeck, T.; Schwarz-Selinger, T.; Toussaint, U. Bonding States of Hydrogen in Plasma-Deposited Hydrocarbon Films. J. Carbon Res. 2020, 6, 3. [Google Scholar] [CrossRef] [Green Version]
  58. Kanda, K.; Shimizugawa, Y.; Haruyama, Y.; Yamada, I.; Matsui, S.; Kitagawa, T.; Tsubakino, H.; Gejo, T. NEXAFS study on substrate temperature dependence of DLC films formed by Ar cluster ion beam assisted deposition. Nucl. Instr. Methods Phys. Res. 2003, B 206, 880–883. [Google Scholar] [CrossRef]
  59. Kanda, K.; Suzuki, S.; Niibe, M.; Hasegawa, T.; Suzuki, T.; Saitoh, H. Local Structure Analysis on Si-Containing DLC Films Based on the Measurement of C K-Edge and Si K-Edge X-ray Absorption Spectra. Coatings 2020, 10, 330. [Google Scholar] [CrossRef] [Green Version]
  60. Grill, A.; Meyerson, B.S.; Patel, V.V.; Reimer, J.A.; Petrich, M.A. Inhomogeneous carbon bonding in hydrogenated amorphous carbon films. J. Appl. Phys. 1987, 61, 2874–2877. [Google Scholar] [CrossRef]
  61. DeLongchamp, D.M.; Kline, R.J.; Lin, E.K.; Fischer, D.A.; Richter, L.J.; Lucas, L.A.; Heeney, M.; McCulloch, I.; Northrup, J.E. High Carrier Mobility Polythiophene Thin Films: Structure Determination by Experiment and Theory. Adv. Mater. 2007, 19, 833–837. [Google Scholar] [CrossRef]
  62. Kim, T.-Y.; Lee, C.S.; Lee, Y.J.; Lee, K.-R.; Chae, K.-H.; Oh, K.H. Reduction of the residual compressive stress of tetrahedral amorphous carbon film by Ar background gas during the filtered vacuum arc process. J. Appl. Phys. 2007, 101, 023504. [Google Scholar] [CrossRef]
  63. Ohmagari, S.; Yoshitake, T.; Nagano, A.; Al-Riyami, S.; Ohtani, R.; Setoyama, H.; Kobayashi, E.; Nagayama, K. Near-Edge X-Ray Absorption Fine Structure of Ultrananocrystalline Diamond/Hydrogenated Amorphous Carbon Films Prepared by Pulsed Laser Deposition. J. Nanomater. 2009, 2009, 876561. [Google Scholar] [CrossRef] [Green Version]
  64. Al-Riyami, S.; Ohmagari, S.; Yoshitake, T. Nitrogen-Doped Ultrananocrystalline Diamond/Hydrogenated Amorphous Carbon Composite Films Prepared by Pulsed Laser Deposition. Appl. Phys. Exp. 2010, 3, 115102. [Google Scholar] [CrossRef]
  65. Hoffman, A.; Heiman, A.; Strunk, H.P.; Christiansen, S.H. Microstructure and phase composition evolution of nanocrystalline carbon films: dependence on deposition temperature. J. Appl. Phys. 2002, 91, 3336–3344. [Google Scholar] [CrossRef]
  66. Bustillo, K.C. Characterization of Amorphous Hydrogenated Carbon Using Solid-State Nuclear Magnetic Resonance Spectroscopy. Chem. Mater. 1990, 2, 202–205. [Google Scholar] [CrossRef]
  67. Metallic Materials—Instrumented Indentation Test for Hardness and Materials Parameters—Part 1: Test Method ISO 14577-1:2015; The International Organization for Standardization; Vernier: Geneva, Switzerland, 2015.
  68. Ferris, L.M. Mellitic Acid from the Oxidation of Graphite with 90% Nitric Acid. J. Chem. Eng. Data 1964, 9, 387–388. [Google Scholar] [CrossRef]
  69. Sato, Y.; Kamo, M.; Setaka, N. Raman Spectra of Carbons at 2600-3300 cm-1 Region. Carbon 1978, 16, 279–280. [Google Scholar] [CrossRef]
  70. Tuinstra, F.; Koenig, J.L. Raman Spectrum of Graphite. J. Chem. Phys. 1970, 53, 1126–1130. [Google Scholar] [CrossRef] [Green Version]
  71. Nemanich, R.J.; Solin, S.A. First- and second-order Raman scattering from finite-size crystals of graphite. Phys. Rev. 1979, B 20, 392–401. [Google Scholar]
  72. Thomsen, C.; Reich, S. Double resonant Raman scattering in graphite. Phys. Rev. 2000, 85, 5214–5217. [Google Scholar] [CrossRef]
  73. Castiglioni, C.; Tommasini, M.; Zerbi, G. Raman spectroscopy of polyconjugated molecules and materials: confinement effect in one and two dimensions. Phil. Trans. R. Soc. Lond. 2004, A 362, 2425–2459. [Google Scholar] [CrossRef]
  74. Okubo, H.; Tadokoro, C.; Hirata, Y.; Sasaki, S. In situ Raman observation of the graphitization process of tetrahedral amorphous carbon under boundary lubrication in poly-alpha-olefin with an organic friction modifier. Tribo. Online 2017, 12, 229–237. [Google Scholar] [CrossRef] [Green Version]
  75. Yoshikawa, M.; Nagai, N.; Matsuki, M.; Fukuda, H.; Katagiri, G.; Ishida, H.; Ishitani, A.; Nagai, I. Raman scattering from sp carbon clusters. Phys. Rev. 1992, B 46, 7169–7174. [Google Scholar] [CrossRef]
  76. Schwan, J.; Ulrich, S.; Batori, V.; Ehrhardt, H.; Silva, S.R.P. Raman spectroscopy on amorphous carbon films. J. Appl. Phys. 1996, 80, 440–447. [Google Scholar] [CrossRef] [Green Version]
  77. Ferrari, A.C.; Rodil, S.E.; Robertson, J. Interpretation of infrared and Raman spectra of amorphous carbon nitrides. Phys. Rev. 2003, B 67, 155306. [Google Scholar] [CrossRef] [Green Version]
  78. Racine, B.; Ferrari, A.C.; Morrison, N.A.; Hutchings, I.; Milne, W.I.; Robertson, J. Properties of amorphous carbon–silicon alloys deposited by a high plasma density source. J. Appl. Phys. 2001, 90, 5002–5012. [Google Scholar] [CrossRef] [Green Version]
  79. Gilkes, K.W.R.; Prawer, S.; Nugent, K.W.; Robertson, J.; Sands, H.S.; Lifshitz, Y.; Shi, X. Direct quantitative detection of the sp3 bonding in diamond-like carbon films using ultraviolet and visible Raman spectroscopy. J. Appl. Phys. 2000, 87, 7283. [Google Scholar] [CrossRef]
  80. Hasebe, T.; Nagashima, S.; Kamijo, A.; Moon, M.-W.; Kashiwagi, Y.; Hotta, A.; Lee, K.-R.; Takahashi, K.; Yamagami, T.; Suzuki, T. Hydrophobicity and non-thrombogenicity of nanoscale dual rough surface coated with fluorine-incorporated diamond-like carbon films: Biomimetic surface for blood-contacting medical devices. Diam. Relat. Mater. 2013, 38, 14–18. [Google Scholar] [CrossRef]
  81. Ha, S.-W.; Hauert, R.; Ernst, K.-H.; Wintermantel, E. Surface analysis of chemically-etched and plasma-treated polyetheretherketone (PEEK) for biomedical applications. Surf. Coat. Technol. 1997, 96, 293–299. [Google Scholar] [CrossRef]
  82. Roy, R.K.; Choi, H.-W.; Park, S.-J.; Lee, K.-R. Surface energy of the plasma treated Si incorporated diamond-like carbon films. Diam. Relat. Mater. 2007, 16, 1732–1738. [Google Scholar] [CrossRef] [Green Version]
  83. Jongwannasiri, C.; Watanabe, S. Surface energy of the plasma treated Si incorporated diamond-like carbon films. J. Surf. Finish. Soc. Jpn. 2014, 65, 77–80. [Google Scholar] [CrossRef]
  84. Karan, S.; Samitsu, S.; Peng, X.; Kurashima, K.; Ichinose, I. Ultrafast Viscous Permeation of Organic Solvents Through Diamond-Like Carbon Nanosheets. Science 2012, 335, 444–447. [Google Scholar] [CrossRef] [PubMed]
  85. Maerten, T.; Jaoul, C.; Oltra, R.; Duport, P.; Niniven, C.; Tristant, P.; Meunier, F.; Jarry, O. Micrometric Growth Defects of DLC Thin Films. J. Carbon Res. 2019, 5, 73. [Google Scholar] [CrossRef] [Green Version]
  86. Maerten, T.; Oltra, R.; Jaoul, C.; Le Niniven, C.; Tristant, P.; Meunier, F.; Jarry, O. Investigation of diamond-like carbon coated steel corrosion: Enhancing the optical detection of defects by a controlled electrochemical activation. Surf. Coat. Technol. 2019, 363, 334–351. [Google Scholar] [CrossRef]
  87. Silva, R.S.R.P.; Amaratunga, G.A.J. The optical properties of band-gap-modulated diamond-like carbon thin films. Diam. Relat. Mater. 1994, 3, 817–820. [Google Scholar]
  88. Dai, H.Y.; Cheng, X.R.; Wang, C.F.; Xue, Y.C.; Chen, Z.P. Structural, optical and electrical properties of amorphous carbon filmsdeposited by pulsed unbalanced magnetron sputtering. Optik 2015, 126, 861–864. [Google Scholar] [CrossRef]
  89. Filik, J.; May, P.W.; Pearce, S.R.J.; Wild, R.K.; Hallam, K.R. XPS and laser Raman analysis of hydrogenated amorphous carbon films. Diam. Relat. Mater. 2003, 12, 974–978. [Google Scholar] [CrossRef]
  90. Yasui, N.; Inaba, H.; Sasaki, S. XPS study of ultrathin carbon films prepared by filtered cathodic vacuum arc. Surf. Sci. Nanotechnol. 2006, 4, 129–132. [Google Scholar] [CrossRef] [Green Version]
  91. Lesiak, B.; Kövér, L.; Tóth, J.; Zemek, J.; Jiricek, P.; Kromka, A.; Rangam, N. sp2/sp3 hybridisations in carbon nanomaterials – XPS and (X)AES study. Appl. Surf. Sci. 2018, 452, 223–231. [Google Scholar] [CrossRef]
  92. Diociaiuti, M.; Casciardi, S.; Sisto, R. The sp2 and sp3 fractions of unknown carbon materials: electronenergy-loss near-edge structure analysis of C-K spectra acquired under the magic-angle condition by the electron nanobeam technique. Micron. 2016, 90, 97–107. [Google Scholar] [CrossRef]
  93. Tamor, M.A.; Vassell, W.C.; Cardune, K.R. Atomic constraint in hydrogenated "diamond-like" carbon. Appl. Phys. Lett. 1991, 58, 592–594. [Google Scholar] [CrossRef]
  94. Takabayashi, S.; Okamoto, K.; Shimada, K.; Motomitsu, K.; Motoyama, H.; Nakatani, T.; Sakaue, H.; Suzuki, H.; Takahagi, T. Chemical Structural Analysis of Diamondlike Carbon Films with Different Electrical Resistivities by X-ray Photoelectron Spectroscopy. Jpn. J. Appl. Phys. 2008, 47, 3376–3379. [Google Scholar] [CrossRef] [Green Version]
  95. Wang, S.; Dong, Y.; He, C.; Gao, Y.; Jia, N.; Chen, Z.; Song, W. The role of sp2/sp3 hybrid carbon regulation in the nonlinear optical properties of graphene oxide materials. RSC Adv. 2017, 7, 53643–53652. [Google Scholar] [CrossRef] [Green Version]
  96. Tsugawa, K.; Ishihara, M.; Kim, J.; Hasegawa, M.; Koga, Y. Large-area and low-temperature nanodiamond coating by microwave plasma chemical vapor deposition. New Diam. Front. Carbon Technol. 2006, 16, 337–346. [Google Scholar]
  97. Shenderova, O.A.; Vlasov, I.I.; Turner, S.; Tendeloo, G.V.; Orlinskii, S.B.; Shiryaev, A.A.; Khomich, A.A.; Sulyanov, S.N.; Jelezko, F.; Wrachtrup, J. Nitrogen Control in Nanodiamond Produced by Detonation Shock-Wave-Assisted Synthesis. J. Phys. Chem. 2011, C 115, 14014–14024. [Google Scholar] [CrossRef]
  98. Isobe, F.; Ohfuji, H.; Sumiya, H.; Irifune, T. Nanolayered Diamond Sintered Compact Obtained by Direct Conversion from Highly Oriented Graphite under High Pressure and High Temperature. J. Nanomater. 2013, 380165. [Google Scholar] [CrossRef] [Green Version]
  99. Sumiya, H.; Irifune, T. Indentation hardness of nano-polycrystalline diamond prepared from graphite by direct conversion. Diam. Relat. Mater. 2004, 13, 1771–1776. [Google Scholar] [CrossRef]
  100. Schultrich, B. Tetrahedrally Bonded Amorphous Carbon Films I: Basics, Structure and Preparation; Springer: Berlin/Heidelberg, Germany, 2018; pp. 236–239. [Google Scholar]
  101. Zhou, X.L.; Tunmee, S.; Suzuki, T.; Phothongkam, P.; Kanda, K.; Komatsu, K.; Kawahara, S.; Ito, H.; Saitoh, H. Quantitative NEXAFS and solid-state NMR studies of sp3/(sp2+sp3) ratio in the hydrogenated DLC films. Diam. Relat. Mater. 2017, 73, 232–240. [Google Scholar] [CrossRef]
  102. Pardanaud, C.; Cartry, G.; Lajaunie, L.; Arenal, R.; Buijnsters, J.G. Investigating the Possible Origin of Raman Bands in Defective sp2/sp3 Carbons below 900 cm-1:Phonon Density of States or Double Resonance Mechanism at Play? J. Carbon Res. 2019, 5, 79. [Google Scholar] [CrossRef] [Green Version]
  103. Puech, P.; Plewa, J.M.; Mallet-Ladeira, P.; Monthioux, M. Spatial confinement model applied to phonons in disordered graphene-based carbons. Carbon 2016, 105, 275–281. [Google Scholar] [CrossRef]
  104. Cançado, L.G.; Takai, K.; Enoki, T.; Endo, M.; Kim, Y.A.; Mizusaki, H.; Jorio, A.; Coelho, L.N.; Magalhães-Paniago, R.; Pimenta, M.A. General equation for the determination of the crystallite size La of nanographite by Raman spectroscopy. Appl. Phys. Lett. 2006, 88, 163106. [Google Scholar] [CrossRef]
  105. Carbon Based Films—Classification and Designations ISO 20523:2017; The International Organization for Standardization; Vernier: Geneva, Switzerland, 2017.
  106. Ohgoe, Y.; Hirakuri, K.K.; Saitoh, H.; Nakahigashi, T.; Ohtake, N.; Hirata, A.; Kanda, K.; Hiratsuka, M.; Fukui, Y. Classification of DLC films in terms of biological response. Surf. Coat. Technol. 2012, 207, 350–354. [Google Scholar] [CrossRef]
Figure 1. Near-edge X-ray absorption fine structure (NEXAFS) spectrum of diamond-like carbon (DLC) measured at a magic angle of 54.7°.
Materials 14 00315 g001
Figure 2. sp3 ratio of amorphous carbon films vs. I(D)/I(G) ratio of each film derived from (a) visible and (b) UV light Raman spectroscopic analyses.
Materials 14 00315 g002
Figure 3. Nano-indentation hardness of amorphous carbon films plotted on the plane consisting of G-peak position and G-peak FWHM measured by (a) visible and (b)ultraviolet (UV) light Raman spectroscopic analyses.
Materials 14 00315 g003
Figure 4. Water contact angle vs. hydrogen content of amorphous carbon films.
Materials 14 00315 g004
Figure 5. Typical optical microscopic images of samples evaluated as levels 4, 3, 2, and 1 in the anti-corrosion test of amorphous carbon films.
Materials 14 00315 g005
Figure 6. Relationship between the anti-corrosion performance and sp3 ratio of amorphous carbon films.
Materials 14 00315 g006
Figure 7. Influence of (a) sp3 ratio and (b) hydrogen content on the optical band gap of amorphous carbon films. The correlation coefficients for (a) and (b) are 0.258 and 0.402, respectively.
Materials 14 00315 g007
Figure 8. I(D)/I(G) ratio of each film derived from visible Raman spectroscopic analysis vs. logarithm of 1/(gap)2.
Materials 14 00315 g008
Figure 9. NEXAFS spectra of six types of amorphous carbon films. Each sample number listed here corresponds to sample number in Table 2.
Materials 14 00315 g009
Figure 10. Distribution of 74 types of amorphous carbon films on the sp3 ratio–logarithmic hydrogen content plane. The diameter of the circle corresponds to the nanoindentation hardness of each amorphous carbon film.
Materials 14 00315 g010
Figure 11. Distribution of 74 types of amorphous carbon films on the ternary diagram. The diameter of the circle corresponds to the nanoindentation hardness of each amorphous carbon film.
Materials 14 00315 g011
Figure 12. Distribution of 74 types of amorphous carbon films on the sp3(C) ratio–logarithmic hydrogen content plane after modifying the sp3 ratio derived by NEXAFS. Diameter of circle corresponds to the nanoindentation hardness of each amorphous carbon film.
Materials 14 00315 g012
Figure 13. Nanoindentation hardness vs. sp3 ratio (a) and sp3(C) ratio.
Materials 14 00315 g013
Figure 14. Influence of hydrogen content on the G-peak position and G-peak FWHM measured by (a) and (c) visible and (b) and (d) ultraviolet (UV) light Raman spectroscopic analyses.
Materials 14 00315 g014aMaterials 14 00315 g014b
Figure 15. Nanoindentation hardness vs. hydrogen content of amorphous carbon films.
Materials 14 00315 g015
Figure 16. Relations between sp3(C)/(sp3(C) + sp2(C)) (a), hydrogen content (b), and nanoindentation hardness (c) of amorphous carbon films and the grain size of sp2 La. The laser line wavelength λ is 514 nm.
Materials 14 00315 g016
Table 1. Measurement conditions of the water contact angle of amorphous carbon films.
Temperature, Humidity20 °C, 32%
LiquidUltra-pure water
Drop TypeNormal Sessile Drop
Water-drop Volume2 μL
Baseline TypeLinear
Evaluation methodCircle Fitting
Table 2. Analyses and test results of 74 types of amorphous carbon films: 35 films were deposited by PVD, and the other 39 films were deposited by CVD.
Sample NumberDeposition MethodTrue Density (g/cm3)Hydrogen (at. %)NEXAFS sp3/(sp2 + sp3)Nano-Indentation Hardness (GPa)NMR sp3/(sp2 + sp3)Refractive Index nExtinction Coefficient kOptical Band Gap (eV)Water Contact Angle (deg.)Thickness (nm) in True Density Measurement
1PECVD2220.53613.8NA2.190.021.3571.5NA
2PECVD1.85500.43614NA1.460.25NA97.9NA
3PECVD1.96230.42515.8NA1.220.190.8684.4NA
4PBII&D2280.61311.9NA3.590.56NA83.4NA
5PBII&D1.77120.4815.8NA2.040.370.874.8635
6PBII&D1.95210.62316NA2.120.380.6980.2596
7PECVD1.51110.57713NA1.840.370.7688.7NA
8PBII&D1.8680.18112.8NA2.090.420.5374NA
9PECVD1.71210.68111.2NA2.080.331.5794.31622
10PECVD1.95200.74614.3NA2.30.131.2177.7590
11PECVD2.1200.33820.1NA1.990.240.7775.2NA
12PECVD2.09200.45917NA1.980.240.9877.2559
13PECVD1.7300.50617.6NA2.140.171.2189.8838
14PECVD2.3220.35119.1NA3.20.6NA79.6NA
15PECVD1.59290.40115.3NA2.040.211.0778.9597
16PECVD1.5280.37319NA2.050.231.5777.7479
17PECVD2.04200.57617.8NA2.10.490.9779.9NA
18PECVD2.04200.42818.6NA1.890.520.774.7NA
19PECVD1.83320.47316.5NA2.160.12NA88.7504
20CVD1.86260.56224.8NA2.330.3NANA723
21CVD1.77280.60217.3NA2.180.19NANA474
22CVD1.71170.53120.3NA2.250.52NANA557
23CVD1.85250.55814.1NA2.270.22NANA639
24CVD1.91180.66417.8NA2.410.4NANA996
25CVD1.69190.50215.5NA2.290.47NANA524
26CVD1.73440.81617.1NA2.220.1NANA1215
27CVD1.73260.49917.9NA2.250.2NANA733
28CVD1.85190.55216.6NA2.320.42NANA567
29CVD1.78170.68613.7NA2.070.74NANA647
30CVD1.89150.71620.9NA2.370.46NANA506
31CVD1.93240.78120.8NA2.250.09NANA161
32CVD1.99260.69226.6NA2.350.44NANA571
33CVD1.78250.5787.2NANANANANA583
34CVD1.93210.5210.5NANANANANA1000
35CVD2.09190.62822.5NANANANANA403
36CVD2.1220.6116.90.1922.410.32NANA300
37CVD1.85250.6413.4NA2.280.27NANA211
38CVD2.06170.5819.2NA2.330.53NANA500
39CVD1.09380.610.83NA1.570NANA260
40AIP21.40.55917.1NA2.040.040.9674.4NA
41IE1.9220.53924.3NA1.290.141.1575.3532
42SP1.8140.3679.7NA1.640.341.1878.1NA
43AIP2.8150.59526.6NA2.080.04NA76.9NA
44IE2.37200.40919.7NA2.140.520.6971.4NA
45IE2.25150.35521.3NA1.210.250.7273.1435
46SP1.7390.62110.2NA1.990.081.3496.2588
47AIP3.3240.63626.1NA2.070.06NA79.5NA
48AIP2.15200.52219.9NA2.870.440.44102.2438
49AIP2.03300.20717.2NA2.540.051.7871.1571
50SP2.33160.50622.4NA2.340.85NA85.2NA
51SP1.8200.5329.3NA1.370.25NA78.8NA
52PLD2.23230.49322.4NA2.180.330.7879.8NA
53SP1.8930.4158.6NA1.480.380.583.8NA
54AIP250.59113.4NA2.490.140.7290.3NA
55AIP3.1550.57247.1NA2.650.11.0775356
56SP1.391.50.15111.2NA2.050.760.1782.1NA
57IBD2.12310.15120.9NANANANA82.7NA
58IE2.03210.39723.8NA2.330.28NA75.6NA
59IE1.85300.5928NA1.250.161.3486.8NA
60PVD2.3710.80430.6NA2.660.4NANA321
61PVD2.680.50.70325.9NA2.590.18NANA189
62PVD2.220.66419.8NANANANANA256
63PVD2.510.750.64628NA2.740.3NANA246
64PVD2.880.30.71832.6NA2.710.1NANA195
65PVD3.040.70.67437.9NANANANANA290
66PVD3.120.20.66941.4NA2.640.04NANA500
67PVD2.950.50.53231NA2.710.27NANA415
68PVD2.990.30.53530.9NA2.730.24NANA553
69PVD2.981.30.7515.6NANANANANA68
70PVD1.7660.598.30.012.040.69NANA250
71PVD3.120.20.6741.30.901NANANANA464
72PVDNA0.50.703480.773NANANANANA
73PVDNA0.750.64647.10.692NANANANANA
74FCVANA0.30.718540.955NANANANANA
NA: Not available. PECVD: Plasma-enhanced CVD. PBII&D: Plasma-based ion implantation and deposition. AIP: Arc ion plating. IE: Ionized evaporation. SP: Sputtering. PLD: Pulsed laser deposition. IBD: Ion beam deposition. FCVA: Filtered cathodic vacuum arc.
Table 3. Results of the VIS and UV Raman spectroscopic analyses of 39 amorphous carbon films. The sample number in this table is the same as that in Table 2.
Sample NumberDeposition MethodD-Peak Position (λ = 514 nm)G-Peak Position (λ = 514 nm)D-Peak FWHM (λ = 514 nm)G-Peak FWHM (λ = 514 nm)I(D)/I(G) (λ = 514 nm)D-Peak Position (λ = 325 nm)G-Peak Position (λ = 325 nm)D-Peak FWHM (λ = 325 nm)G-Peak FWHM (λ = 325 nm)I(D)/I(G) (λ = 325 nm)
1PECVD1387.91559.6305.9122.10.7711396.21584.8299.199.30.422
2PECVD1379.71577.5288.593.21.09314001538289.884.10.598
3PECVD1387.71559.1302.3137.50.7061400.31582.5337.2115.20.523
5PBII&D1375.51549308.7143.40.7241403.91575.2378.7116.10.649
6PBII&D1378.11546.2321.3145.60.7391412.51573.6380.5122.10.71
7PECVD1371.61548.1299.9143.90.7471394.11573.1347.8118.10.641
8PBII&D1372.31548306.61430.81713941571.4350117.90.719
9PECVD13801553.3302135.90.7051406.41578.2351.7106.90.539
10PECVD1349.81515.6279.4145.50.4811381.51555378.5117.50.465
11PECVD1387.11560.4304.5129.70.8491399.31581.5403.31210.796
12PECVD1387.61560.8303.2126.90.7391385.41586.2382.3125.10.537
13PECVD1388.91560.7303.5124.60.6911388.31590.6374.2121.60.416
14PECVD1381.31555.4299.2141.60.6811392.31584.7413.2128.30.747
15PECVD1363.31545.6292.3144.50.5061390.81587.5381.4116.80.476
16PECVD1352.91543.5285.2156.10.3951373.91590386.1132.20.467
17PECVD1373.21555307.5159.60.4651396.31589.2389117.60.685
18PECVD1391.21563.1302.1137.80.8011400.91589.8405.61170.838
19PECVD1369.51548.9300.5142.90.4721394.91593363.9115.70.382
40AIP1377.91545.7329154.50.5951413.81578.5356.4125.80.611
41IE1361.11547.1312.91640.4171381.11587.3370.7141.70.396
42SP1384.41558.6292.7129.50.65614061596.2354.5940.53
43AIP1296.51549.9444.6206.60.2051297.51610.5416203.20.248
44IE1385.41553294.9137.70.8081403.91570.4366.5112.10.704
45IE1396.91566.9317.1138.10.8521406.41584352.4120.30.686
46SP1380.31548.8318.3130.60.6391396.21590320.194.40.349
47AIP1247.81547.4575211.40.2061297.51613.7374208.40.268
48AIP1383.21557.1310.6155.30.5421406.71587.4382.3130.90.521
49AIPPSFPSFPSFPSFPSF1400.51585.5363.8123.40.563
50SP1387.41561.6321.3133.71.067PSFPSFPSFPSFPSF
51SP1392.41568.6308.8121.91.111412.91581.3347.4101.90.731
52PLD1367.21532.8288.2169.20.481410.21566.7442.6129.41.186
53SP1400.51590325.286.81.2771424.81599.1377.986.40.907
54AIP1404.81560212.9176.70.3241322.71614.6370.3189.10.273
55AIP1360.31562.2391.5199.60.2231270.81608.8334.8240.60.508
56SP1390.31567.6311.1132.51.46314011577.3427.8117.41.541
57IBD1385.11559.8300.3138.80.7141394.71589.6432.4128.60.791
58IE1372.21554.5302157.10.5021387.11593.8407.2135.90.616
59IE1368.81554.7291.9159.90.4451395.61597.8415.7139.70.609
PSF: Peak separation failed. PECVD: Plasma-enhanced CVD. PBII&D: Plasma-based ion implantation and deposition. AIP: Arc ion plating. IE: Ionized evaporation. SP: Sputtering. PLD: Pulsed laser deposition. IBD: Ion beam deposition.
Table 4. Classification of amorphous carbon films including DLC films, and those with industrial applications.
ClassificationDLCDLCDLCDLCnot DLC
Short nameta-Cta-C:Ha-Ca-C:HPLC
DesignationTetrahedral hydrogen-free amorphous carbon filmTetrahedral hydrogenated amorphous carbon filmHydrogen-free amorphous carbon filmHydrogenated amorphous carbon filmPolymer-like carbon
sp3/(sp3 + sp2) (%)50–9050–9010–5010–50-
H (at%)<55–50<55–5040–70
Deposition methodPVDPVD, CVD, PVD + CVDPVDCVD, PVD + CVDCVD, PVD
Deposition temperature (°C)RT-300RT-500RT-200RT-500RT-100
True density ρ (g/cm3) (as reference)3.5 > ρ > 2.62.6 > ρ > 2.01.7 > ρ > 1.42.0 > ρ > 1.4ρ < 1.4
Coefficient of friction vs. steel (dry cond.) (as reference)0.1–0.20.08–0.20.1–0.20.08–0.2Unstable
Wear resistance vs. steel (dry cond.)AB–ACB–A×
Nano-indentation hardness (HIT: GPa)25–909–359–259–250.5–9
Young’s modulus (GPa)200–900120–300100–400100–220~100
Corrosion resistanceB–AC–B×–CBB
Water contact angle (°) (as reference)70–8080–10070–10070–90~70
Refractive index n (λ = 550 nm)2.5–3.02.0–2.51.8–2.51.7–2.41.5–2.0
Extinction coefficient k (λ = 550 nm)0.04–0.50.05–0.60.1–0.60.05–0.6~0.1
Color
(500 nm in thick)
Transparent
(Interference color)
BrownBlackLight brownTransparent
Optical band gap (eV)0.2–1.71.0–2.51.0–1.70.5–2.0NA
A: Excellent; B: Good; C: Somewhat poor; ×: Poor; NA: Unknown.
Publisher’s Note: MDPI stays neutral with regard to jurisdictional claims in published maps and institutional affiliations.

