
Evaluation of Various Surface Cleaning Techniques Inside Tunnels on Pavement Skid Resistance


Abstract
:1. Introduction
1.1. Objective
1.2. Project Background
2. Research Methodology
2.1. Laboratory Study
2.2. Field Study
3. Antecedents and Experimental Design
- Traffic: Acceleration and deceleration lanes were not included due to the variability of the SR values in the same location caused by the constant braking of the vehicles. Sections with almost constant volume and speed were selected;
- Length: Each section has a minimum length of 200–250 m;
- Lane location: Due to the high traffic volume inside the tunnel, only the right lane was tested to minimize the impact on the traffic;
- Referencing: Kilometer markers, or kiloposts, were used to indicate the begging and end of each section inside the tunnel;
- Pavement type: All sections selected have the same pavement type.
3.1. Sections Selected
3.2. Treatment Distribution
4. Results
4.1. Treatments General Response
4.2. Treatments Effect
4.3. Water Pressure
4.4. Sweeping
5. Findings
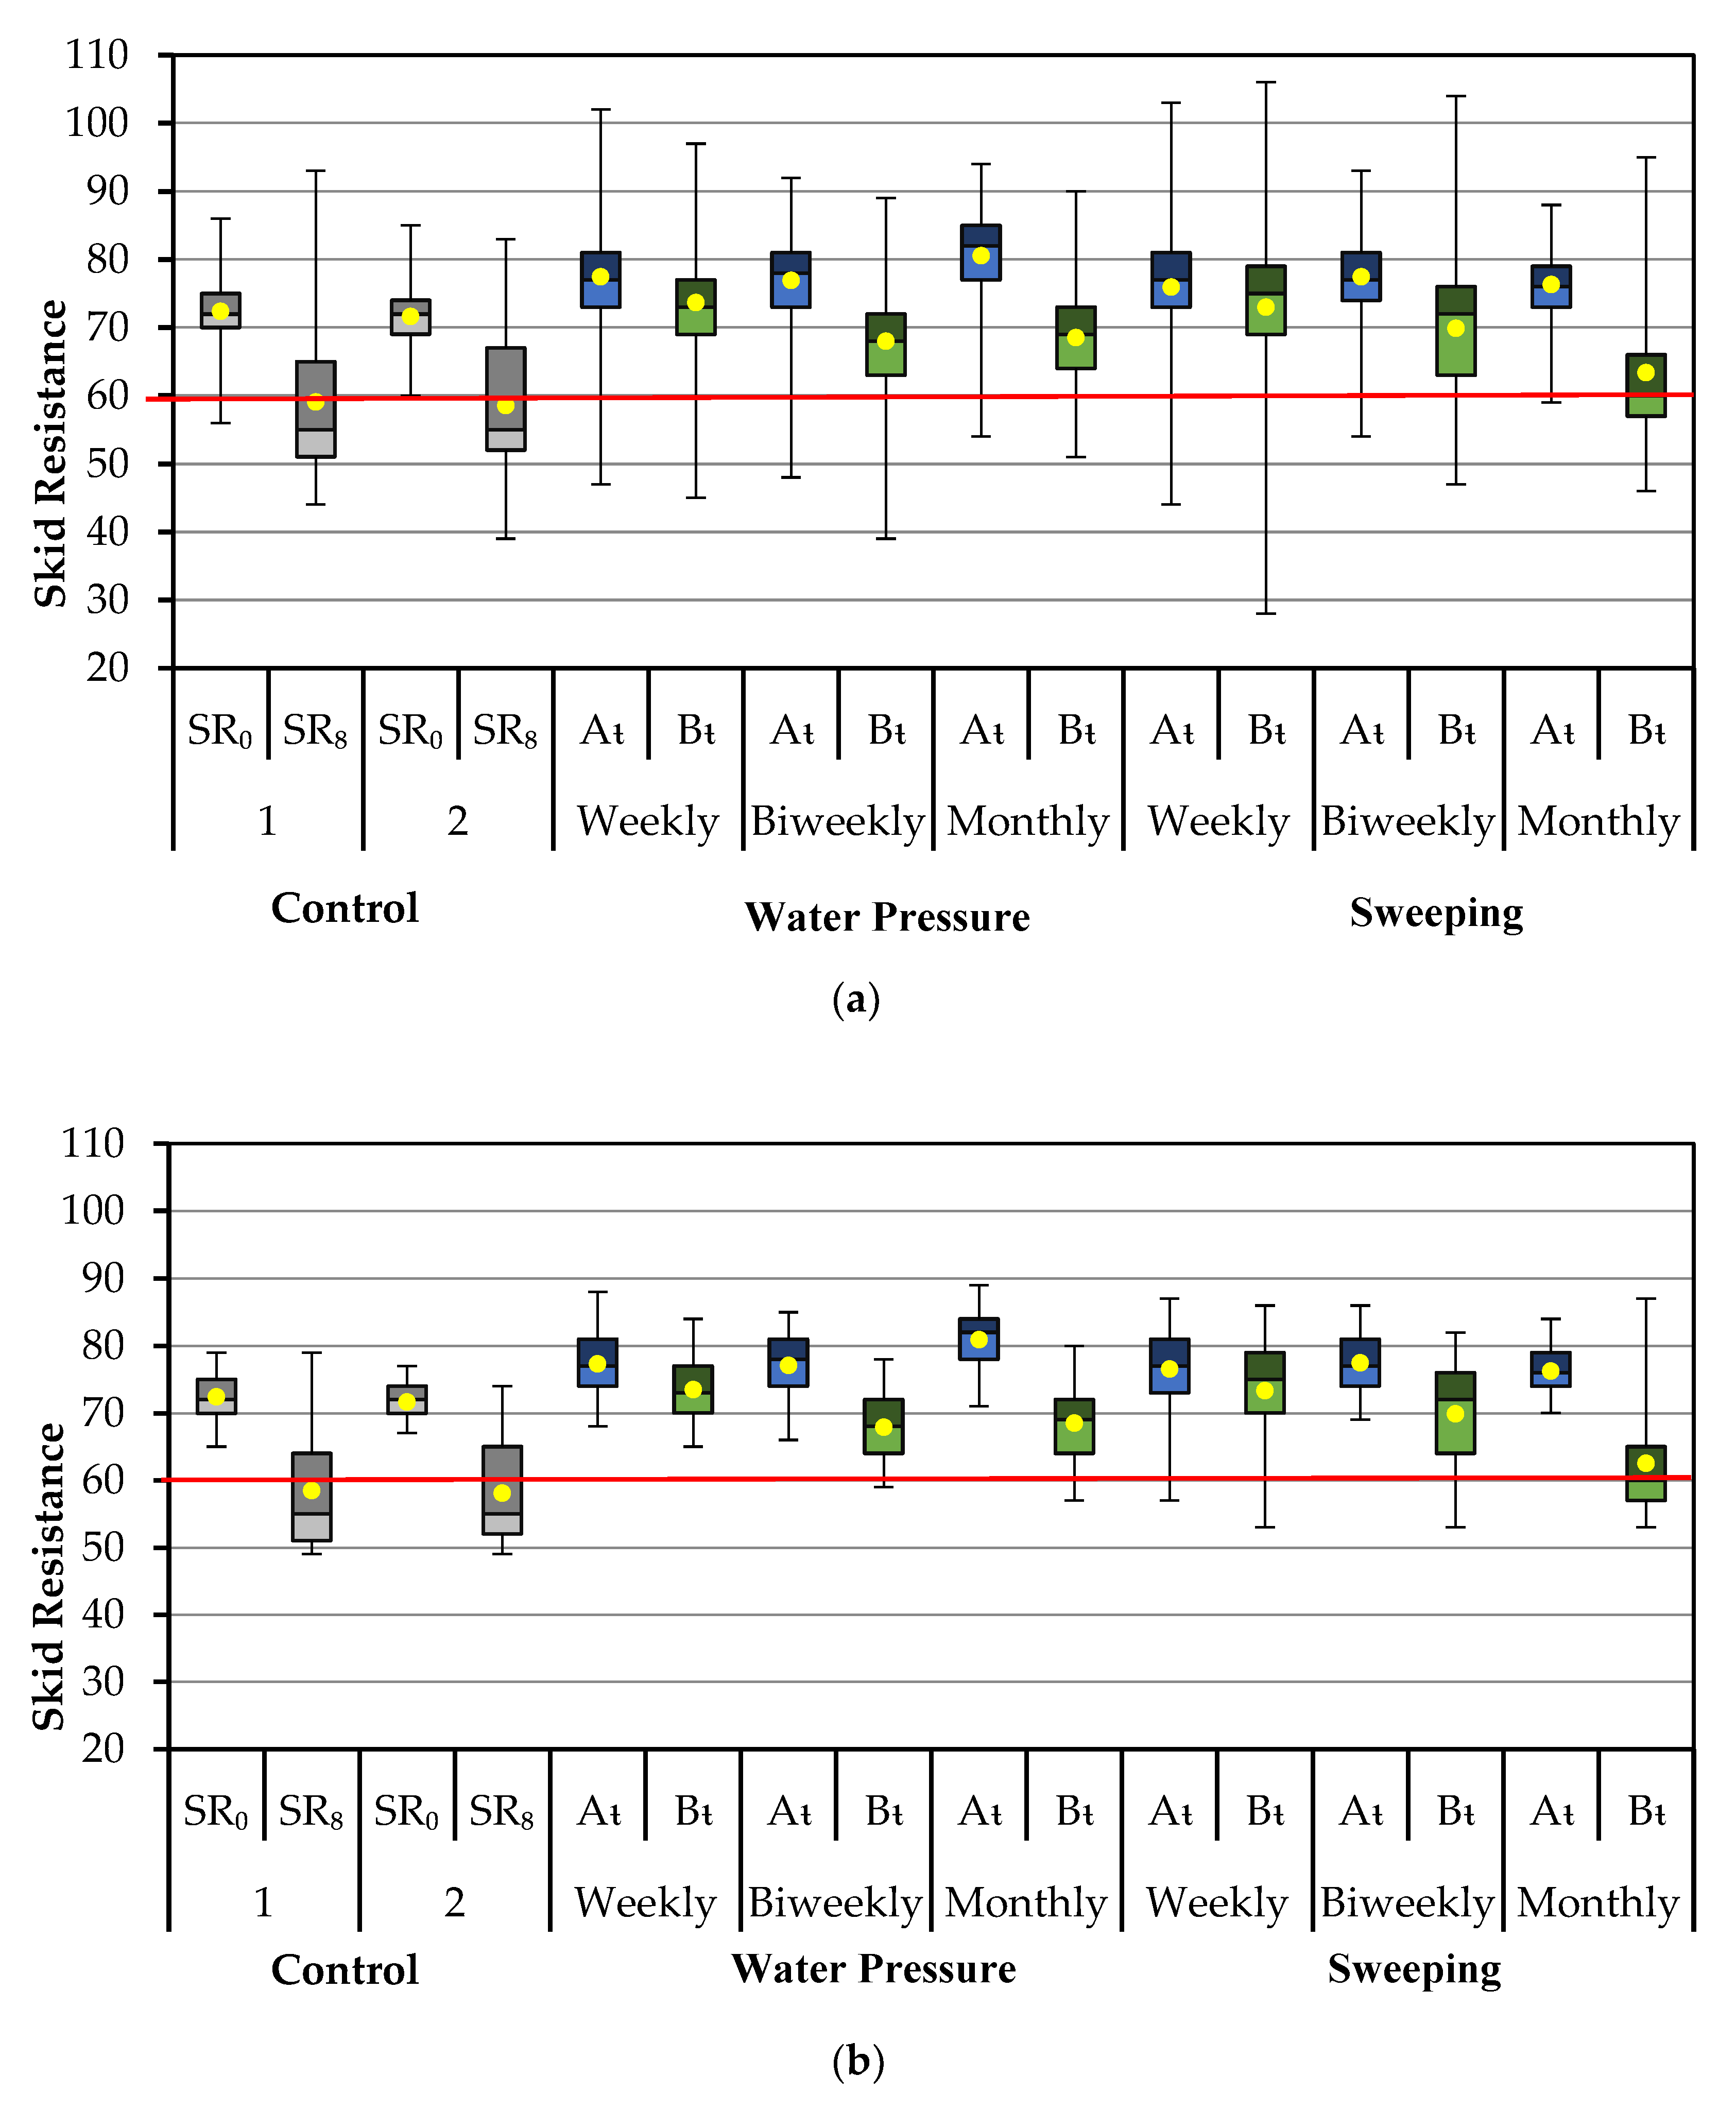
- The 5% outliers removal from the bottom and the top did not change more than 1% of the average SR compared to the original;
- Outliers removal helped with the reduction of unrelated data that does not present the actual performance of the tested sections;
- Box plots showed how SR decreased depending on the frequency of the treatment applied;
- Both treatments applied maintained the SR above 60 at every frequency;
- Water pressure applied monthly proves to be efficient in maintaining SR above the minimum level without major impacts to the traffic and pavement surface;
- Pavement surface sweeping can also increase the SR but at a slower rate compared to the water pressure;
- The average weekly performance of the sections proved that for higher frequencies, SR maintained its value above 60;
- SR of the control sections suggests that surface treatment is needed to maintain the SR above 60;
- One-tailed t-test showed that for both treatments and frequencies, there is statistically significant evidence at α = 0.05 that the SR is greater than 60 after it is applied.
6. Conclusions
7. Recommendations
- The testing period of two months does not give an entire view of pavement response in terms of when it will reach the minimum value of 60, therefore frequencies of two months or more will help to find that threshold;
- Georeferenced SR measurements before and after treatment to avoid outliers;
- Analysis of the economic impact of the treatment;
- Addition of other treatments such as air blowing or vacuum and shot blasting.
Author Contributions
Funding
Institutional Review Board Statement
Informed Consent Statement
Data Availability Statement
Conflicts of Interest
References
- Wilcox, R.G. Skid Resistance of Highway Pavements; American Society for Testing & Materials: West Conshohocken, PA, USA, 1973; Available online: https://compass-astm-org.ezproxy.lib.vt.edu/download/STP530-EB.13809.pdf (accessed on 9 July 2017).
- European Commission. Statistics—Accidents Data. Mobility and Transport: Road Safety. Available online: https://ec.europa.eu/transport/road_safety/specialist/statistics_en (accessed on 9 July 2017).
- European Commission. Annual Accident Report 2016. Mobility and Transport: Road Safety. Available online: https://ec.europa.eu/transport/road_safety/sites/roadsafety/files/pdf/statistics/dacota/asr2016.pdf (accessed on 9 July 2017).
- European Union. Countries Europa. 10 May 2017. Available online: https://europa.eu/european-union/about-eu/countries_en (accessed on 9 July 2017).
- European Union. Spain: Overview. Europa. 26 June 2017. Available online: https://europa.eu/european-union/about-eu/countries/member-countries/spain_en (accessed on 9 July 2017).
- European Commission. European Road Fatalities. Directorate General for Mobility and Transport. Available online: https://ec.europa.eu/transport/road_safety/sites/roadsafety/files/pdf/observatory/trends_figures.pdf (accessed on 9 July 2017).
- World Road Association Modiale De La Route. PIARC WG5 “Complex Underground Road Networks”—Part A Case Studies. Appendix 2.17-SPAIN–Madrid-Riío-TUNNEL. Available online: https://tunnels.piarc.org/en/system/files/media/file/appendix_2.17_-_spain_-_madrid_-_rio_tunnel.pdf (accessed on 9 July 2017).
- ESTI de Canales, Caminos y Puertos. Convenio Para la Optimización de los Procedimientos de Aplicación de Agentes Químicos para la Eliminación de la Contaminación en los Pavimentos de Túneles: Diseño Experimental. Universidad Politécnica de Madrid, Madrid, Spain, 2011. [Google Scholar]
- Ministerio de Fomento. Real Decreto 635/2006, Sobre Requisitos Mínimos de Seguridad en los Túneles de Carreteras del Estado. Agencia Estatal: Boletín Oficial del Estado. Available online: https://www.boe.es/diario_boe/txt.php?id=BOE-A-2006-9296 (accessed on 9 July 2017).
- Euroconsult Nuevas Tecnologías. SCRIM (Control de Adherencia Sobre Pavimentos Mojados). Available online: http://www.euroconsult.es/pdf/Scrim_multiidioma.pdf (accessed on 9 July 2017).
- Zimmerman Paint Contractors, Co. The Advantages of Hydroblasting for Line Removal and Surface Preparation. Available online: http://zimmermanpaint.com/html/line-removal-hydroblasting.html (accessed on 9 July 2017).
- Performance Hydroblasting. Road Marking Removal. Performance Hydroblasting Professional Services. Available online: http://www.performancehydroblasting.com/roadmarkingremoval (accessed on 9 July 2017).
- H2-GO. The Benefits and Advantages of Using H2-GO’s Hydroblasting Services. Why H2-Go? Available online: http://www.h2-go.com/page/the-benefits-and-advantages-of-using-h2-gos-hydroblasting-services/ (accessed on 9 July 2017).
- UNE-EN 1097-8. Ensayos Para Determinar las Propiedades MECÁNICAS y Físicas de los Áridos. Depósito Legal: M 1223:2010. Asociación Española de Normalización y Certificación (AENOR): Madrid, Spain, 2010. [Google Scholar]


| Section | 1 | 2 | 3 | 4 | 5 | 6 | 7 | 8 |
| Start | 12XC00 | 11XC75 | 11XC50 | 11XC25 | 11XC00 | 10XC75 | 10XC50 | 10XC25 |
| End | 11XC75 | 11XC50 | 11XC25 | 11XC00 | 10XC75 | 10XC50 | 10XC25 | 10XC00 |
| Month | Volume(Veh./Day) | Light Vehicle Volume (Veh./Day) | Heavy Vehicle Volume (Veh./Day) |
| April | 9754 | 7998 | 1756 |
| May | 10,440 | 8039 | 2401 |
| June | 10,750 | 8600 | 2150 |
| Section | 1 | 2 | 3 | 4 | 5 | 6 | 7 | 8 |
| Start | 12XC00 | 11XC75 | 11XC50 | 11XC25 | 11XC00 | 10XC75 | 10XC50 | 10XC25 |
| End | 11XC75 | 11XC50 | 11XC25 | 11XC00 | 10XC75 | 10XC50 | 10XC25 | 10XC00 |
| Treatment | Water Pressure | No Treatment | Sweeping | |||||
| Frequency | Weekly | Biweekly | Monthly | Weekly | Biweekly | Monthly | ||
| Treatment | Frequency | 0% of Outliers Removed | 5% of Outliers Removed | |||
|---|---|---|---|---|---|---|
| Count | Mean | Count | Mean | |||
| Untreated | N/A | SR0 | 3862 | 72.4 | 3476 | 72.4 |
| SR8 | 59.1 | 58.4 | ||||
| N/A | SR0 | 3903 | 71.6 | 3513 | 71.6 | |
| SR8 | 58.5 | 58.1 | ||||
| Water Pressure | Weekly | At | 15,859 | 77.4 | 14,273 | 77.3 |
| Bt | 73.6 | 73.4 | ||||
| Biweekly | At | 8057 | 76.9 | 7251 | 77.0 | |
| Bt | 67.9 | 67.8 | ||||
| Monthly | At | 3880 | 80.5 | 3492 | 80.9 | |
| Bt | 68.5 | 68.5 | ||||
| Sweeping | Weekly | At | 28,631 | 75.9 | 25,767 | 76.5 |
| Bt | 73.0 | 73.3 | ||||
| Biweekly | At | 8535 | 77.4 | 7681 | 77.4 | |
| Bt | 69.9 | 69.9 | ||||
| Monthly | At | 4064 | 76.3 | 3658 | 76.2 | |
| Bt | 63.4 | 62.5 | ||||
| Frequency | Count | MeanBL | Mean | SD | t0.05 | T-Statistic | p-Value | |
|---|---|---|---|---|---|---|---|---|
| Before | Weekly | 20,414 | 73.0 | 74.48 | 6.33 | 1.64 | 326.84 | 0.000 |
| Biweekly | 13,657 | 73.0 | 69.5 | 6.2 | 1.64 | 177.98 | 0.000 | |
| Monthly | 7872 | 73.0 | 67.77 | 6.5 | 1.64 | 104.61 | 0.000 | |
| After | Weekly | 20,414 | 73.0 | 78.1 | 6.5 | 1.64 | 393.62 | 0.000 |
| Biweekly | 13,657 | 73.0 | 75.5 | 6.4 | 1.64 | 283.02 | 0.000 | |
| Monthly | 7872 | 73.0 | 72.1 | 11. | 1.64 | 96.33 | 0.000 |
| Frequency | Count | MeanBL | Mean | SD | t0.05 | T-Statistic | p-Value | |
|---|---|---|---|---|---|---|---|---|
| Before | Weekly | 32,047 | 66.0 | 72.6 | 9.44 | 1.64 | 240.27 | 0.000 |
| Biweekly | 12,743 | 66.0 | 70.6 | 8.6 | 1.64 | 139.07 | 0.000 | |
| Monthly | 5530 | 76.0 | 65.86 | 9.52 | 1.64 | 45.77 | 0.000 | |
| After | Weekly | 32,047 | 66.0 | 75.2 | 9.3 | 1.64 | 292.58 | 0.000 |
| Biweekly | 12,743 | 66.0 | 77.2 | 7.8 | 1.64 | 250.08 | 0.000 | |
| Monthly | 5530 | 76.0 | 80.1 | 10.5 | 1.64 | 142.84 | 0.000 |
Publisher’s Note: MDPI stays neutral with regard to jurisdictional claims in published maps and institutional affiliations. |
© 2021 by the authors. Licensee MDPI, Basel, Switzerland. This article is an open access article distributed under the terms and conditions of the Creative Commons Attribution (CC BY) license (https://creativecommons.org/licenses/by/4.0/).
Share and Cite
Marcobal, J.R.; Salado, F.; Flintsch, G. Evaluation of Various Surface Cleaning Techniques Inside Tunnels on Pavement Skid Resistance. Materials 2021, 14, 5660. https://doi.org/10.3390/ma14195660
Marcobal JR, Salado F, Flintsch G. Evaluation of Various Surface Cleaning Techniques Inside Tunnels on Pavement Skid Resistance. Materials. 2021; 14(19):5660. https://doi.org/10.3390/ma14195660
Chicago/Turabian StyleMarcobal, José Ramon, Freddie Salado, and Gerardo Flintsch. 2021. "Evaluation of Various Surface Cleaning Techniques Inside Tunnels on Pavement Skid Resistance" Materials 14, no. 19: 5660. https://doi.org/10.3390/ma14195660
APA StyleMarcobal, J. R., Salado, F., & Flintsch, G. (2021). Evaluation of Various Surface Cleaning Techniques Inside Tunnels on Pavement Skid Resistance. Materials, 14(19), 5660. https://doi.org/10.3390/ma14195660