
Probabilistic Approach to Limit States of a Steel Dome


Abstract
:1. Introduction
2. Materials and Methods
2.1. Method FORM
2.2. Crude Monte Carlo Method
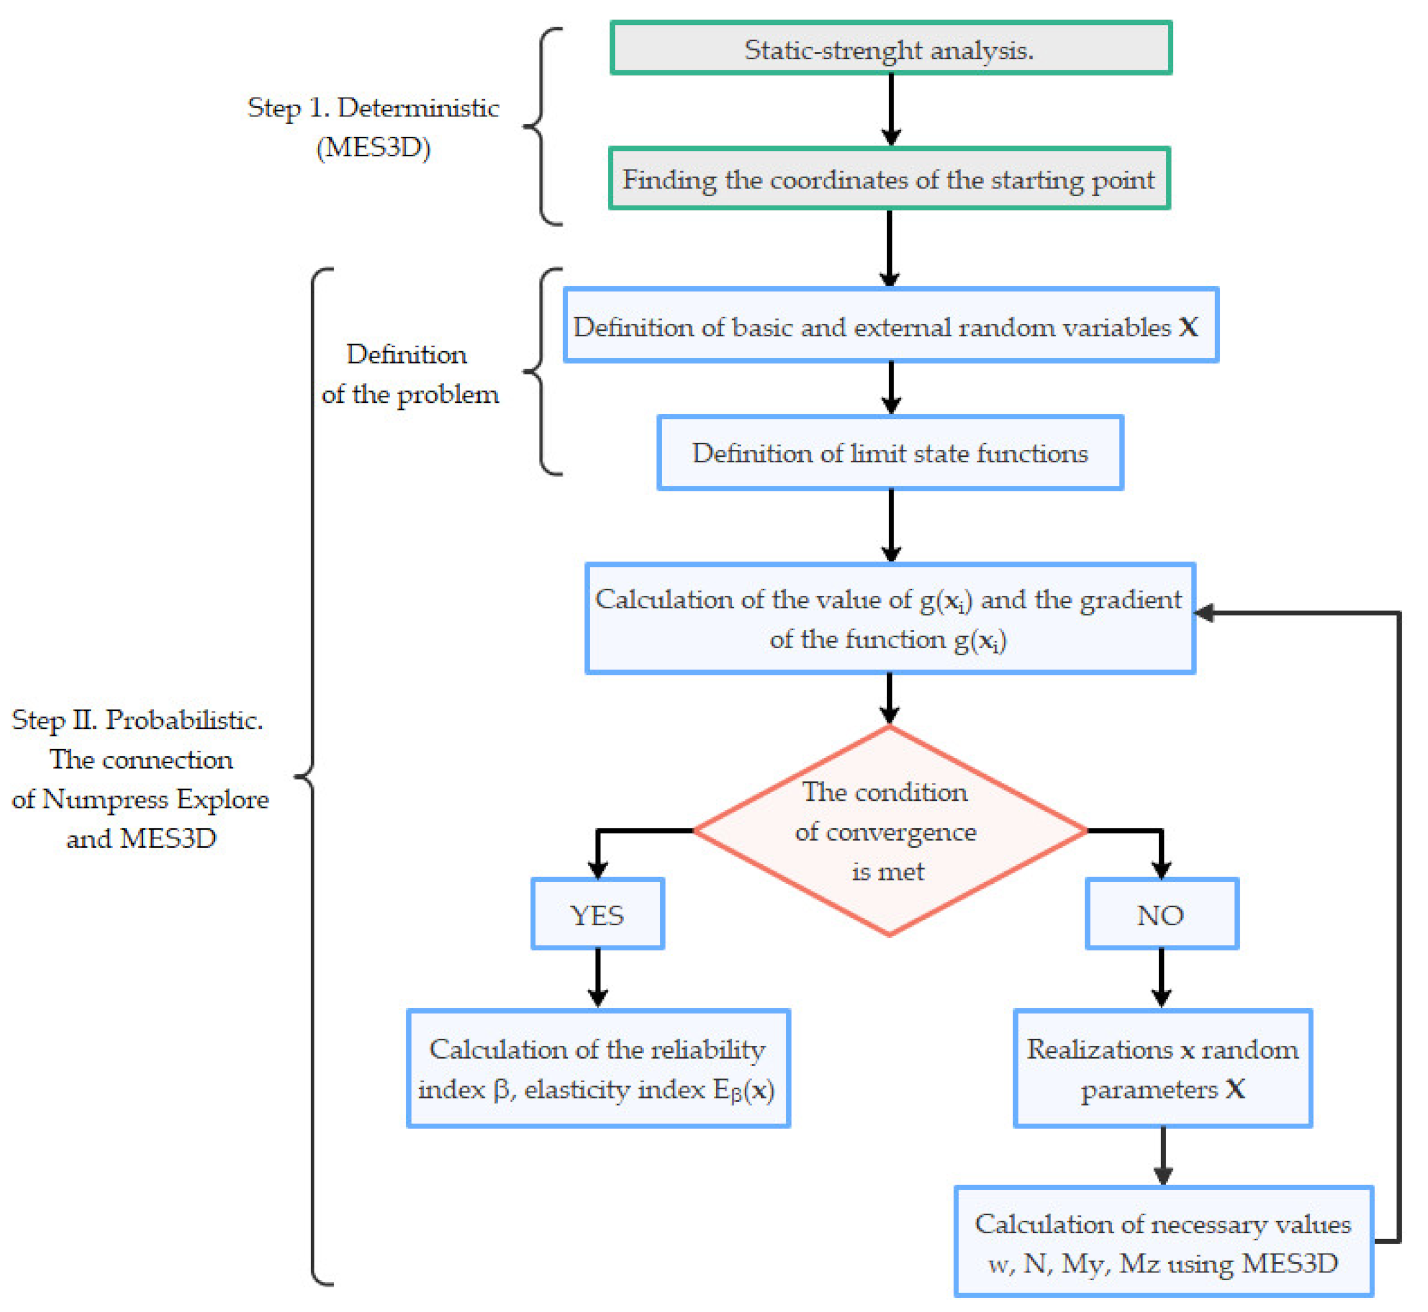
2.3. Cooperation between Numpress Explore and MES3D Software
3. Results
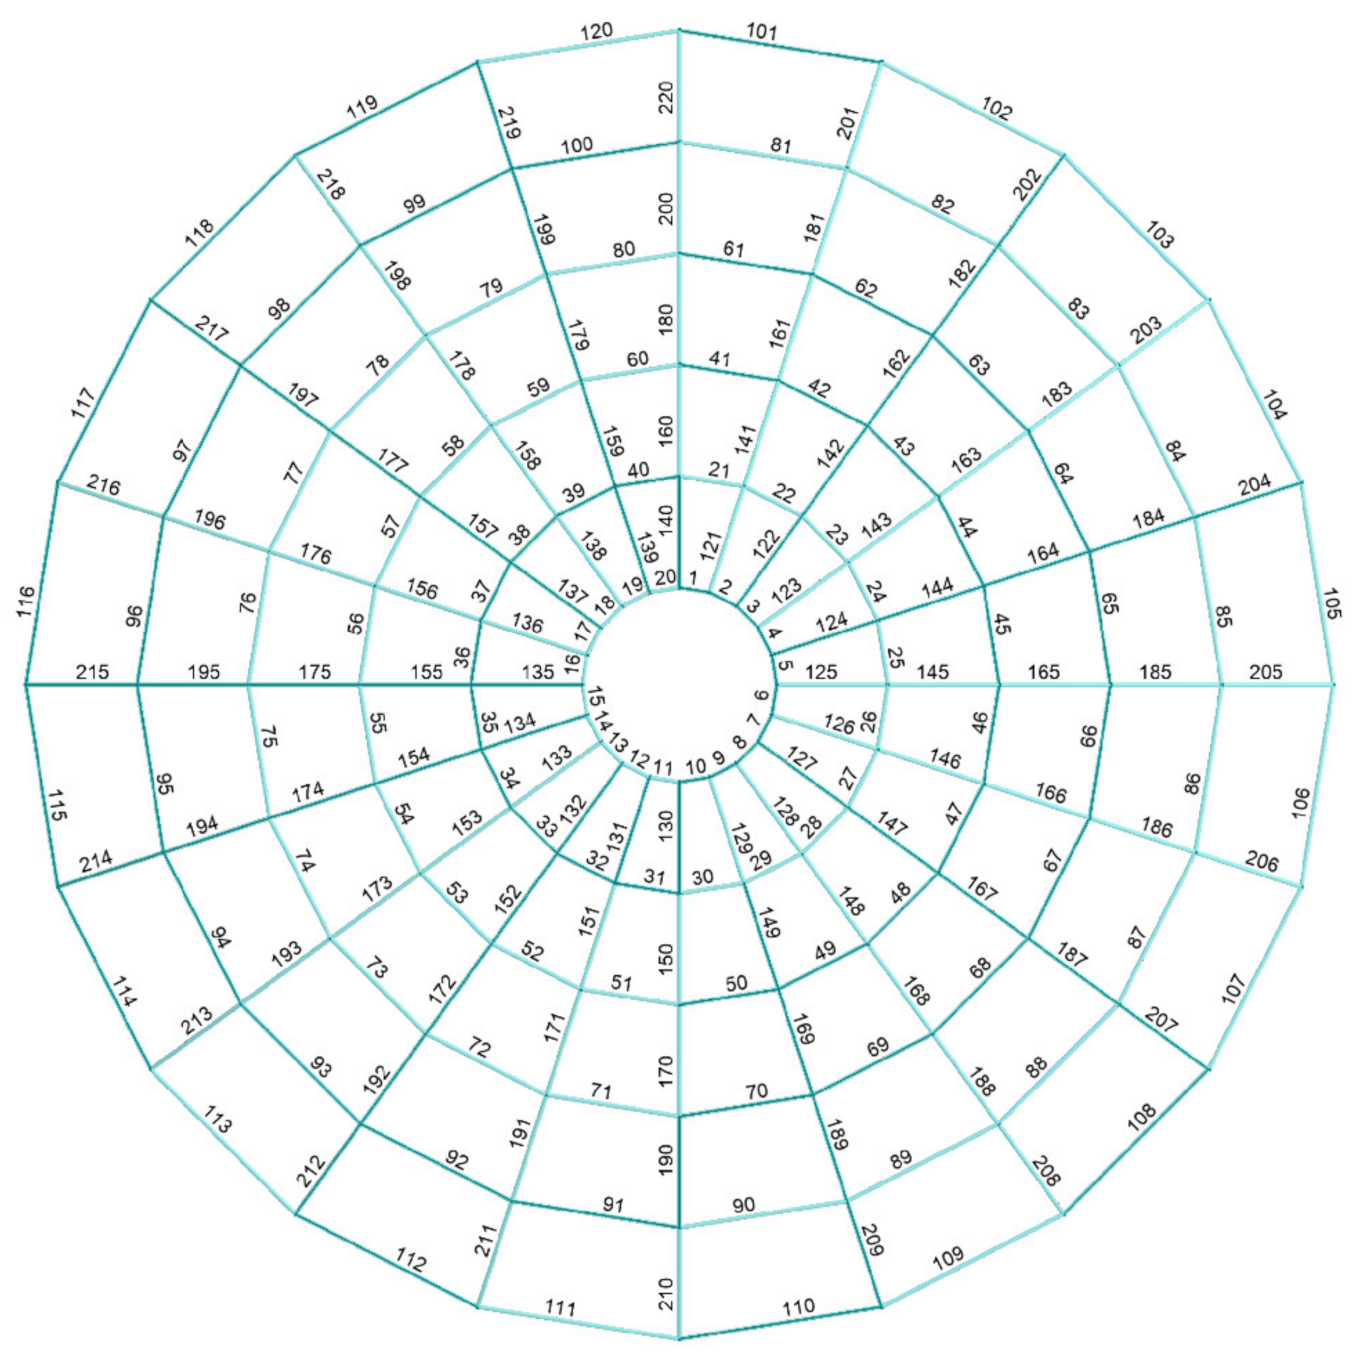
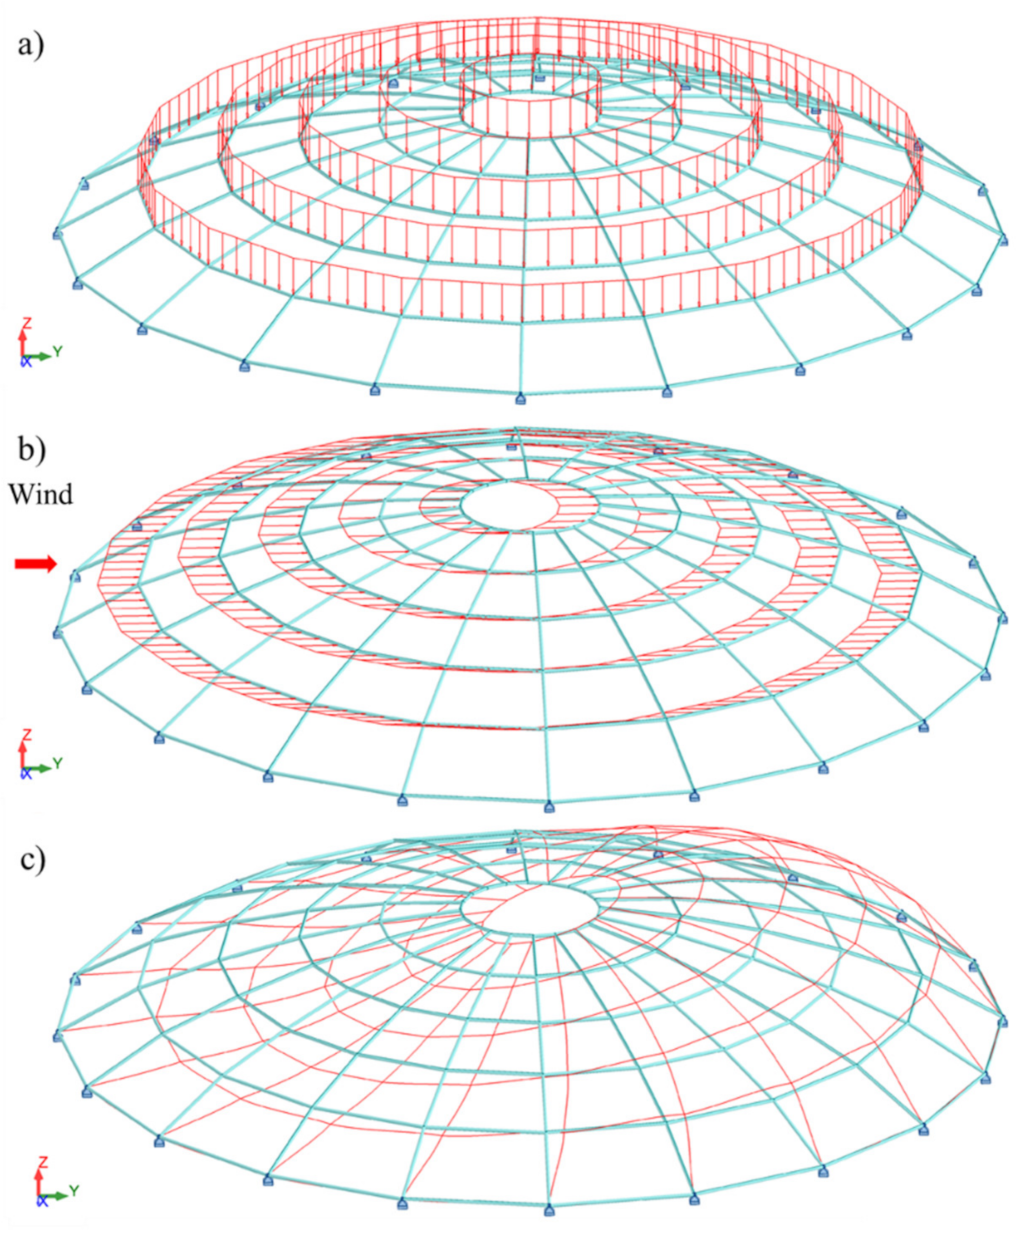
3.1. Deterministic Static and Strength Analysis
3.2. Computation of the Hasofer-Lind Reliability Index
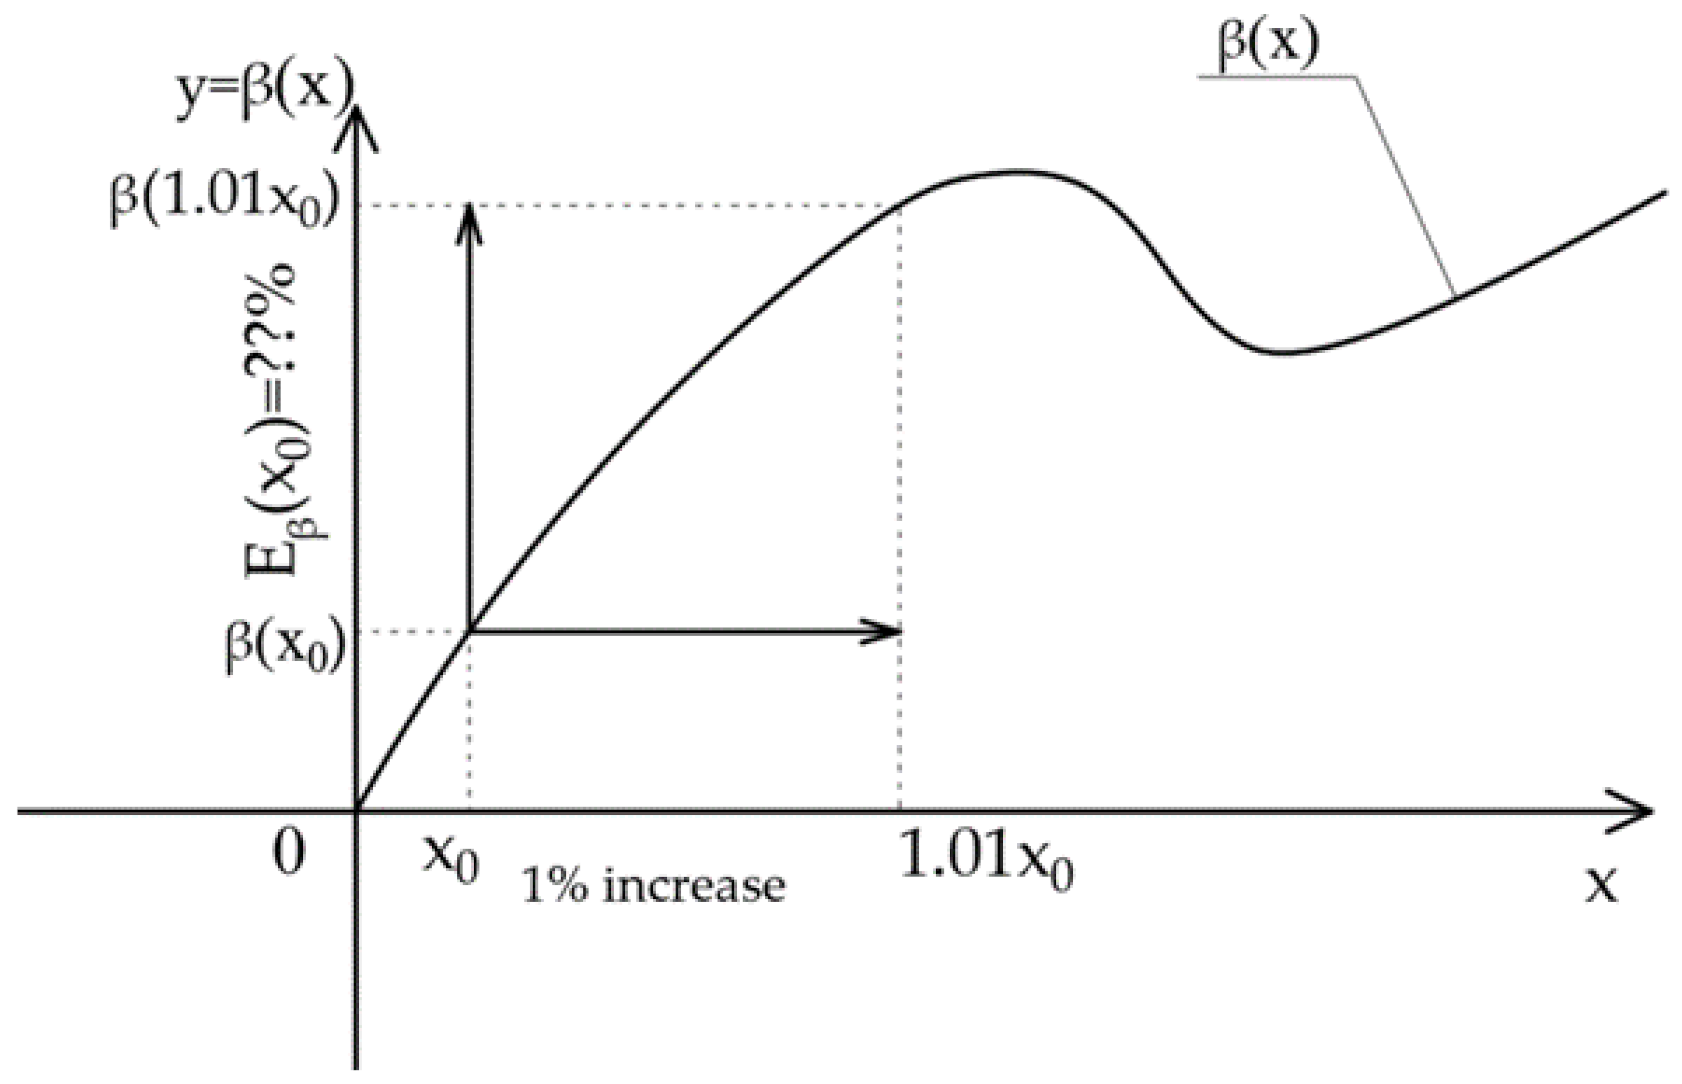
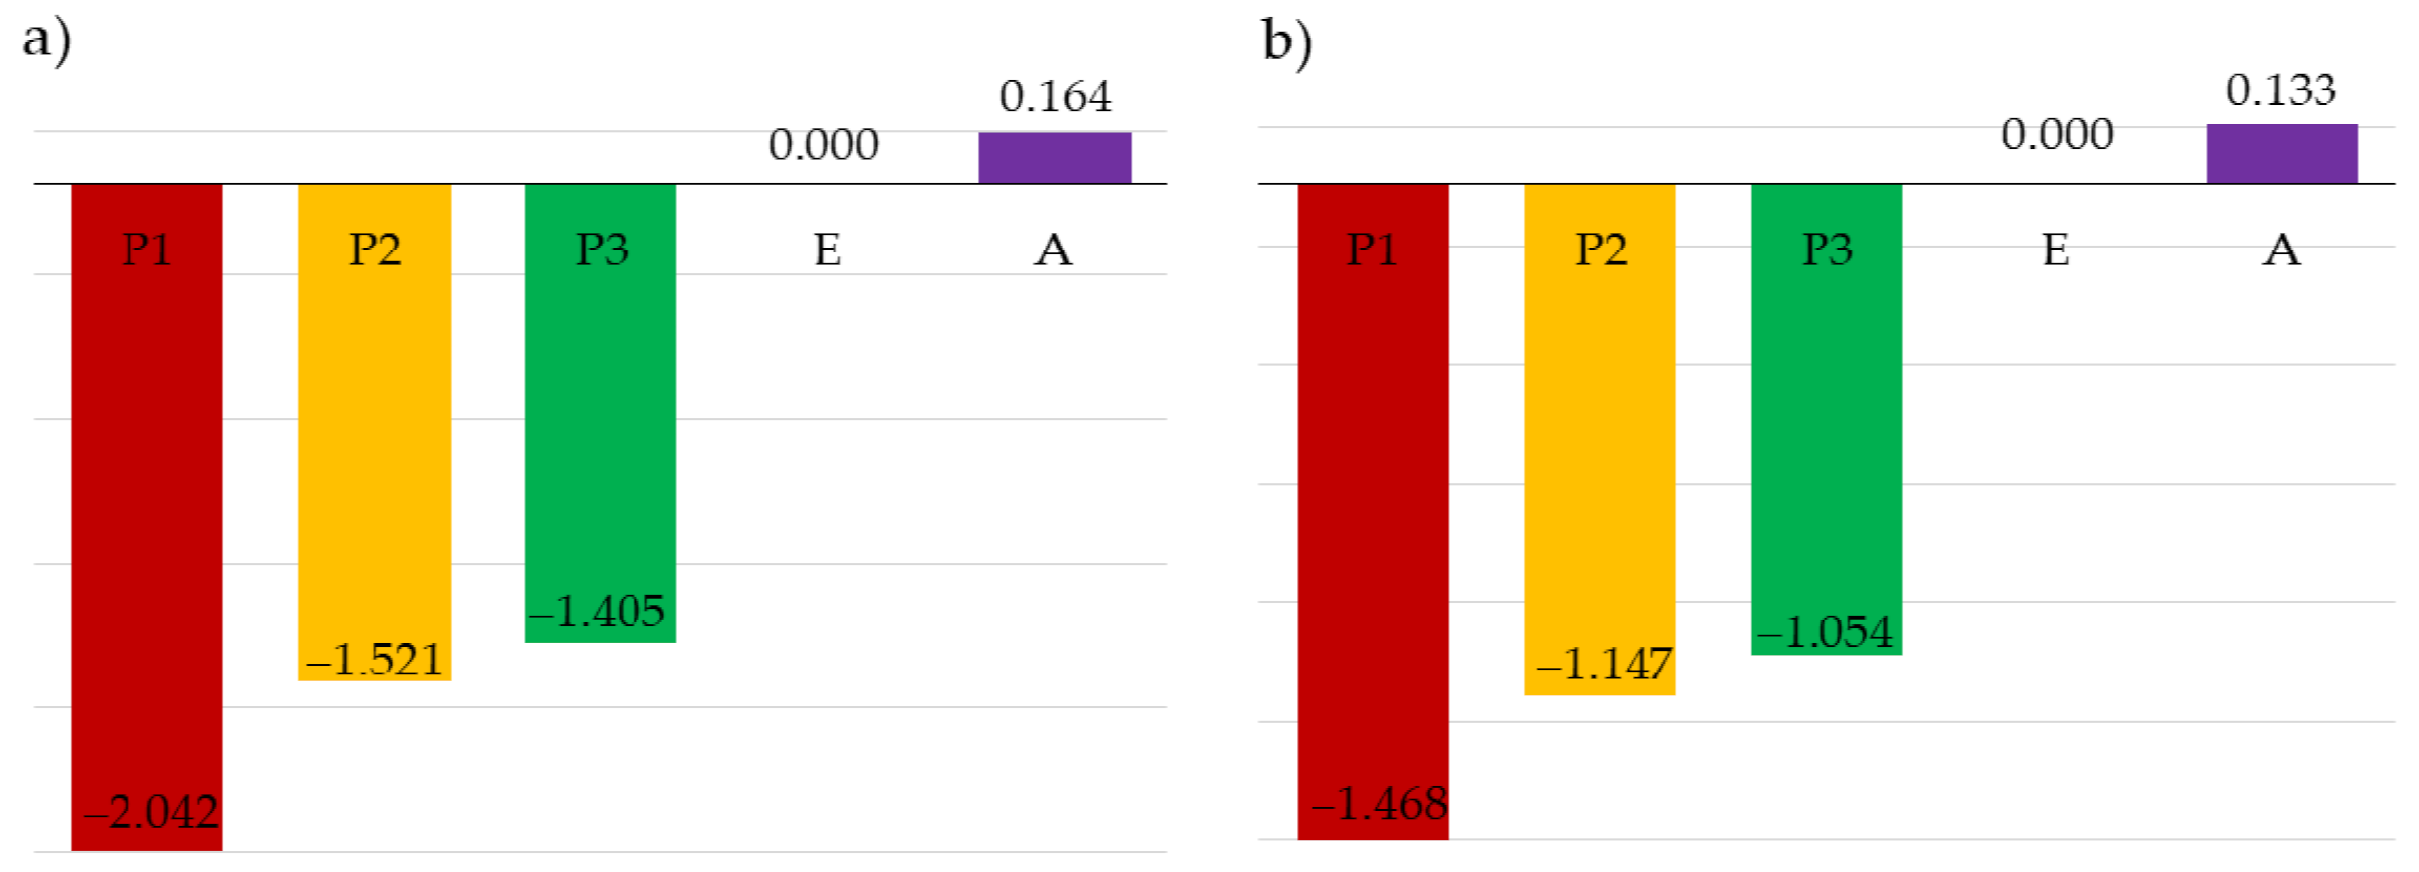
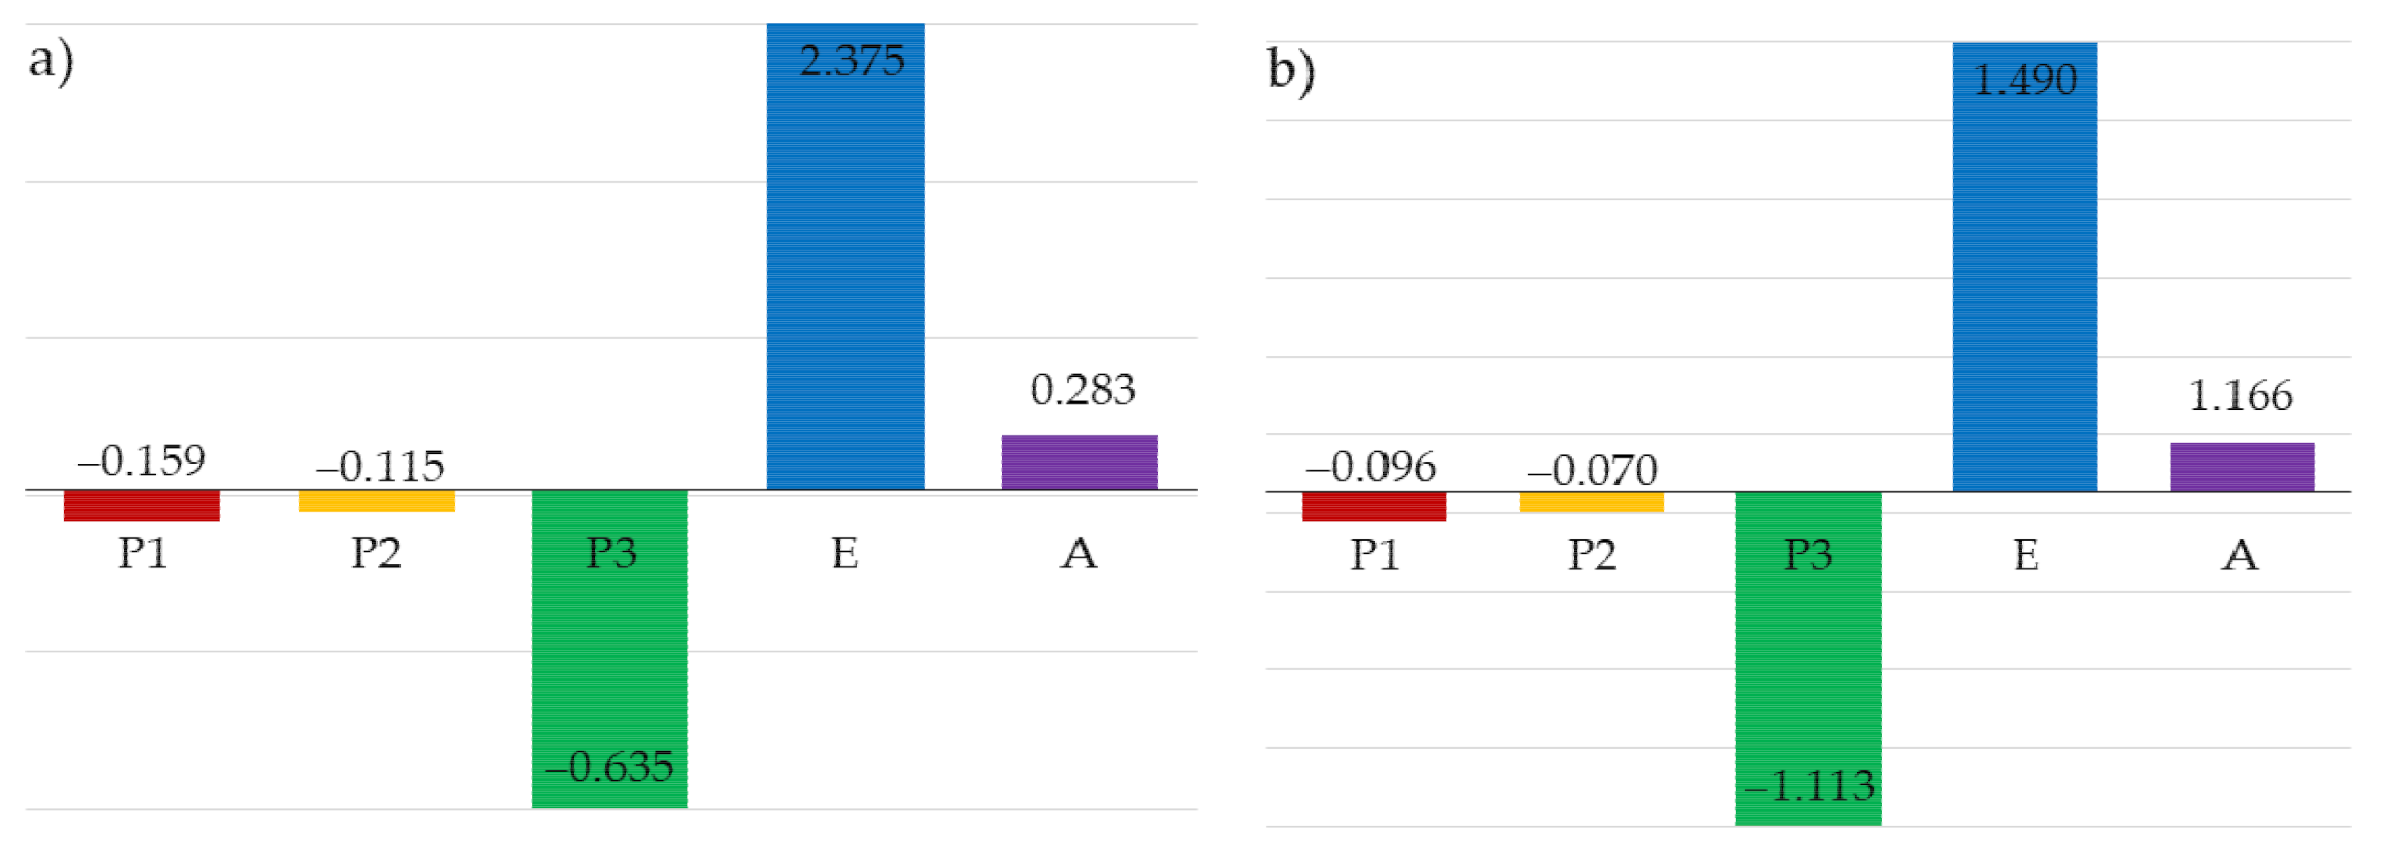
3.3. Analysis of the Sensitivity of the Hasofer-Lind Index to Changes in Random Parameters
3.4. Discussion of the Results
4. Conclusions
Author Contributions
Funding
Institutional Review Board Statement
Informed Consent Statement
Data Availability Statement
Conflicts of Interest
References
- EU. PN-EN 1991-1-3: Eurocode 1: Actions on Structures—Part 1-3: General Actions—Snow Loads; EU: Brussels, Belgium, 2003. [Google Scholar]
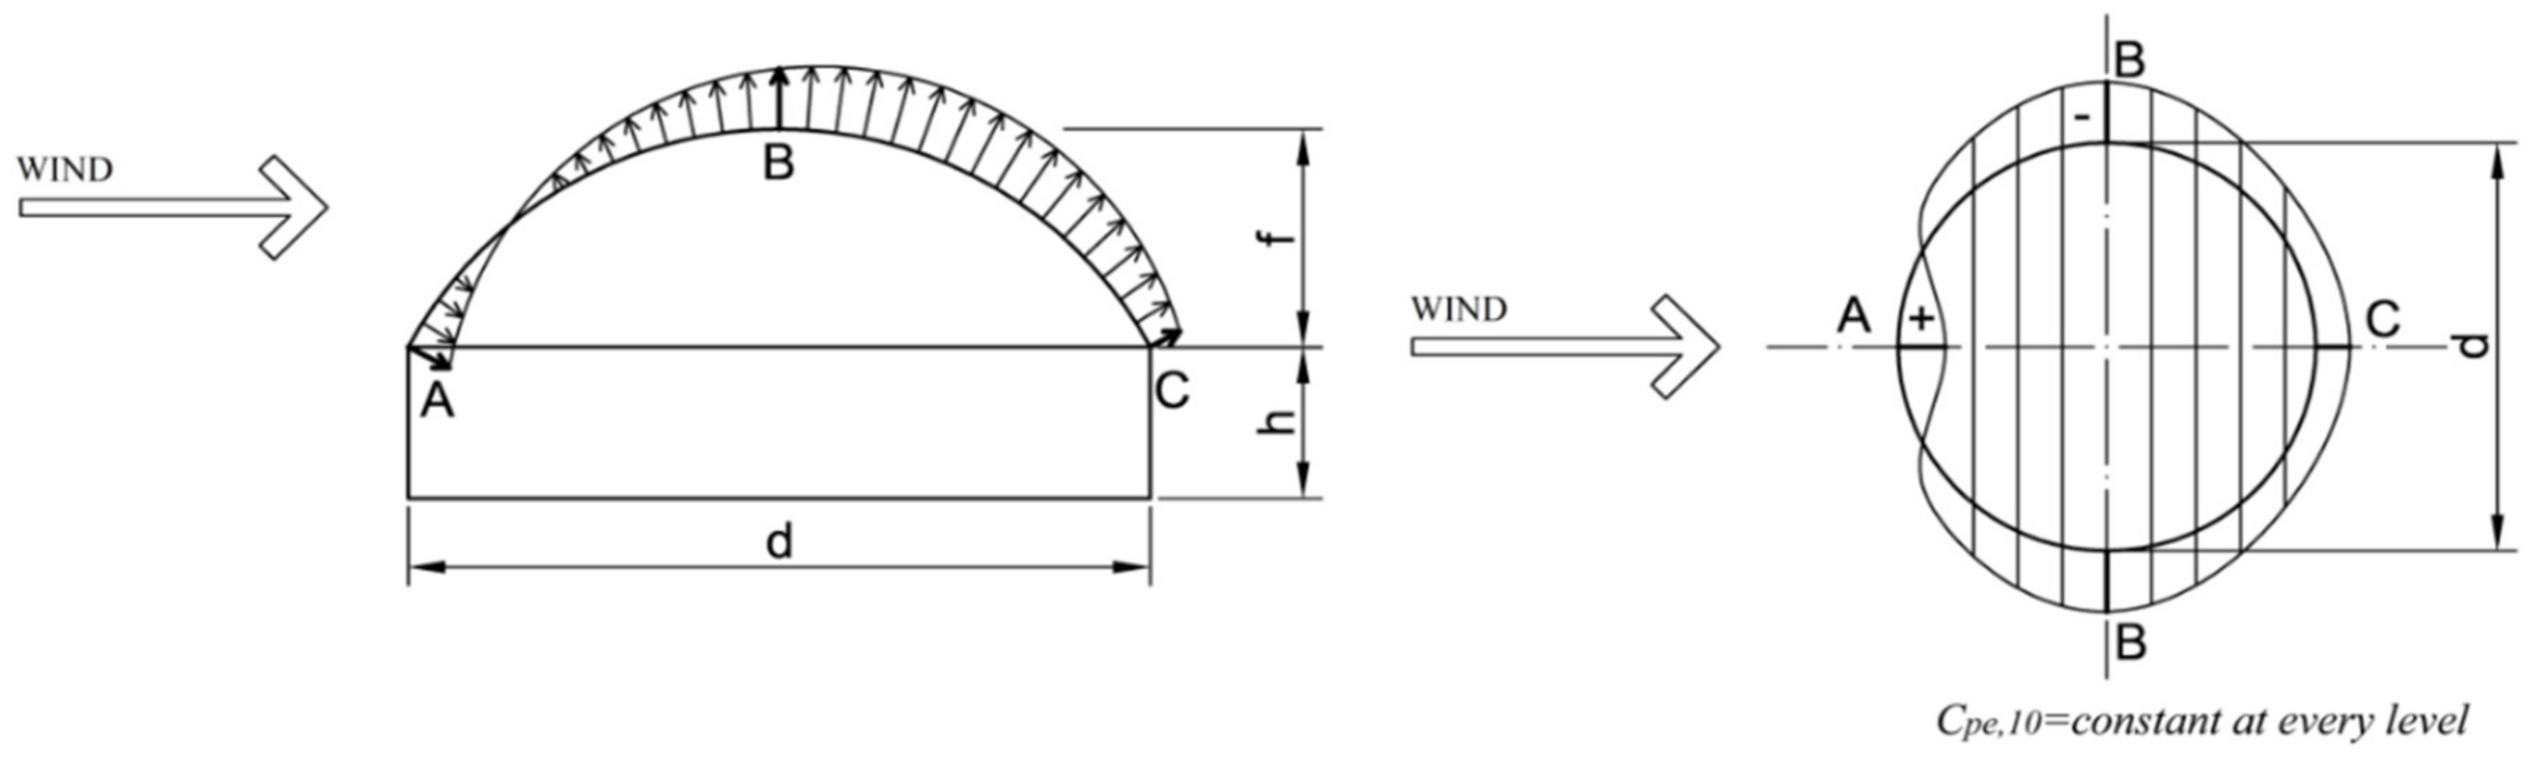
- EU. PN-EN 1991-1-4: Eurocode 1: Actions on Structures—Part 1-4: General Actions—Wind Actions; EU: Brussels, Belgium, 2010. [Google Scholar]
- EU. PN-EN 1990:2004. Eurocode: Basis of Structural Design; EU: Brussels, Belgium, 2005. [Google Scholar]
- EU. PN-EN 1993-1-1. Eurocode 3: Design of Steel Structures. Part 1-1: General Rules and Rules for Buildings; EU: Brussels, Belgium, 2005. [Google Scholar]
- Hasofer, A.M.; Lind, N.C. Exact and Invariant Second-Moment Code Format. J. Eng. Mech. Div. 1974, 100, 111–121. [Google Scholar] [CrossRef]
- Cornell, C.A. A probability-based structural code. J. Am. Concr. Inst. 1969, 66, 974–985. [Google Scholar]
- Rackwitz, R.; Fiessler, B. Structural reliability under combined random load sequences. Comput. Struct. 1978, 9, 489–494. [Google Scholar] [CrossRef]
- Hohenbichler, M.; Gollwitzer, S.; Kruse, W.; Rackwitz, R. New light on first- and second-order reliability methods. Struct. Saf. 1987, 4, 267–284. [Google Scholar] [CrossRef]
- Fiessler, B.; Neumann, H.-J.; Rackwitz, R. Quadratic Limit States in Structural Reliability. J. Eng. Mech. Div. 1979, 105, 661–676. [Google Scholar] [CrossRef]
- Der Kiureghian, A.; De Stefano, M. Efficient Algorithm for Second-Order Reliability Analysis. J. Eng. Mech. 1991, 117, 2904–2923. [Google Scholar] [CrossRef]
- Der Kiureghian, A.; Lin, H.; Hwang, S. Second-Order Reliability Approximations. J. Eng. Mech. 1987, 113, 1208–1225. [Google Scholar] [CrossRef]
- Fujita, M.; Rackwitz, R. Updating first-and second-order reliability estimates by importance sampling. Doboku Gakkai Ronbunshu 1988, 1988, 53–59. [Google Scholar] [CrossRef]
- Doliński, K. Importance Sampling Techniques in Reliability Calculations; Prace IPPT; Institute of Fundamental Technological Research: Warsaw, Poland, 1988; p. 37. [Google Scholar]
- Hohenbichler, M.; Rackwitz, R. Improvement of Second-Order Reliability Estimates by Importance Sampling. J. Eng. Mech. 1988, 114, 2195–2199. [Google Scholar] [CrossRef]
- Le, L.M.; Ly, H.-B.; Pham, B.T.; Le, V.M.; Pham, T.A.; Nguyen, D.-H.; Tran, X.-T.; Le, T.-T. Hybrid Artificial Intelligence Approaches for Predicting Buckling Damage of Steel Columns Under Axial Compression. Materials 2019, 12, 1670. [Google Scholar] [CrossRef] [Green Version]
- Dudzik, A.; Potrzeszcz-Sut, B. Hybrid Approach to the First Order Reliability Method in the Reliability Analysis of a Spatial Structure. Appl. Sci. 2021, 11, 648. [Google Scholar] [CrossRef]
- Rossi, L.; Winands, M.H.M.; Butenweg, C. Monte Carlo Tree Search as an intelligent search tool in structural design problems. Eng. Comput. 2021. [Google Scholar] [CrossRef]
- Lehner, P.; Krejsa, M.; Pařenica, P.; Křivý, V.; Brozovsky, J. Fatigue damage analysis of a riveted steel overhead crane support truss. Int. J. Fatigue 2019, 128, 105190. [Google Scholar] [CrossRef]
- Nguyen, T.-H.; Nguyen, D.-D. Reliability Assessment of Steel-Concrete Composite Beams considering Metal Corrosion Effects. Adv. Civ. Eng. 2020, 2020, 8817809. [Google Scholar] [CrossRef]
- Hohenbichler, M.; Rackwitz, R. Non-Normal Dependent Vectors in Structural Safety. J. Eng. Mech. Div. 1981, 107, 1227–1238. [Google Scholar] [CrossRef]
- Rosenblatt, M. Remarks on a Multivariate Transformation. Ann. Math. Stat. 1952, 23, 470–472. [Google Scholar] [CrossRef]
- Der Kiureghian, A.; Liu, P.-L. Structural reliability under incomplete probability information. J. Eng. Mech. 1986, 112, 85–104. [Google Scholar] [CrossRef]
- Hisada, T.; Nakagiri, S. Role of the Stochastic Finite Element Method in structural safety and reliability. In Proceedings of the 5th International Conference on Structural Safety and Reliability, San Francisco, CA, USA, 7–11 August 1989; pp. 385–394. [Google Scholar]
- Liu, J.K.; Mani, A.; Belytschko, T. Finite element methods in probabilistic mechanics. Probabilistic Eng. Mech. 1987, 2, 201–213. [Google Scholar] [CrossRef]
- Shinozuka, M. Basic issues in Stochastic Finite Element analysis. In Proceedings of the 5th International Conference on Applications of Statistics and Probability, Vancouver, BC, Canada, 25–29 May 1987; Volume 1, pp. 507–520. [Google Scholar]
- Li, C.-C.; Der Kiureghian, A. Optimal discretization of random fields. J. Eng. Mech. ASCE 1993, 119, 1136–1154. [Google Scholar] [CrossRef]
- Matthies, H.G.; Brenner, C.E.; Bucher, C.G.; Soares, C.G. Uncertainties in probabilistic numerical analysis of structures and solids-Stochastic finite elements. Struct. Saf. 1997, 19, 283–336. [Google Scholar] [CrossRef]
- Pellissetti, M.F.; Schuëller, G.I. On general purpose software in structural reliability—An overview. Struct. Saf. 2006, 28, 3–16. [Google Scholar] [CrossRef]
- Reh, S.; Beley, J.-D.; Mukherjee, S.; Khor, E.H. Probabilistic finite element analysis using ANSYS. Struct. Saf. 2006, 28, 17–43. [Google Scholar] [CrossRef]
- Der Kiureghian, A.; Haukaas, T.; Fujimura, K. Structural reliability software at the University of California, Berkeley. Struct. Saf. 2006, 28, 44–67. [Google Scholar] [CrossRef]
- Schuëller, G.; Pradlwarter, H. Computational stochastic structural analysis (COSSAN)—A software tool. Struct. Saf. 2006, 28, 68–82. [Google Scholar] [CrossRef]
- Thacker, B.H.; Riha, D.S.; Fitch, S.K.H.; Huyse, L.J.; Pleming, J.B. Probabilistic engineering analysis using the NESSUS software. Struct. Saf. 2006, 28, 83–107. [Google Scholar] [CrossRef]
- Gollwitzer, S.; Kirchgäßner, B.; Fischer, R.; Rackwitz, R. PERMAS-RA/STRUREL system of programs for probabilistic reliability analysis. Struct. Saf. 2006, 28, 108–129. [Google Scholar] [CrossRef]
- Lemaire, M.; Pendola, M. Phimeca-soft. Struct. Saf. 2006, 28, 130–149. [Google Scholar] [CrossRef]
- Tvedt, L. Proban-probabilistic analysis. Struct. Saf. 2006, 28, 150–163. [Google Scholar] [CrossRef]
- Wu, Y.-T.; Shin, Y.; Sues, R.H.; Cesare, M.A. Probabilistic function evaluation system (ProFES) for reliability-based design. Struct. Saf. 2006, 28, 164–195. [Google Scholar] [CrossRef]
- Lin, H.-Z.; Khalessi, M. General outlook of UNIPASS™ V5.0: A general-purpose probabilistic software system. Struct. Saf. 2006, 28, 196–216. [Google Scholar] [CrossRef]
- Lee, J.; Ang, A. Finite element fracture reliability of stochastic structures. Struct. Eng. Mech. 1995, 3, 1–10. [Google Scholar] [CrossRef]
- Engelstad, S.P.; Reddy, J.N. Probabilistic nonlinear finite element analysis of composite structures. AIAA J. 1993, 31, 362–369. [Google Scholar] [CrossRef]
- Mahadevan, S.; Mehta, S. Dynamic reliability of large frames. Comput. Struct. 1993, 47, 57–67. [Google Scholar] [CrossRef]
- Zabojszcza, P.; Radoń, U. The Impact of Node Location Imperfections on the Reliability of Single-Layer Steel Domes. Appl. Sci. 2019, 9, 2742. [Google Scholar] [CrossRef] [Green Version]
- Zabojszcza, P.; Radoń, U. Stability analysis of the single-layer dome in probabilistic description by the Monte Carlo method. J. Theor. Appl. Mech. 2020, 58, 425–436. [Google Scholar] [CrossRef]
- Mochocki, W.; Radoń, U. Analysis of Basic Failure Scenarios of a Truss Tower in a Probabilistic Approach. Appl. Sci. 2019, 9, 2662. [Google Scholar] [CrossRef] [Green Version]
- Kubicka, K.; Obara, P.; Radoń, U.; Szaniec, W. Assessment of steel truss fire safety in terms of the system reliability analysis. Arch. Civ. Mech. Eng. 2019, 19, 417–427. [Google Scholar] [CrossRef]
- Stocki, R. Analiza Niezawodności i Optymalizacja Odpornościowa Złożonych Konstrukcji i Procesów Technologicznych; IPPT PAN: Warsaw, Poland, 2010. [Google Scholar]
- Stocki, R.; Kolanek, K.; Knabel, J.; Tauzowski, P. FE based structural reliability analysis using STAND environment. Comput. Assist. Mech. Eng. Sci. 2009, 16, 35–58. [Google Scholar]
- Computer System Numpress. Available online: http://numpress.ippt.pan.pl/ (accessed on 29 August 2021).
- Pettermann, H.E.; Huber, C.O.; Luxner, M.H.; Nogales, S.; Böhm, H.J. An Incremental Mori-Tanaka Homogenization Scheme for Finite Strain Thermoelastoplasticity of MMCs. Materials 2010, 3, 434–451. [Google Scholar] [CrossRef]
- Berardi, V.P.; Mancusi, G. Time-Dependent Behavior of Reinforced Polymer Concrete Columns under Eccentric Axial Loading. Materials 2012, 5, 2342–2352. [Google Scholar] [CrossRef] [Green Version]
- Piotrowski, R.; Siedlecka, M. Point Protection of Primary Beams of Steel Grillages Against Lateral Torsional Buckling. Adv. Sci. Technol. Res. J. 2020, 14, 1–8. [Google Scholar] [CrossRef]
- Xie, X.; Li, X.; Shen, Y. Static and Dynamic Characteristics of a Long-Span Cable-Stayed Bridge with CFRP Cables. Materials 2014, 7, 4854–4877. [Google Scholar] [CrossRef] [Green Version]
- Kubicka, K.; Pawlak, U.; Radoń, U. Influence of the Thermal Insulation Type and Thickness on the Structure Mechanical Response Under Fire Conditions. Appl. Sci. 2019, 9, 2606. [Google Scholar] [CrossRef] [Green Version]
- Shi, J.; Shen, J.; Yu, X.; Liu, J.; Zhou, G.; Li, P. Stressing State Analysis of an Integral Abutment Curved Box-Girder Bridge Model. Materials 2019, 12, 1841. [Google Scholar] [CrossRef] [Green Version]
- Barazzetta, G.M.; Mossa, E.; Poggi, C.; Simoncelli, M. The Airplane Hangars of Pier Luigi Nervi: Digital and Scaled Models. J. Int. Assoc. Shell Spat. Struct. 2020, 61, 187–200. [Google Scholar] [CrossRef]
- Gwóźdż, M.; Machowski, A. Selected Studies and Calculations of Building Structures with Probabilistic Methods; Wydawnictwo Politechniki Krakowskiej: Kraków, Poland, 2011. (In Polish) [Google Scholar]


| No. | X | Y | Z | No. | X | Y | Z | No. | X | Y | Z |
|---|---|---|---|---|---|---|---|---|---|---|---|
| 1 | −3.380 | 0.000 | 6.000 | 41 | −8.996 | −6.536 | 4.700 | 81 | −5.828 | −17.937 | 2.200 |
| 2 | −3.215 | 1.044 | 6.000 | 42 | −10.576 | −3.436 | 4.700 | 82 | −11.086 | −15.258 | 2.200 |
| 3 | −2.734 | 1.987 | 6.000 | 43 | −11.120 | 0.000 | 4.700 | 83 | −15.258 | −11.086 | 2.200 |
| 4 | −1.987 | 2.734 | 6.000 | 44 | −10.576 | 3.436 | 4.700 | 84 | −17.937 | −5.828 | 2.200 |
| 5 | −1.044 | 3.215 | 6.000 | 45 | −8.996 | 6.536 | 4.700 | 85 | −18.860 | 0.000 | 2.200 |
| 6 | 0.000 | 3.380 | 6.000 | 46 | −6.536 | 8.996 | 4.700 | 86 | −17.937 | 5.828 | 2.200 |
| 7 | 1.044 | 3.215 | 6.000 | 47 | −3.436 | 10.576 | 4.700 | 87 | −15.258 | 11.086 | 2.200 |
| 8 | 1.987 | 2.734 | 6.000 | 48 | 0.000 | 11.120 | 4.700 | 88 | −11.086 | 15.258 | 2.200 |
| 9 | 2.734 | 1.987 | 6.000 | 49 | 3.436 | 10.576 | 4.700 | 89 | −5.828 | 17.937 | 2.200 |
| 10 | 3.215 | 1.044 | 6.000 | 50 | 6.536 | 8.996 | 4.700 | 90 | 0.000 | 18.860 | 2.200 |
| 11 | 3.380 | 0.000 | 6.000 | 51 | 8.996 | 6.536 | 4.700 | 91 | 5.828 | 17.937 | 2.200 |
| 12 | 3.215 | −1.044 | 6.000 | 52 | 10.576 | 3.436 | 4.700 | 92 | 11.086 | 15.258 | 2.200 |
| 13 | 2.734 | −1.987 | 6.000 | 53 | 11.120 | 0.000 | 4.700 | 93 | 15.258 | 11.086 | 2.200 |
| 14 | 1.987 | −2.734 | 6.000 | 54 | 10.576 | −3.436 | 4.700 | 94 | 17.937 | 5.828 | 2.200 |
| 15 | 1.044 | −3.215 | 6.000 | 55 | 8.996 | −6.536 | 4.700 | 95 | 18.860 | 0.000 | 2.200 |
| 16 | 0.000 | −3.380 | 6.000 | 56 | 6.536 | −8.996 | 4.700 | 96 | 17.937 | −5.828 | 2.200 |
| 17 | −1.044 | −3.215 | 6.000 | 57 | 3.436 | −10.576 | 4.700 | 97 | 15.258 | −11.086 | 2.200 |
| 18 | −1.987 | −2.734 | 6.000 | 58 | 0.000 | −11.120 | 4.700 | 98 | 11.086 | −15.258 | 2.200 |
| 19 | −2.734 | −1.987 | 6.000 | 59 | −3.436 | −10.576 | 4.700 | 99 | 5.828 | −17.937 | 2.200 |
| 20 | −3.215 | −1.044 | 6.000 | 60 | −6.536 | −8.996 | 4.700 | 100 | 0.000 | −18.860 | 2.200 |
| 21 | −6.895 | −2.240 | 5.500 | 61 | −8.811 | −12.127 | 3.600 | 101 | 0.000 | −22.730 | 0.000 |
| 22 | −7.250 | 0.000 | 5.500 | 62 | −12.127 | −8.811 | 3.600 | 102 | −7.024 | −21.618 | 0.000 |
| 23 | −6.895 | 2.240 | 5.500 | 63 | −14.256 | −4.632 | 3.600 | 103 | −13.360 | −18.389 | 0.000 |
| 24 | −5.865 | 4.261 | 5.500 | 64 | −14.990 | 0.000 | 3.600 | 104 | −18.389 | −13.360 | 0.000 |
| 25 | −4.261 | 5.865 | 5.500 | 65 | −14.256 | 4.632 | 3.600 | 105 | −21.618 | −7.024 | 0.000 |
| 26 | −2.240 | 6.895 | 5.500 | 66 | −12.127 | 8.811 | 3.600 | 106 | −22.730 | 0.000 | 0.000 |
| 27 | 0.000 | 7.250 | 5.500 | 67 | −8.811 | 12.127 | 3.600 | 107 | −21.618 | 7.024 | 0.000 |
| 28 | 2.240 | 6.895 | 5.500 | 68 | −4.632 | 14.256 | 3.600 | 108 | −18.389 | 13.360 | 0.000 |
| 29 | 4.261 | 5.865 | 5.500 | 69 | 0.000 | 14.990 | 3.600 | 109 | −13.360 | 18.389 | 0.000 |
| 30 | 5.865 | 4.261 | 5.500 | 70 | 4.632 | 14.256 | 3.600 | 110 | −7.024 | 21.618 | 0.000 |
| 31 | 6.895 | 2.240 | 5.500 | 71 | 8.811 | 12.127 | 3.600 | 111 | 0.000 | 22.730 | 0.000 |
| 32 | 7.250 | 0.000 | 5.500 | 72 | 12.127 | 8.811 | 3.600 | 112 | 7.024 | 21.618 | 0.000 |
| 33 | 6.895 | −2.240 | 5.500 | 73 | 14.256 | 4.632 | 3.600 | 113 | 13.360 | 18.389 | 0.000 |
| 34 | 5.865 | −4.261 | 5.500 | 74 | 14.990 | 0.000 | 3.600 | 114 | 18.389 | 13.360 | 0.000 |
| 35 | 4.261 | −5.865 | 5.500 | 75 | 14.256 | −4.632 | 3.600 | 115 | 21.618 | 7.024 | 0.000 |
| 36 | 2.240 | −6.895 | 5.500 | 76 | 12.127 | −8.811 | 3.600 | 116 | 22.730 | 0.000 | 0.000 |
| 37 | 0.000 | −7.250 | 5.500 | 77 | 8.811 | −12.127 | 3.600 | 117 | 21.618 | −7.024 | 0.000 |
| 38 | −2.240 | −6.895 | 5.500 | 78 | 4.632 | −14.256 | 3.600 | 118 | 18.389 | −13.360 | 0.000 |
| 39 | −4.261 | −5.865 | 5.500 | 79 | 0.000 | −14.990 | 3.600 | 119 | 13.360 | −18.389 | 0.000 |
| 40 | −5.865 | −4.261 | 5.500 | 80 | −4.632 | −14.256 | 3.600 | 120 | 7.024 | −21.618 | 0.000 |
| Force/Bearing Capacity | Value |
|---|---|
| NEd [kN]—axial force | 445.444 |
| Nc,Rd [kN]—design capacity of the section under uniform compression | 1200.85 |
| Nb,Rd [kN]—design buckling resistance of the compressed element | 878.945 |
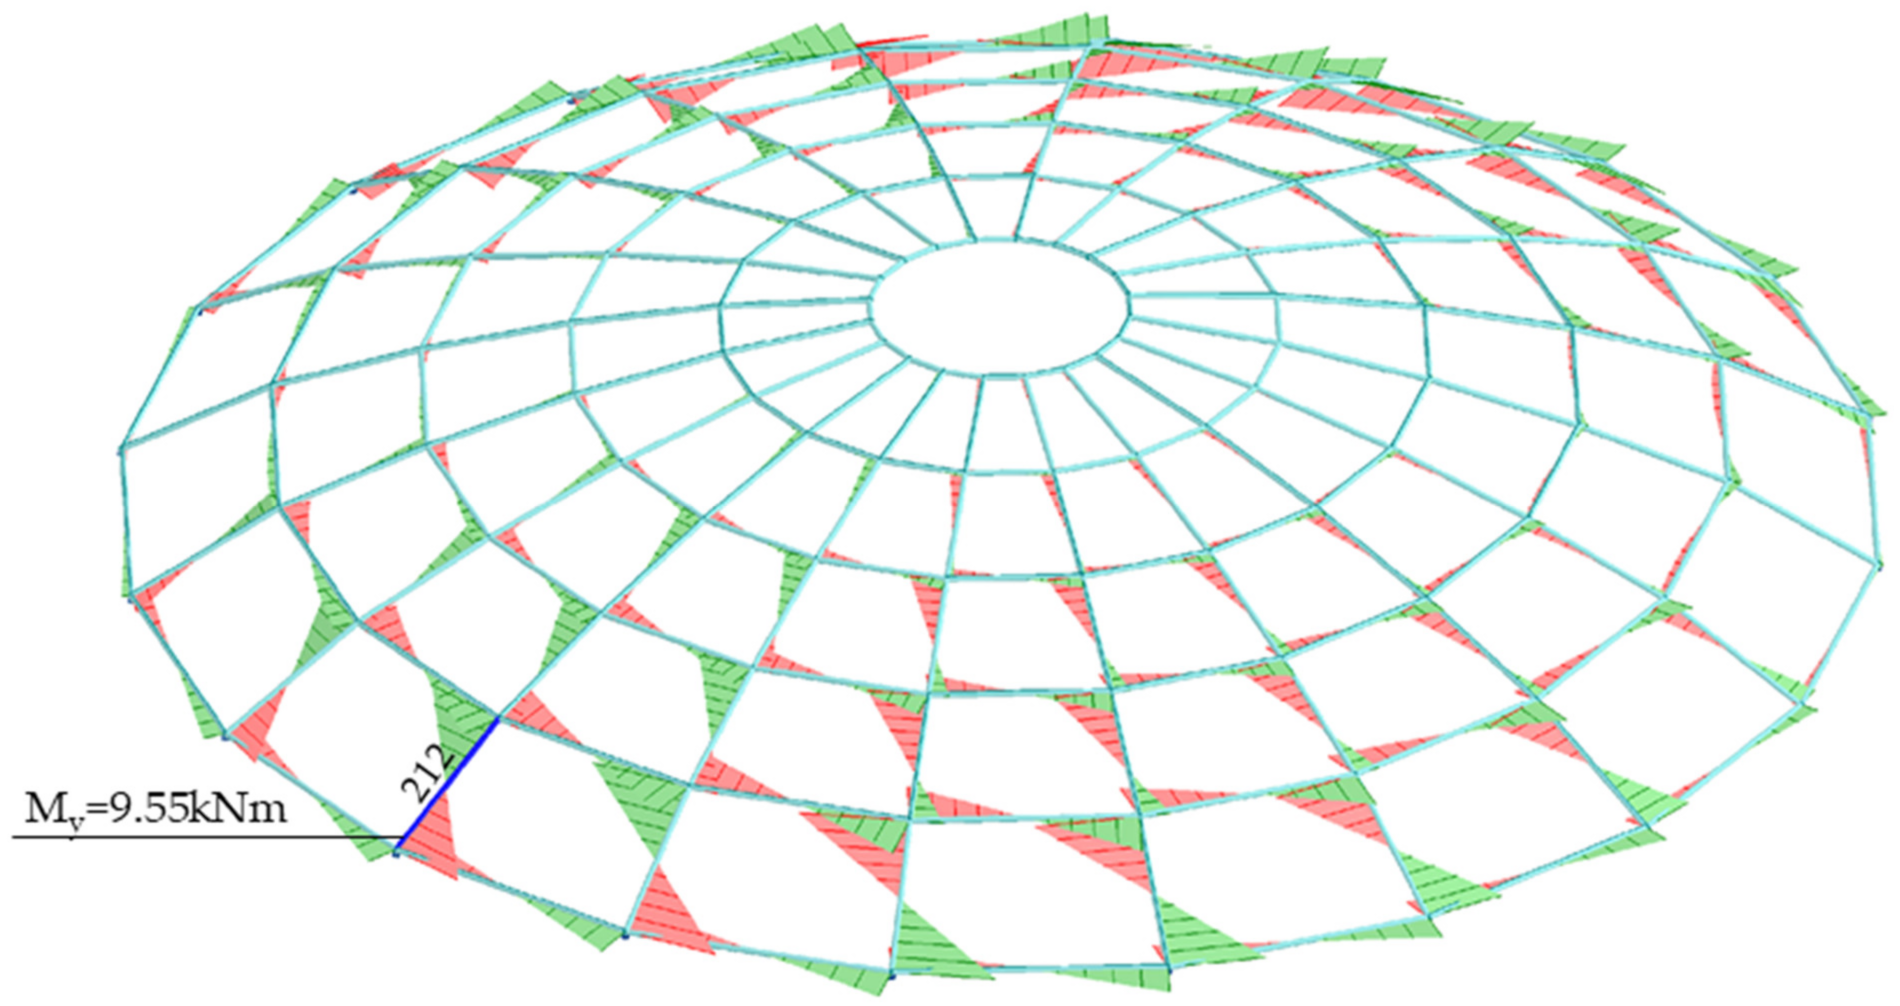
| My,Ed,Max [kNm]—design bending moment with respect to y-y axis | 9.55 |
| My,c,Rd [kNm]—design bending resistance with respect to y-y axis | 56.73 |
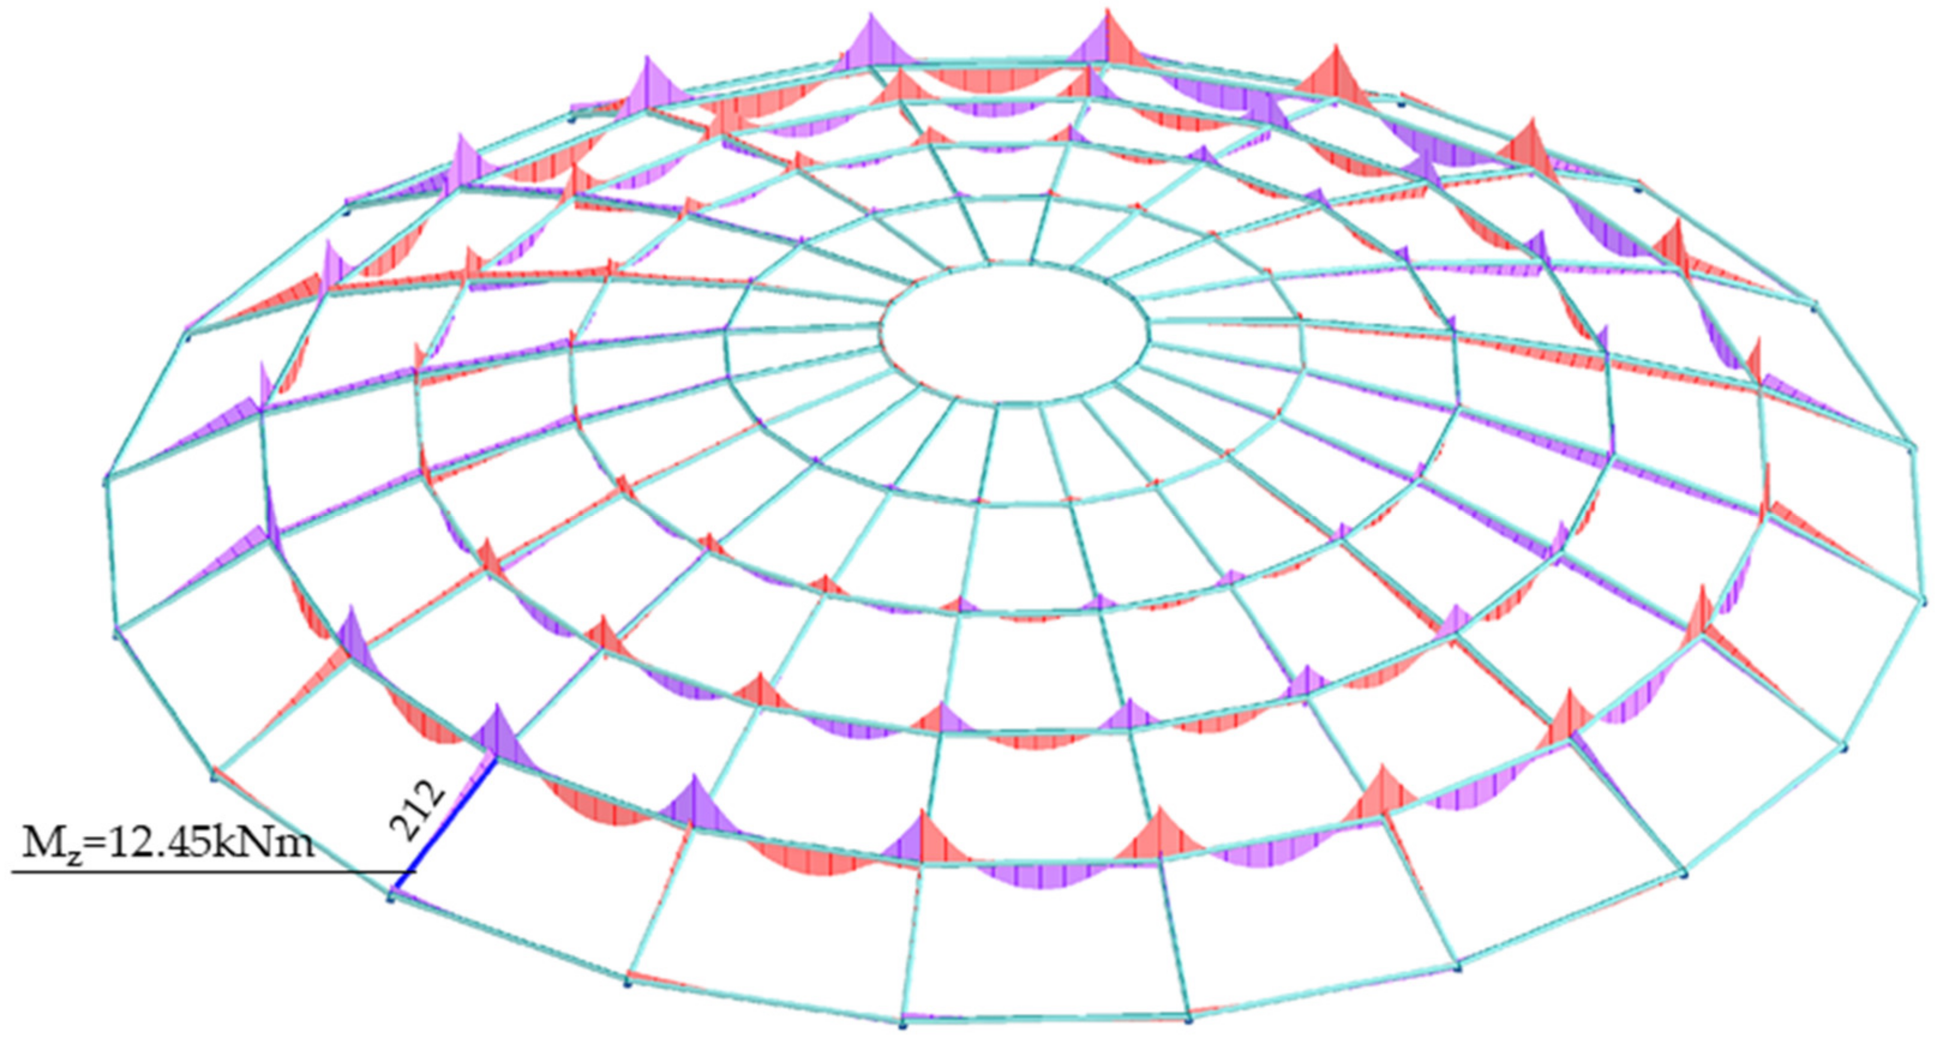
| Mz,Ed,max [kNm]—design bending moment with respect to z-z axis | 12.45 |
| Mz,c,Rd [kNm]—design bending resistance with respect to z-z axis | 56.73 |
| Strength utilization [%] | 95 |
| Maximum vertical displacement [mm]—for node 58 | 121.36 |
| Allowable vertical displacement [mm]—D/300 | 151.53 |
| Maximum horizontal displacement [mm]—for node 58 | 35.24 |
| Allowable horizontal displacement [mm]—H/150 | 40.00 |
| Case 1 | |
|---|---|
| Random variable | Type of probability distribution |
| P1—dead load | Normal (5400, 540) |
| P2—snow load | Normal (3900, 562) |
| P3—wind load | Normal (300, 60) |
| E—Young’s modulus | Normal (2.1 × 10¹¹, 5.1 × 10⁹) |
| A—cross-sectional area | Normal (0.00511, 0.0002555) |
| Case 2 | |
|---|---|
| Random variable | Type of probability distribution |
| P1—dead load | Normal (5400, 540) |
| P2—snow load | Gumbel (3647.07, 438.190) |
| P3—wind load | Gumbel (272.997, 46.782) |
| E—Young’s modulus | Log-normal (2.1 × 10¹¹, 5.1 × 10⁹) |
| A—cross-sectional area | Log-normal (0.00511, 0.0002555) |
| Reliability Index β for SLS | ||
|---|---|---|
| FORM | Monte Carlo | |
| CASE 1 | 4.334 | 4.265 |
| CASE 2 | 3.588 | 3.494 |
| Reliability Index β for ULS | |
|---|---|
| FORM | |
| CASE 1 | 2.738 |
| CASE 2 | 2.492 |
Publisher’s Note: MDPI stays neutral with regard to jurisdictional claims in published maps and institutional affiliations. |
© 2021 by the authors. Licensee MDPI, Basel, Switzerland. This article is an open access article distributed under the terms and conditions of the Creative Commons Attribution (CC BY) license (https://creativecommons.org/licenses/by/4.0/).
Share and Cite
Zabojszcza, P.; Radoń, U.; Szaniec, W. Probabilistic Approach to Limit States of a Steel Dome. Materials 2021, 14, 5528. https://doi.org/10.3390/ma14195528
Zabojszcza P, Radoń U, Szaniec W. Probabilistic Approach to Limit States of a Steel Dome. Materials. 2021; 14(19):5528. https://doi.org/10.3390/ma14195528
Chicago/Turabian StyleZabojszcza, Paweł, Urszula Radoń, and Waldemar Szaniec. 2021. "Probabilistic Approach to Limit States of a Steel Dome" Materials 14, no. 19: 5528. https://doi.org/10.3390/ma14195528
APA StyleZabojszcza, P., Radoń, U., & Szaniec, W. (2021). Probabilistic Approach to Limit States of a Steel Dome. Materials, 14(19), 5528. https://doi.org/10.3390/ma14195528