Abstract
The stress strain curve of 7075 aluminum alloy in the temperature range of 310 °C to 410 °C was obtained by Gleeble-3800. By Nakazima test, the isothermal thermoforming limit diagrams of 7075 aluminum alloy at different deformation temperatures and stamping speeds were acquired. Moreover, the parameters of automotive S-rail hot stamping process were optimized by GA-BP neural network. The results show that the forming limit curve of 7075 aluminum alloy increases as the deformation temperature and stamping speed increase. The predicted optimal parameters for hot stamping of automotive S-rails by GA-BP neural network are: stamping speed is 50 mm/s, friction coefficient between die and blank is 0.1, and blank holder force is 5 kN. The maximum thinning rate at this process parameter is 9.37%, which provided a reference for 7075 aluminum alloy automotive S-rail hot stamping.
1. Introduction
Due to severe environmental pressures and the increasing depletion of energy, higher requirements have been placed on the automobile manufacturing industry. The trends of today’s automotive industry are energy saving, environmental protection and safety. Under the premise of ensuring the safety of the car, reducing the weight of vehicles can effectively achieve energy savings and reduce emissions [1,2]. The advantages of high strength, recyclability and good performance make aluminum alloy one of the most ideal materials in current automotive lightweighting technology [3]. However, the plastic elongation of aluminum alloy materials is low at room temperature, therefore, most aluminum alloy sheet metal parts are formed by hot stamping [4].
The process of aluminum alloy hot stamping is: first, the high-strength light alloy sheet such as aluminum alloy is heated, generally to 300 °C~500 °C [5,6], so that the alloy material has good elongation. Then, the heated alloy sheet is quickly moved to the forming die device for stamping, so as to obtain a light alloy structure with good formability, smaller rebound and higher strength.
One of the important goals of the sheet metal forming process design is to manufacture the blank into the required shape without any failures, such as fracture and excessive local thinning. The determination and prediction of the forming limit are of great significance to prevent material failures in sheet metal forming. Bruschi et al. [7] reviewed the development of testing methods and modeling theory in the field of sheet metal forming. Among them, the forming limit diagram (FLD) [8] is the most widely used and direct method in the industry. Killer et al. [9,10] first proposed the concept of forming limit diagram, which was widely used to predict the comprehensive forming performance of sheet metal. Currently, there are two typical methods to determine FLD: the Nakajima test [11] and the Marciniak test [12]. Generally, the FLD can completely cover various strain paths that appear in industrial forming operations. In order to achieve different strain paths, loads that generate different strain paths are applied to the sheet specimen, so that uniaxial stretching becomes biaxial stretching.
In recent years, many scholars have conducted research on 7075 aluminum alloy hot stamping. Xiao et al. [13] studied the influences of process parameters such as blank temperature, stamping speed, blank holder force, and friction coefficient on the formability and mechanical properties of 7075 aluminum alloy deep drawing, based on the hot stamping process. Liu et al. [14] studied the formability of 6061 and 7075 aluminum alloy hot stamping automotive B-pillars under different solution heating times and different lubrication conditions. Song et al. [15] proposed a servo motion to study the hot stamping formability of 7075 aluminum alloy thin-walled cylindrical parts, and revealed the law and mechanism of the influence of servo motion on the formability of thin-walled cylindrical parts. Liu et al. [16] developed a novel experimental apparatus for measuring the temperature variation of sheet and die for hot stamping of 7075 aluminum alloy under dry and lubricated conditions with different contact pressures. Rong et al. [17] proposed an improved continuous damage model and incorporated it into a set of uniaxial unified viscoplastic constitutive equations to describe the thermal flow behavior of AA7075 alloy. Then, the damage correction formula was introduced into the damage model to predict the hot forming limit diagram of AA7075 at high temperature. Ying et al. [18] determined the thermoforming limit diagram (TFLD) of AA7075 aluminum alloy by experiment and numerical simulation. Liu et al. [19] developed an initial blank temperature correlation model to predict the interfacial heat transfer coefficient (IHTC) of 7075 aluminum alloy at different initial blank temperatures and verified it through the results of non-isothermal forming tests. Gao et al. [6] used the GTN model to predict the mechanical properties of 7075 aluminum alloy thermal in a small punch test experiment. They verified that the GTN damage model can predict the damage evolution of the B-pillar. Xiao et al. [5] predicted the forming limit curve of 7075 aluminum alloy at high temperature based on the continuous damage mechanics model.
In this paper, the high temperature mechanical properties of 7075 aluminum alloy are determined through uniaxial hot tensile experiment. The forming limit diagrams of 7075 aluminum alloy at different temperatures and stamping speeds were obtained by Nakazima test, and the mechanical properties and microstructure of the formed parts were analyzed. In addition, the process parameters of 7075 aluminum alloy automobile S-rail hot stamping forming are optimized through GA-BP neural network and the optimization results are analyzed and verified, which can be used to improve hot stamping formability and reduce forming defects, providing a reference for 7075 aluminum alloy hot stamping forming. The results show that the aluminum hot stamping process can significantly improve the formability without reducing the mechanical properties.
2. Materials and Experiment
2.1. Material
In the experiment, rolled 7075 aluminum alloy with the thickness of 2 mm was selected. The chemical composition of the alloy is (wt %) 0.07 Si-0.22 Fe-1.4 Cu-0.01 Mn-2.2 Mg-0.19 Cr-5.4 Zn-0.02 Ti-(bal.) Al. The properties of the materials at room temperature conditions are shown in Table 1 [13]. Figure 1 shows the microstructure along the short transverse (ST) of the rolled alloy. In Figure 1, typical elongated pancake-like particles can be observed, with an average thickness of 12 μm, in which sediments are distributed.

Table 1.
Properties of 7075 aluminum alloy at room temperature.
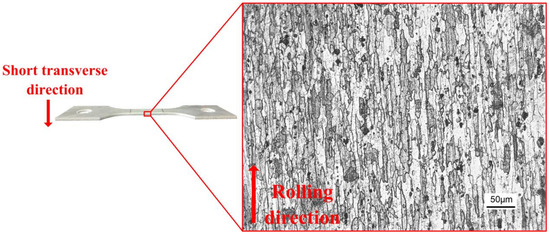
Figure 1.
Short transverse microstructure of 7075 aluminum alloy.
2.2. High Temperature Tensile Test
To measure the mechanical data of 7075 aluminum alloy under high temperature conditions, the Gleeble-3800 thermal simulation testing machine was used to perform constant high temperature stretching of 7075 aluminum alloy. Gleeble-3800 adopts computer programming control technology and hydraulic power control technology, which has the characteristics of high precision and good repeatability of simulation tests. The Gleeble-3800 selected for this test is manufactured by FULETE Instrument Technology (Shanghai) Company Limited (Shanghai, China). The shape and size of the sample are shown in Figure 2 (unit: mm). A wire cutting machine is used to cut the sheet into a tensile sample. The length of the sample is the same as the rolling direction of the sheet, and the outline of the sample is smoothed with 400# sandpaper.
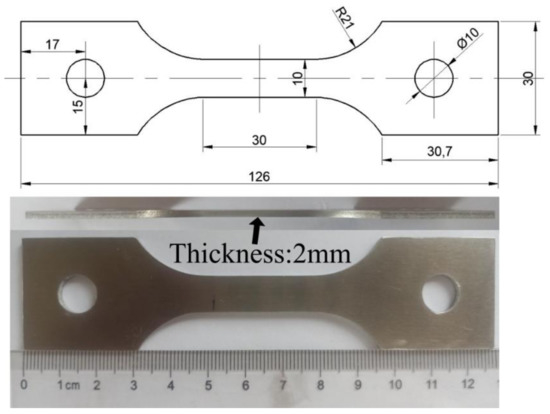
Figure 2.
The shape and size of the sample.
Combined with the hot stamping process, the design of high temperature tensile experiment scheme is shown in Figure 3. First, the sample was heated to 450 °C at a rate of 20 °C/s, and then to a solution temperature of 480 °C at a rate of 5 °C/s, and then kept warm for 10 min. The sample was reduced to the deformation temperature at 20 °C/s, and the temperature was kept for 10 s to make the temperature of the sample uniform. The tensile test was carried out at a constant temperature and strain rate, and the specimen was quickly cooled after being broken to preserve its microstructure at high temperature. The deformation temperature is 310 °C, 360 °C, 410 °C, and the strain rate is 0.001 s−1, 0.01 s−1, 0.1 s−1, 1s−1, respectively.
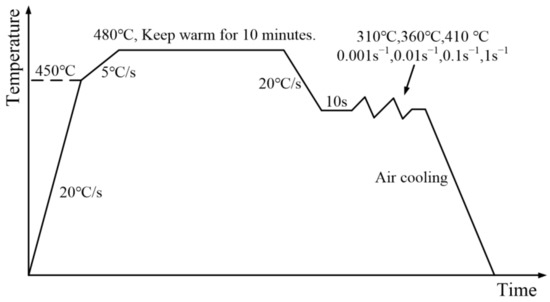
Figure 3.
Sample temperature history.
Figure 4 shows the true stress-strain curve of 7075 aluminum alloy sheet under different deformation temperatures and different strain rates. It can be seen from the figure that at the same deformation temperature, the flow stress increases significantly with the increase of the strain rate. At the same time, it is also found that at the same deformation temperature, the ultimate strain of the sample increased slightly with the increase of the strain rate. At the same strain rate, the flow stress decreases with the increase of the deformation temperature, which is manifested as thermal softening.
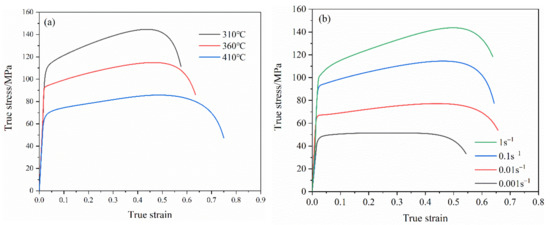
Figure 4.
The stress-strain curve of 7075 aluminum alloy under different conditions. (a) The strain rate is 0.1, (b) the deformation temperature is 360 °C.
2.3. Isothermal Forming Limit Experiment of Aluminum Alloy Sheet
The hemispherical rigid punch bulging test method (Nakazima test) was used to study the isothermal thermal deformation behavior of 7075 aluminum alloy under plane stress. The experimental equipment is the muffle furnace of model SXL-1700C (SHANGHAI JUJING PRECISION INSTRUMENT MANUFACTURING CO., LTD., Shanghai, China) and the sheet forming test machine of model EC600H (SHANGHAI GENBON INDUSTRIAL CO., LTD., Shanghai, China), as shown in Figure 5. The muffle furnace has high temperature control accuracy and good heat preservation effect, and is used for heating blanks. The sheet forming test machine is mainly composed of a punch, a die and a blank holder. The specific dimensions are shown in Figure 6 (unit: mm). During the working process, the blank is placed on the die, and then the blank holder moves downwards to compress it with a constant blank holder force (6 kN), which is provided by a nitrogen gas spring. Subsequently, the punch moves downwards, and the blank is deformed in the process of contact with the punch. Stretching ribs are arranged on the blank holder to prevent the sheet material from flowing into the cavity in the die during the deformation process.
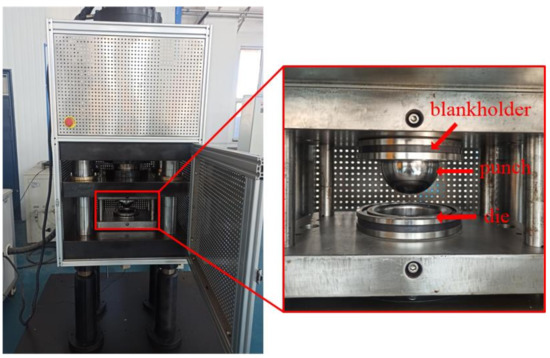
Figure 5.
Sheet forming test machine.
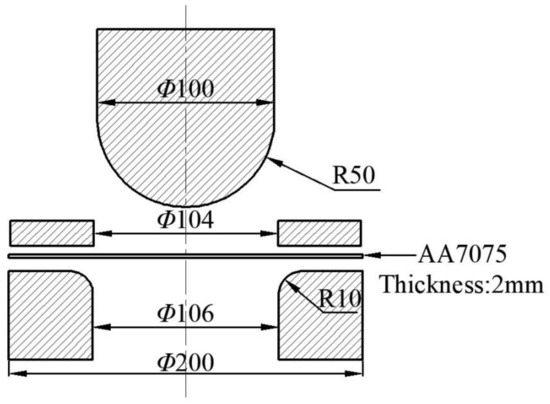
Figure 6.
Dimensions of sheet metal forming test machine (unit:mm).
The blank geometry and size are shown in Figure 7. The blank width w in the figure corresponds to 5 groups of different sizes, which are 30 mm, 80 mm, 100 mm, 150 mm and 200 mm. The thickness of the blank is 2 mm. Blanks with different widths correspond to different stress states, and the blanks with a width of 30 mm are subjected to uniaxial tensile stress during the deformation process. The blank with a width of 200 mm is subjected to double tensile stress during the deformation process. The rest of the width of the blank is under plane stress during the deformation process, and the stress ratio is between the blank with a width of 30 mm and the blank with a width of 200 mm. The circular grid with the diameter of 2 mm is applied to the surface of the blank by electrochemical corrosion to facilitate subsequent strain measurement. In the process of blank deformation, the experiment will be stopped when the blank is locally necked or just ruptured. The deformation grid near the neck or the fracture site is measured to calculate the local ultimate strain. Then, the ultimate strain under different deformation conditions is plotted on the main strain diagram to form the forming limit curve (FLC).
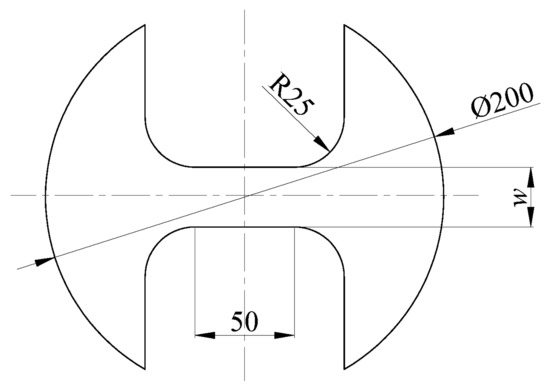
Figure 7.
The geometry and size of the blank (unit: mm).
During the experiment, the die is heated to the forming temperature (310 °C, 360 °C, 410 °C) with the heating rod, and the blank is heated to the deformation temperature in the muffle furnace and kept for 10 min. Subsequently, the blank is manually transferred to the sheet forming test machine within 3 s, and the positioning is completed. Taking into account the temperature drop of the blank during the manual transfer process, the heating temperature of the blank should be increased by 10 °C compared with the deformation temperature to ensure that the temperature of the blank is consistent with the die temperature and achieve isothermal forming. The central area of the blank (diameter <100 mm) and the punch are fully lubricated with dry graphite lubricant, and the contact friction coefficient between the punch and the blank is about 0.1 [20]. The movement speed of the hydraulic press is controlled to adjust the punching speed. The adjustable range of the punching speed is about 10–40 mm/s, and the corresponding strain rate is 0.2–0.8 [21]. Each experiment is repeated 3 times to ensure the accuracy of the experiment. Figure 8 shows part of the 7075 aluminum alloy blank isothermal forming a limit fracture.

Figure 8.
Isothermal forming of a limit fracture of 7075 aluminum alloy blank.
After the completion of the experiment, it is necessary to select the critical grid used to calculate the strain, namely, the largest deformed grid next to the broken grid. The measured grid size is converted into the maximum and minimum strain, which are projected in the coordinate system to obtain the forming limit diagram at the corresponding process conditions [22,23].
3. 7075 Aluminum Alloy Isothermal Forming Limit Analysis
3.1. Results of Forming Limit Diagram
Figure 9a is the forming limit diagram of 7075 aluminum alloy when the stamping speed is 20 mm/s and the forming temperature is 360 °C. It can be seen from the figure that the maximum principal strain of the uniaxial stretching zone is greater than the maximum principal strain of the biaxial stretching zone, which make the FLC present an upward warping trend on the left. If the principal strain is below 0.408, the effectiveness of the formed part can be guaranteed. If the principal strain is higher than this value, the formed part is prone to cracking failure. Figure 9b shows the forming limit diagram at the stamping speed of 20 mm/s and different deformation temperatures. It can be seen from the figure that the forming limit curve of 7075 aluminum alloy has improved as the temperature increases, which means that the forming limit of the material has increased. In the plane strain state, the maximum principal strain increased from 0.381 at 310 °C to 0.434 at 410 °C, an increase of about 14%.
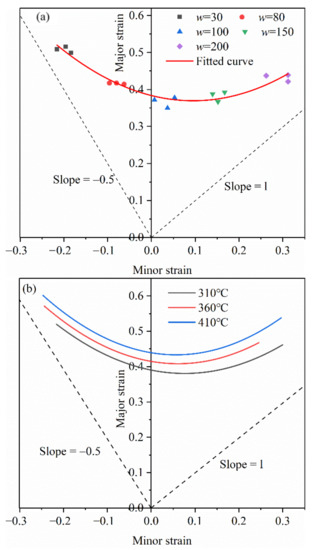
Figure 9.
(a) 360 °C forming limit diagram, (b) forming limit curves at different temperatures.
Figure 10 shows the effect of stamping speed on the forming limit curve of 7075 aluminum alloy when the deformation temperature is 410 °C. It can be seen from the figure that when the stamping speed increases from 10 m/s to 40 mm/s, the forming limit of the material is slightly increased, and the change is not very obvious. The specific reason is that in the isothermal Nakazima test, the strain rate corresponding to the punching speed of 10 mm/s to 40 mm/s is 0.2–0.8, and the strain rate in the experiment is only expanded by 4 times. Therefore, the impact of the stamping speed on the forming limit is very small, only increasing by 2%. It can be considered that when the stamping speed is within 10 mm/s to 40 mm/s, the impact of stamping speed on the forming limit is negligible, and the change of stamping speed has basically no effect on the forming limit of 7075 aluminum alloy.
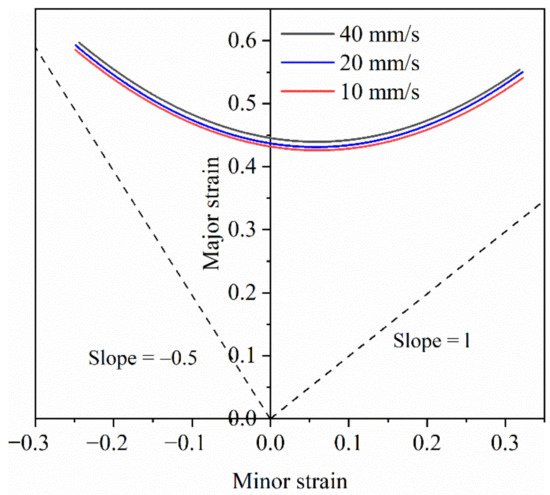
Figure 10.
Forming limit curves at different stamping speeds of 410 °C.
3.2. Fracture Morphology Analysis
A scanning electron microscope (SEM, Shanghai Opton Instrument Co., Ltd., Shanghai, China) was used to observe the fracture morphology of the samples at different conditions. Figure 11 shows the fracture morphology of the sample with a width of 30 mm at 310 °C and 360 °C. It can be seen from the figure that there are various dimples and voids distributed in the fracture of the sample at 310 °C and 360 °C. The number and size of the dimples are related to the number and size of the second phase in the material [24,25]. When the width is 30mm, the strain path is approximately uniaxial stretching, so the dimple shape is similar to the dimple shape in uniaxial thermal stretching. Dimples appear when the material fractures by ductile fracture [26]. When the deformation temperature is 360 °C, the number of dimples is less than that at 310 °C, but the depth and size of the dimples increases. The depth of the dimple is consistent with the plasticity of the material, and there is a deeper dimple at 360 °C, indicating that the sample has better plasticity at this time, which is consistent with the result of Figure 9b. It can be seen from the figure that there are obvious second-phase particles in some dimples, which indicates that some voids nucleate at the second-phase particles. In addition, the nucleation and coalescence of micro-voids can be seen in the figure. The micro-voids nucleate, grow and accumulate into larger voids, thereby generating cracks.
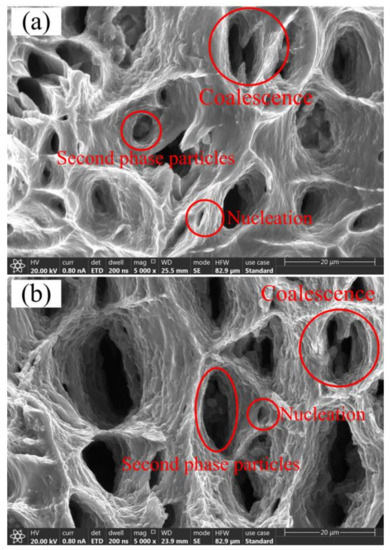
Figure 11.
Fracture morphology of w = 30 (as shown in Figure 7) samples at different temperatures. (a) 310 °C, (b) 360 °C.
Figure 12 shows the fracture morphology of the sample with a width of 80 mm and 200 mm at a deformation temperature of 360 °C. From the figure, we can see the obvious second phase particles, the nucleation and coalescence of the voids. In addition, the dimples of the sample with a width of 80 mm are flat, and the dimples of the sample with a width of 200 mm are regular and circular. This is because the sample with a width of 200 mm is in a biaxial tension state, and the force received by the sample in the vertical direction in the plane is equal. The sample with a width of 80 mm is in the state of plane edge response. The force on the specimen in the vertical direction in the plane is not equal, and the dimple is elongated in the direction where the sample receives the greatest force. At the same time, it can be seen in the figure that as the width of the sample increases, the number of dimples and the size of the dimples decreases significantly. This shows that the sample with a width of 200 mm has better plasticity, which is consistent with the result in Figure 9a.
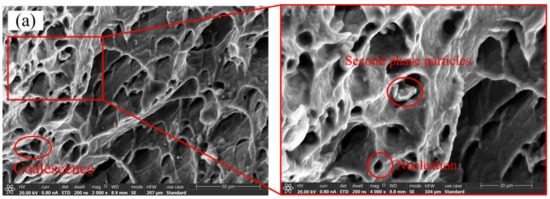
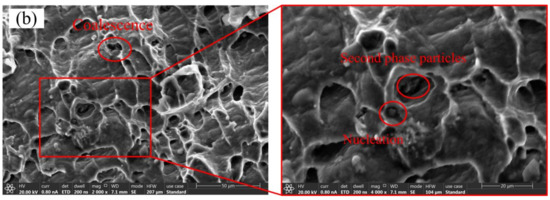
Figure 12.
Fracture morphology of samples with different widths at a deformation temperature of 360 °C (a) w = 80, (b) w = 200 (as shown in Figure 7).
4. Optimization of Hot Stamping Process Parameters of Automobile S-Rail
4.1. Finite Element Model
There are many car body parts and using aluminum alloy to make car body products can reduce the weight of the car body to achieve the goal of a lightweight car. The requirements for stamping and forming technology have also been continuously improved. The S rail is a component that absorbs energy inside the car body when the car collides. Therefore, it needs to be strong. It is divided into an axial rail and a lateral rail (S-shaped rail). Its position on the car body is shown in Figure 13.
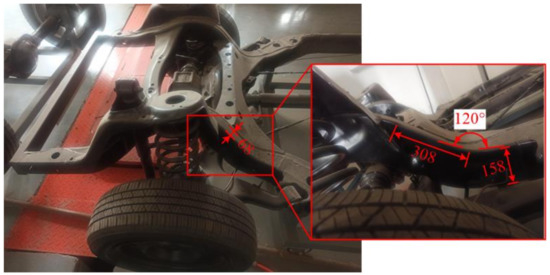
Figure 13.
Automobile S-rail (unit:mm).
The stamping dies and blank of the automobile S-rail were drawn in CREO software, as shown in Figure 14. The dies include punch, blank holder and lower die. In the ABAQUS software, in order to save analysis time, the dies and the blank choose the shell. The dies were set as the rigid body. The blank was set as a deformable shell, and the initial thickness of the blank was set to 1 mm. The basic mechanical properties of 7075 aluminum alloy, such as density, elastic modulus and Poisson’s ratio were inputted in the material properties. According to Figure 4, we inputted the plastic mechanical properties at different temperatures and strain rates, as well as the forming limit diagram obtained in the upper part into the FLD damage in ABAQUS material properties. The thermal properties of 7075 aluminum alloy are shown in Table 2 [18]. The analysis step of the model is a thermal-mechanical coupling analysis step. The die was set to room temperature (25 °C) and the sheet material was set to the forming temperature. The heat transfer between the tool and the blank was also considered. If the distance between the die and the blank exceeds 2 mm, it was ignored. Otherwise, it was set to a constant value of 16 kW·m−2·°C−1 [27].
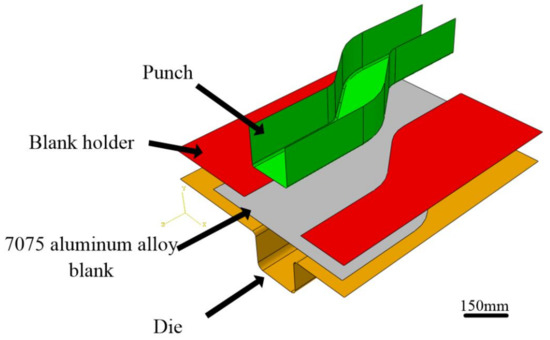
Figure 14.
Finite element model of automobile S-rail hot stamping.

Table 2.
Thermal properties of 7075 aluminum alloy.
The hot stamping process is: (1) Fix the die. (2) Apply a blank holder force to the blank holder. (3) Punch moves down 40 mm at a constant speed.
4.2. Orthogonal Experimental Design Based on Hot Stamping Process
An orthogonal experiment is a design method that studies multiple factors and multiple levels [28,29]. It selects a representative combination of factors from all the factor level combinations of the comprehensive experiment to conduct the experiment, which can greatly reduce the workload. By analyzing these representative combinations, useful and objective conclusions can be obtained efficiently and quickly. Therefore, orthogonal experiments have been widely used in scientific research in various fields [30,31].
The process parameters of hot stamping mainly include blank holder force, blank temperature, stamping speed, friction coefficient between blank and die, die gap and so on. The process parameters have a great influence on the performance of the sheet metal after forming. Since the optimal forming temperature of 7075 aluminum alloy is about 400 °C [32], the blank temperature selected in this article is 410 °C. Numerical simulation is used to study the influence of blank holder force, stamping speed and friction coefficient between blank and die on the maximum thinning rate after blank forming. Therefore, an orthogonal test with three factors and three levels is established. Table 3 is the level table of the orthogonal experiment of the numerical simulation.

Table 3.
Factor level table.
According to the well-divided factors and levels in Table 3, a three-factor and three-level orthogonal experimental design was constructed. The selected orthogonal table is L27(33). Through numerical simulation, the orthogonal test scheme of the maximum thinning rate based on the hot stamping process parameters was obtained, as shown in Table 4.

Table 4.
Orthogonal test scheme.
The cloud map of sheet thickness under some conditions is shown in Figure 15.
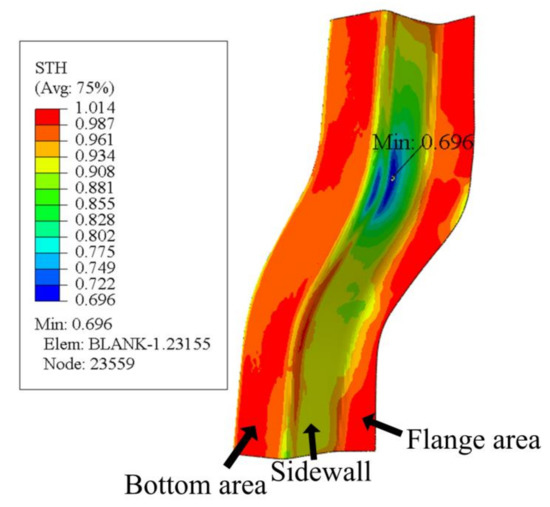
Figure 15.
Thickness cloud map at stamping speed of 10 mm/s, friction coefficient of 0.1, and blank holder force of 10.5 kN, forming temperature 410 °C.
4.3. Establishment of GA-BP Network
Back Propagation (BP) neural network is a multi-layer feedforward network trained according to the error back propagation algorithm. The basic idea of BP neural network is the gradient descent method, which uses error back propagation and repeated learning and training to minimize the mean square error between the actual output value and the expected output value of the network. Neural network is not only the basis of parallel processing and large-scale computing, but also a highly nonlinear dynamic and adaptive organizational system. BP neural networks can be used to describe cognition, decision-making and control intelligent behavior [33,34], which has non-linear mapping capabilities and is good at finding rules from input and output signals. It does not require precise mathematical models and has strong parallel computing capabilities. It is easy to perform programming calculations of software and hardware [35].
BP neural network is a three-layer feedforward neural network (input layer, hidden layer, output layer), as shown in Figure 16. Forward propagation and backward error transfer are completed by the learning process of BP neural network. First, in the forward propagation process, the input information will be processed by the hidden layer and passed to the output layer. The state of neurons in each layer only affects the next layer. If the desired result cannot be obtained, the error change of the output should be calculated. Then, in the reverse error transfer process, the error between the actual value and the output will return along the previous joint access, and change the joint weight to reduce the error. Finally, it returns to the forward propagation and calculates repeatedly until the error is less than the set value [36,37].
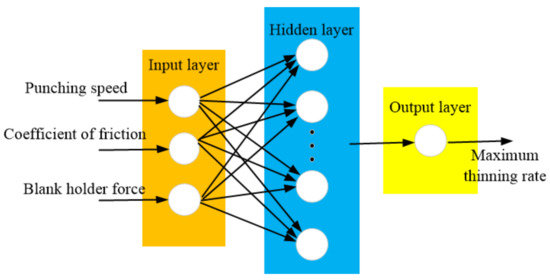
Figure 16.
BP neural network structure.
In this paper, a three-layer BP network model was chosen. In nonlinear function fitting, there are 3 input parameters and 1 output parameter. The hidden layer selects 7 nodes, which are calculated according to the formula of Equation (1).
where: n is the input nodes number. l is the output node. α is a constant and the range of α is 1–10. The Sigmoid function is chosen for the transfer function, which is:
In applications, BP neural networks have limitations in dealing with the problem. BP neural networks use the steepest descent method, which has the advantages of simplicity, a small amount of calculation and strong parallelism. However, it has the disadvantages of slow convergence in the learning process, susceptibility to falling into a local minimum, an incomplete algorithm, poor robustness and poor network performance [38]. To address the limitations of BP networks, there are three approaches: (1) additional momentum [39], (2) adaptive learning rate method, (3) genetic algorithm [40]. Genetic algorithms are metaheuristic algorithms inspired by natural selection processes and belong to the broad category of evolutionary algorithms. Genetic algorithms typically rely on biologically inspired operators such as variation, crossover and selection to generate high-quality solutions to optimize and search for problems [41,42]. Its main advantages are robustness, simplicity and generality. Therefore, BP neural networks are combined with genetic algorithms to optimize the weights and thresholds of neural networks and then use BP neural networks to solve the problem.
The neural network optimized by genetic algorithm includes three parts [43,44]: BP neural network, genetic algorithm optimization and BP neural network prediction. In the BP neural network, the BP structure is determined according to the number of parameters of the fitting function, and then the length of the algorithm is defined. The path of the genetic algorithm is optimized by weight and threshold based on BP neural network optimization. Each individual in the population contains all weights and thresholds of the network. The adaptive value of the function is calculated by the individual fitness function. In the BP neural network prediction, the best individual is found through selection, crossover and mutation, and the initial value of the weight value and the threshold value is obtained through the genetic algorithm. The prediction output function is obtained after network training. The specific flowchart is shown in Figure 17. The structure of BP neural network is determined according to the number of input and output parameters of fitting function, and then the individual length of genetic algorithm is determined. The weight and threshold of the BP neural network were optimized by genetic algorithm. The adaptive value can be calculated by the adaptive function, and the genetic algorithm finds the optimum adaptive value corresponding to the individual by selecting, crossing and variation operation. The parameters of the optimal individual are assigned to the initial weights and thresholds of the network, and finally the prediction model after training the network is obtained.
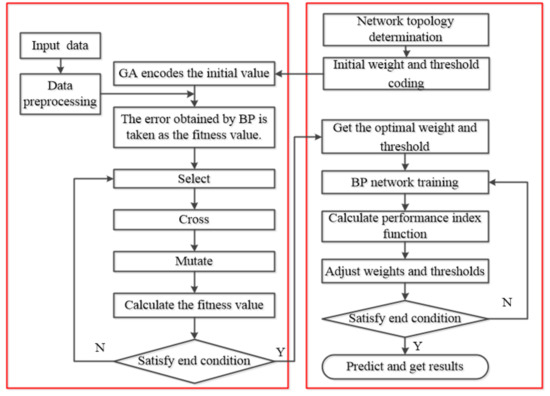
Figure 17.
GA-BP algorithm flow chart.
The GA-BP neural network was built in MATLAB. The BP neural network was created by the newff function. The training function trainlm, and its training principle, is based on the Levenberg–Marquardt algorithm. For medium-sized BP neural networks, it has the fastest convergence speed. The maximum number of trains is 3000, and the convergence error is 0.001. The initial weight and threshold are the default value of the system. The parameter setting of the genetic algorithm is shown in Table 5. The adaptation function uses training data to train the BP neural network and predicts the prediction error of the training data as an individual adaptability value. After a series of selections, crosses, variations, and repetitive operations, the genetic algorithm can eventually find the best individual corresponding to the best adaptivity value. A function using a roulette method from a population was used to select an individual with ideal adaptability. Two individuals were selected by cross function from the overall, and new individuals are acquired at a certain probability. The variation function selects an individual from the population randomly and gets a new individual by a certain probability change.

Table 5.
Parameters of genetic algorithm.
We selected the sample input to punching speed, coefficient of friction, blank holder force, and specified the input layers X1-X3, respectively, with the node values of the three parameters. The output layer is the maximum thinning rate. 20 groups of 27 sets of data in Table 4 were selected as training data, and the remaining 7 groups were tested as test data.
Due to the quantitative level and unit of the punching speed, the coefficient of friction, and the blank holder force, the data must be prepared first. In order to improve the speed and convenience of the network computing and improve the prediction accuracy, the mapminmax function was used to normalize the data. Figure 18 shows the iterative process of adaptability in the genetic algorithm. It can be seen that when there is an iteration of approximately 27 times, the adaptivity value reaches the lowest.
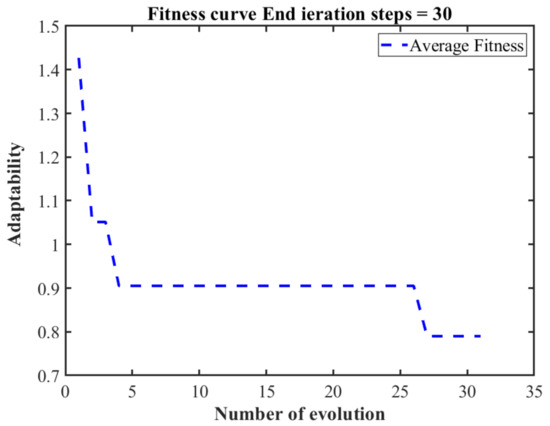
Figure 18.
GA-BP Neural Network Application Curve.
Figure 19 is a comparative and error diagram of the GA-BP neural network prediction value and the expected value. From the figure, it can be seen that the prediction results of GA-BP neural network are accurate. The prediction error remains within 0.05. The results of the multiple regression analysis of the prediction results are shown in Figure 20. The correlation coefficient of the training data is 0.9941, indicating that the fit effect is very good. At the same time, the R values of regression analysis used to verify data and test data are 0.983 and 0.92, respectively, indicating that the model is reliable. The optimal process parameter of the 7075 aluminum alloy predicted by the GA-BP neural network is: the punching speed is 50 mm/s, the coefficient of friction between the die and the blank is 0.1 and the blank holder force is 5 kN. Predictive results: the maximum thinning rate is 9.37%.
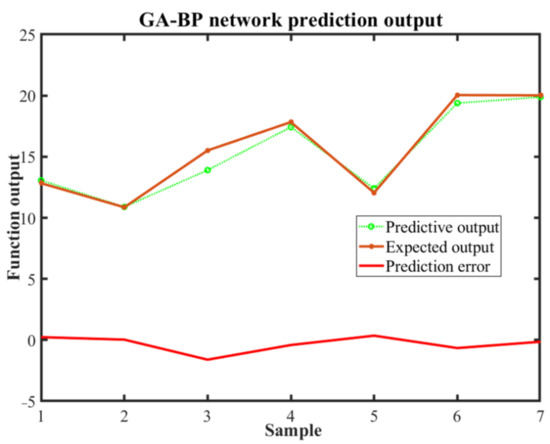
Figure 19.
Comparison and error diagram of GA-BP neural network predictive value and expected value.
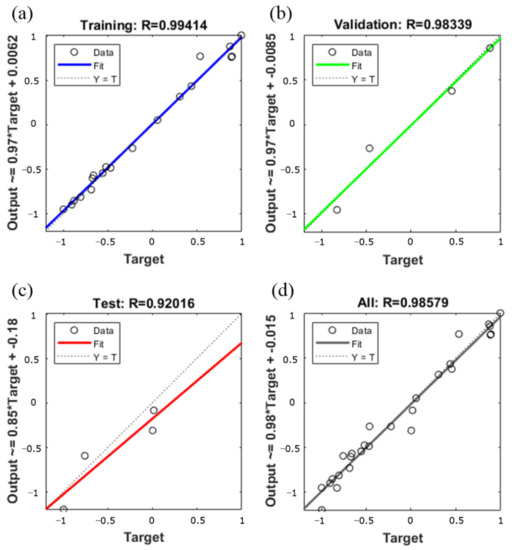
Figure 20.
The results of multivariate regression analysis. (a) Training data (b) Validation data (c) Test data (d) All data.
4.4. Verification of Prediction Results and Finite Element Analysis
The process parameters predicted by the GA-BP neural network were entered into the Abaqus software, and the resulting S-rail thickness cloud map is shown in Figure 21. As can be seen from the figure, the minimum thickness of the S-rail is at the corner of the lower part of the left side wall, with a minimum thickness of 0.9019 mm. The maximum thinning rate of the S-track is 9.81%, and the error of the maximum thinning rate of 9.3% predicted by the GA-BP neural network is only 5%, which shows the accuracy of the prediction of the GA-BP neural network. It can also be seen in the thickness cloud map that the thickness distribution of the automotive S-rails formed using the process parameters predicted by the GA-BP neural network is relatively uniform, with only slight stacking at the corners of the upper part of the sidewalls.
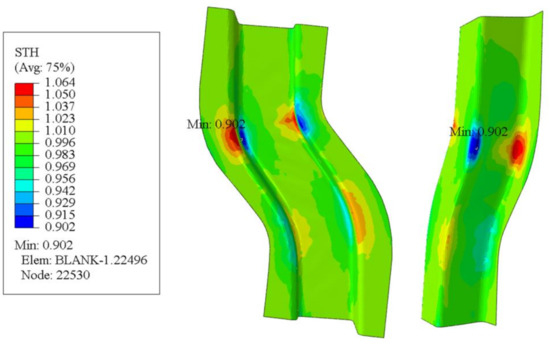
Figure 21.
Thickness cloud map at stamping speed of 50 mm/s, friction coefficient of 0.1, and blank holder force of 5 kN, forming temperature 410 °C.
The forming result is taken in accordance with the cross-sectional indication line of Figure 22a and the thickness distribution of the S-rail is analyzed according to the layout of Figure 22b. Figure 23 shows the thickness distribution of the cross section. As can be seen in the figure, the thickness distribution in the flange of the S-rail and the bottom surface region is relatively uniform, approximately 1 mm. The stacker occurs at the corner where the left flange is connected to the sidewall and the bottom surface is connected to the right sidewall, and the thickness increases to 1.06 mm. At the corner where the left sidewall is connected to the bottom and the corner where the right flange is connected to the sidewall are thinned and the thickness is reduced to about 0.902 mm. The normalized average thickness and thickness standard deviation are calculated according to Equations (3) and (4). The normalized average thickness is 0.9913 mm and the standard deviation of thickness is 0.002 mm, indicating excellent hot stamping formability.
where, NAT is a normalized average thickness. Tini is the thickness of the initial blank. Ti is the thickness of i point. TD is the standard deviation of thickness values. AT is the average thickness of the formed part.
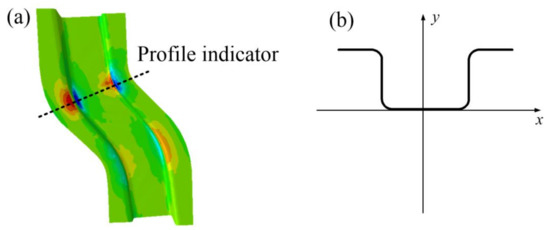
Figure 22.
Schematic diagram of cross-sectional position (a,b) at optimal forming conditions (stamping speed of 50 mm/s, friction coefficient of 0.1, and blank holder force of 5 kN, forming temperature 410 °C).
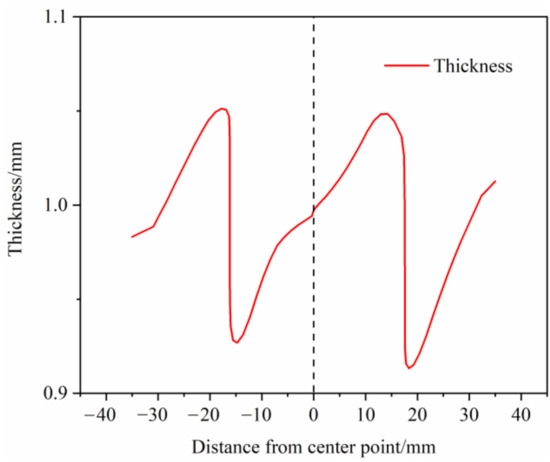
Figure 23.
Thickness distribution at the profile for optimal forming conditions (stamping speed of 50 mm/s, friction coefficient of 0.1, and blank holder force of 5 kN, forming temperature 410 °C).
Figure 24 is the damaged cloud map of the S-rail. As can be seen from the figure, the maximum damage occurs at the same location as the minimum thickness, which shows that the simulation is accurate. When the damage value reaches 1, the mesh is deleted, which means that the material fails to fracture. The maximum value of damage in Figure 24 is 0.3293, which indicates that only minor damage occurred to the material. The result of the finite element is randomly taken by 100 units of the major strain and the minor strain, as shown in Figure 25. It can be seen that all points are in the lower end of the FLC, the security zone [45]. Most of the points are to the left of FLC, which indicates that most of the automotive S-rails are in uniaxial tensile strain state and plane strain state during stamping, and only very few are in biaxial tensile strain state.
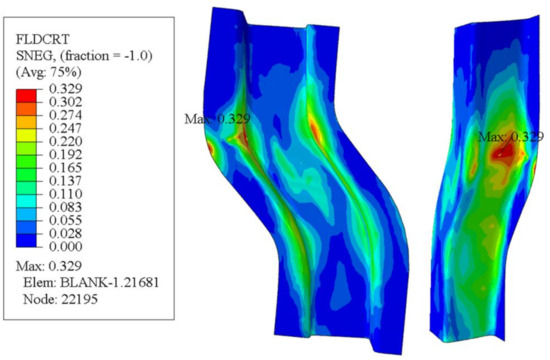
Figure 24.
S-rail FLD damage cloud map at optimal forming conditions (stamping speed of 50 mm/s, friction coefficient of 0.1, and blank holder force of 5 kN, forming temperature 410 °C).
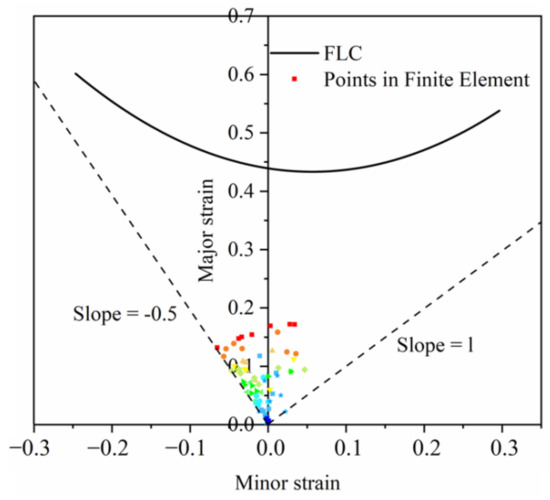
Figure 25.
Forming limit result at optimal forming conditions (stamping speed of 50 mm/s, friction coefficient of 0.1, and blank holder force of 5 kN, forming temperature 410 °C).
5. Conclusions
In this paper, 7075 aluminum alloy high temperature formability was studied. Mechanical properties under high temperature conditions of 7075 aluminum alloy are obtained by uniaxular thermal tensile experiments. The forming limit diagram of 7075 aluminum alloy was analyzed by high temperature Nakazima experiments, and the micro-morphologies of the fracture under different forming conditions were observed using SEM. Finally, numerical simulation and GA-BP neural network were used to optimize the stamping parameters of the hot-stamping automotive S-rails of 7075 aluminum alloy. The specific conclusions are as follows:
- In the isothermal forming limit experiment, when the stamping speed was 20 mm, the forming limit increased from 310 °C to 410 °C, and the maximum principal strain increased from 0.443 at 310 °C to 0.527 at 410 °C, an increase of about 14%. The change in stamping speed (10–40 mm/s) has a small effect on the forming limit of 7075 aluminum alloy within the applicable range of this experimental press.
- In the GA-BP neural network, to optimize the parameters of automotive S-rail hot stamping process, the results predicted by GA-BP are very close to the experimental results of the training samples. The correlation coefficient of training data reaches 0.9956, indicating that the fit effect is very good. Meanwhile, the R-values for the regression analysis used for the validation data and the test data reached 0.99873 and 0.9911, respectively, indicating that the model is reliable. The optimal process parameters for hot stamping of 7075 aluminum alloy predicted by GA-BP neural network are: stamping speed is 50 mm/s, friction coefficient between die and blank is 0.1, and the blank holder force is 5 kN. The maximum thinning rate is 9.37%.
- The hot stamping process parameters optimized by GA-BP neural network are input into ABAQUS for verification. The maximum thinning rate obtained is 9.81%, and the error with the maximum thinning rate predicted by the GA-BP neural network is only 5%, which illustrates the accuracy of the prediction of the GA-BP neural network. From the results, the normalized average thickness is 0.9913 mm, and the standard deviation of thickness is 0.002 mm. Comparing the results with the forming limit diagram, all units of the simulation results are in the safe zone, indicating excellent hot stamping formability.
Author Contributions
Z.M.: Writing—original draft, review and editing, investigation; H.J.: conceptualization, investigation, writing—original draft, review and editing, project administration; X.H.: review and editing. investigation; W.X.: review and editing. investigation; X.T.: review and editing. investigation. All authors have read and agreed to the published version of the manuscript.
Funding
This work is supported by the National Natural Science Foundation of China (51905501), this work is also supported by the Tangshan talent foundation innovation team (20130204D), The Hebei Provincial Department of Education YouthTalents Project (BJ2019010) and funded by S&P Program of Hebei (Grant No.19012204Z).
Institutional Review Board Statement
Not applicable.
Informed Consent Statement
Not applicable.
Data Availability Statement
Data is contained within the article. The data presented in this study are available in Research on High Temperature Stamping Forming Performance and Process Parameters Optimization of 7075 Aluminum Alloy.
Conflicts of Interest
The authors declare no conflict of interest.
References
- Liu, Y.; Liu, Y.; Chen, J. The impact of the Chinese automotive industry: Scenarios based on the national environmental goals. J. Clean. Prod. 2015, 96, 102–109. [Google Scholar] [CrossRef]
- Kumar, D.; Phanden, R.K.; Thakur, L. A review on environment friendly and lightweight Magnesium-Based metal matrix composites and alloys. Mater. Today Proc. 2021, 38, 359–364. [Google Scholar] [CrossRef]
- Li, H.; Yan, Z.; Cao, L. Bake hardening behavior and precipitation kinetic of a novel Al-Mg-Si-Cu aluminum alloy for lightweight automotive body. Mater. Sci. Eng. A 2018, 728, 88–94. [Google Scholar] [CrossRef]
- Karbasian, H.; Tekkaya, A.E. A review on hot stamping. J. Mater. Process. Technol. 2010, 210, 2103–2118. [Google Scholar] [CrossRef]
- Xiao, W.; Wang, B.; Zheng, K. An experimental and numerical investigation on the formability of AA7075 sheet in hot stamping condition. Int. J. Adv. Manuf. Technol. 2017, 92, 3299–3309. [Google Scholar] [CrossRef]
- Gao, T.; Ying, L.; Hu, P.; Han, X.; Rong, H.; Wu, Y.; Sun, J. Investigation on mechanical behavior and plastic damage of AA7075 aluminum alloy by thermal small punch test: Experimental trials, numerical analysis. J. Manuf. Processes 2020, 50, 1–16. [Google Scholar] [CrossRef]
- Bruschi, S.; Altan, T.; Banabic, D.; Bariani, P.F.; Brosius, A.; Cao, J.; Ghiotti, A.; Khraisheh, M.; Merklein, M.; Tekkaya, A.E. Testing and modelling of material behaviour and formability in sheet metal forming. CIRP Ann. 2014, 63, 727–749. [Google Scholar] [CrossRef]
- Erfanian, M.; Hashemi, R. A comparative study of the extended forming limit diagrams considering strain path, through-thickness normal and shear stress. Int. J. Mech. Sci. 2018, 148, 316–326. [Google Scholar] [CrossRef]
- Killer, S.P.; Backofen, W.A. Plastic instability and fracture in sheets stretched over rigid punches. Punches Trans. ASM 1963, 56, 25–48. [Google Scholar]
- Goodwin, G.M. Application of strain analysis to sheet metal forming problems in the press shop. SAE Trans. 1968, 380–387. [Google Scholar]
- Emanuela, A.; Marion, M. Metallographic Analysis of Nakajima Tests for the Evaluation of the Failure Developments. Procedia Eng. 2017, 183, 83–88. [Google Scholar] [CrossRef]
- Suttner, S.; Merklein, M. Characterization of the Shear Stress State Under Non-Proportional Strain Paths Realized by Biaxial Stretching in the Marciniak Test. Mater. Today Proc. 2015, 2, S98–S106. [Google Scholar] [CrossRef]
- Xiao, W.-C.; Wang, B.-Y.; Kang, Y.; Ma, W.-P.; Tang, X.-F. Deep drawing of aluminum alloy 7075 using hot stamping. Rare Met. 2017, 36, 485–493. [Google Scholar] [CrossRef]
- Liu, Y.; Zhu, Z.; Wang, Z.; Zhu, B.; Wang, Y.; Zhang, Y. Formability and lubrication of a B-pillar in hot stamping with 6061 and 7075 aluminum alloy sheets. Procedia Eng. 2017, 207, 723–728. [Google Scholar] [CrossRef]
- Song, Y.; Dai, D.; Geng, P.; Hua, L. Formability of aluminum alloy thin-walled cylinder parts by servo hot stamping. Procedia Eng. 2017, 207, 741–746. [Google Scholar] [CrossRef]
- Liu, X.; Ji, K.; Fakir, O.E.; Fang, H.; Gharbi, M.M.; Wang, L. Determination of the interfacial heat transfer coefficient for a hot aluminium stamping process. J. Mater. Process. Technol. 2017, 247, 158–170. [Google Scholar] [CrossRef] [Green Version]
- Rong, H.; Hu, P.; Ying, L.; Hou, W.; Zhang, J. Thermal forming limit diagram (TFLD) of AA7075 aluminum alloy based on a modified continuum damage model: Experimental and theoretical investigations. Int. J. Mech. Sci. 2019, 156, 59–73. [Google Scholar] [CrossRef]
- Ying, L.; Gao, T.; Rong, H.; Han, X.; Hu, P.; Hou, W. On the thermal forming limit diagram (TFLD) with GTN mesoscopic damage model for AA7075 aluminum alloy: Numerical and experimental investigation. J. Alloys Compd. 2019, 802, 675–693. [Google Scholar] [CrossRef]
- Liu, X.; El Fakir, O.; Cai, Z.; Dalkaya, B.; Wang, K.; Gharbi, M.M.; Wang, L. Development of an interfacial heat transfer coefficient model for the hot and warm aluminium stamping processes under different initial blank temperature conditions. J. Mater. Process. Technol. 2019, 273, 116245. [Google Scholar] [CrossRef]
- Ma, W.-Y.; Wang, B.-Y.; Fu, L.; Zhou, J.; Huang, M.-D. Effect of friction coefficient in deep drawing of AA6111 sheet at elevated temperatures. Trans. Nonferrous Met. Soc. China 2015, 25, 2342–2351. [Google Scholar] [CrossRef]
- Zhou, J.; Mu, Y.; Wang, B. A damage-coupled unified viscoplastic constitutive model for prediction of forming limits of 22MnB5 at high temperatures. Int. J. Mech. Sci. 2017, 133, 457–468. [Google Scholar] [CrossRef]
- Djavanroodi, F.; Ebrahimi, M.; Janbakhsh, M. A study on the stretching potential, anisotropy behavior and mechanical properties of AA7075 and Ti-6Al-4V alloys using forming limit diagram: An experimental, numerical and theoretical approaches. Results Phys. 2019, 14, 102496. [Google Scholar] [CrossRef]
- Shinge, V.R.; Dabade, U.A. Experimental Investigation on Forming Limit Diagram of Mild Carbon Steel Sheet. Procedia Manuf. 2018, 20, 141–146. [Google Scholar] [CrossRef]
- Yang, X.; Wang, B.; Zhou, J.; Xiao, W.; Feng, P. Constitutive modeling of softening mechanism and damage for Ti–6Al–4V alloy and its application in hot tensile simulation process. Arch. Civ. Mech. Eng. 2021, 21, 1–13. [Google Scholar] [CrossRef]
- Lin, Y.C.; Deng, J.; Jiang, Y.-Q.; Wen, D.-X.; Liu, G. Effects of initial δ phase on hot tensile deformation behaviors and fracture characteristics of a typical Ni-based superalloy. Mater. Sci. Eng. A 2014, 598, 251–262. [Google Scholar] [CrossRef]
- Li, Q.; Ning, J.; Chen, L.; Hu, J.; Liu, Y. The mechanical response and microstructural evolution of 2195 Al–Li alloy during hot tensile deformation. J. Alloys Compd. 2020, 848, 156515. [Google Scholar] [CrossRef]
- Zhou, J.; Wang, B.; Lin, J.; Fu, L. Optimization of an aluminum alloy anti-collision side beam hot stamping process using a multi-objective genetic algorithm. Arch. Civ. Mech. Eng. 2013, 13, 401–411. [Google Scholar] [CrossRef]
- Lin, R.; Diao, X.; Ma, T.; Tang, S.; Chen, L.; Liu, D. Optimized microporous layer for improving polymer exchange membrane fuel cell performance using orthogonal test design. Appl. Energy 2019, 254, 113714. [Google Scholar] [CrossRef]
- Wang, B.; Lin, R.; Liu, D.; Xu, J.; Feng, B. Investigation of the effect of humidity at both electrode on the performance of PEMFC using orthogonal test method. Int. J. Hydrogen Energy 2019, 44, 13737–13743. [Google Scholar] [CrossRef]
- Wu, Y.; Zhao, H.; Zhang, C.; Wang, L.; Han, J. Optimization analysis of structure parameters of steam ejector based on CFD and orthogonal test. Energy 2018, 151, 79–93. [Google Scholar] [CrossRef]
- Li, X.; Hao, J. Orthogonal test design for optimization of synthesis of super early strength anchoring material. Constr. Build. Mater. 2018, 181, 42–48. [Google Scholar] [CrossRef]
- Lu, J.; Song, Y.; Hua, L.; Zheng, K.; Dai, D. Thermal deformation behavior and processing maps of 7075 aluminum alloy sheet based on isothermal uniaxial tensile tests. J. Alloys Compd. 2018, 767, 856–869. [Google Scholar] [CrossRef]
- Yang, Z.; Mao, L.; Yan, B.; Wang, J.; Gao, W. Performance analysis and prediction of asymmetric two-level priority polling system based on BP neural network. Appl. Soft Comput. 2021, 99, 106880. [Google Scholar] [CrossRef]
- Guo, Y. Credit risk assessment of P2P lending platform towards big data based on BP neural network. J. Visual Commun. Image Represent. 2020, 71, 102730. [Google Scholar] [CrossRef]
- Song, Y.; Yue, L.; Wang, Y.; Di, H.; Gao, F.; Li, S.; Zhou, Y.; Hua, D. Research on BP network for retrieving extinction coefficient from Mie scattering signal of lidar. Measurement 2020, 164, 108028. [Google Scholar] [CrossRef]
- Chalisgaonkar, R.; Kumar, J.; Pant, P. Prediction of machining characteristics of finish cut WEDM process for pure titanium using feed forward back propagation neural network. Mater. Today Proc. 2020, 25, 592–601. [Google Scholar] [CrossRef]
- Lin, Y.C.; Chow, H.M.; Lee, H.M.; Liu, J.F. Modelling of the Parameters of EDM in Gas Based on Back Propagation Neural Network. Mater. Sci. Forum 2018, 926, 11–16. [Google Scholar] [CrossRef]
- Wang, H.; Zhang, Z.; Liu, L. Prediction and fitting of weld morphology of Al alloy-CFRP welding-rivet hybrid bonding joint based on GA-BP neural network. J. Manuf. Processes 2021, 63, 109–120. [Google Scholar] [CrossRef]
- Wei, W.; Bo, Y. Text categorization based on combination of modified back propagation neural network and latent semantic analysis. Neural Comput. Appl. 2009, 18, 875–881. [Google Scholar]
- Zhang, Y.; Gao, X.; Katayama, S. Weld appearance prediction with BP neural network improved by genetic algorithm during disk laser welding. J. Manuf. Syst. 2015, 34, 53–59. [Google Scholar] [CrossRef]
- Fountas, N.A.; Vaxevanidis, N.M. Optimization of fused deposition modeling process using a virus-evolutionary genetic algorithm. Comput. Ind. 2021, 125, 103371. [Google Scholar] [CrossRef]
- Taheranpour, N.; Talebi, S. Development of a new efficient method using genetic algorithm for increasing of fuel rod life time. Prog. Nucl. Energy 2021, 131, 103600. [Google Scholar] [CrossRef]
- Zou, M.; Xue, L.; Gai, H.; Dang, Z.; Wang, S.; Xu, P. Identification of the shear parameters for lunar regolith based on a GA-BP neural network. J. Terramech. 2020, 89, 21–29. [Google Scholar] [CrossRef]
- Wang, Z.; Fei, Y.; Ye, P.; Qiu, F.; Tian, G.; Woo, W.L. Crack characterization in ferromagnetic steels by pulsed eddy current technique based on GA-BP neural network model. J. Magn. Magn. Mater. 2020, 500, 166412. [Google Scholar] [CrossRef]
- Abbasi, M.; Shafaat, M.A.; Ketabchi, M.; Haghshenas, D.F.; Abbasi, M. Application of the GTN model to predict the forming limit diagram of IF-Steel. J. Mech. Sci. Technol. 2012, 26, 345–352. [Google Scholar] [CrossRef]
Publisher’s Note: MDPI stays neutral with regard to jurisdictional claims in published maps and institutional affiliations. |
© 2021 by the authors. Licensee MDPI, Basel, Switzerland. This article is an open access article distributed under the terms and conditions of the Creative Commons Attribution (CC BY) license (https://creativecommons.org/licenses/by/4.0/).