
On Structural Rearrangements Near the Glass Transition Temperature in Amorphous Silica


Abstract
:
1. Introduction
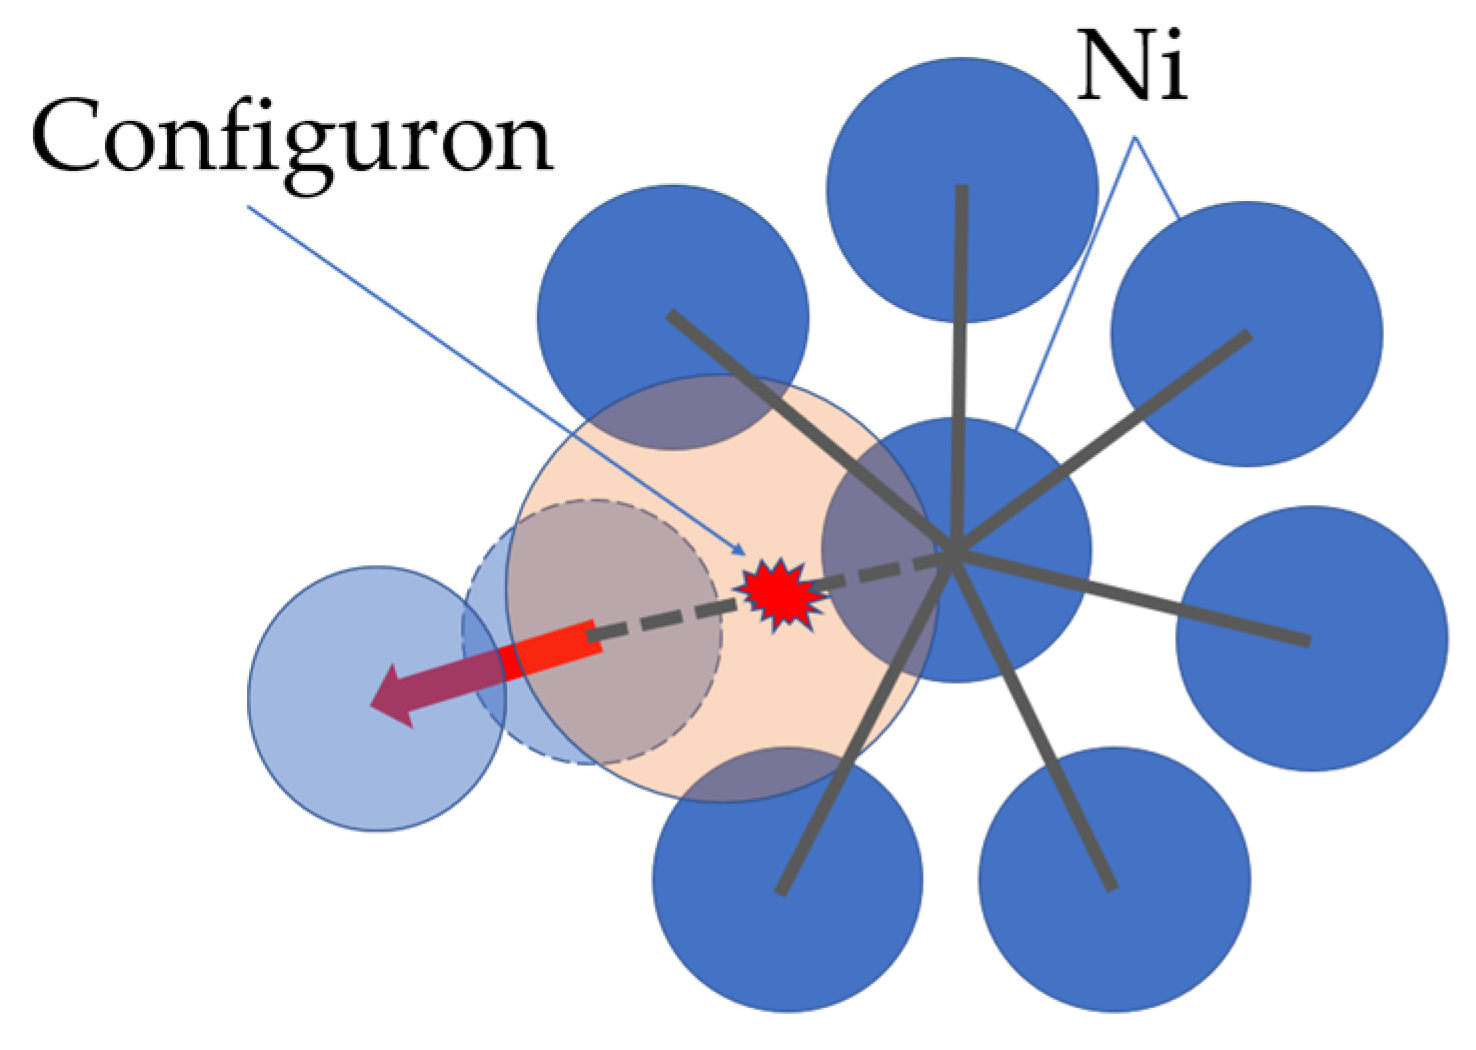
2. Configurons
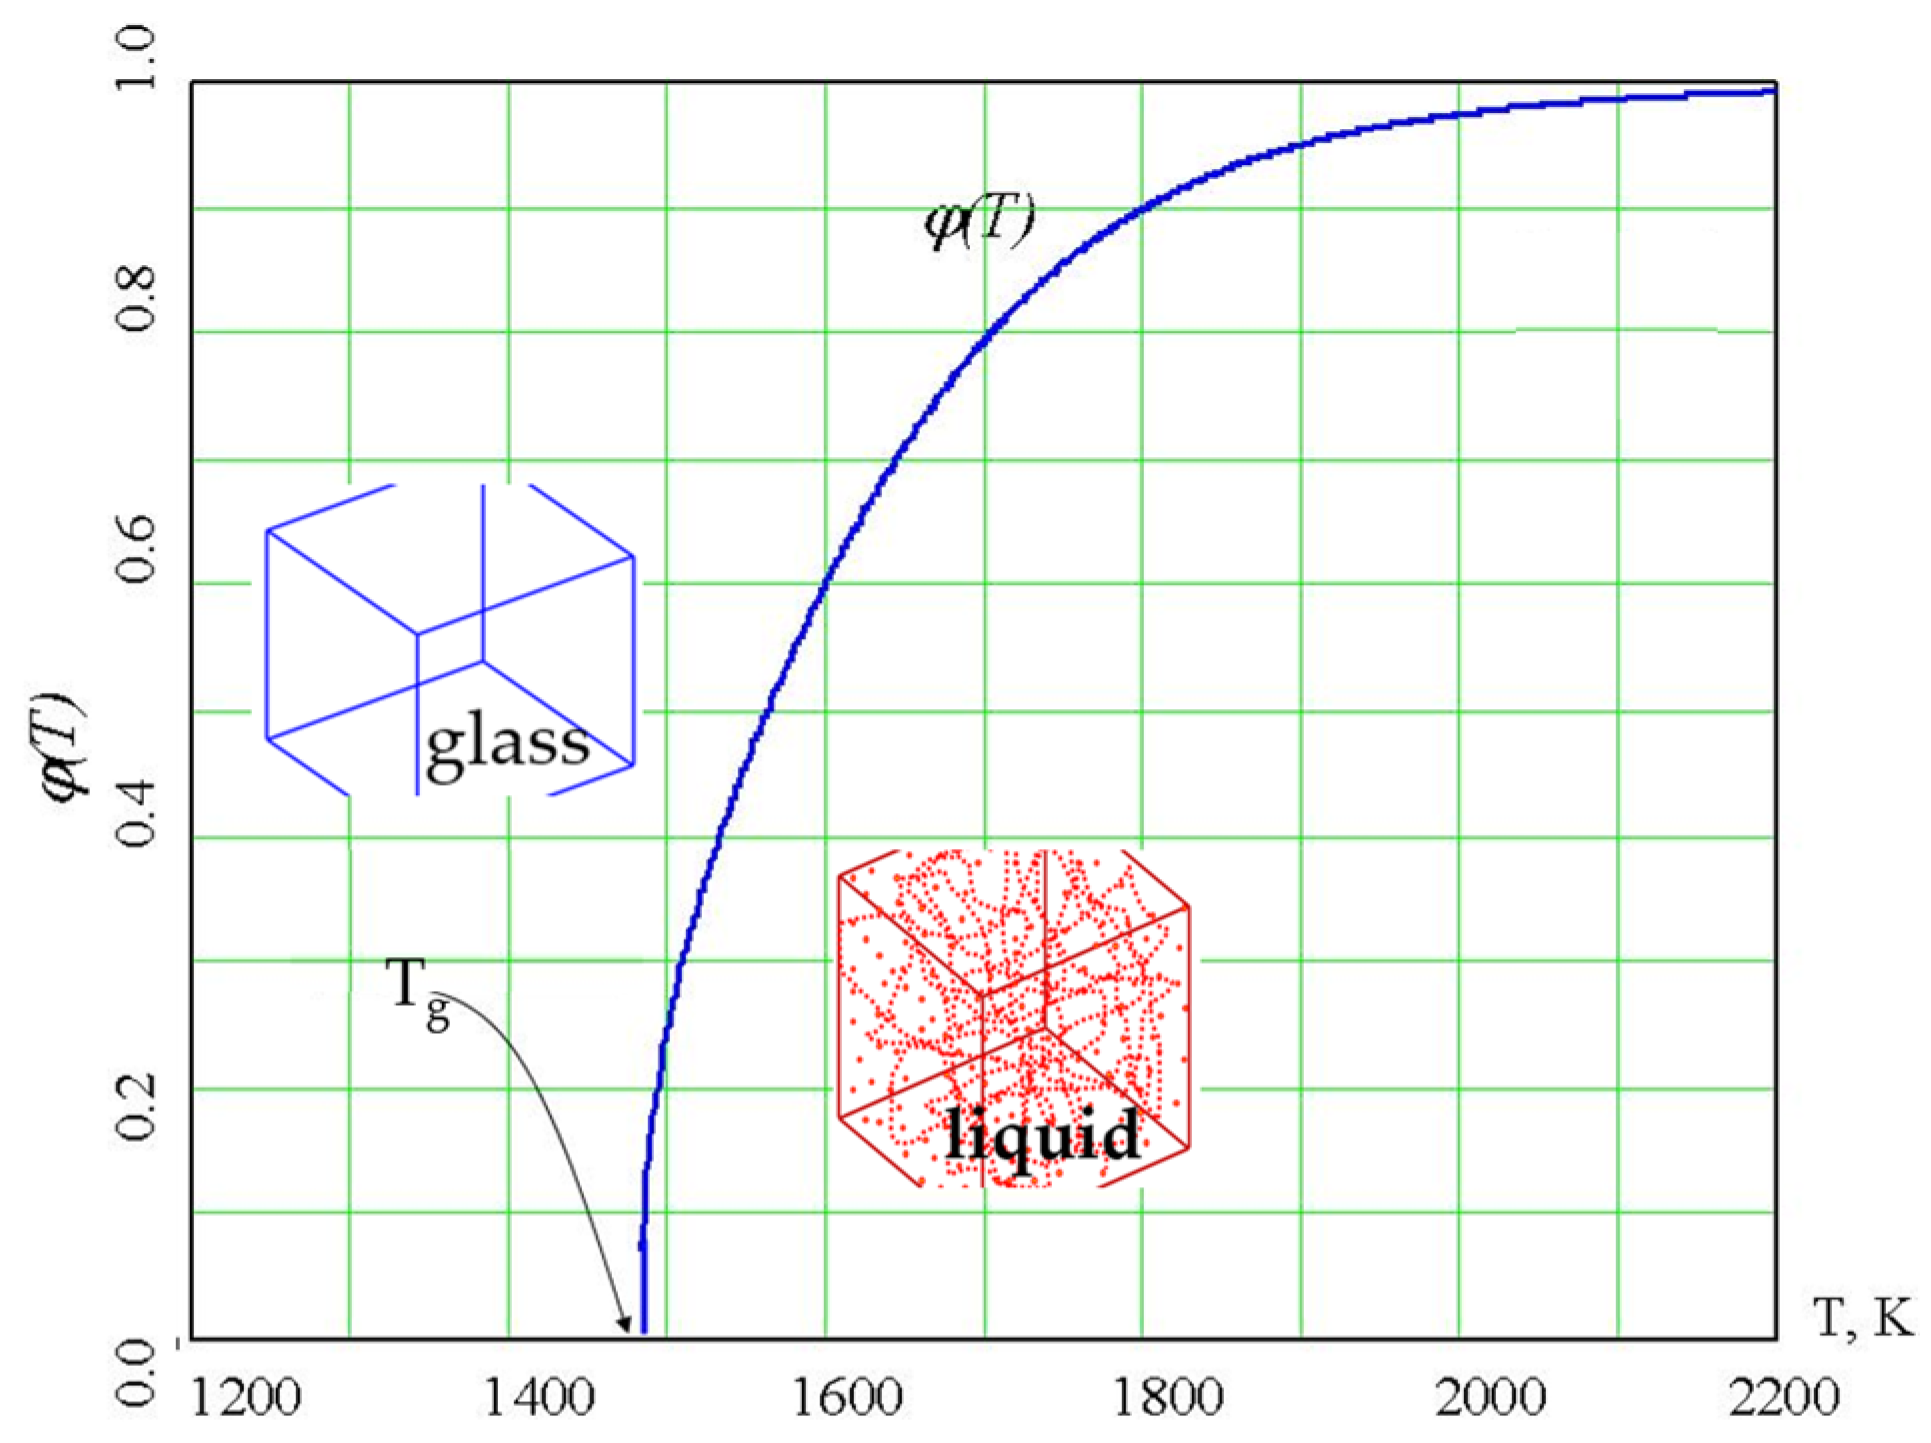
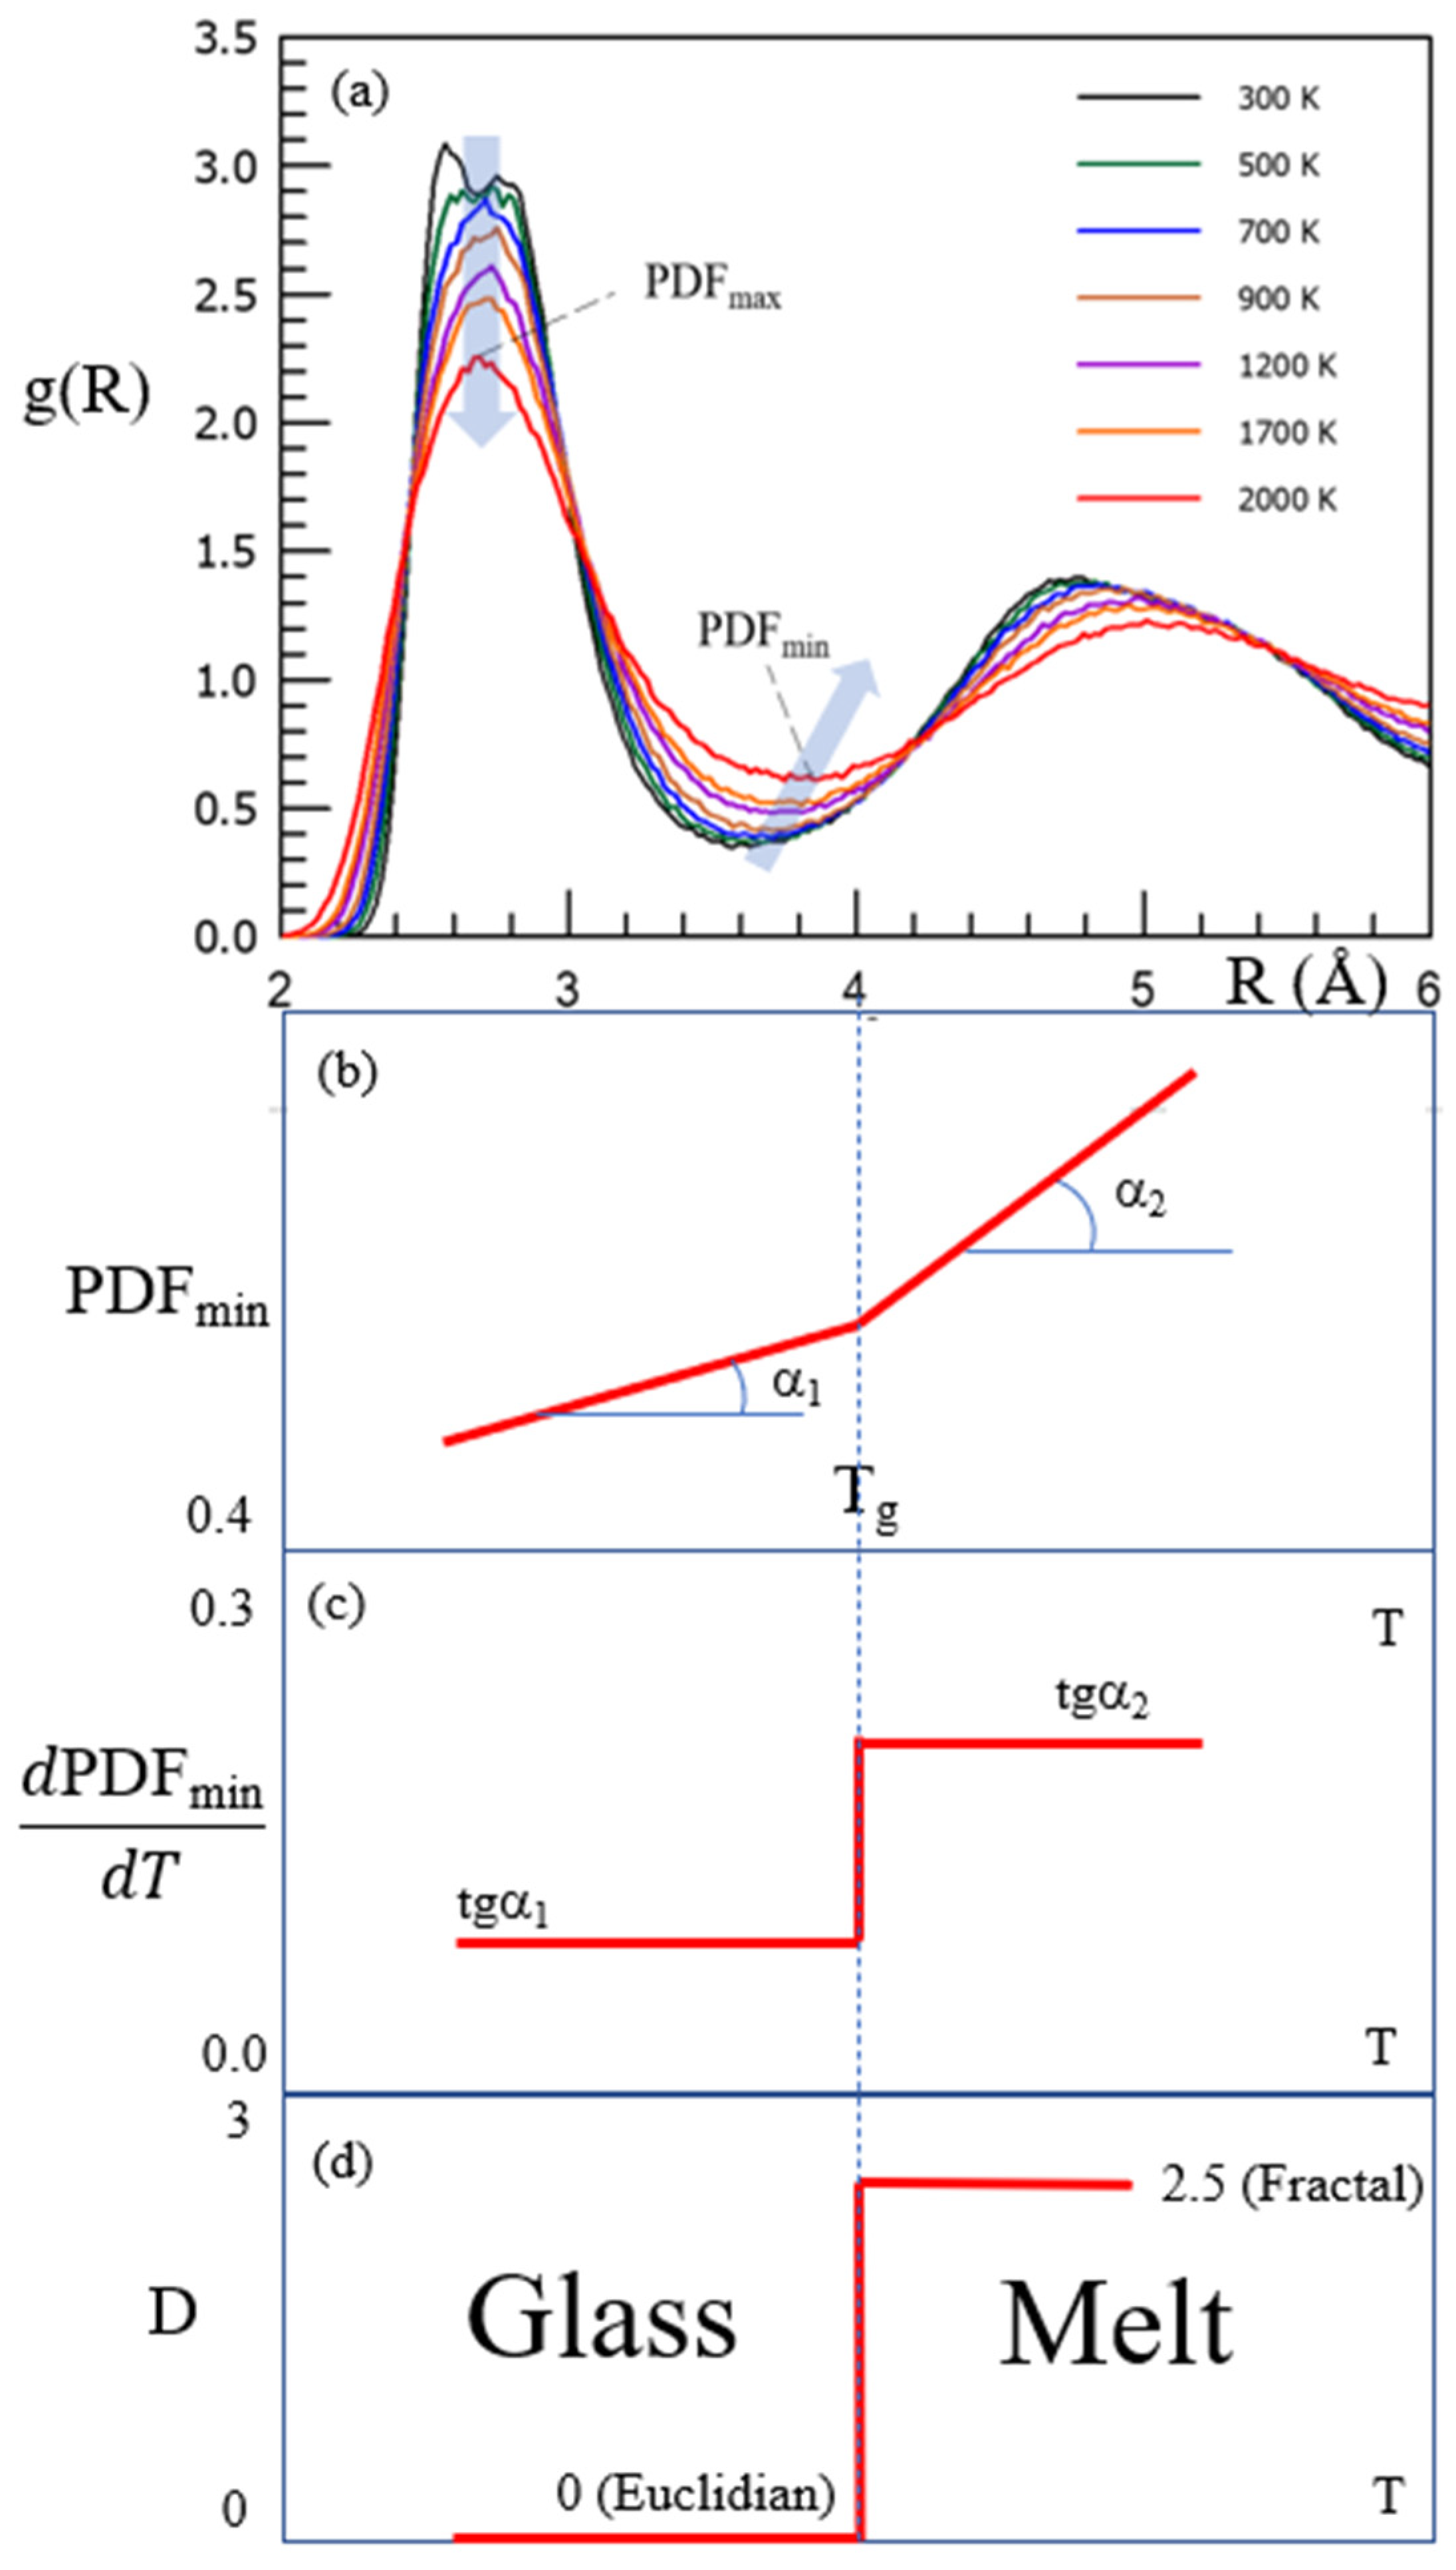
3. Glass Transition in Silica
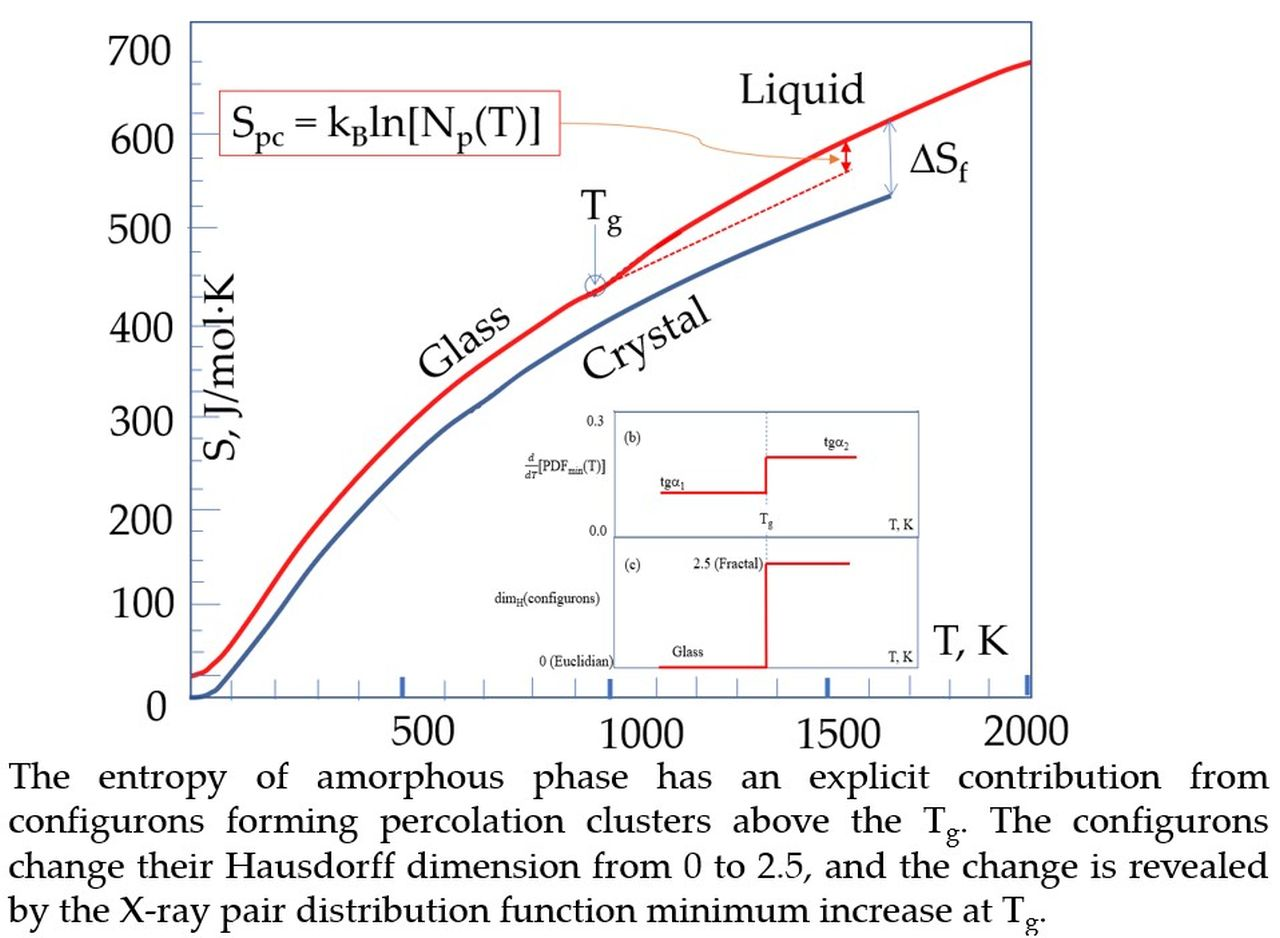
4. Discussion
5. Conclusions
Author Contributions
Funding
Institutional Review Board Statement
Informed Consent Statement
Data Availability Statement
Acknowledgments
Conflicts of Interest
References
- Mysen, B.; Richet, P. Silicate Glasses and Melts, 2nd ed.; Elsevier: Amsterdam, The Netherlands, 2019. [Google Scholar]
- Cheng, S. New interpretation of X-ray diffraction pattern of vitreous silica. Ceramics 2021, 4, 83–96. [Google Scholar] [CrossRef]
- Cheng, S. Viscosity-Temperature relation based on the evolution of medium-range structure of silica. J. Non-Cryst. Solids 2021, 557, 120582. [Google Scholar] [CrossRef]
- Takada, A. New geometrical modelling of B2O3 and SiO2 glass structures. Phys. Chem. Glasses Eur. J. Glass Sci. Technol. B 2009, 50, 219–223. [Google Scholar]
- Takada, A. Computer simulation models of glass structure. Phys. Chem. Glasses Eur. J. Glass Sci. Technol. B 2008, 49, 127–135. [Google Scholar]
- Takada, A.; Richet, P.; Catlow, C.R.A.; Price, G.D. A molecular dynamics simulation of complex structural changes in amorphous silica at high temperatures. Phys. Chem. Glasses Eur. J. Glass Sci. Technol. B 2007, 48, 182–187. [Google Scholar]
- Zarzycki, J. Glasses and the Vitreous State; Cambridge University Press: Cambridge, UK, 1982. [Google Scholar]
- Varshneya, A.K. Fundamentals of Inorganic Glasses; Society of Glass Technology: Sheffield, UK, 2006. [Google Scholar]
- Dyre, J.P. Colloquium: The glass transition and elastic models of glass-forming liquids. Rev. Mod. Phys. 2006, 78, 953–972. [Google Scholar] [CrossRef] [Green Version]
- Angell, C.A. Glass-formers and viscous liquid slowdown since David Turnbull: Enduring puzzles and new twists. MRS Bull. 2008, 33, 544–555. [Google Scholar] [CrossRef] [Green Version]
- Klinger, M.I. Glassy Disordered Systems: Glass Formation and Universal Anomalous Low-Energy Properties; World Scientific: London, UK, 2013. [Google Scholar]
- Tournier, R.F. Thermodynamic and kinetic origins of the vitreous transition. Intermetallics 2012, 30, 104–110. [Google Scholar] [CrossRef]
- Tanaka, H. Importance of many-body orientational correlations in the physical description of liquids. Faraday Discuss. 2013, 167, 9–76. [Google Scholar] [CrossRef] [PubMed] [Green Version]
- Nemilov, S.V. On the possibility of calculating entropy, free energy, and enthalpy of vitreous substances. Entropy 2018, 20, 187. [Google Scholar] [CrossRef] [Green Version]
- Sanditov, D.S.; Ojovan, M.I.; Darmaev, M.V. Glass transition criterion and plastic deformation of glass. Phys. B Condens. Matter 2020, 582, 411914. [Google Scholar] [CrossRef]
- Kittel, C. Introduction to Solid State Physics; John Wiley and Sons: Hoboken, NJ, USA, 1996. [Google Scholar]
- Tournier, R.F. Fragile-to-Fragile liquid transition at Tg and stable-glass phase nucleation rate maximum at the Kauzmann temperature TK. Phys. B Condens. Matter 2014, 454, 253–271. [Google Scholar] [CrossRef] [Green Version]
- Sanditov, D.S. A criterion for the glass-liquid transition. J. Non-Cryst. Solids 2014, 385, 148–152. [Google Scholar] [CrossRef]
- Louzguine-Luzgin, D.V.; Chen, N.; Churymov, A.Y.; Battezzati, L.; Yavari, A.R. Role of different factors in the glass-forming ability of binary alloys. J. Mater. Sci. 2014, 50, 1783–1793. [Google Scholar] [CrossRef]
- Tournier, R.F. Glass phase and other multiple liquid-to-liquid transitions resulting from two-liquid competition. Chem. Phys. Lett. 2016, 665, 64–70. [Google Scholar] [CrossRef] [Green Version]
- Continentino, M.A. Topological phase transitions. Phys. B Condens. Matter 2017, 505, A1–A2. [Google Scholar] [CrossRef]
- Zheng, Q.; Zhang, Y.; Montazerian, M.; Gulbiten, O.; Mauro, J.C.; Zanotto, E.D.; Yue, Y. Understanding glass through differential scanning calorimetry. Chem. Rev. 2019, 119, 7848–7939. [Google Scholar] [CrossRef]
- Tournier, R.F. First-order transitions in glasses and melts induced by solid siperclusters nucleated and melted by homogeneous nucleation instead of surface melting. Chem. Phys. 2019, 524, 40–54. [Google Scholar] [CrossRef] [Green Version]
- Sanditov, D.S.; Ojovan, M.I. Relaxation aspects of the liquid–glass transition. Physics-Uspekhi 2019, 62, 111–130. [Google Scholar] [CrossRef]
- Ojovan, M.I.; Louzguine-Luzgin, D.V. Revealing structural changes at glass transition via radial distribution functions. J. Phys. Chem. B 2020, 124, 3186–3194. [Google Scholar] [CrossRef] [PubMed]
- Bennett, T.D.; Tan, J.C.; Yue, Y.Z.; Baxter, E.; Ducati, C.; Terrill, N.J.; Yeung, H.H.M.; Zhou, Z.; Chen, W.; Henke, S.; et al. Hybrid glasses from strong and fragile metal-organic framework liquids. Nat. Commun. 2015, 6, 8079. [Google Scholar] [CrossRef] [PubMed] [Green Version]
- Medvedev, N.N.; Geider, A.; Brostow, W. Distinguishing liquids from amorphous solids: Percolation analysis on the Voronoi network. J. Chem. Phys. 1990, 93, 8337–8342. [Google Scholar] [CrossRef]
- Evteev, A.V.; Kosilov, A.T.; Levchenko, E.V. Atomic mechanisms of pure iron vitrification. J. Exp. Theor. Phys. 2004, 99, 522–529. [Google Scholar] [CrossRef]
- Ojovan, M.I. Glass formation in amorphous SiO2 as a percolation phase transition in a system of network defects. J. Exp. Theor. Phys. Lett. 2004, 79, 632–634. [Google Scholar] [CrossRef]
- Fischer, H.E.; Barnes, A.C.; Salmon, P.S. Neutron and X-ray diffraction studies of liquids and glasses. Rep. Prog. Phys. 2006, 69, 233–299. [Google Scholar] [CrossRef]
- Soper, A.K. The radial distribution functions of water as derived from radiation total scattering experiments: Is there anything we can say for sure? ISRN Phys. Chem. 2013, 2013, 279463. [Google Scholar] [CrossRef] [Green Version]
- Richet, P.; Conradt, R.; Takada, A.; Dyon, J. Encyclopedia of Glass Science, Technology, History, and Culture; John Wiley & Sons: Hoboken, NJ, USA, 2021; p. 1568. Available online: https://onlinelibrary.wiley.com/doi/book/10.1002/9781118801017 (accessed on 11 August 2021).
- Ojovan, M.I. The Modified random network (MRN) model within the configuron percolation theory (CPT) of glass transition. Ceramics 2021, 4, 121–134. [Google Scholar] [CrossRef]
- Fischer, E.W.; Meier, G.; Rabenau, T.; Patkowski, A.; Steffen, W.; Thönnes, W. Density fluctuations around the glass-transition of low molecular weight glass-forming liquids. J. Non-Cryst. Solids 1991, 131–133, 134–138. [Google Scholar] [CrossRef]
- Bakai, A.S.; Fischer, E.W. Nature of long-range correlations of density fluctuations in glass-forming liquids. J. Chem. Phys. 2004, 120, 5235–5252. [Google Scholar] [CrossRef] [PubMed]
- Yue, Y. Experimental evidence for the existence of an ordered structure in a silicate liquid above its liquidus temperature. J. Non-Cryst. Sol. 2004, 345–346, 523–527. [Google Scholar]
- Ozhovan, M.I. Dynamic uniform fractals in emulsions. J. Exp. Theor. Phys. 1993, 77, 939–943. [Google Scholar]
- Angell, C.A. Oxide glasses in light of the ’Ideal glass’ concept. I. General aspects: Ideal and non-ideal transitions. J. Am. Ceram. Soc. 1968, 51, 117–124. [Google Scholar] [CrossRef]
- Angell, C.A.; Richards, B.E.; Velikov, V. Simple glass-forming liquids: Their definition, fragilities, and landscape excitation profiles. J. Phys. B Condens. Matter 1999, 11, A75–A94. [Google Scholar] [CrossRef]
- Angell, C.A.; Wong, J.J. Structure and glass transition thermodynamics of liquid zinc chloride from far-infrared, Raman, and probe ion electronic and vibrational spectra. Chem. Phys. 1970, 53, 2053–2066. [Google Scholar] [CrossRef]
- Angell, C.A.; Rao, K.J. Configurational excitations in condensed, and the “bond lattice” model for the liquid-glass transition. J. Chem. Phys. 1972, 57, 470–481. [Google Scholar] [CrossRef]
- Egami, T. Atomistic theory of metallic liquids and glasses. In Bulk Metallic Glasses; Miller, M., Liaw, P., Eds.; Springer: Boston, MA, USA, 2008. [Google Scholar]
- Kantor, Y.; Webman, I. Elastic properties of random percolating systems. Phys. Rev. Lett. 1984, 52, 1891–1894. [Google Scholar] [CrossRef]
- Ozhovan, M.I. Topological characteristics of bonds in SiO2 and GeO2 oxide systems upon a glass-liquid transition. J. Exp. Theor. Phys. 2006, 103, 819–829. [Google Scholar] [CrossRef]
- Ojovan, M.I.; Lee, W.E. Connectivity and glass transition in disordered oxide systems. J. Non-Cryst. Solids 2010, 356, 2534–2540. [Google Scholar] [CrossRef]
- Ashkroft, N.W.; Mermin, N.D. Solid State Physics; Holt-Saunders: Tokyo, Japan, 1976. [Google Scholar]
- Tanaka, H. Two-order-parameter model of the liquid-glass transition. I. Relation between glass transition and crystallization. J. Non-Cryst. Solids 2005, 43–45, 3371–3384. [Google Scholar] [CrossRef]
- Sun, G.Q. Pattern transitions in spatial epidemics: Mechanisms and emergent properties. Phys. Life Rev. 2016, 19, 43–73. [Google Scholar] [CrossRef] [Green Version]
- Li, L. Patch invasion in a spatial epidemic model. Appl. Math. Comput. 2015, 258, 342–349. [Google Scholar] [CrossRef]
- Dumonteil, E. Spatial extent of an outbreak in animal epidemics. Proc. Natl. Acad. Sci. USA 2013, 110, 4239–4244. [Google Scholar] [CrossRef] [Green Version]
- Houchmandzadeh, B. Neutral clustering in a simple experimental ecological community. Phys. Rev. Lett. 2008, 101, 078103. [Google Scholar] [CrossRef] [Green Version]
- Houchmandzadeh, B. Clustering of diffusing organisms. Phys. Rev. E 2002, 66, 052902. [Google Scholar] [CrossRef] [PubMed] [Green Version]
- Young, W.R. Reproductive pair correlations and the clustering of organisms. Nature 2001, 412, 328–331. [Google Scholar] [CrossRef] [PubMed] [Green Version]
- Cox, J.T.; Griffeath, D. Occupation times for critical branching Brownian motions. Ann. Probabil. 1985, 13, 1108–1132. [Google Scholar] [CrossRef]
- Taraskin, S.N.; Perez-Reche, F.J. Effects of variable-state neighborhoods for spreading synergystic processes on lattices. Phys. Rev. E 2013, 88, 062815. [Google Scholar] [CrossRef] [Green Version]
- Dumonteil, E.; Bahran, R.; Cutler, T.; Dechenaux, B.; Grove, T.; Hutchinson, J.; McKenzie, G.; McSpaden, A.; Monange, W.; Nelson, M.; et al. Patchy nuclear chain reactions. Commun. Phys. 2021, 4, 151. [Google Scholar] [CrossRef]
- Isichenko, M.B. Percolation, statistical topography, and transport in random media. Rev. Mod. Phys. 1992, 64, 961–1043. [Google Scholar] [CrossRef] [Green Version]
- Frenkel, J. Kinetic Theory of Liquids; Oxford University Press: Oxford, UK, 1946. [Google Scholar]
- Bolmatov, D.; Brazhkin, V.V.; Trachenko, K. The phonon theory of liquid thermodynamics. Sci. Rep. 2012, 2, 421. [Google Scholar] [CrossRef]
- Brazhkin, V.; Trachenko, K. What separates a liquid from a gas? Physics Today 2012, 65, 68–69. [Google Scholar] [CrossRef] [Green Version]
- Trachenko, K.; Brazhkin, V.V. Collective modes and thermodynamics of the liquid state. Rep. Prog. Phys. 2016, 79, 016502. [Google Scholar] [CrossRef]
- Trachenko, K. Lagrangian formulation and symmetrical description of liquid dynamics. Phys. Rev. E 2017, 96, 062134. [Google Scholar] [CrossRef] [Green Version]
- Benigni, P. CALPHAD modeling of the glass transition for a pure substance, coupling thermodynamics and relaxation kinetics. Calphad 2021, 72, 102238. [Google Scholar] [CrossRef]
- Scher, H.; Zallen, R. Critical density in percolation processes. J. Chem. Phys. 1970, 53, 3759–3761. [Google Scholar] [CrossRef] [Green Version]
- Mazurin, O.V. Problems of compatibility of the values of glass transition temperatures published in the world literature. Glass Phys. Chem. 2007, 33, 22–36. [Google Scholar] [CrossRef]
- Tournier, R.F.; Ojovan, M.I. Undercooled phase behind the glass phase with superheated medium-range order above glass transition temperature. Phys. B Condens. Matter 2021, 602, 412542. [Google Scholar] [CrossRef]
- Ojovan, M.I. Configurons: Thermodynamic parameters and symmetry changes at glass transition. Entropy 2008, 10, 334–364. [Google Scholar] [CrossRef] [Green Version]
- Hunt, A. A Purely kinetic justification for application of Ehrenfest theorems to the glass transition. Solid State Commun. 1992, 84, 263–266. [Google Scholar] [CrossRef]
- Tournier, R.F.; Ojovan, M.I. Dewetting temperatures of prefrozen and grafted layers in ultrathin films viewed as melt-memory effects. Phys. B Condens. Matter 2021, 611, 412796. [Google Scholar] [CrossRef]
- Rincon, J.M. Structure and microstructure of glasses and geopolymers under electron microscopies. In Proceedings of the 2nd Workshop-Symposium Vitro Geowastes: Vitrification, Geopolymerization, Wastes Management and Circular Economy, Baeza, Spain, 23–26 May 2021. [Google Scholar]
- Rincón, J.M. Vitreous and ceramic processing for the recycling of industrial wastes. Key Eng. Mater. 2016, 663, 11–22. [Google Scholar] [CrossRef]
- Rincón, J.M.; Casasola, R. TEM Replica of fluor-miserite glassceramic. Mater. Technol. 2015, 49, 229–233. [Google Scholar] [CrossRef]
- Rincon, J.; Duran, A. Separacion de Fasesen Vidrios; Sociedad Espanola de Ceramica y Vidrio: Madrid, Spain, 1982. [Google Scholar]
- Mazurin, O.V.; Porai-Koshits, E.A. Phase Separation in Glass; Elsevier: Amsterdam, The Netherlands, 1984. [Google Scholar]
- Ojovan, M.I. Ordering and structural changes at the glass–liquid transition. J. Non-Cryst. Solids 2013, 382, 79–86. [Google Scholar] [CrossRef]
- Angel, C.A. Calorimetric studies of the energies landscapes of glassformers by hyper-quenching methods. J. Therm. Anal. Calorim. 2002, 69, 785–794. [Google Scholar] [CrossRef]
- Jaeger, G. The Ehrenfest classification of phase transitions: Introduction and evolution. Arch. Hist. Exact Sci. 1998, 53, 51–81. [Google Scholar] [CrossRef]
- Patashinskioe, A.Z.; Pokrovskioe, V.L. Fluctuation Theory of Phase Transitions; Pergamon Press: Oxford, UK, 1979. [Google Scholar]
- Landau, L.D.; Lifshitz, E.M. Statistical Physics; Elsevier: Amsterdam, The Netherlands, 2013. [Google Scholar]
- Tournier, R.F.; Ojovan, M.I. Building and breaking bonds by homogenous nucleation in glass-forming melts leading to transitions in three liquid states. Materials 2021, 14, 2287. [Google Scholar] [CrossRef]
- Holmlid, L. Direct observation of circular Rydberg electrons in a Rydberg matter surface layer by electronic circular dichroism. J. Phys. Condens. Matter. 2007, 19, 276206. [Google Scholar] [CrossRef]
- Aasen, T.H.; Zeiner-Gundersen, D.H.; Zeiner-Gundersen, S.; Ohlckers, P.; Wanget, K. A condensed excited (Rydberg) matter: Perspective and applications. J. Clust. Sci. 2021. [Google Scholar] [CrossRef]
- Cunningham, D.W. Set Theory: A First Course; Cambridge University Press: Cambridge, UK, 2016. [Google Scholar]
- Witek, M.; Krzystyniak, M.; Romanelli, G.; Witczak, T. Glass transition in rice pasta as observed by combined neutron scattering and time-domain NMR. Polymers 2021, 13, 2426. [Google Scholar] [CrossRef]
- Stanzione, J.F., III; Strawhecker, K.E.; Wool, R.P. Observing the twinkling fractal nature of the glass transition. J. Non-Cryst. Solids 2011, 357, 311–319. [Google Scholar] [CrossRef]
- Wool, R.P. Twinkling fractal theory of the glass transition. J. Polym. Sci. B Polym. Phys. 2008, 46, 2765–2778. [Google Scholar] [CrossRef]
- Albert, S.; Bauer, T.; Michl, M.; Biroli, G.; Bouchaud, J.-P.; Loidl, A.; Luckenheimer, P.; Tourbot, R.; Wiertel-Gasquet, C.; Ladieu, F. Fifth-order susceptibility unveils growth of thermodynamic amorphous order in glass-formers. Science 2016, 352, 1308–1311. [Google Scholar] [CrossRef] [PubMed] [Green Version]
- Louzguine-Luzgin, D.V.; Seki, I.; Ketov, S.V.; Louzguina-Luzgina, L.V.; Polkin, V.I.; Chen, N.; Fecht, H.; Vasiliev, A.N.; Kawaji, H. Glass-transition process in an Au-based metallic glass. J. Non-Cryst. Solids 2015, 419, 12–15. [Google Scholar] [CrossRef]
- Louzguine-Luzgin, D.V.; Georgarakis, K.; Tsarkov, A.; Solonin, A.; Honkimaki, V.; Hennet, L.; Yavari, A.R. Structural changes in liquid Fe and Fe-B alloy on cooling. J. Mol. Liq. 2015, 209, 233–238. [Google Scholar] [CrossRef]
- Wang, Z.; Chen, C.L.; Ketov, S.V.; Akagi, K.; Tsarkov, A.A.; Ikuhara, Y.; Louzguine-Luzgin, D.V. Local chemical ordering within the incubation period as a trigger for nanocrystallization of a highly supercooled Ti-based liquid. Mater. Des. 2018, 156, 504–513. [Google Scholar] [CrossRef]
- Louzguine-Luzgin, D.V.; Belosludov, R.; Yavari, A.R.; Georgarakis, K.; Vaughan, G.; Kawazoe, Y.; Egami, T.; Inoue, A. Structural basis for supercooled liquid fragility established by synchrotron-radiation method and computer simulation. J. Appl. Phys. 2011, 110, 043519. [Google Scholar] [CrossRef]
- Louzguine-Luzgin, D.V.; Miyama, M.; Nishio, K.; Tsarkov, A.A.; Greer, A.L. Vitrification and nanocrystallization of pure liquid Ni studied using molecular-dynamics simulation. J. Chem. Phys. 2019, 151, 124502. [Google Scholar] [CrossRef]
- Louzguine-Luzgin, D.V. Vitrification and devitrification processes in metallic glasses. J. Alloys Compd. 2014, 586, S2–S8. [Google Scholar] [CrossRef]
- Georgarakis, K.; Louzguine-Luzgin, D.V.; Antonowicz, J.; Vaughan, G.; Yavari, A.R.; Egami, T.; Inoue, A. Variations in atomic structural features of a supercooled Pd-Ni-Cu-P glass forming liquid during in situ vitrification. Acta Mater. 2011, 59, 708–716. [Google Scholar] [CrossRef]
- Uhlmann, D.R. A kinetic treatment of glass formation. J. Non-Cryst. Solids 1972, 7, 337–348. [Google Scholar] [CrossRef]
- Ozhovan, M.I.; Semenov, K.N. Percolation in a system of polydispersed particles. J. Exp. Theor. Phys. 1992, 75, 696–698. [Google Scholar]
- Uhlmann, D.R.; Hays, J.F.; Turnbull, D. The effect of high pressure on crystallization kinetics with special reference to fused silica. Phys. Chem. Glasses 1966, 7, 159–168. [Google Scholar]
- Fanfoni, M.; Tomellini, M. The Johnson-Mehl-Avrami-Kolmogorov model: A brief review. Il Nuovo Cimento D 1998, 20, 1171–1182. [Google Scholar] [CrossRef]
- Ojovan, M. On viscous flow in glass-forming organic liquids. Molecules 2020, 25, 4029. [Google Scholar] [CrossRef] [PubMed]
- Doremus, R.H. Viscosity of silica. J. Appl. Phys. 2002, 92, 7619. [Google Scholar] [CrossRef]


| Bond Type | Substance | Bond Energy (kJ/mol) | Configuron Description | Microscopic Result of Configuron Formation |
|---|---|---|---|---|
| Covalent | SiO2 | 443 | A Si–O broken bond with neighboring adjustments | A shift by one or more atoms from the first coordination shell |
| Ionic | CuF2 | 2591 | A Cu–F broken bond with neighboring adjustments | A shift by one or more atoms from the first coordination shell |
| Metallic | Fe | 407 | A displacement of an atom out of the first coordination shell with neighboring adjustments | A shift by one or more atoms from the first coordination shell |
| Van der Waals | Ar | 7.6 | A broken Ar–Ar bond with neighboring adjustments | A shift by one or more atoms from the first coordination shell |
| Hydrogen | H2O | 50 | A broken hydrogen bond with neighboring adjustments | A shift by one or more atoms from the first coordination shell |
Publisher’s Note: MDPI stays neutral with regard to jurisdictional claims in published maps and institutional affiliations. |
© 2021 by the authors. Licensee MDPI, Basel, Switzerland. This article is an open access article distributed under the terms and conditions of the Creative Commons Attribution (CC BY) license (https://creativecommons.org/licenses/by/4.0/).
Share and Cite
Ojovan, M.I.; Tournier, R.F. On Structural Rearrangements Near the Glass Transition Temperature in Amorphous Silica. Materials 2021, 14, 5235. https://doi.org/10.3390/ma14185235
Ojovan MI, Tournier RF. On Structural Rearrangements Near the Glass Transition Temperature in Amorphous Silica. Materials. 2021; 14(18):5235. https://doi.org/10.3390/ma14185235
Chicago/Turabian StyleOjovan, Michael I., and Robert F. Tournier. 2021. "On Structural Rearrangements Near the Glass Transition Temperature in Amorphous Silica" Materials 14, no. 18: 5235. https://doi.org/10.3390/ma14185235
APA StyleOjovan, M. I., & Tournier, R. F. (2021). On Structural Rearrangements Near the Glass Transition Temperature in Amorphous Silica. Materials, 14(18), 5235. https://doi.org/10.3390/ma14185235