1. Introduction
Magnetoelectric (ME) materials produce strong ME effects due to the mechanical coupling between magnetostrictive and piezoelectric materials, which has been studied intensively in both theories and experiments [
1,
2,
3,
4,
5,
6]. Such ME effects provide a promising candidate for the highly sensitive DC magnetic field sensor due to its significant variations with external direct current (DC) magnetic field. Dong et al. [
7] presented a ME laminate under a constant drive of
Hac = 1 Oe, which can reach the limit of detection (LOD) for a DC magnetic field
Hdc of 10
−4 Oe. Sun et al. [
2] reported a novel Nano-Electromechanical System (NEMS) AlN/FeGaB resonator with a high DC magnetic field sensitivity of 280 kHz/Oe and a LOD of 8 × 10
−6 Oe. Liu et al. [
8] demonstrated a highly sensitive DC magnetic field sensor with a LOD of 2 × 10
−5 Oe. Martins et al. [
9] showed a Metglas/poly(vinylidene fluoride)/Metglas magnetoelectric laminate with the sensitivity of 30 mV·Oe
−1 and resolution of 8 μ Oe for
Hdc detection, and its correlation coefficient, linearity and accuracy values reached 0.995, 95.9% and 99.4%, respectively. Yao et al. [
10] developed a Metglas/PMNT/Metglas laminate with the LOD of 10 × 10
−5 Oe for
Hdc detection. Wang et al. [
11] also proposed a transformer-type magnetic sensor consisting of soft magnetostrictive alloy FeBSiC/piezoelectric ceramics Pb(Zr,Ti)O
3/FeBSiC heterostructure wrapped with both the exciting and sensing coils, which provided the maximum magnetic field sensitivity of 2.12 V/Oe and equivalent magnetic noise of 114 × 10
−8 Oe/
(at 1 Hz).
Meanwhile the material property and structure of ME composite have been researched intensively for the magnetic sensor application. As such, the field-dependent characteristics of piezomagnetic coefficient for magnetostrictive material [
12], the effect of different magnetostrictive materials on the
Hdc sensitivity [
13,
14,
15,
16], and the optimum structure of piezoelectric/magnetostrictive composite [
17,
18,
19,
20] etc. were reported. Additional to understanding the material property of ME composite, it is essential to study the equivalent electrical parameters of ME composite to further improve the DC magnetic sensor performance. However, few articles have reported and analyzed the
Hdc dependence of equivalent electrical parameters based on the modified Butterworth–Van Dyke (MBVD) model of magnetoelectric material, even though this is crucial to guide the conditioning circuit design of the ME sensor. Hence, the exploration of electrical equivalent circuit for ME device in this study facilitates understandings of corresponding electrical resonance behavior, which is beneficial for the design and optimization of impedance matching circuits for ME devices. Additionally, this study is expected to guide the design of the magnetic-field-tuned ultrasonic transducer, which can effectively solve the problem of resonance frequency shift and impedance mismatch of the ultrasonic transducer. It is noted that the MBVD model characterizes the loss mechanisms more accurately compared to the conventional Butterworth–Van Dyke model by considering the effects of additional electrical losses and dielectric losses, which can model the measured results more accurately.
In this paper, we investigate the equivalent circuit of the ME sensor based on the MBVD model of PZT/FeSiB laminated composite. It is noted that Lead zirconate titanate Pb(Zr0.3Ti0.7)O3 (PZT) exhibits the outstanding piezoelectric performance and high mechanical quality factor compared to other piezoelectric materials such as polyvinylidene fluoride (PVDF) and BaTiO3 etc. Meanwhile, the FeSiB (International standard trademark Metglas-2605 S2) possesses a low saturation field and a strong magnetostrictive effect at low magnetic biases Hdc due to its ultrahigh magnetic permeability (i.e., the initial magnetic permeability of 45,000). Correspondingly, magnetostrictive material FeSiB and piezoelectric material PZT are utilized for the ME composite in order to obtain highly magnetic sensing capabilities. In this study, the electrical equivalent circuit parameters of the ME sensor are calculated with the electrical resonance characteristics of measured impedance. Furthermore, the dependences of magnetoimpedance and corresponding MBVD model’s parameters on DC magnetic field are measured and discussed. Such dependences are mainly attributed to the delta E and magnetostrictive effects of FeSiB and correspondingly varied PZT’s dielectric permittivity. Additionally, the effects of the piezoelectric materials and electrode material’s properties on the MBVD model’s parameters are analyzed. The study of electrical equivalent circuit facilitates the understanding of electrical resonance behavior for ME devices, and it plays a crucial role in the design of impedance matching circuits for ME devices. Meanwhile, the controllable impedance and dielectric permittivity of PZT/FeSiB ME composites with DC bias magnetic field have broad potential applications, such as tunable spin filters, storage devices, and magnetic sensor etc.
3. Results and Discussion
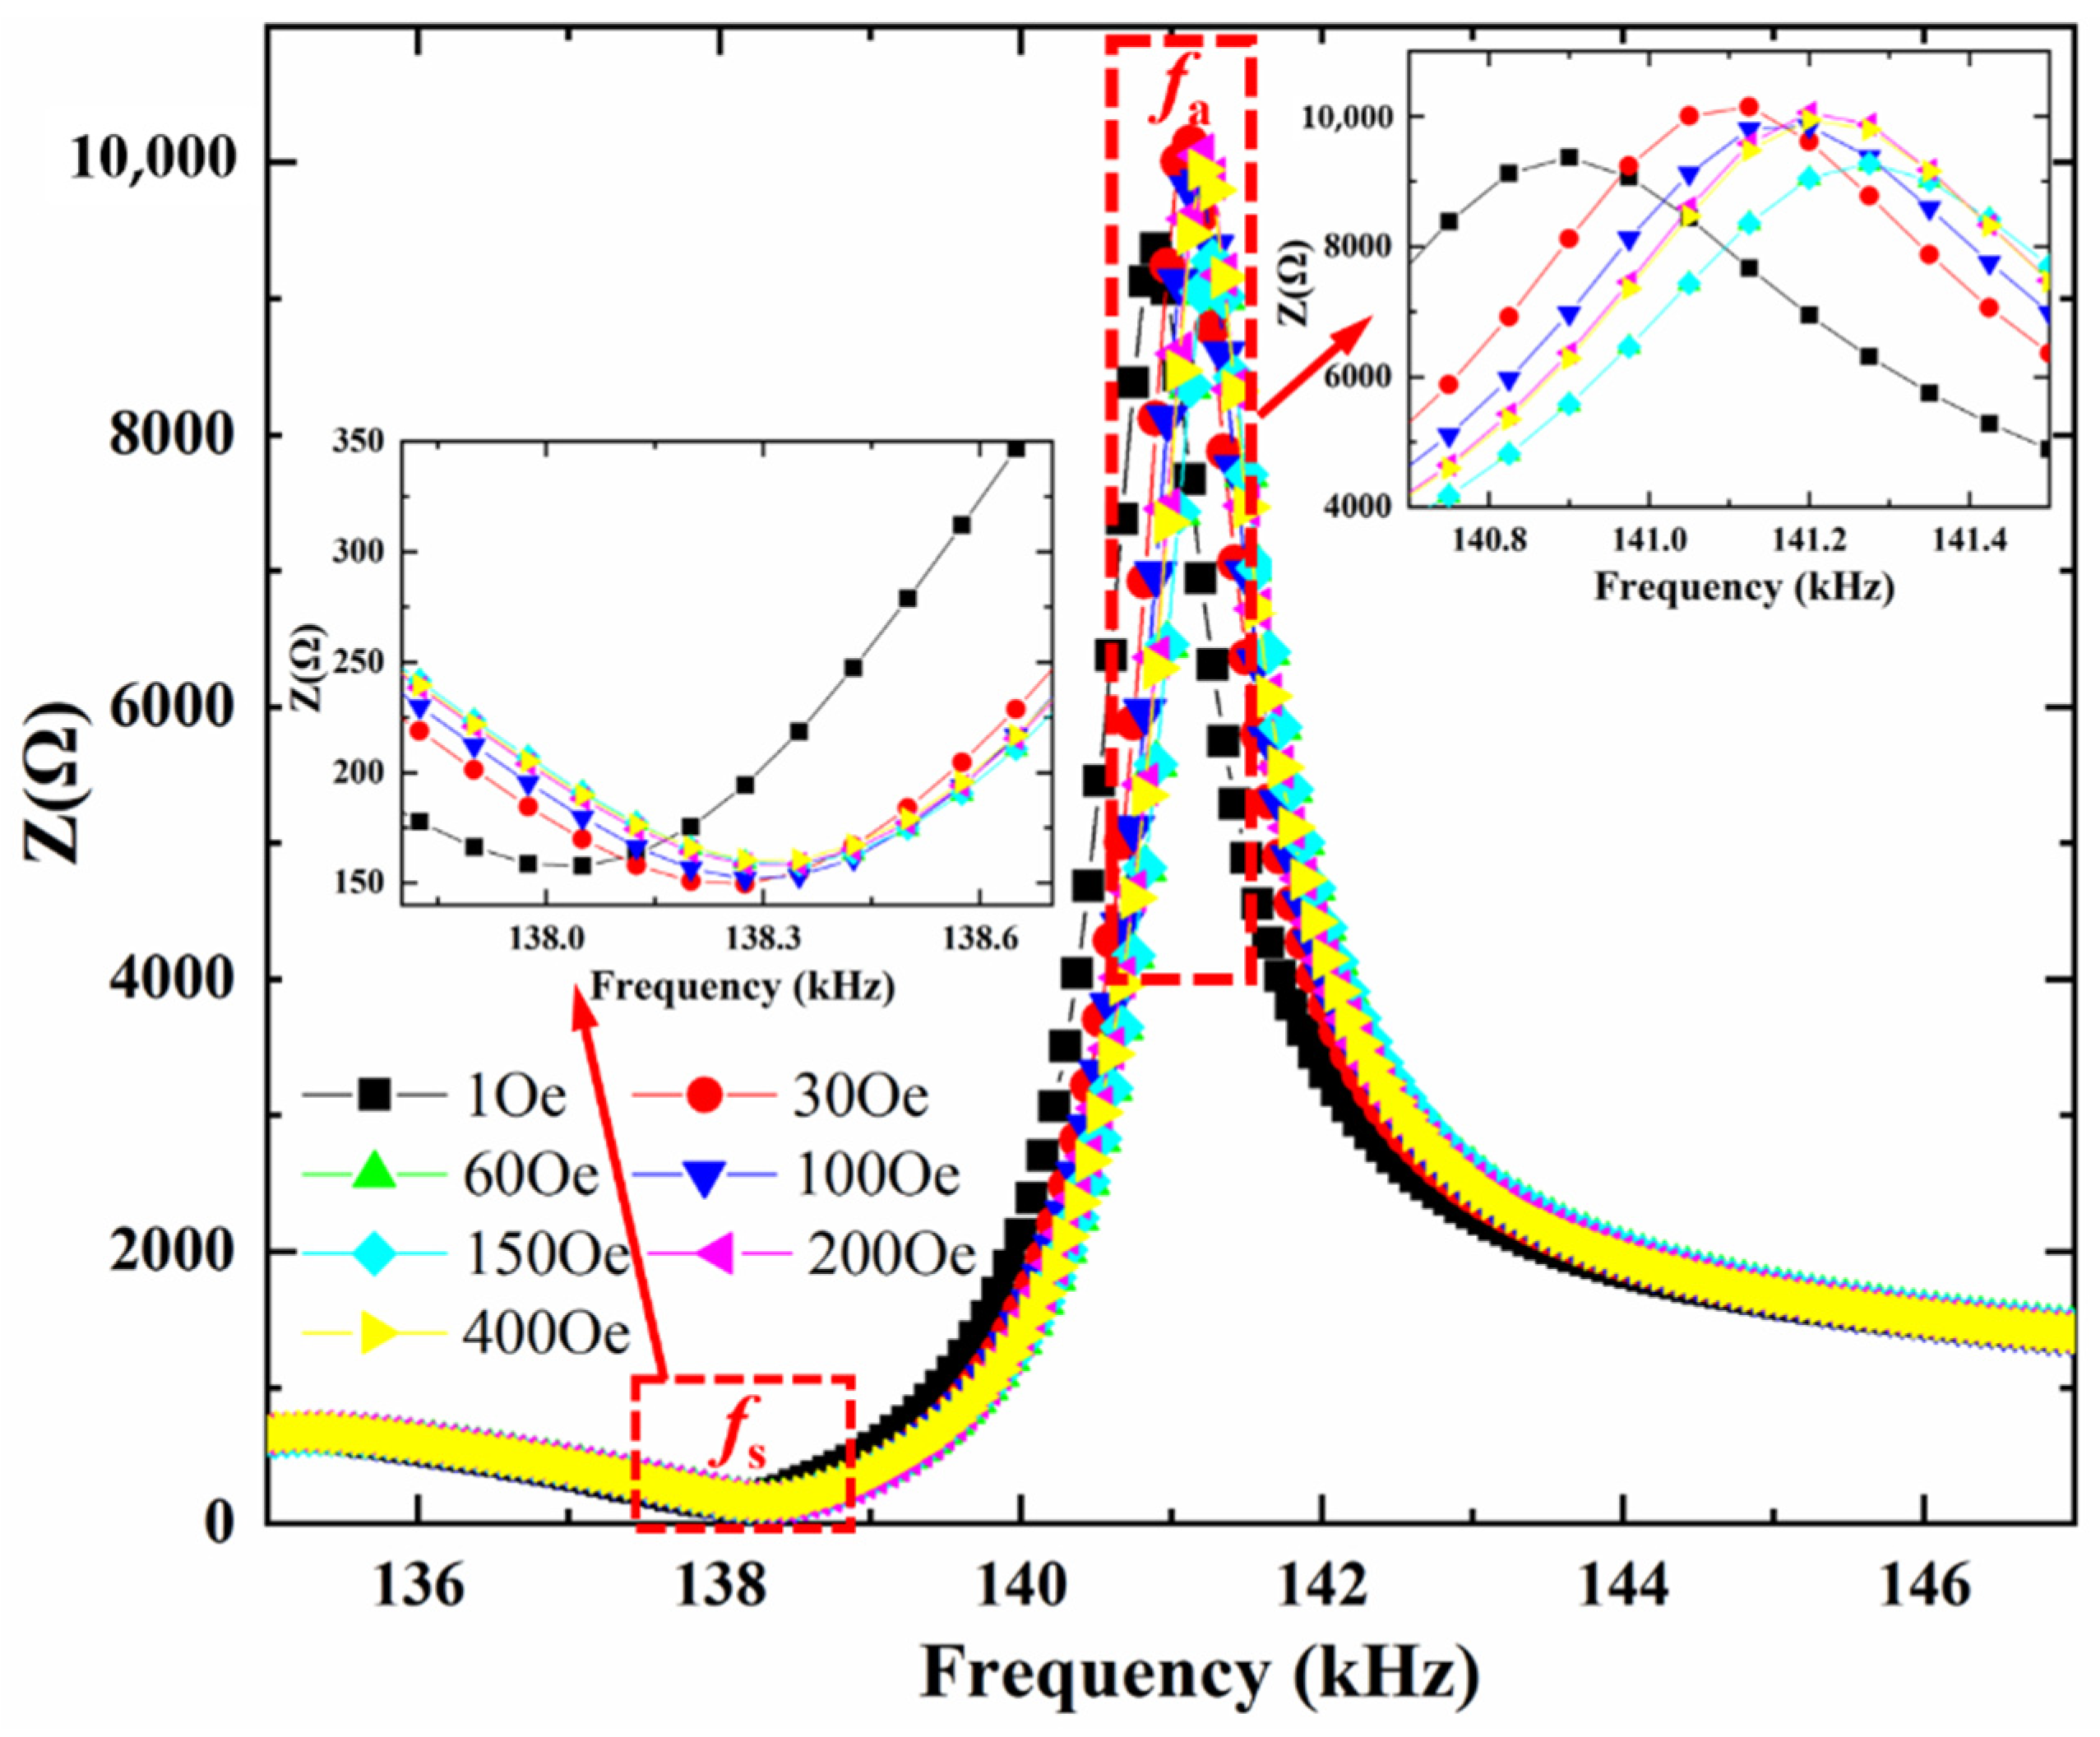
Figure 1 shows the impedance Z of the ME sensor as a function of electrical excitation frequency
f when the varied DC bias magnetic field is applied along the length direction. As illustrated in the inset of
Figure 1, the maximum and minimum impedance as a function of excitation frequency show a strong dependence on DC bias magnetic field.
It is known that the impedance of the ME sensor is defined by [
21],
where
and
are the effective relative permeability and permittivity,
and
are vacuum permeability and permittivity, respectively. The effective relative permittivity
can be represented as [
22].
where
is relative permittivity of piezoelectric material,
d31,p is the piezoelectric coefficient,
fs is the resonance frequency,
and
are the Young’s modulus of piezoelectric and magnetostrictive materials, respectively.
and
are the volume fractions of piezoelectric material PZT and magnetostrictive material FeSiB in the ME sensor, respectively.
By applying a DC bias magnetic field to the magnetostrictive material FeSiB, the magnetostriction is produced by FeSiB and transferred to the PZT layer through interfacial coupling. Meanwhile the magnetostrictive stress will also change the Young’s modulus
of magnetostrictive material FeSiB and corresponding resonance frequency
. Correspondingly from the inset of
Figure 1, the electromechanical resonance frequency
fs of the ME sensor shows a strong dependence on DC bias magnetic field
Hdc. Specifically, the resonance frequency
fs of the ME sensor is determined by the geometrical dimensions and material parameters (i.e., Young’s modulus and mass density) of both piezomagnetic and piezoelectric materials, and is expressed as [
12],
where
l is the length of the ME sensor,
and
are the average density and equivalent Young’s modulus of ME laminate, respectively. For the ME composite,
and
are determined by [
6],
where
and
are the densities of piezoelectric and magnetostrictive materials, respectively.
Here the Young’s modulus of magnetostrictive material FeSiB is given by [
23],
where
,
,
are the elastic strain, elastic stress and magnetoelastic strain, respectively. The magnetoelastic strain arises from the magnetic domain reorientation during the varied
Hdc [
24,
25], which results in the change in effective Young’s modulus with
Hdc. As a result, the shifts in corresponding resonance frequency (Equation (3)) with
Hdc are observed.
According to Equations (1) and (2), the variations in the Young’s modulus
of FeSiB and resonance frequency
with
Hdc also lead to the changes in effective relative permittivity and corresponding impedance with
Hdc for ME composite. It is noted that the combination of magnetoresistance (MR) and the Maxwell–Wagner effect could also cause the magnetodielectric effect, according to the previous report [
26]. However, for our asymmetric PZT/FeSiB laminate, piezoelectric material PZT is covered with the insulating epoxy glue at surface to prevent the current penetrating into the neighboring magnetic ribbon FeSiB. Hence, there is no giant magnetoresistance effect since the sensing current cannot go through the magnetic layers and, correspondingly, no spin dependent scattering phenomenon happens in the ferromagnetic layer. Furthermore, Castel et al. [
22] have also reported that the magnetodielectric effect of BaTiO
3-Ni laminated composite could reach 10% near the resonance frequency at
Hdc = 6 kOe and clarified that the magnetodielectric mechanism of their composites was based on the strain effect instead of the Maxwell—Wagner effect.
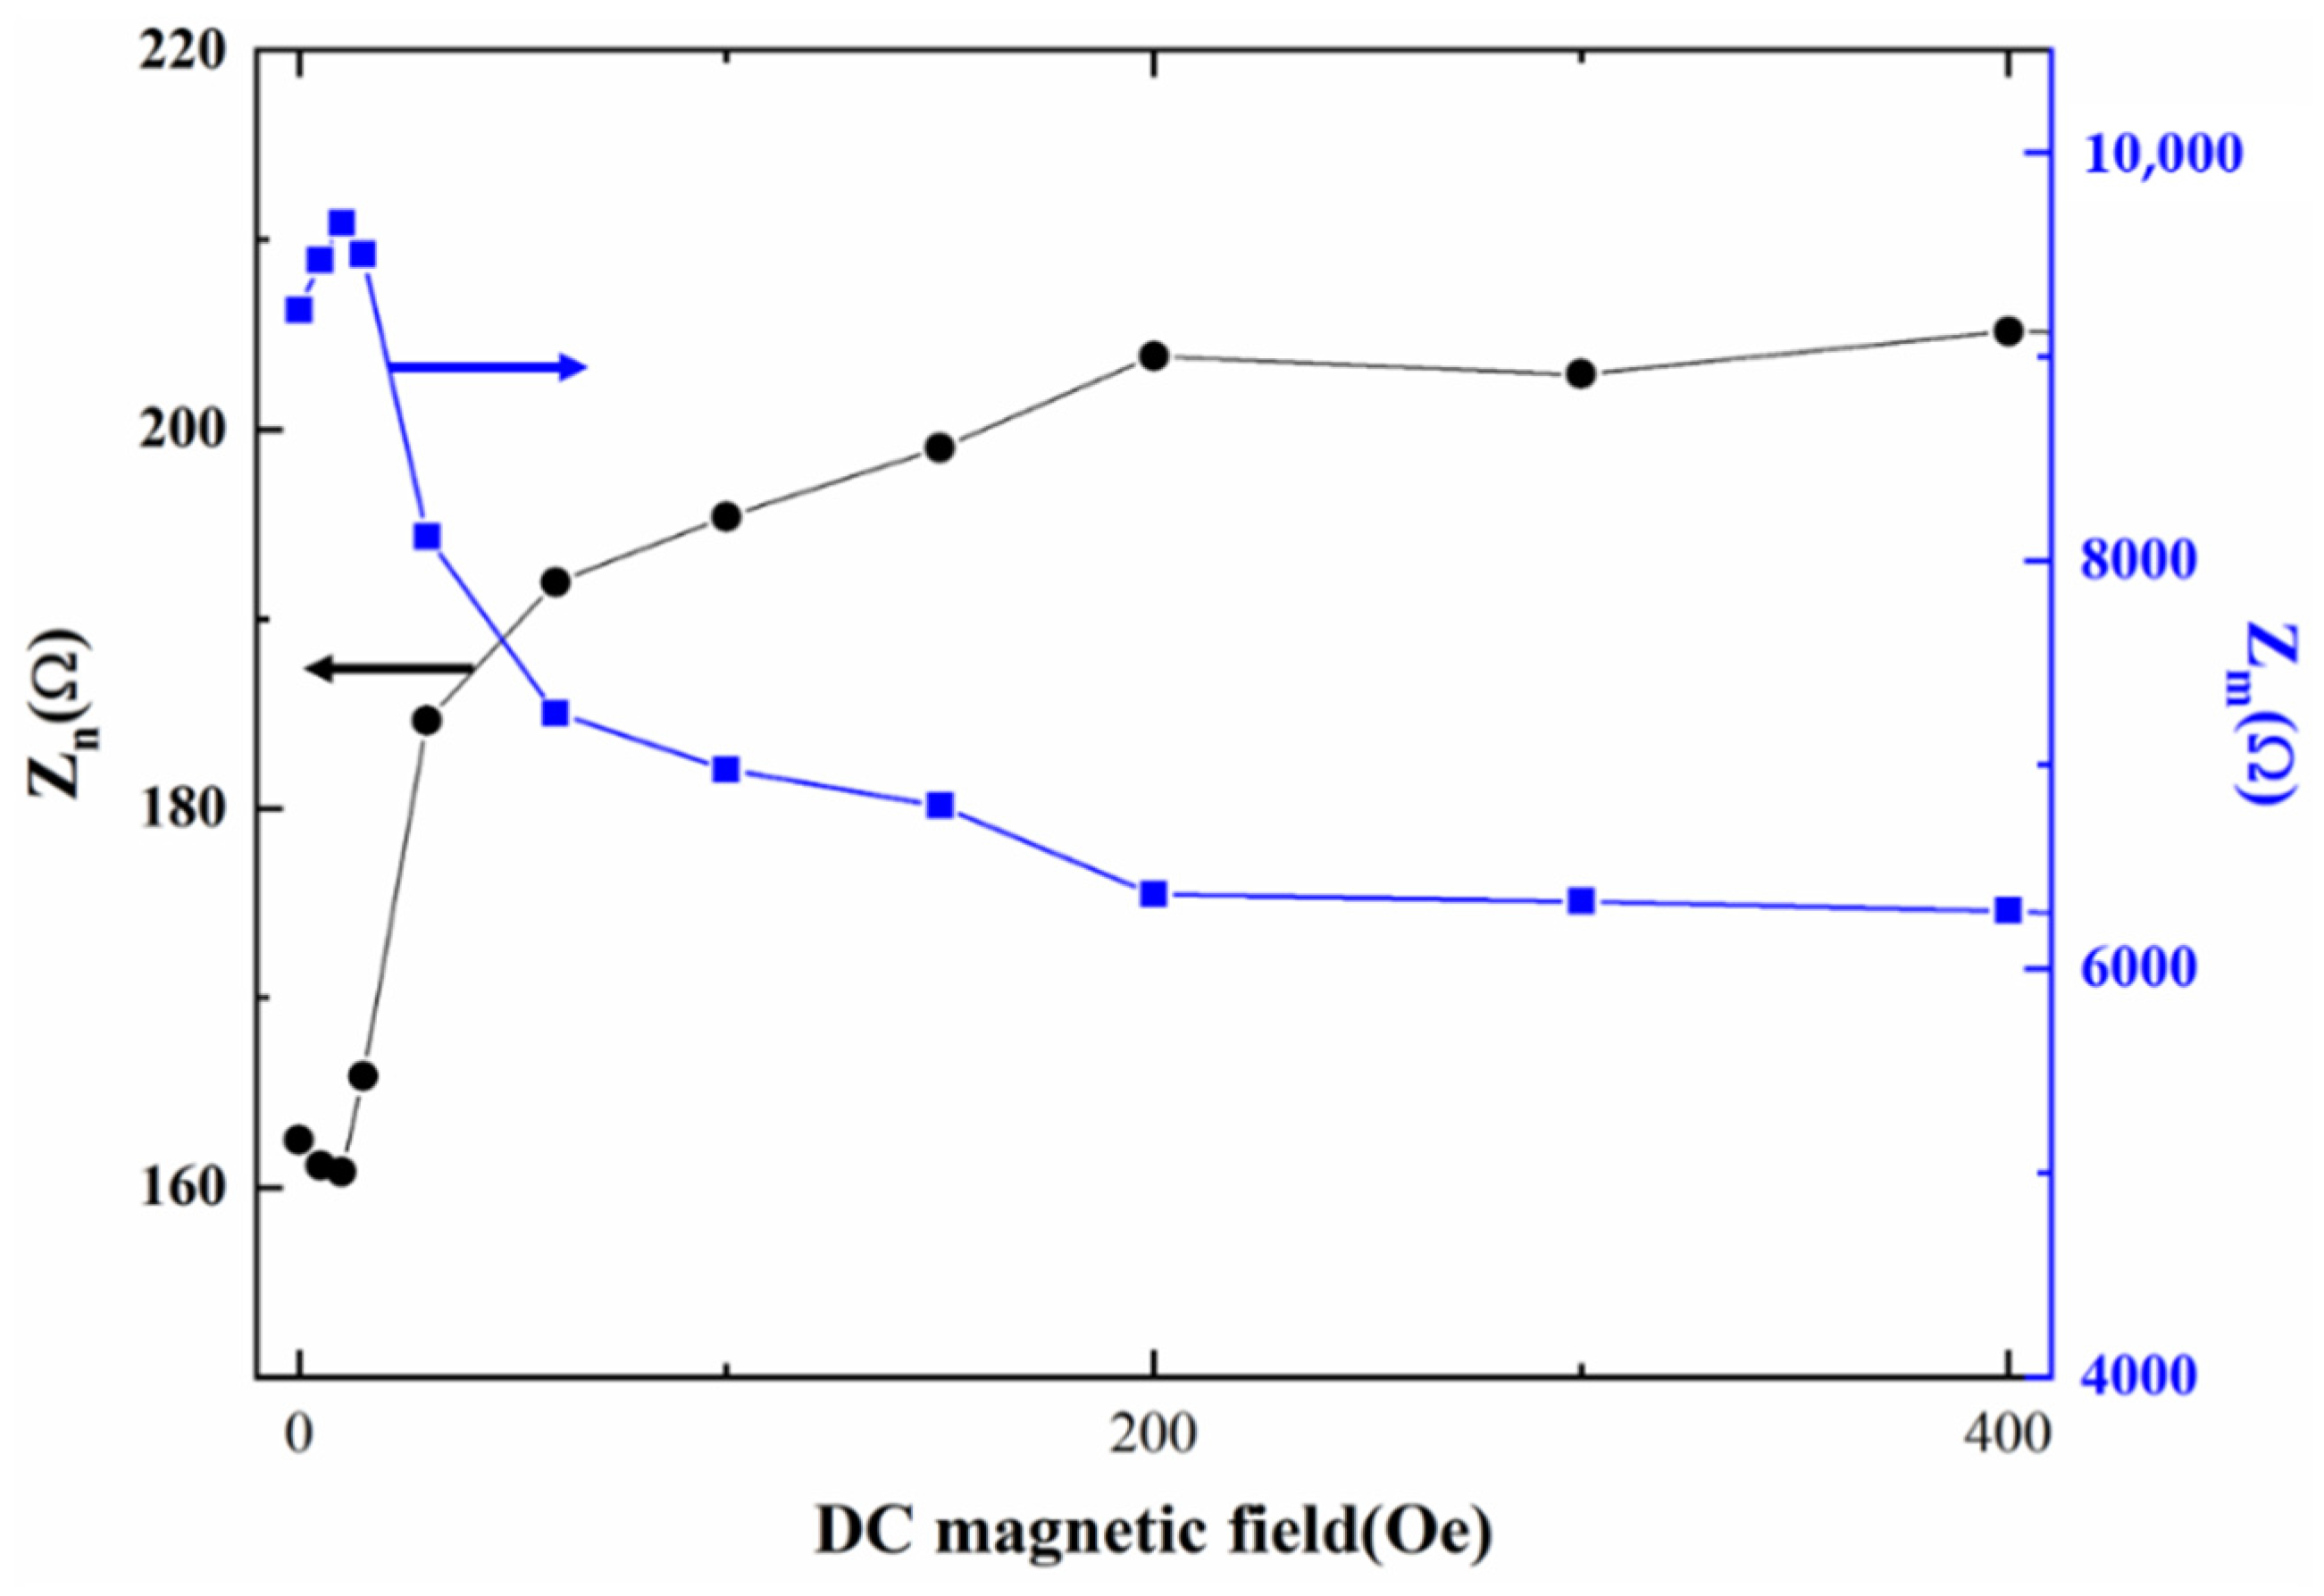
It is also interesting to find in
Figure 2 that the maximum impedance Z
m at the antiresonance frequency (
fa) increases to a maximum value at
Hdc = 30 Oe, and then decreases with further increasing
Hdc, while the minimum impedance Z
n at the resonance frequency (
fs) varies in the opposite trend. Namely, Z
n decreases to a minimum value, and then increases with the increasing
Hdc. This is mainly because the capacitance is directly proportional to dielectric permittivity, the minimum capacitance value at
fa results in the maximum impedance Z
m and the maximum capacitance value at
fs leads to the minimum impedance Z
n according to Equation (1).
In order to understand the trend of impedance as a function of
DC magnetic field, the electromechanical (ME) sensor is characterized with a lumped-parameter equivalent circuit based on the MBVD model, as shown in
Figure 3. To characterize the loss from the electrodes, the MBVD model adds two additional loss resistors (i.e.,
R0 and
Rs) to obtain a more accurate model compared with the standard Butterworth–Van Dyke model. It consists of two network branches in parallel, where
R0 represents the resistance associated with dielectric losses of the ME sensor,
Rs represents the resistance associated with electrical losses of electrode,
Rm denotes the resistance associated with mechanical losses,
Lm and
Cm denote the motional inductance and capacitance,
C0 represents the static capacitance formed between top and bottom electrodes of the ME sensor.
The analytical expression of impedance
and the electrical admittance
for MBVD model are given by [
27,
28],
The series resonance frequency
and antiresonance frequency
can be expressed as [
27,
28],
Using Equations (7), (9) and (10), the model parameter values of
C0,
R0,
Rs,
Lm,
Cm and
Rm are extracted from the measured Z.
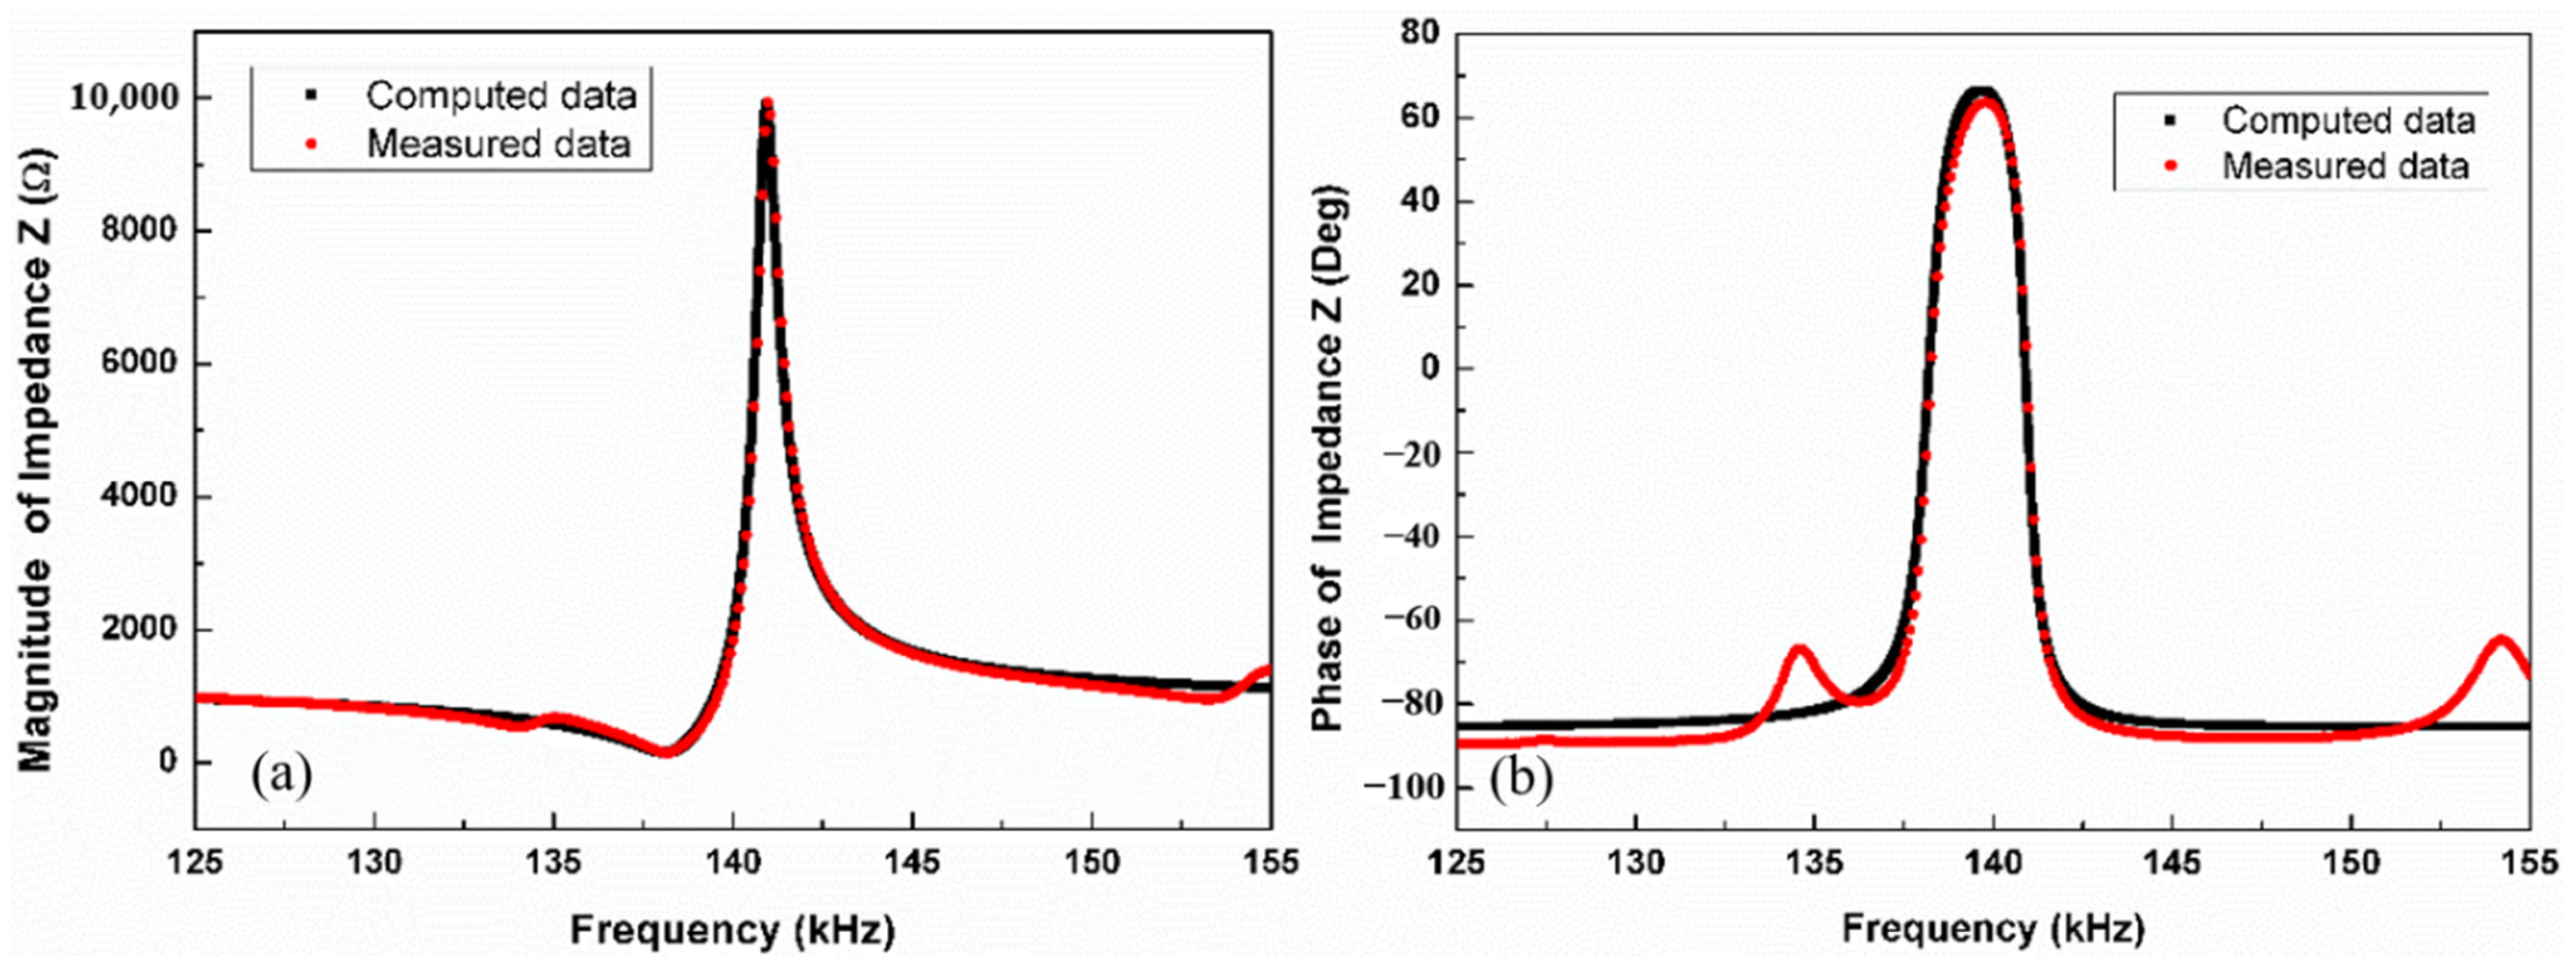
Table 1 lists all the extracted model parameters. To verify the MBVD model for further design of the conditioning circuit, the simulation of the model is implemented with the electrical simulator Agilent ADS.
Figure 4 presents the computed impedance Z and phase based on the extracted model parameters at
Hdc = 30 Oe, which shows a good agreement with the measured data.
According to the measured Z with DC bias magnetic field
Hdc, the corresponding equivalent circuit parameters (i.e.,
Cm,
Lm,
C0, Qs,
Rs +
Rm,
fs and
fa) are calculated and analyzed as a function of
Hdc, as shown in
Figure 5,
Figure 6,
Figure 7 and
Figure 8, respectively.
Specifically,
Cm and
Lm are given by [
27,
28],
where
d31,
,
,
lw,
lt and
l are the piezoelectric coefficient, elastic compliance coefficient, density, width, thickness and length of the ME sensor, respectively.
is the plate area.
It is obvious that the the length
l and elastic compliance coefficient
have strong influences on the
Cm and
Lm according to Equations (11) and (12). Specifically, due to the stress-strain coupling of interlayers, the magnetostrictive strain produced by FeSiB under varying
Hdc results in the change in the length
and elastic compliance coefficient
for piezoelectric material. As a result, the equivalent electrical parameters
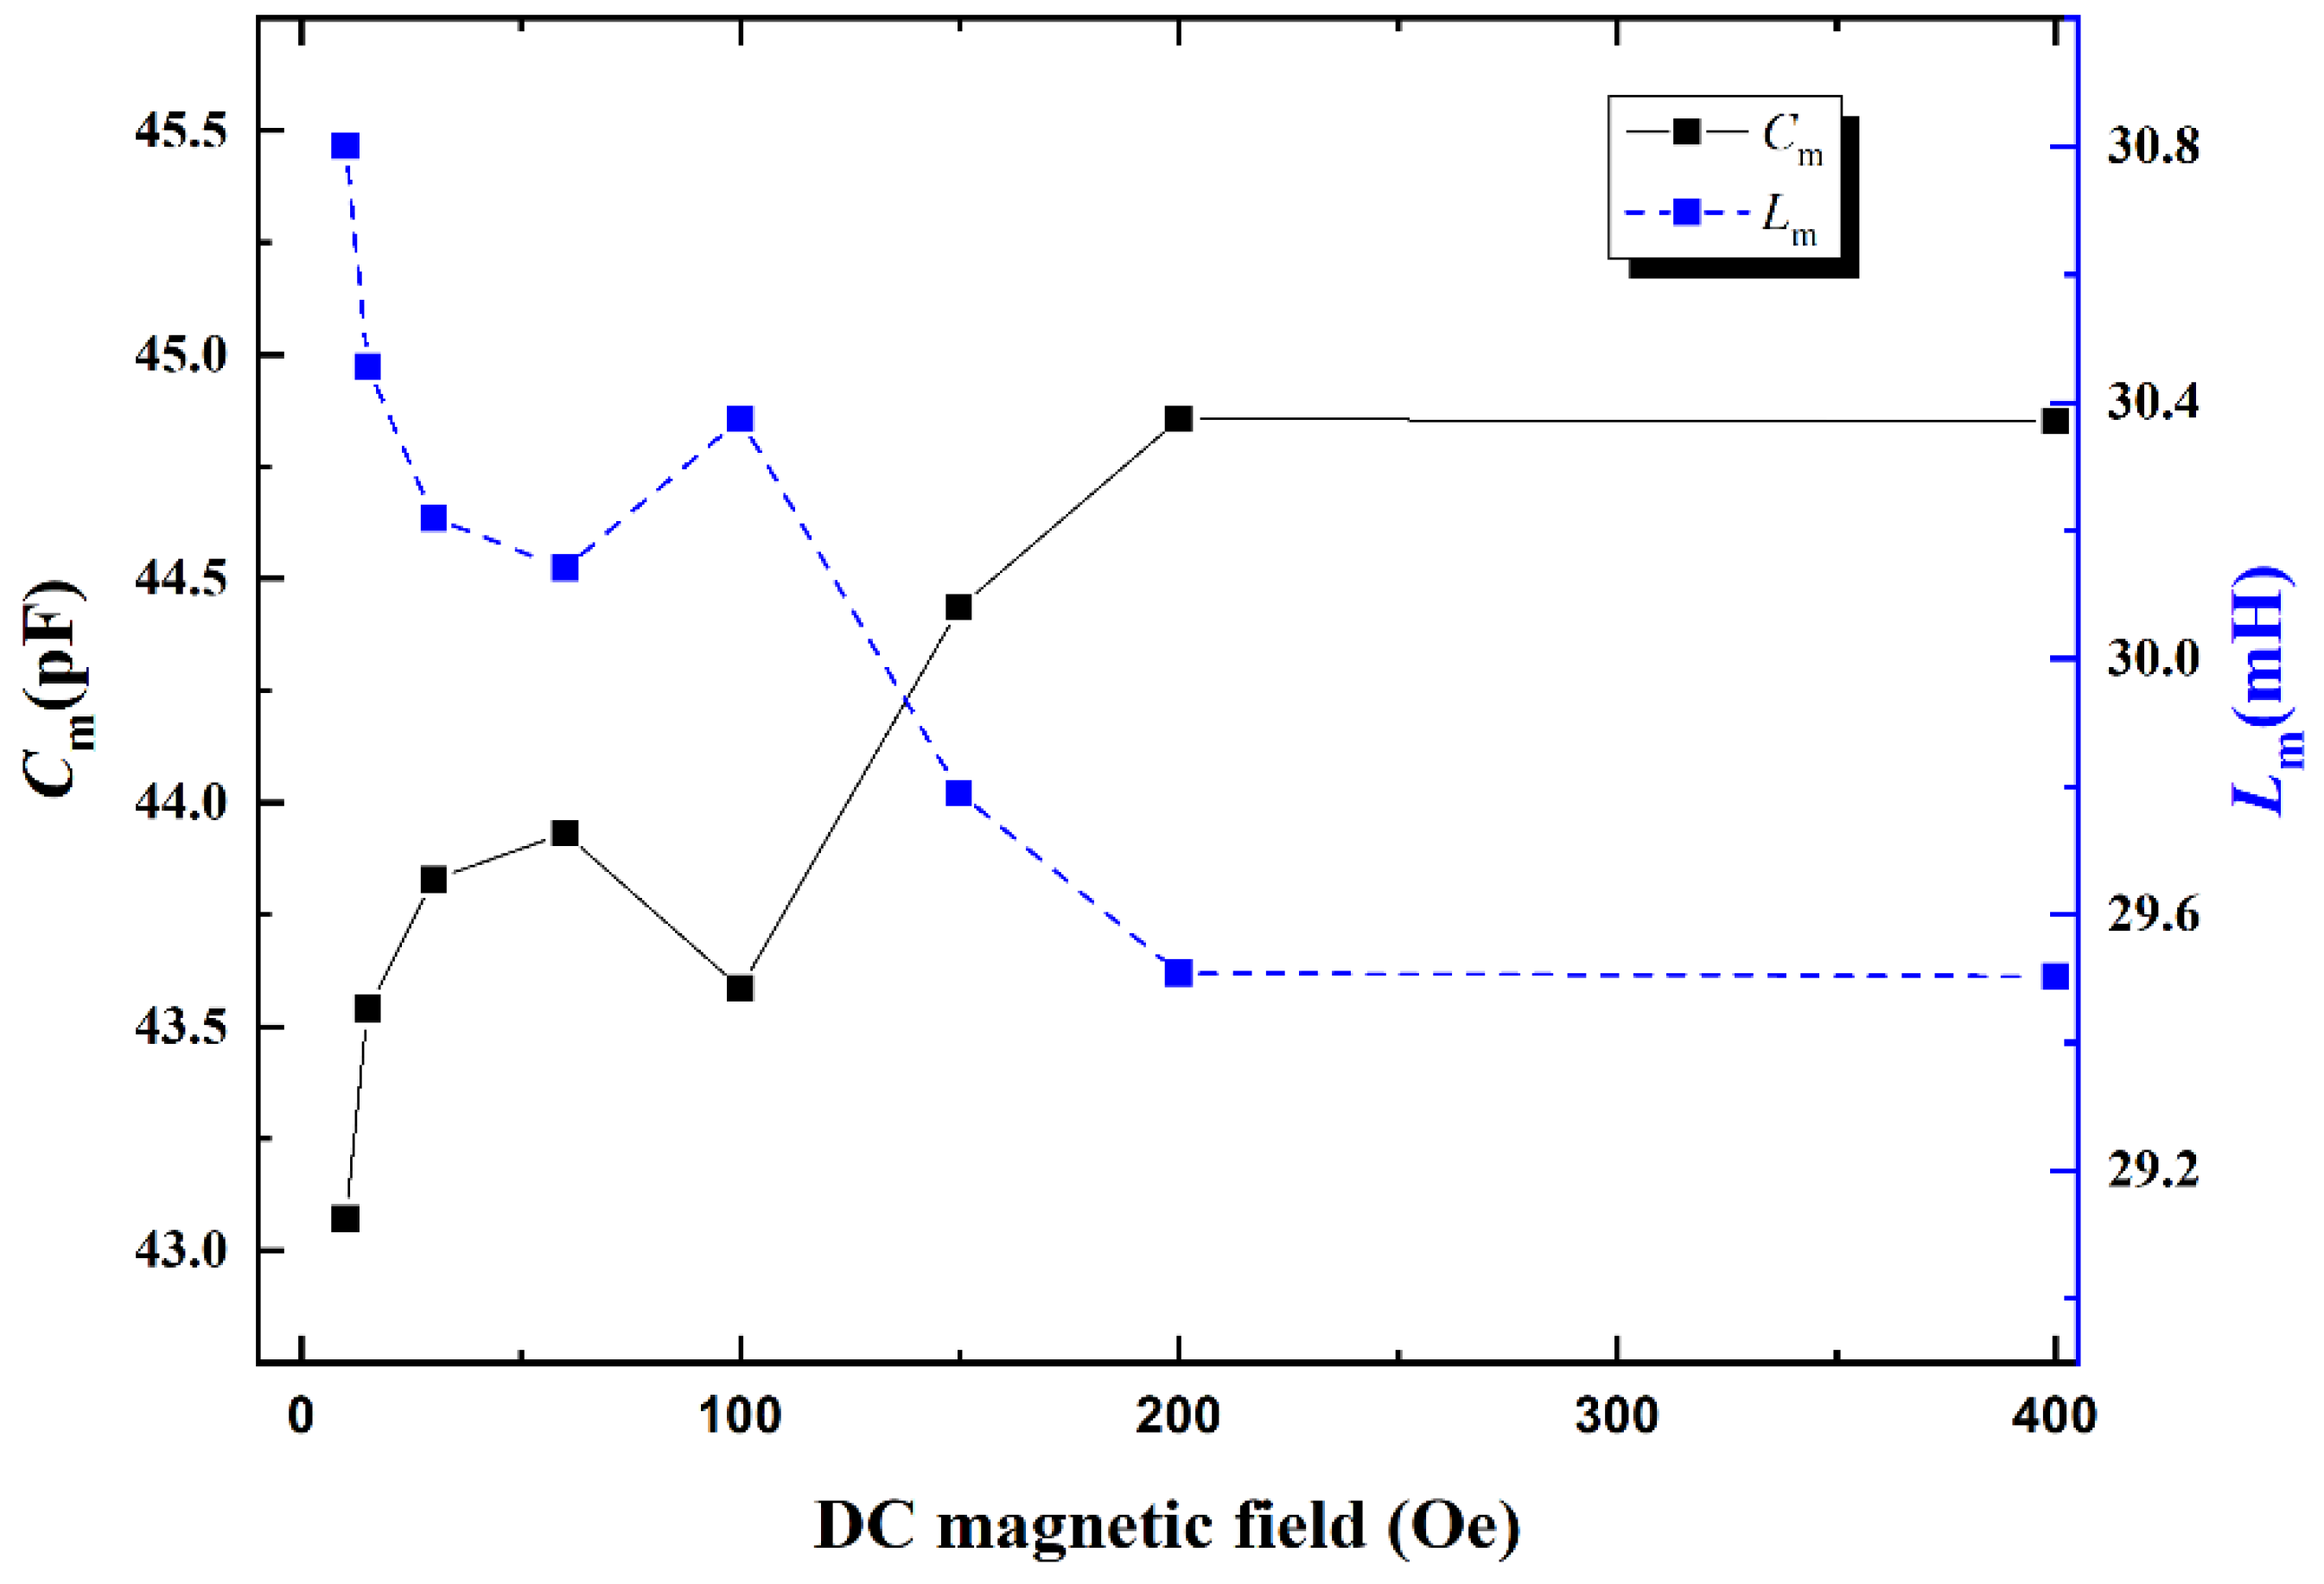
Cm and
Lm of the ME sensor strongly depend on
Hdc and vary in the opposite ways, as illustrated in
Figure 5. This is due to the fact that
Lm and
Cm are proportional to
and
, respectively.
Furthermore,
Cm is proportional to the length
l of composite, whereas it is inverse proportional to the elastic compliance coefficient. Since the Young’s modulus is the inverse of elastic compliance coefficient,
Cm is determined by both the Young’s modulus
E and length
l. On one hand due to the stress-strain coupling of the interlayers, the length
l increases quickly to a maximum value due to the large piezomagnetic coefficient
d33,m of FeSiB and then
l reaches the saturation with further increasing
Hdc. On the other hand, the Young’s modulus
E of the magnetostrictive layer and, corresponding, ME composite decrease initially to a minimum value with the increasing
Hdc, and then increases and reaches saturation at large
Hdc when
Hdc further increases [
18]. When
Hdc < 60 Oe, the magnetostriction does not attain to saturation,
Cm is affected by both Young’s modulus and the length
l. However, the effect of length
l on
Cm is more obvious than that of Young’s modulus due to the large
d33,m of FeSiB at the small
Hdc, which causes
Cm to increase with
Hdc and reach a positive peak in low magnetic field
Hdc = 60 Oe. When
Hdc further increases above 60 Oe, the magnetostriction reaches saturation quickly; however, the Young’s modulus
E still varies significantly and plays a dominant role in
Cm. Currently, Young’s modulus
E and corresponding
Cm reach the local minimum values when
Hdc further increases to 100 Oe, then
Cm gradually increases and reaches saturation with further increasing
Hdc due to the variation in E, as shown in
Figure 5.
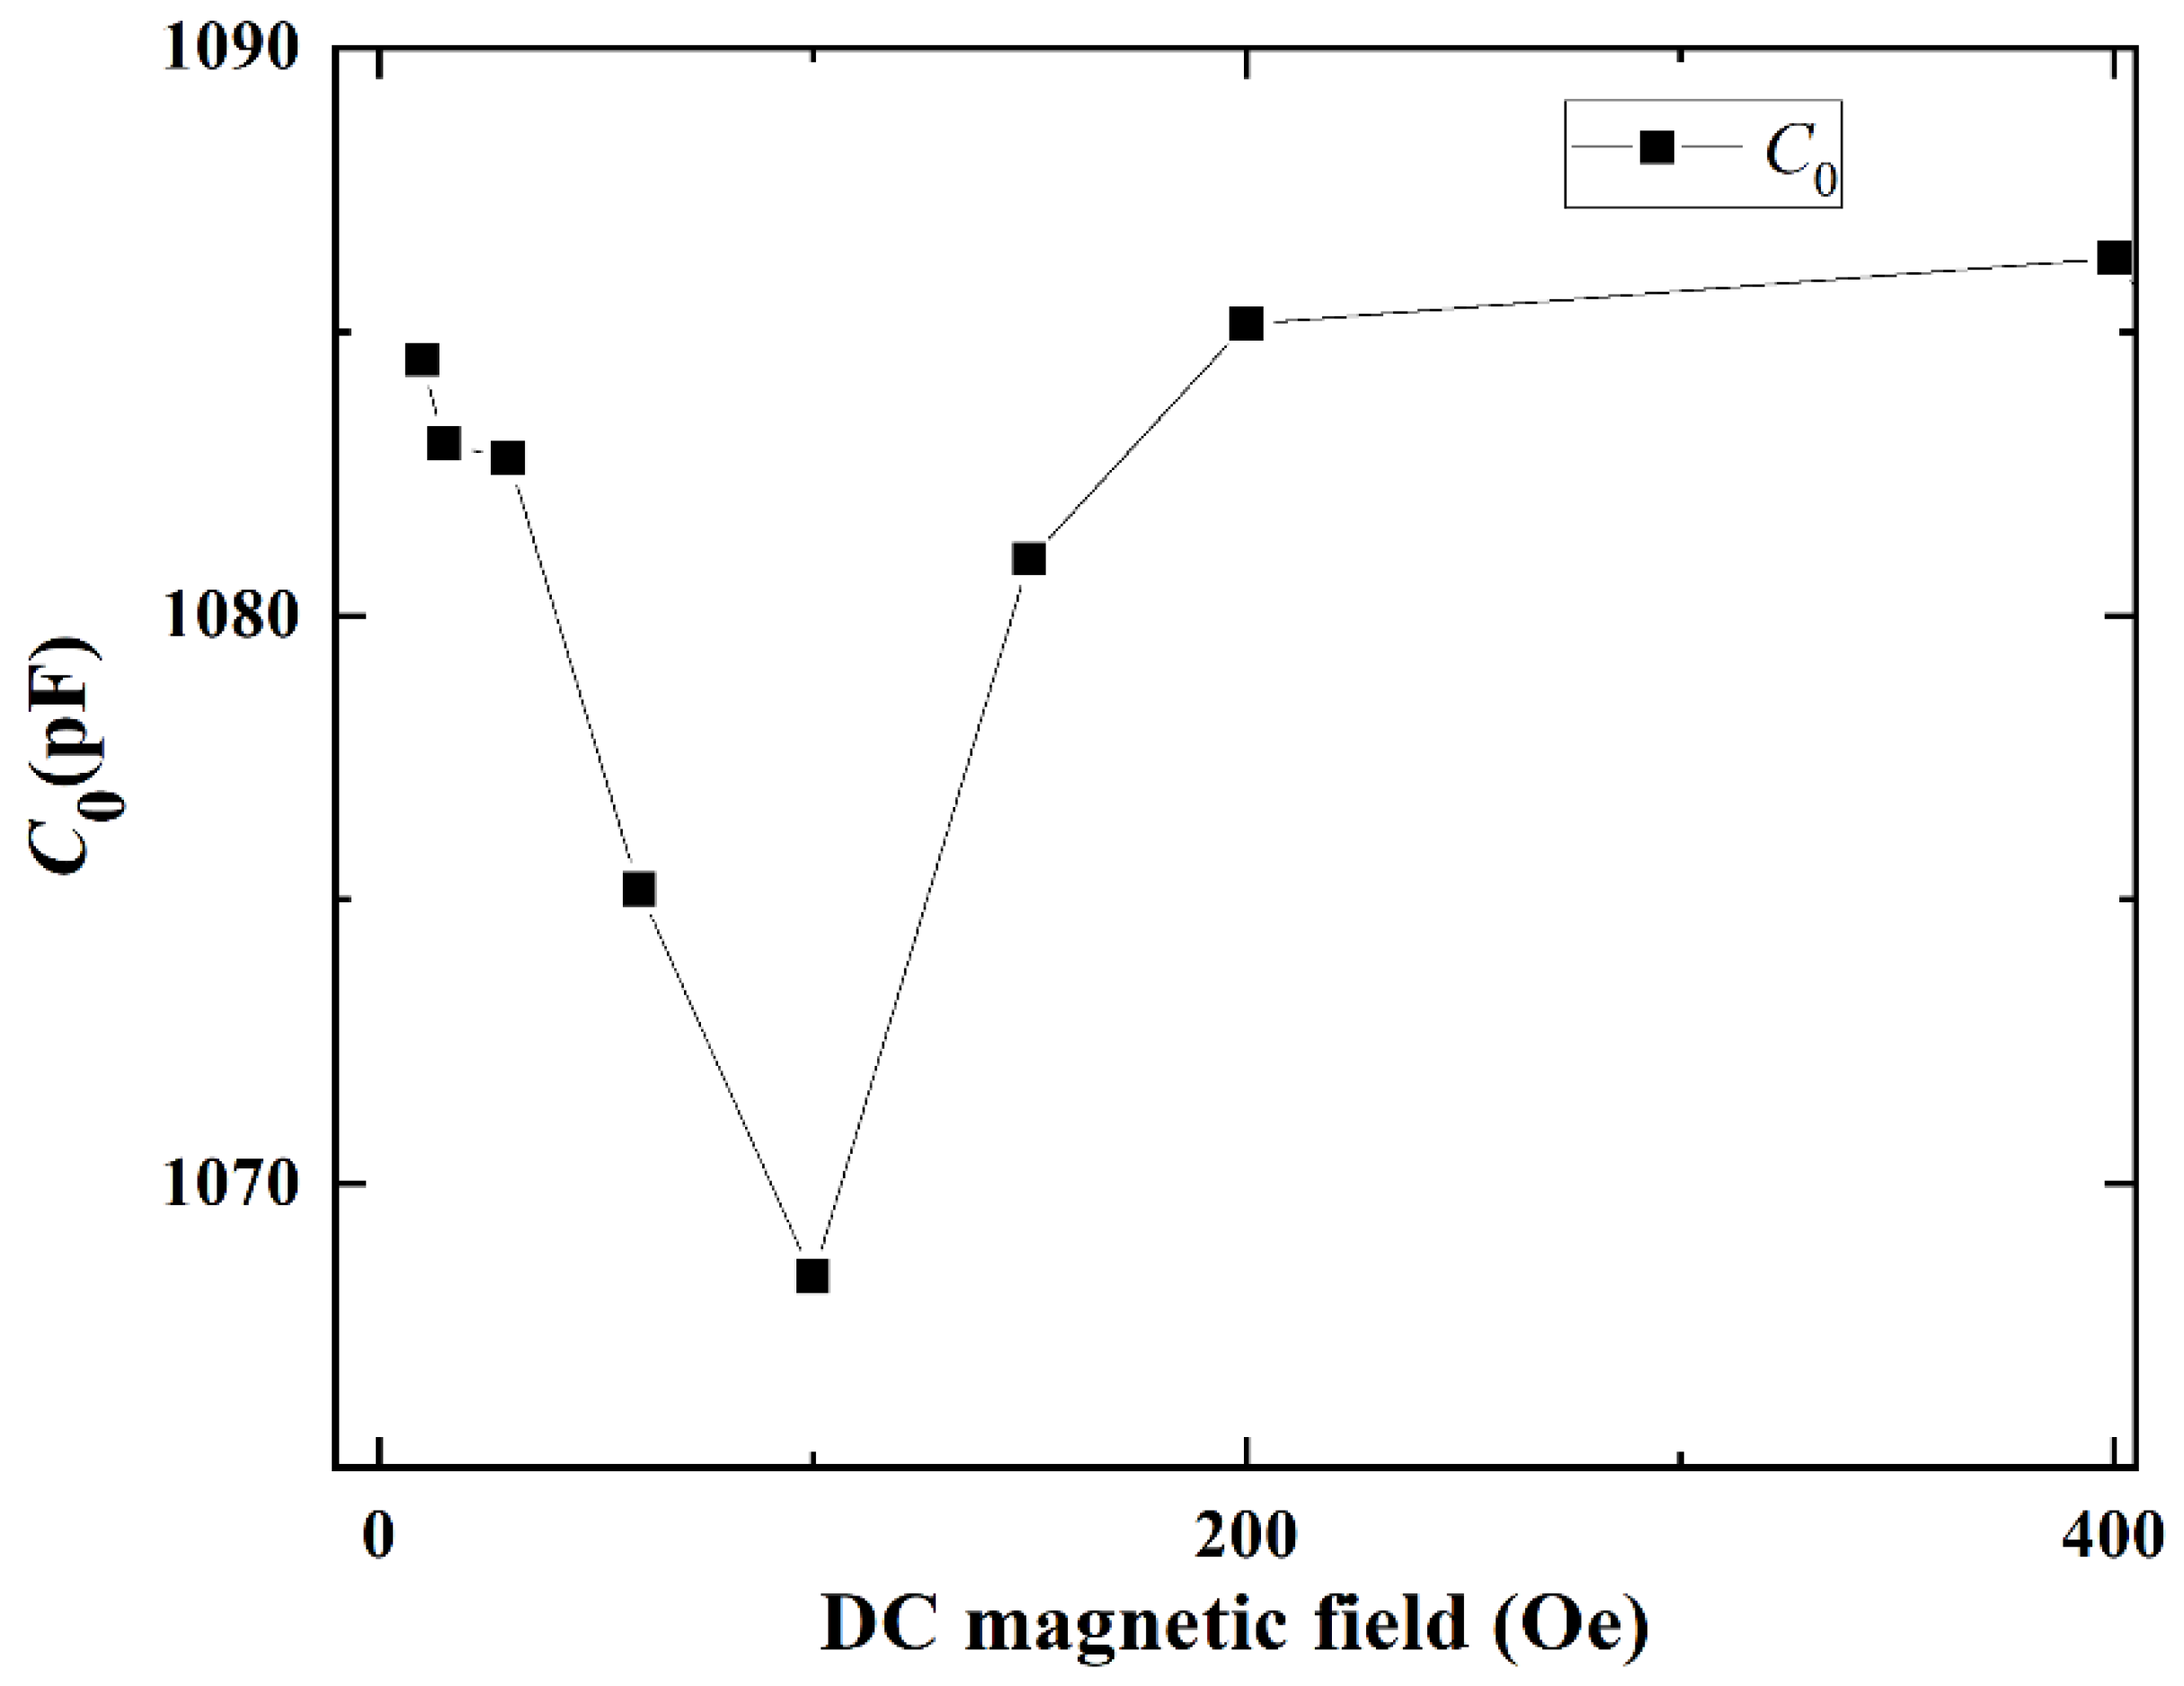
Meanwhile the static capacitance
C0 can be also expressed with the following expressions [
28]:
where
and
are the relative dielectric permittivity and vacuum permittivity of the piezoelectric material, respectively.
When
Hdc is applied along the longitudinal direction of the ME sensor, the magnetostrictive material FeSiB expands with the increasing
Hdc, which changes dielectric permittivity of piezoelectric material due to the transferred magnetostrictive stress. Correspondingly,
C0 varies with the DC magnetic field since
C0 is strongly determined by the dielectric permittivity. Yao et al. [
10] reported that the dielectric permittivity of Terfenol-D/PZT magnetoelectric composite at the resonant frequency decreased and then increased with increasing dc magnetic field. In this case,
C0 varies in a similar trend as function of
Hdc since
C0 is proportional to the dielectric permittivity. Specifically, it is shown in
Figure 6 that the static capacitance
C0 of the ME sensor first decreases with the increasing
Hdc, and then gradually increases.
The
Rm is used to characterize the mechanical loss, which is subject to energy loss in the ME sensor. It can be given as [
28],
is primarily determined by the length l. Correspondingly, the variations in the length l due to the magnetostriction of FeSiB cause the variation in with Hdc.
By analyzing the variation in equivalent circuit parameters (i.e., Cm, Lm, C0, Rm etc.) with Hdc, it is found that the varying magnetostrictive strain of FeSiB with Hdc is the main reason for the Hdc dependences of equivalent circuit parameters. Furthermore, it is also noted that these equivalent circuit parameters depend on the actively vibrating area A, since Rm and Lm decrease with the enlarged area, whereas the capacitances C0 and Cm increase with the enlarged area. Such relations are important for designing ME sensors.
Furthermore, the mechanical Quality factor (Q-factor) reflects the capability of the ME sensor to reserve mechanical energy and the corresponding loss of resonant circuit.
Q is defined as the ratio of the stored energy to the dissipated energy per cycle during oscillation. According to Lakin’s method, the
at series resonance frequency
and
at antiresonance frequency
can be defined as [
27,
28],
On one hand, the smaller value of RS is desired to improve the effective mechanical Quality factor of the ME sensor, according to Equation (15). Since RS represents the electrical loss of electrode, the type and quality of the electrode materials directly affect the of the ME sensor. In this case, utilizing the electrode material with high acoustic impedance and low resistivity can reduce RS and improve the effective electromechanical coupling coefficient of the ME sensor. On the other hand, Equation (16) predicts that the high value can be obtained when the ME sensor possesses a low . Since the dielectric losses R0 of the ME sensor is mainly determined by the dielectric loss of piezoelectric material, it means the smaller dielectric loss results in the larger effective mechanical Quality factor of the ME sensor. Additionally, from Equations (15) and (16), it is found that both at resonance frequency and at antiresonance frequency decrease with the increasing mechanical loss Rm. Hence, the mechanical loss Rm plays a primary role in the energy dissipations of the ME sensor.
Subsequently, the
Qs,
Qp and corresponding loss as a function of
Hdc are experimentally investigated to verify and further understand the above theoretical analysis. It is known that
Rm depends on the mechanical energy dissipation
of the ME sensor [
28], while
Qs is inversely proportional to
[
29]. When the DC magnetic field is applied, the mechanical energy dissipation
Rs +
Rm of magnetostrictive material FeSiB changes dramatically owing to the non-
domain wall motions. This results in the varied mechanical quality factor
Qs of the ME sensor with
Hdc, as shown in
Figure 7a. Specifically, the quality factor (
Qs) at the series resonance frequency
decreases from 182 to the minimum value of 160 at the
Hdc = 200 Oe and then gradually increases according to the MBVD model. Obviously, the variation in
Qs is mainly attributed to the magnetic mechanical loss associated with magnetic domain wall movement and material damping of FeSiB.
Furthermore, the trends of
and
R0 +
Rm as a function of
Hdc are similar to that of
and
Rs +
Rm, as shown in
Figure 7b. However, the magnitude of antiresonance mechanical quality factor
ranges from 234 to 245.6, which is higher than the resonance mechanical quality factor
Qs. The differences between
and
were also reported by in previous literature [
30,
31]. Finally, the resonance frequency
fs and antiresonance frequency
fa of ME laminated sensor as a function of varied
Hdc are investigated, as shown in
Figure 8. Both
fs and
fa exhibit similar trends with
Hdc, which increases with the increasing DC bias field. The obvious shifts of resonance frequency
fs and antiresonance frequency
fa with
Hdc indicate that
fs and
fa of the ME sensor are adjustable by varying the DC bias magnetic field.


