
Influence of Salt Support Structures on Material Jetted Aluminum Parts

 , , and
Abstract
:1. Introduction
- Visual signs of corrosion at the aluminum–salt interface, especially where aluminum has come into contact with molten salt.
- Change in the surface structure due to remelting of the aluminum alloy in areas with molten salt contact.
- Salt residues on the aluminum surface after support removal and cleaning the surface.
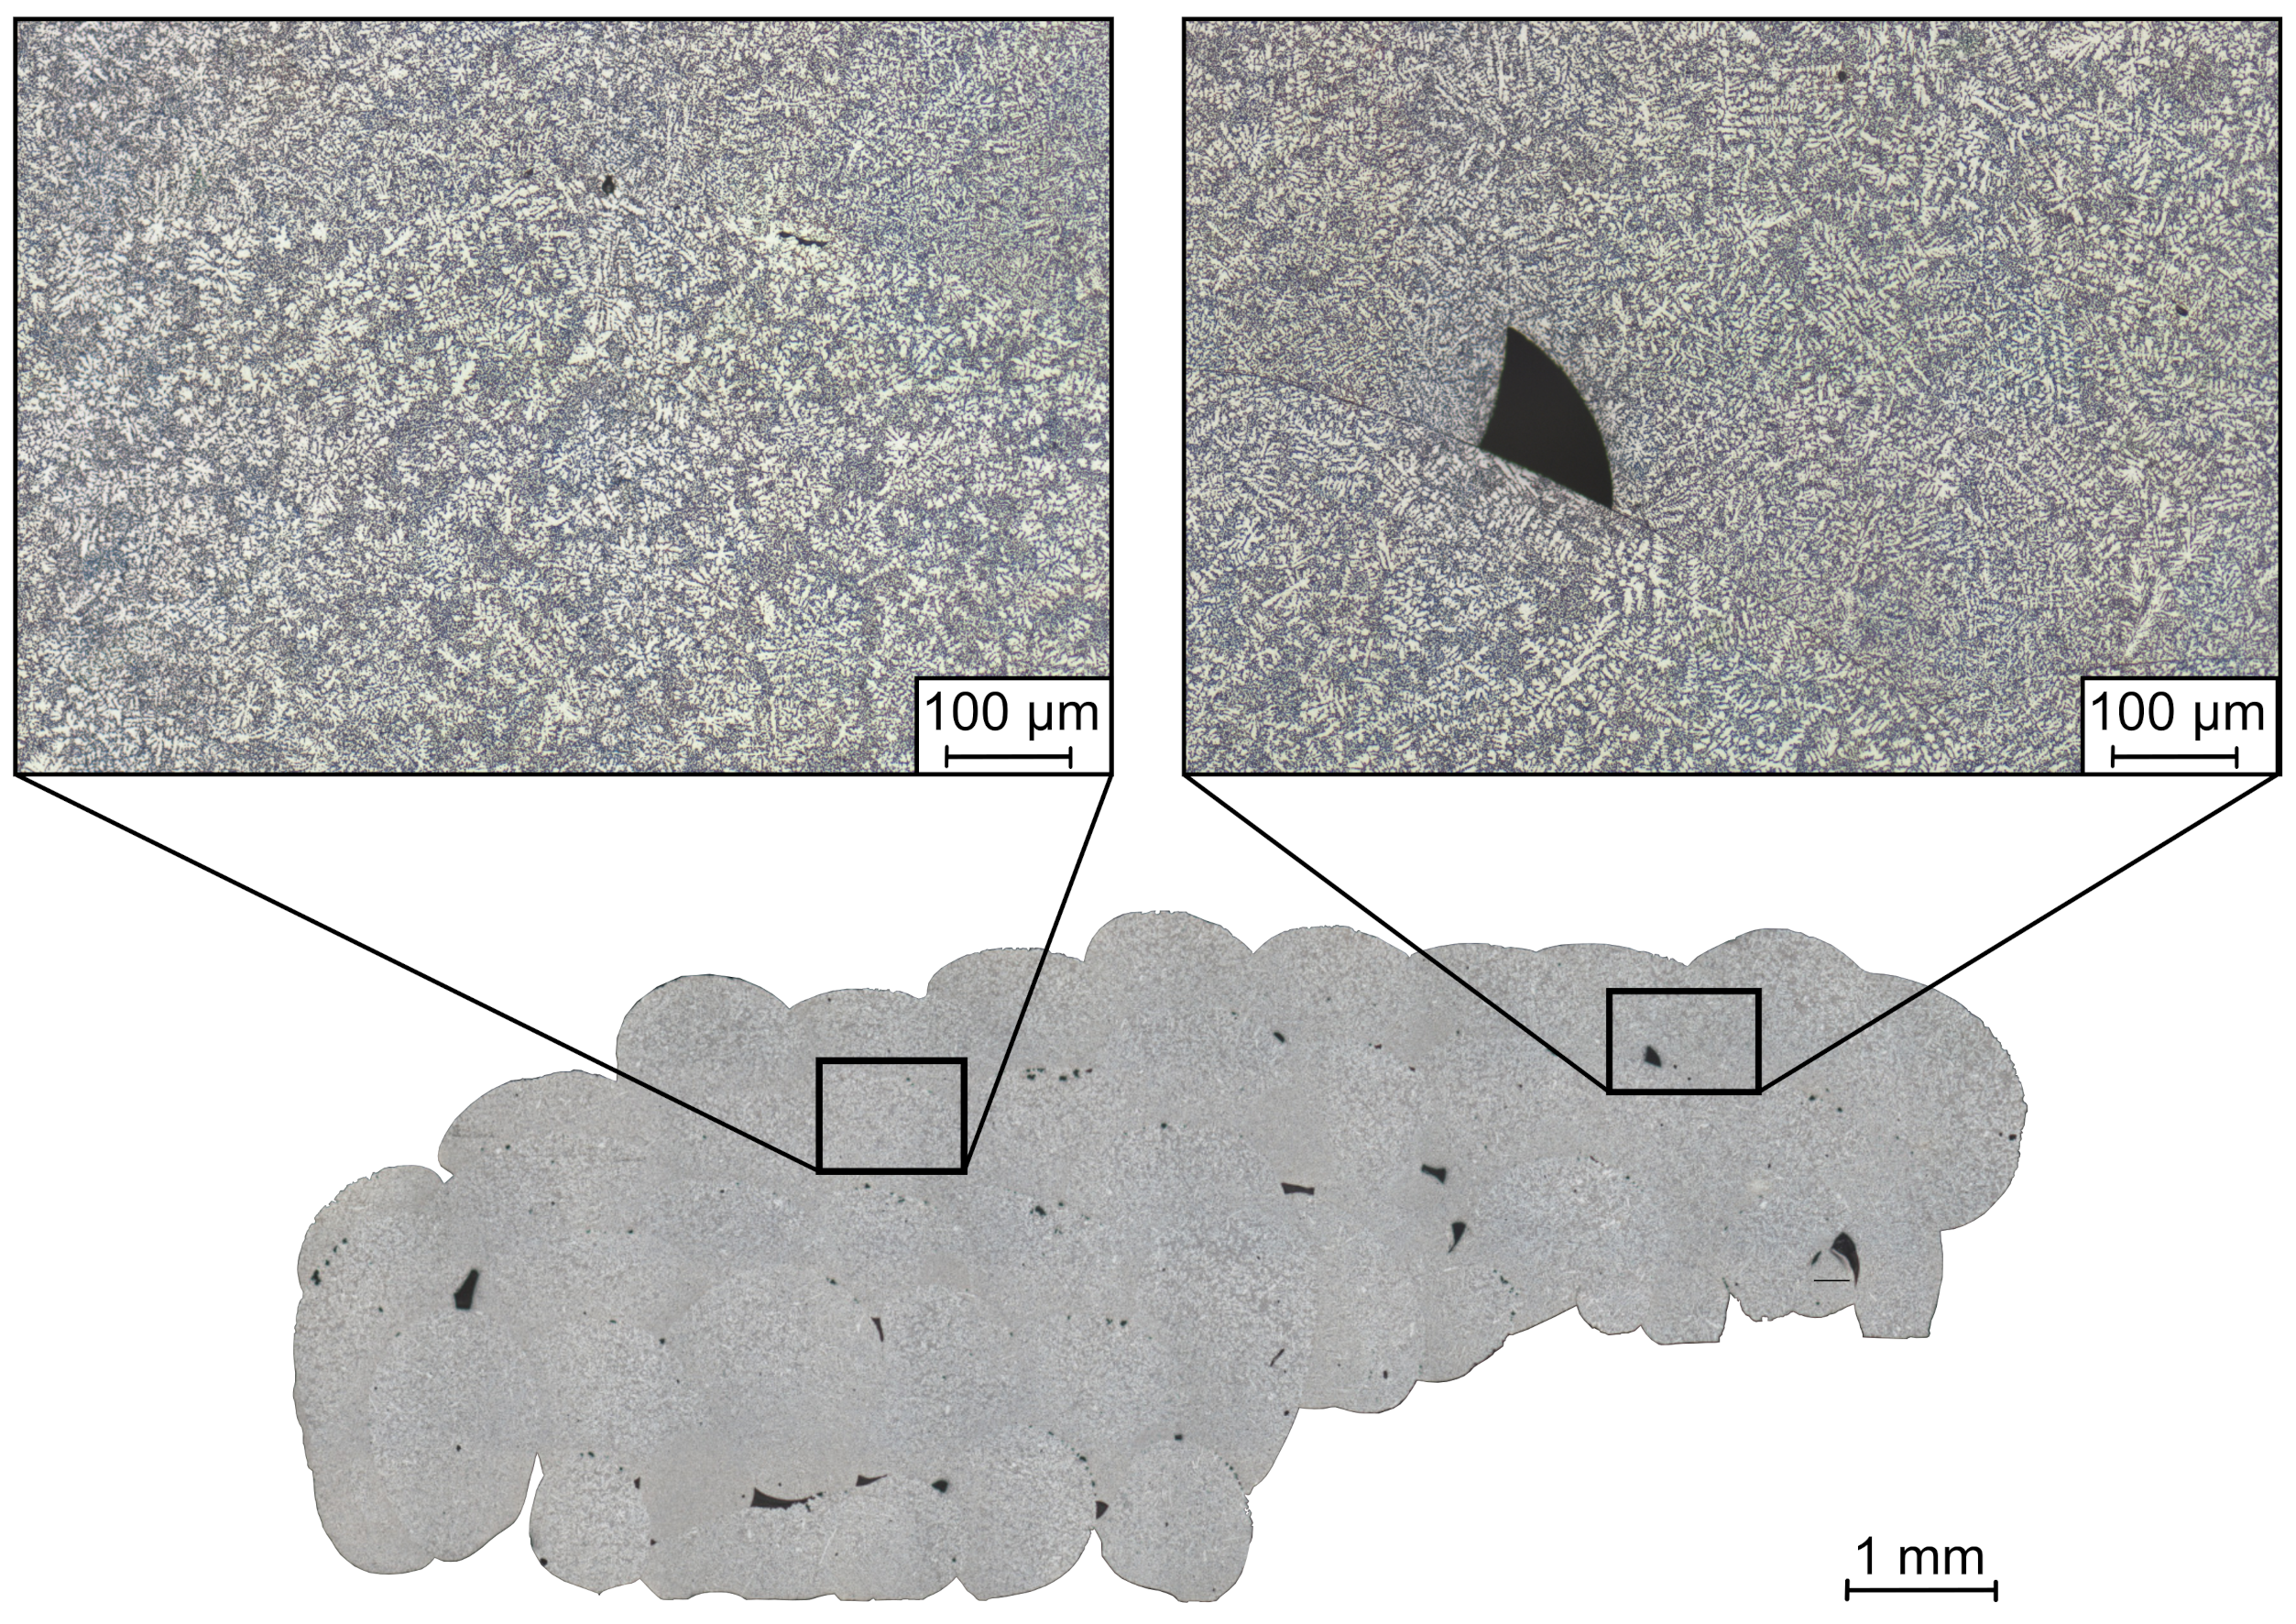
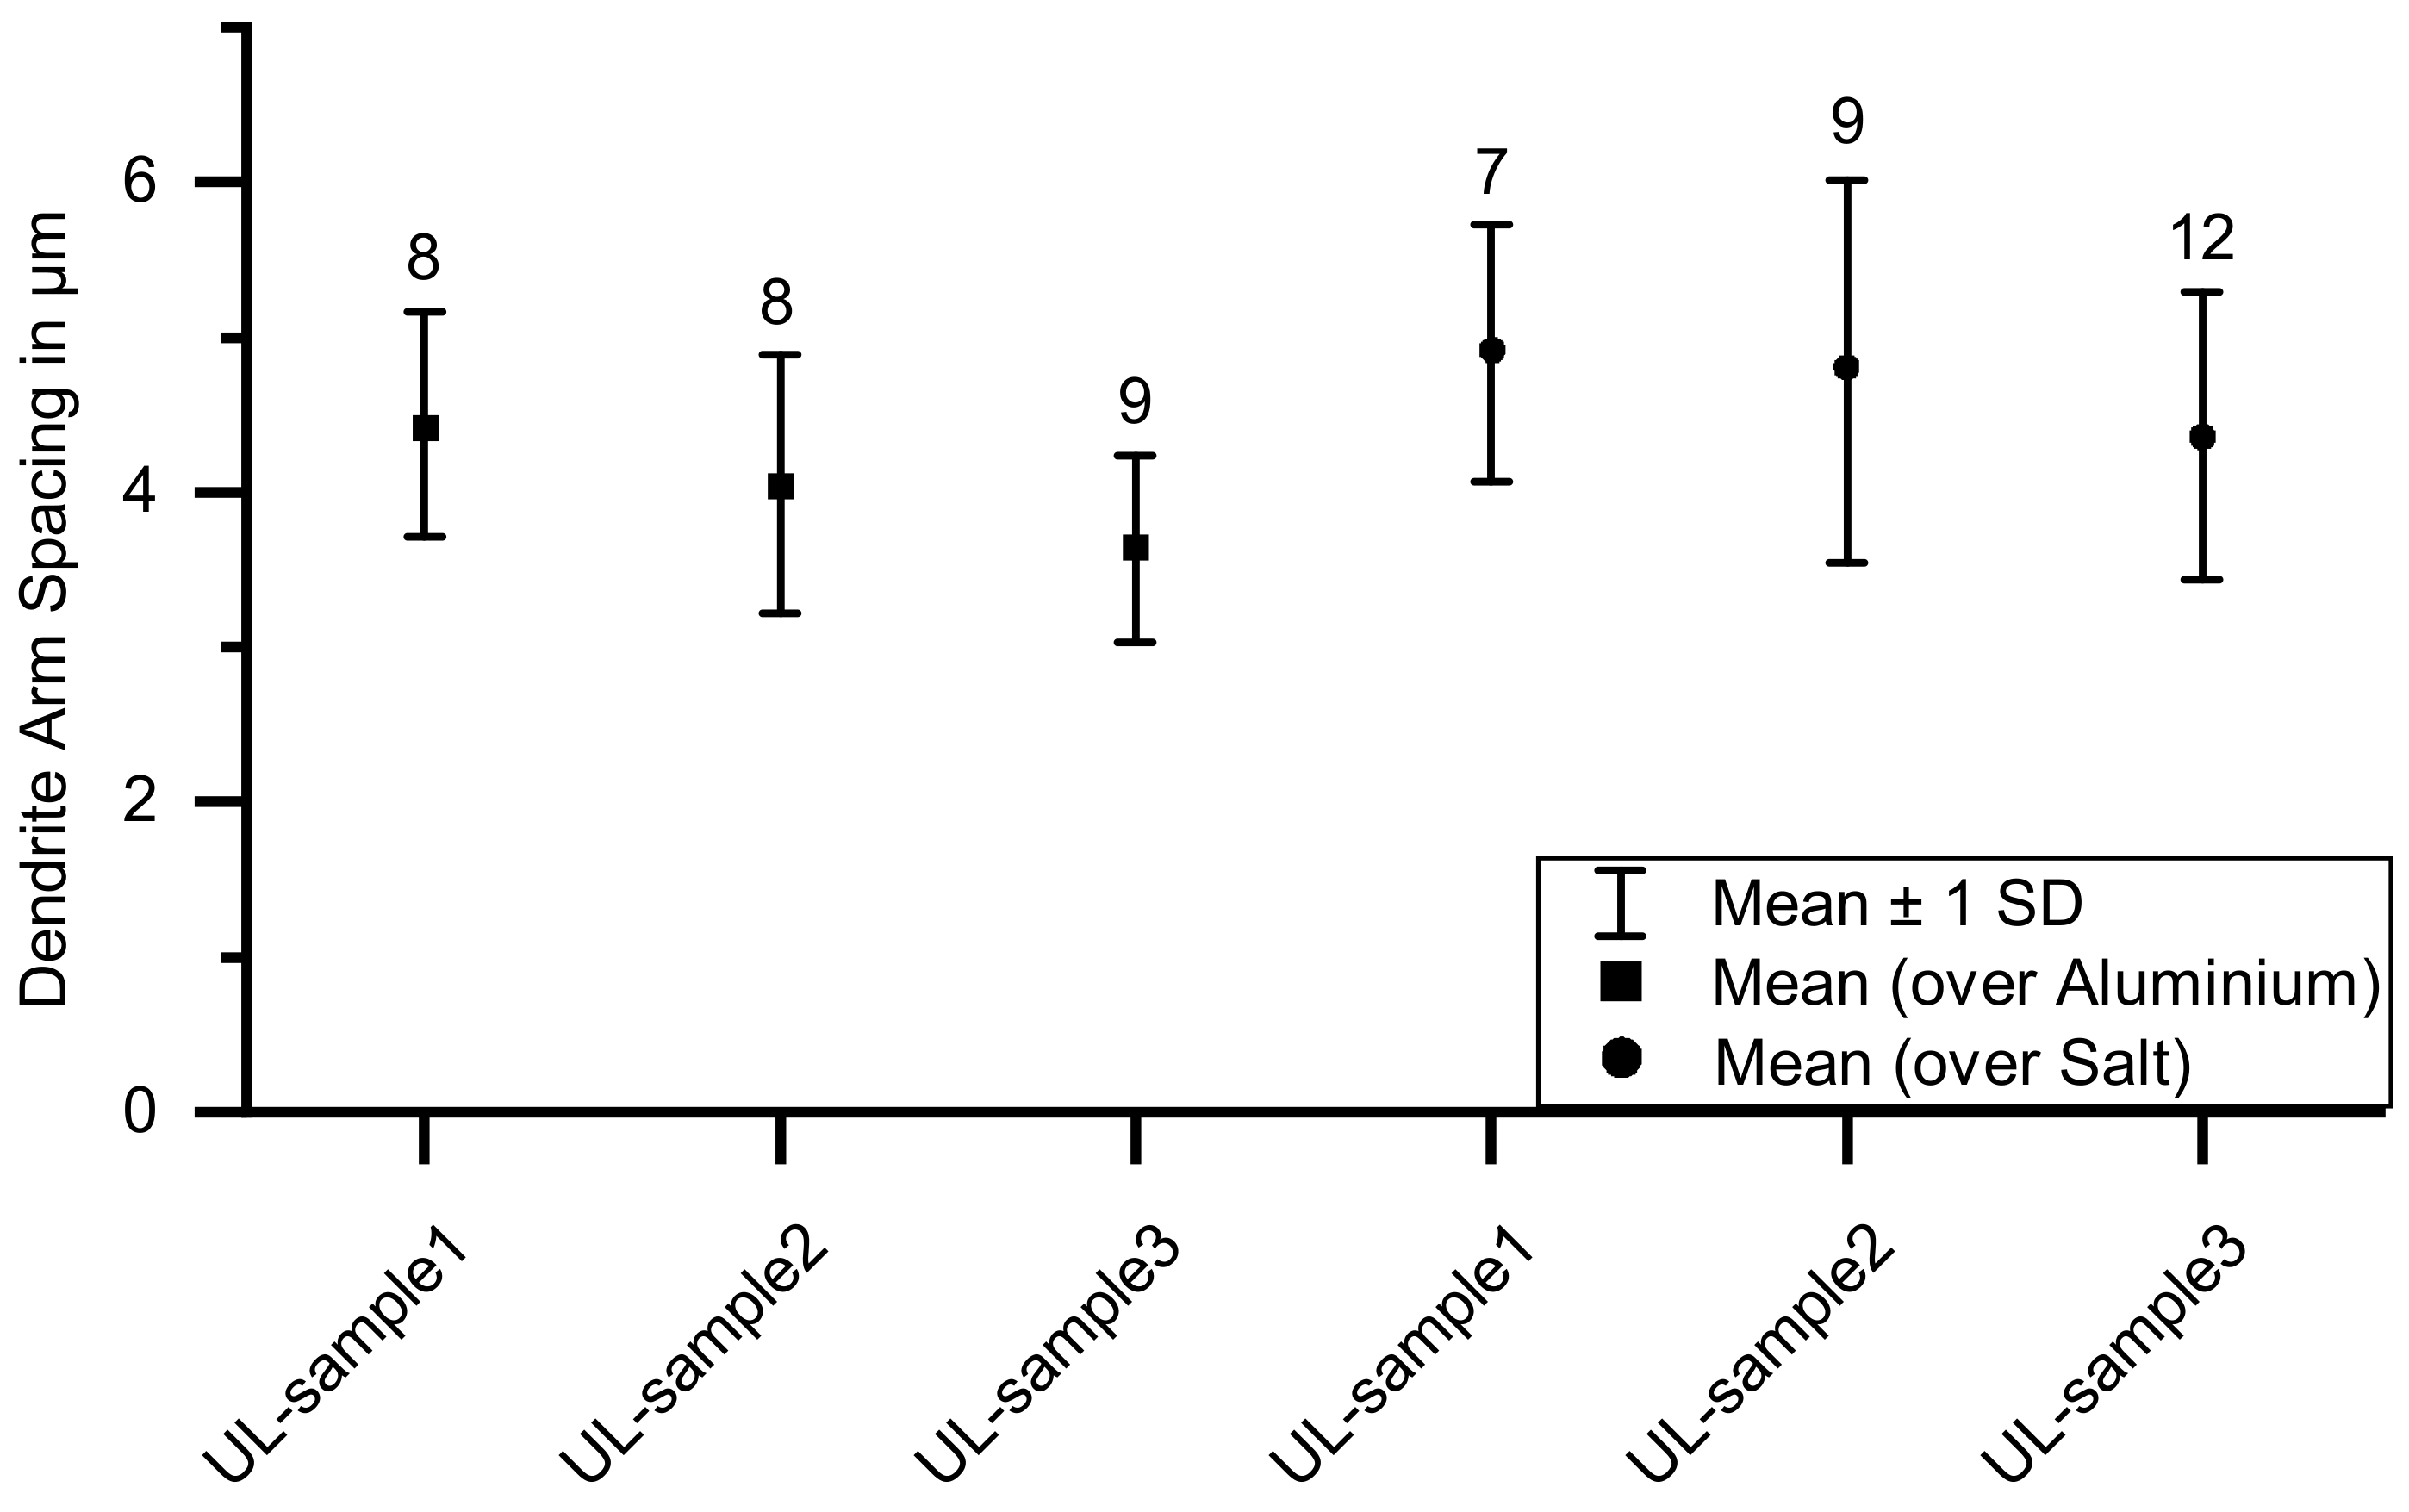
- Larger dendrite arm spacing due to a slower solidification of aluminum on top of the support structure compared to the rest of the sample.
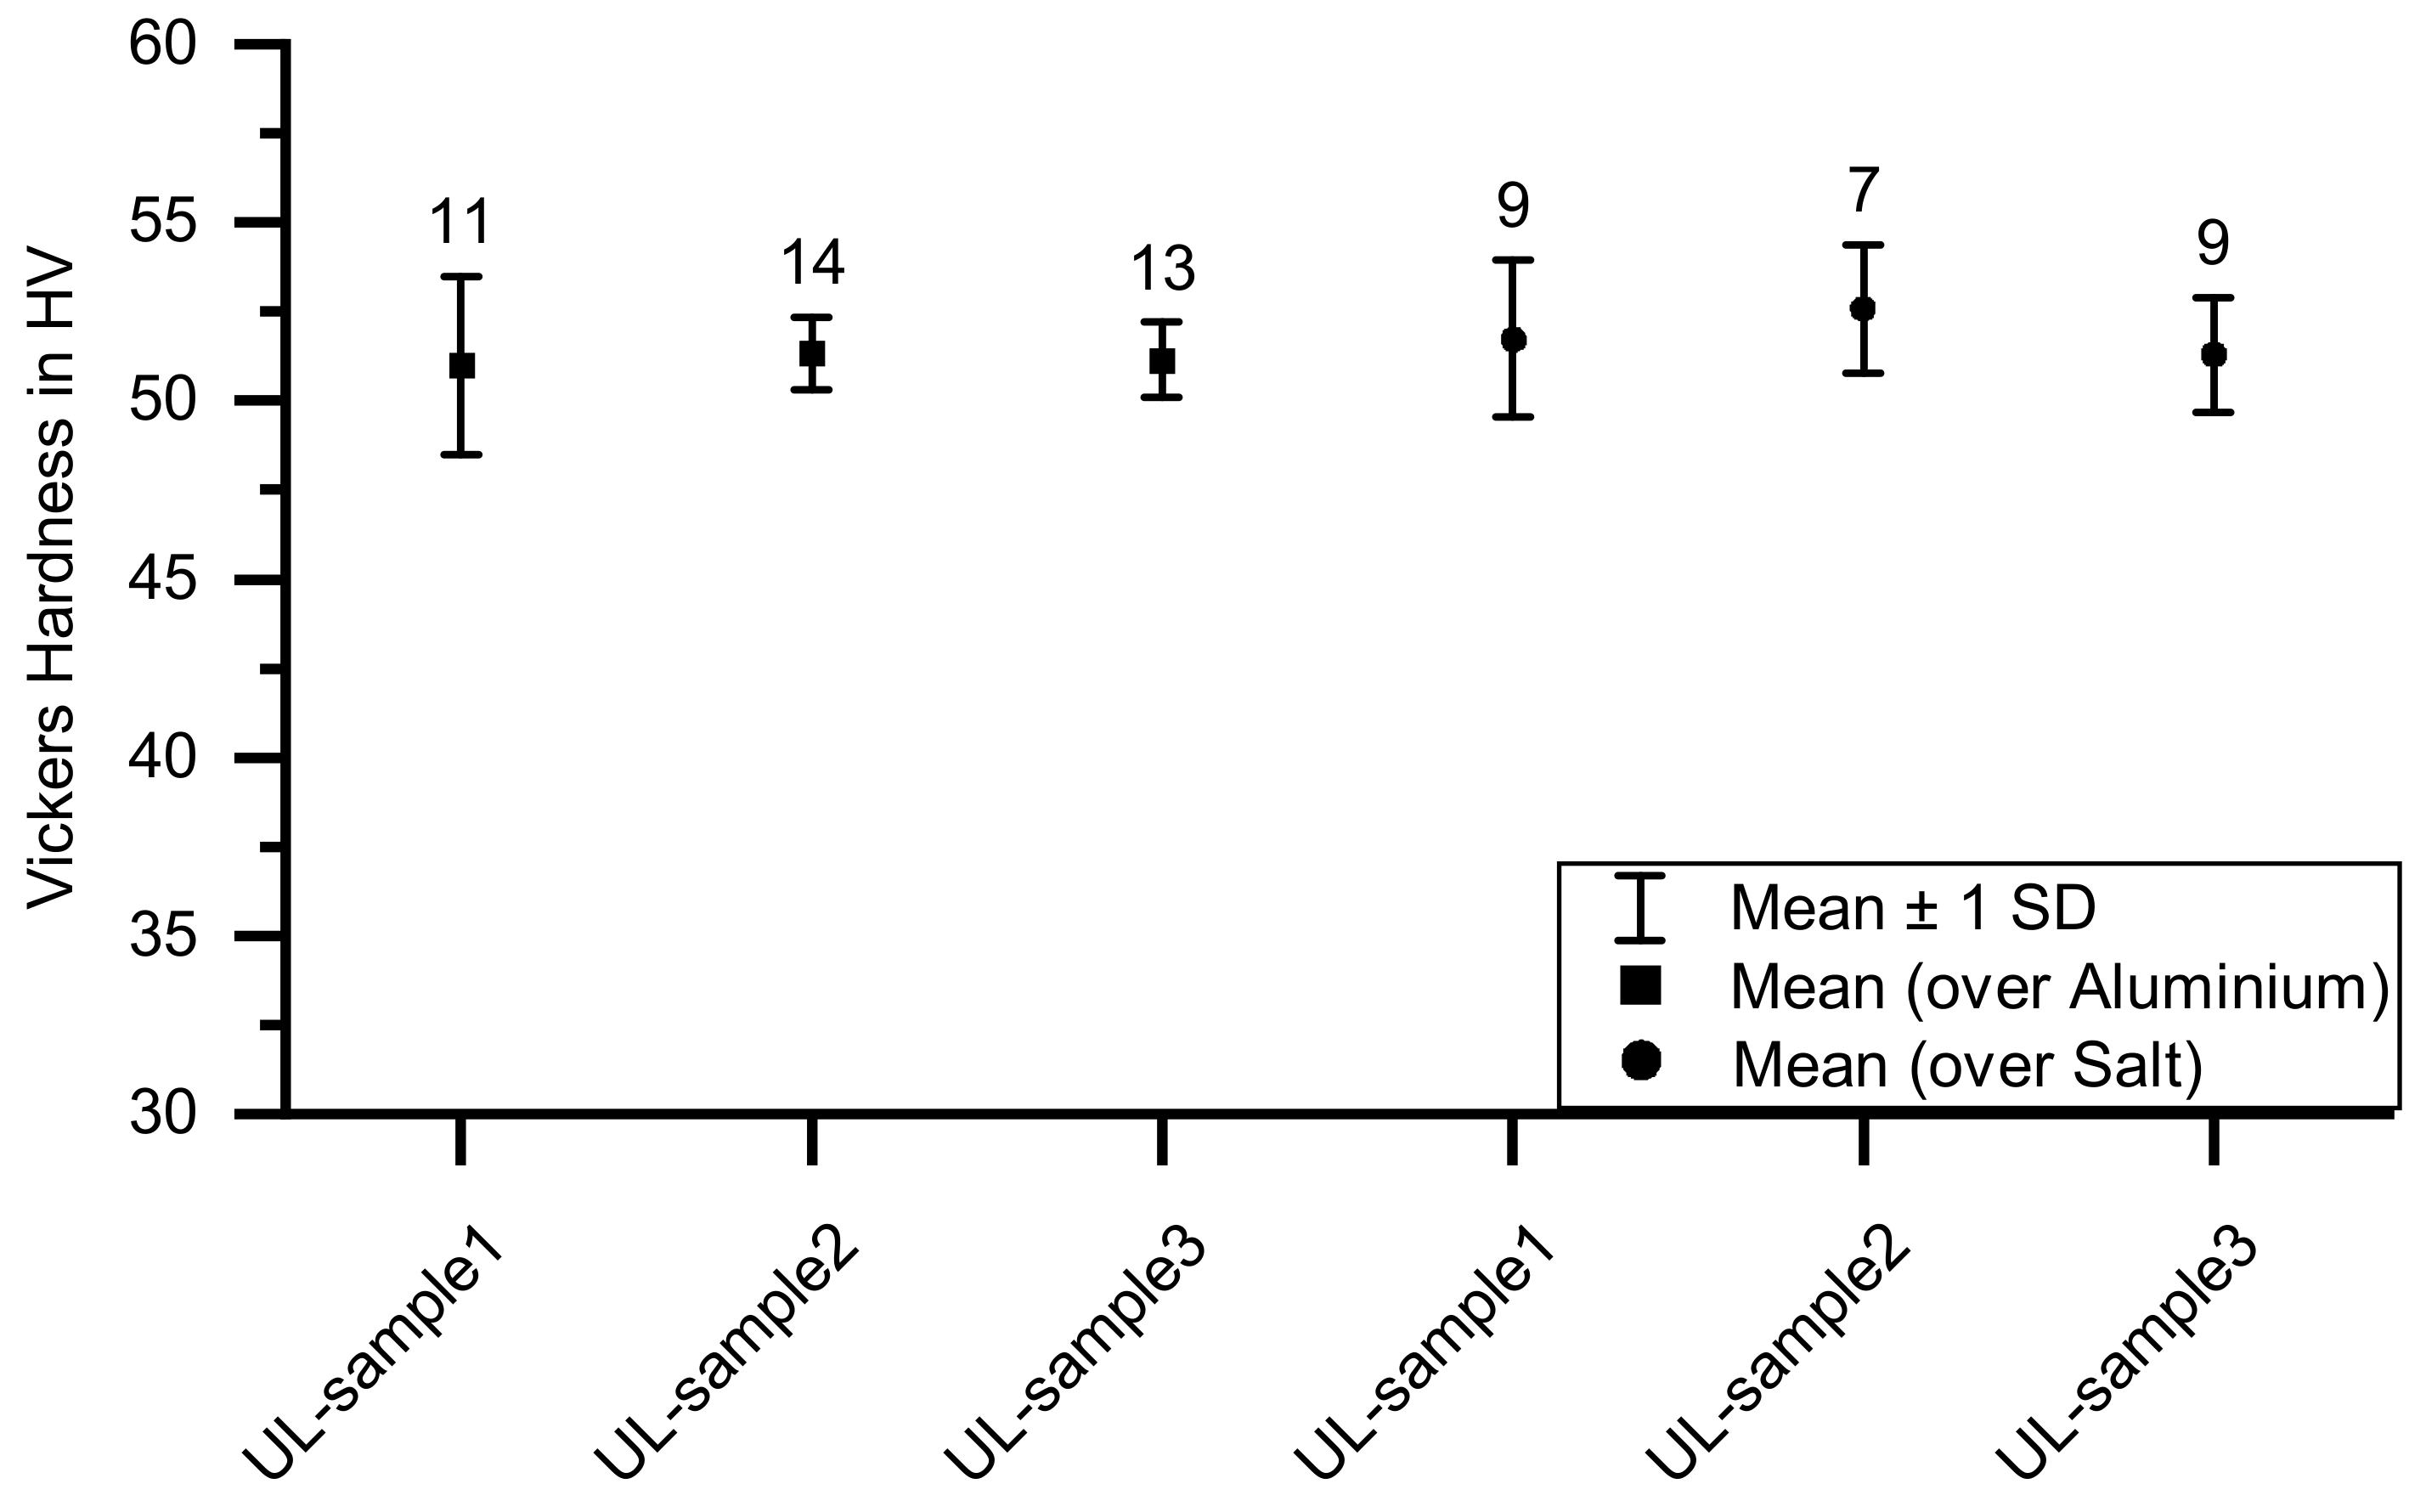
- Lower micro-hardness in areas where it was printed on salt because of the low thermal conductivity of salt and consequently slow solidification.
2. Materials and Methods
2.1. Sample Description
2.1.1. Build and Support Material
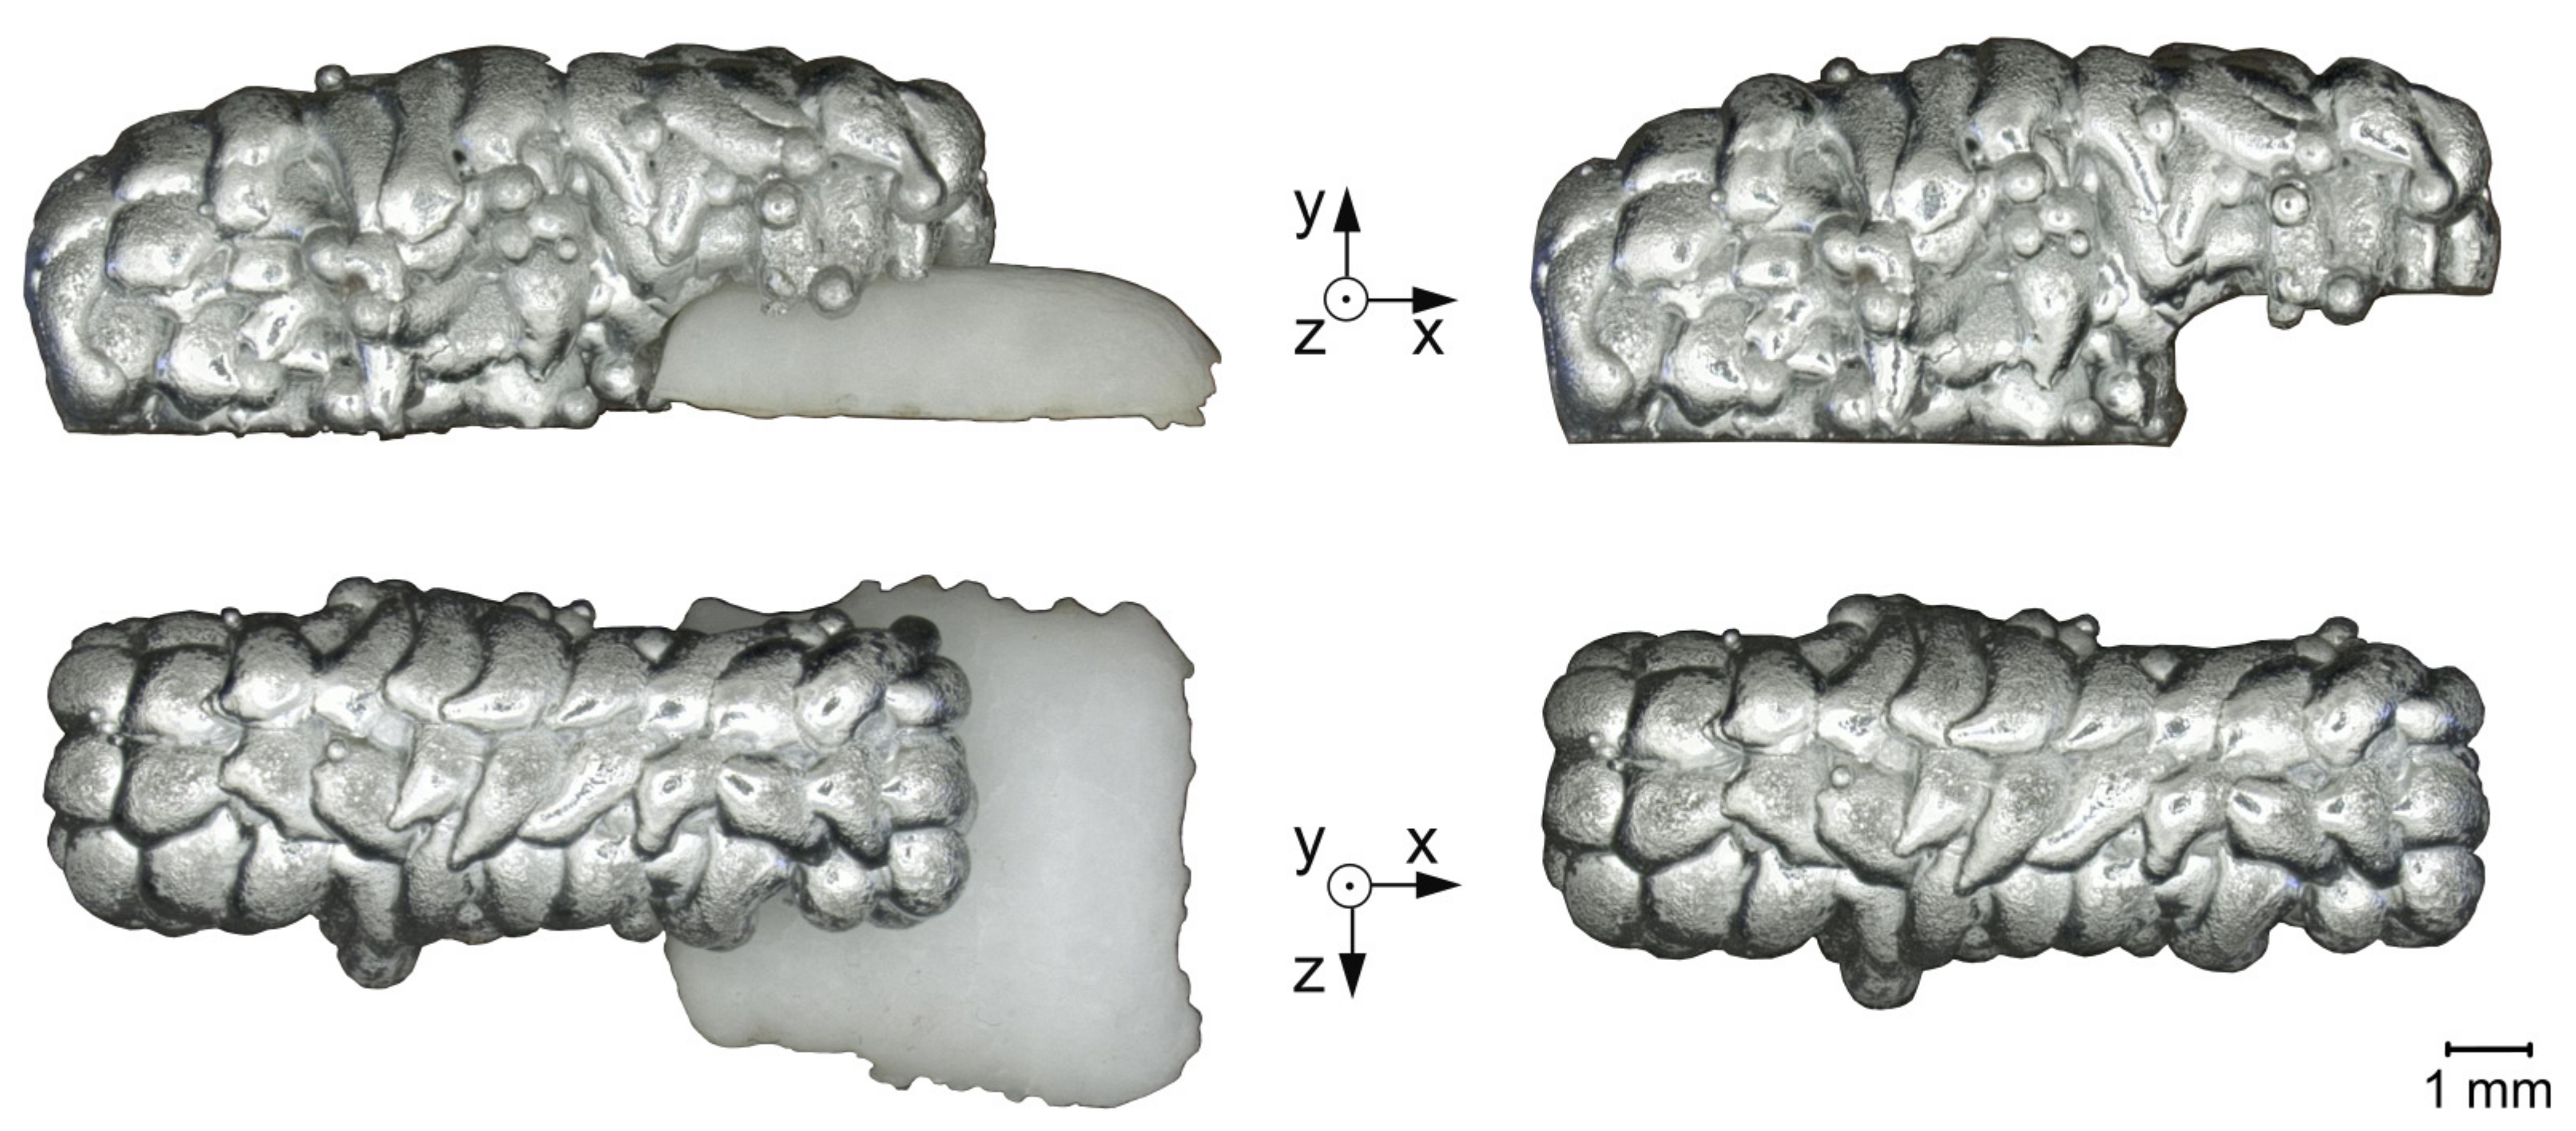
2.1.2. Geometries
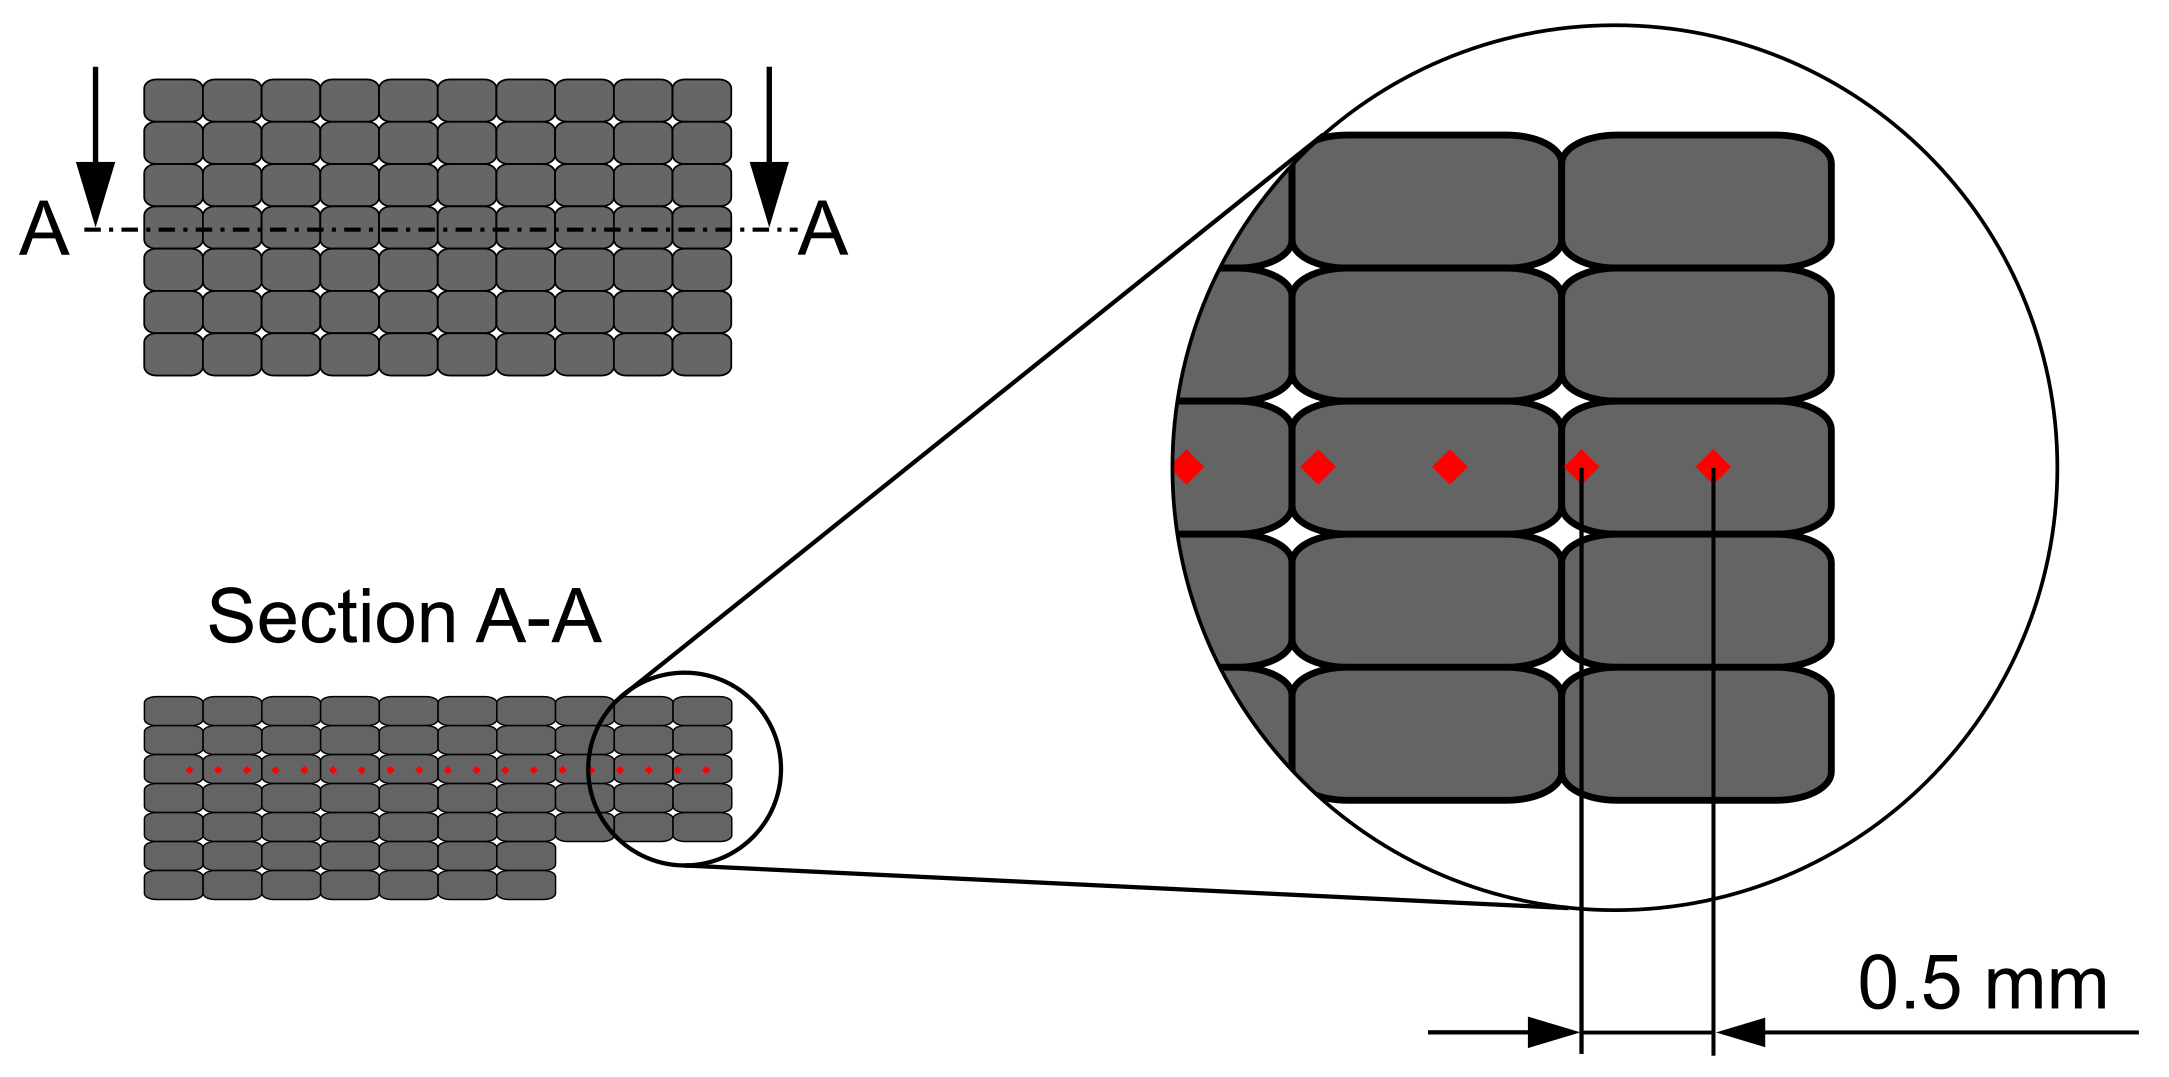
2.1.3. Sample Preparation
2.2. Experimental Setup
2.3. Experimental Procedure
2.3.1. Optical Microscopy
2.3.2. Energy-Dispersive X-ray Spectroscopy
2.3.3. Confocal Laser Scanning Microscopy
2.3.4. Micro-Hardness Testing
3. Results and Discussion
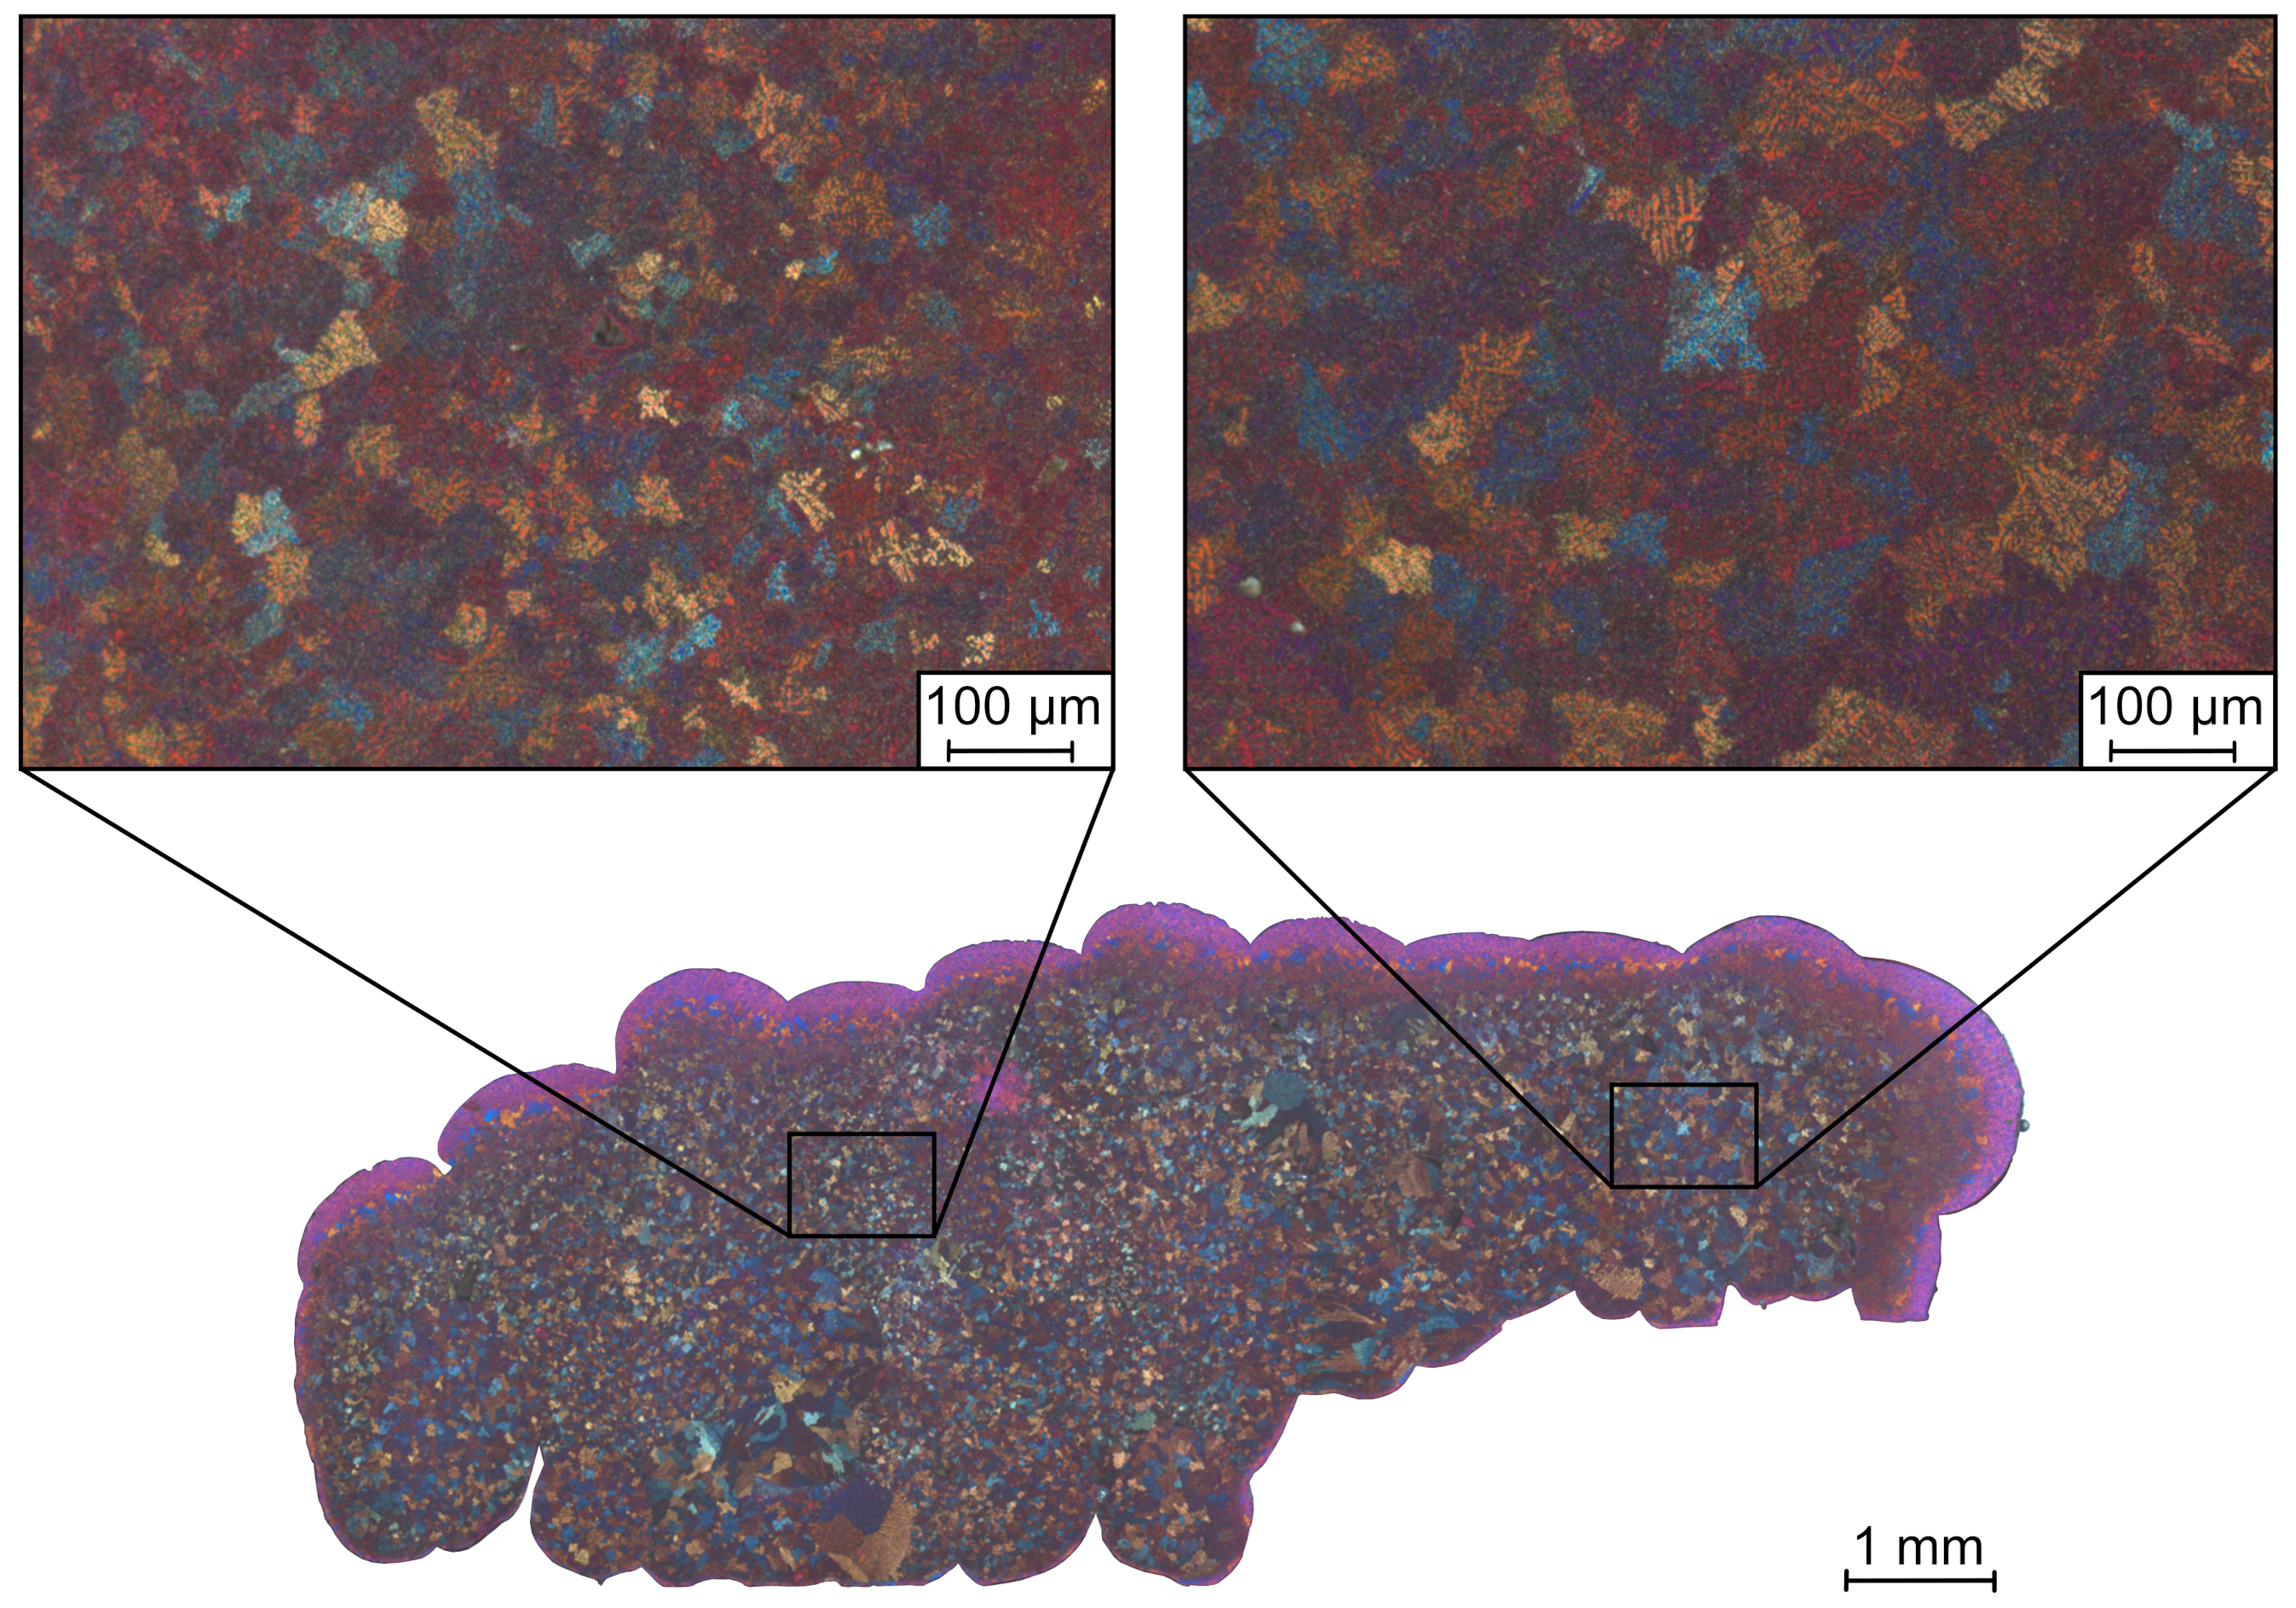
3.1. Optical Microscopy
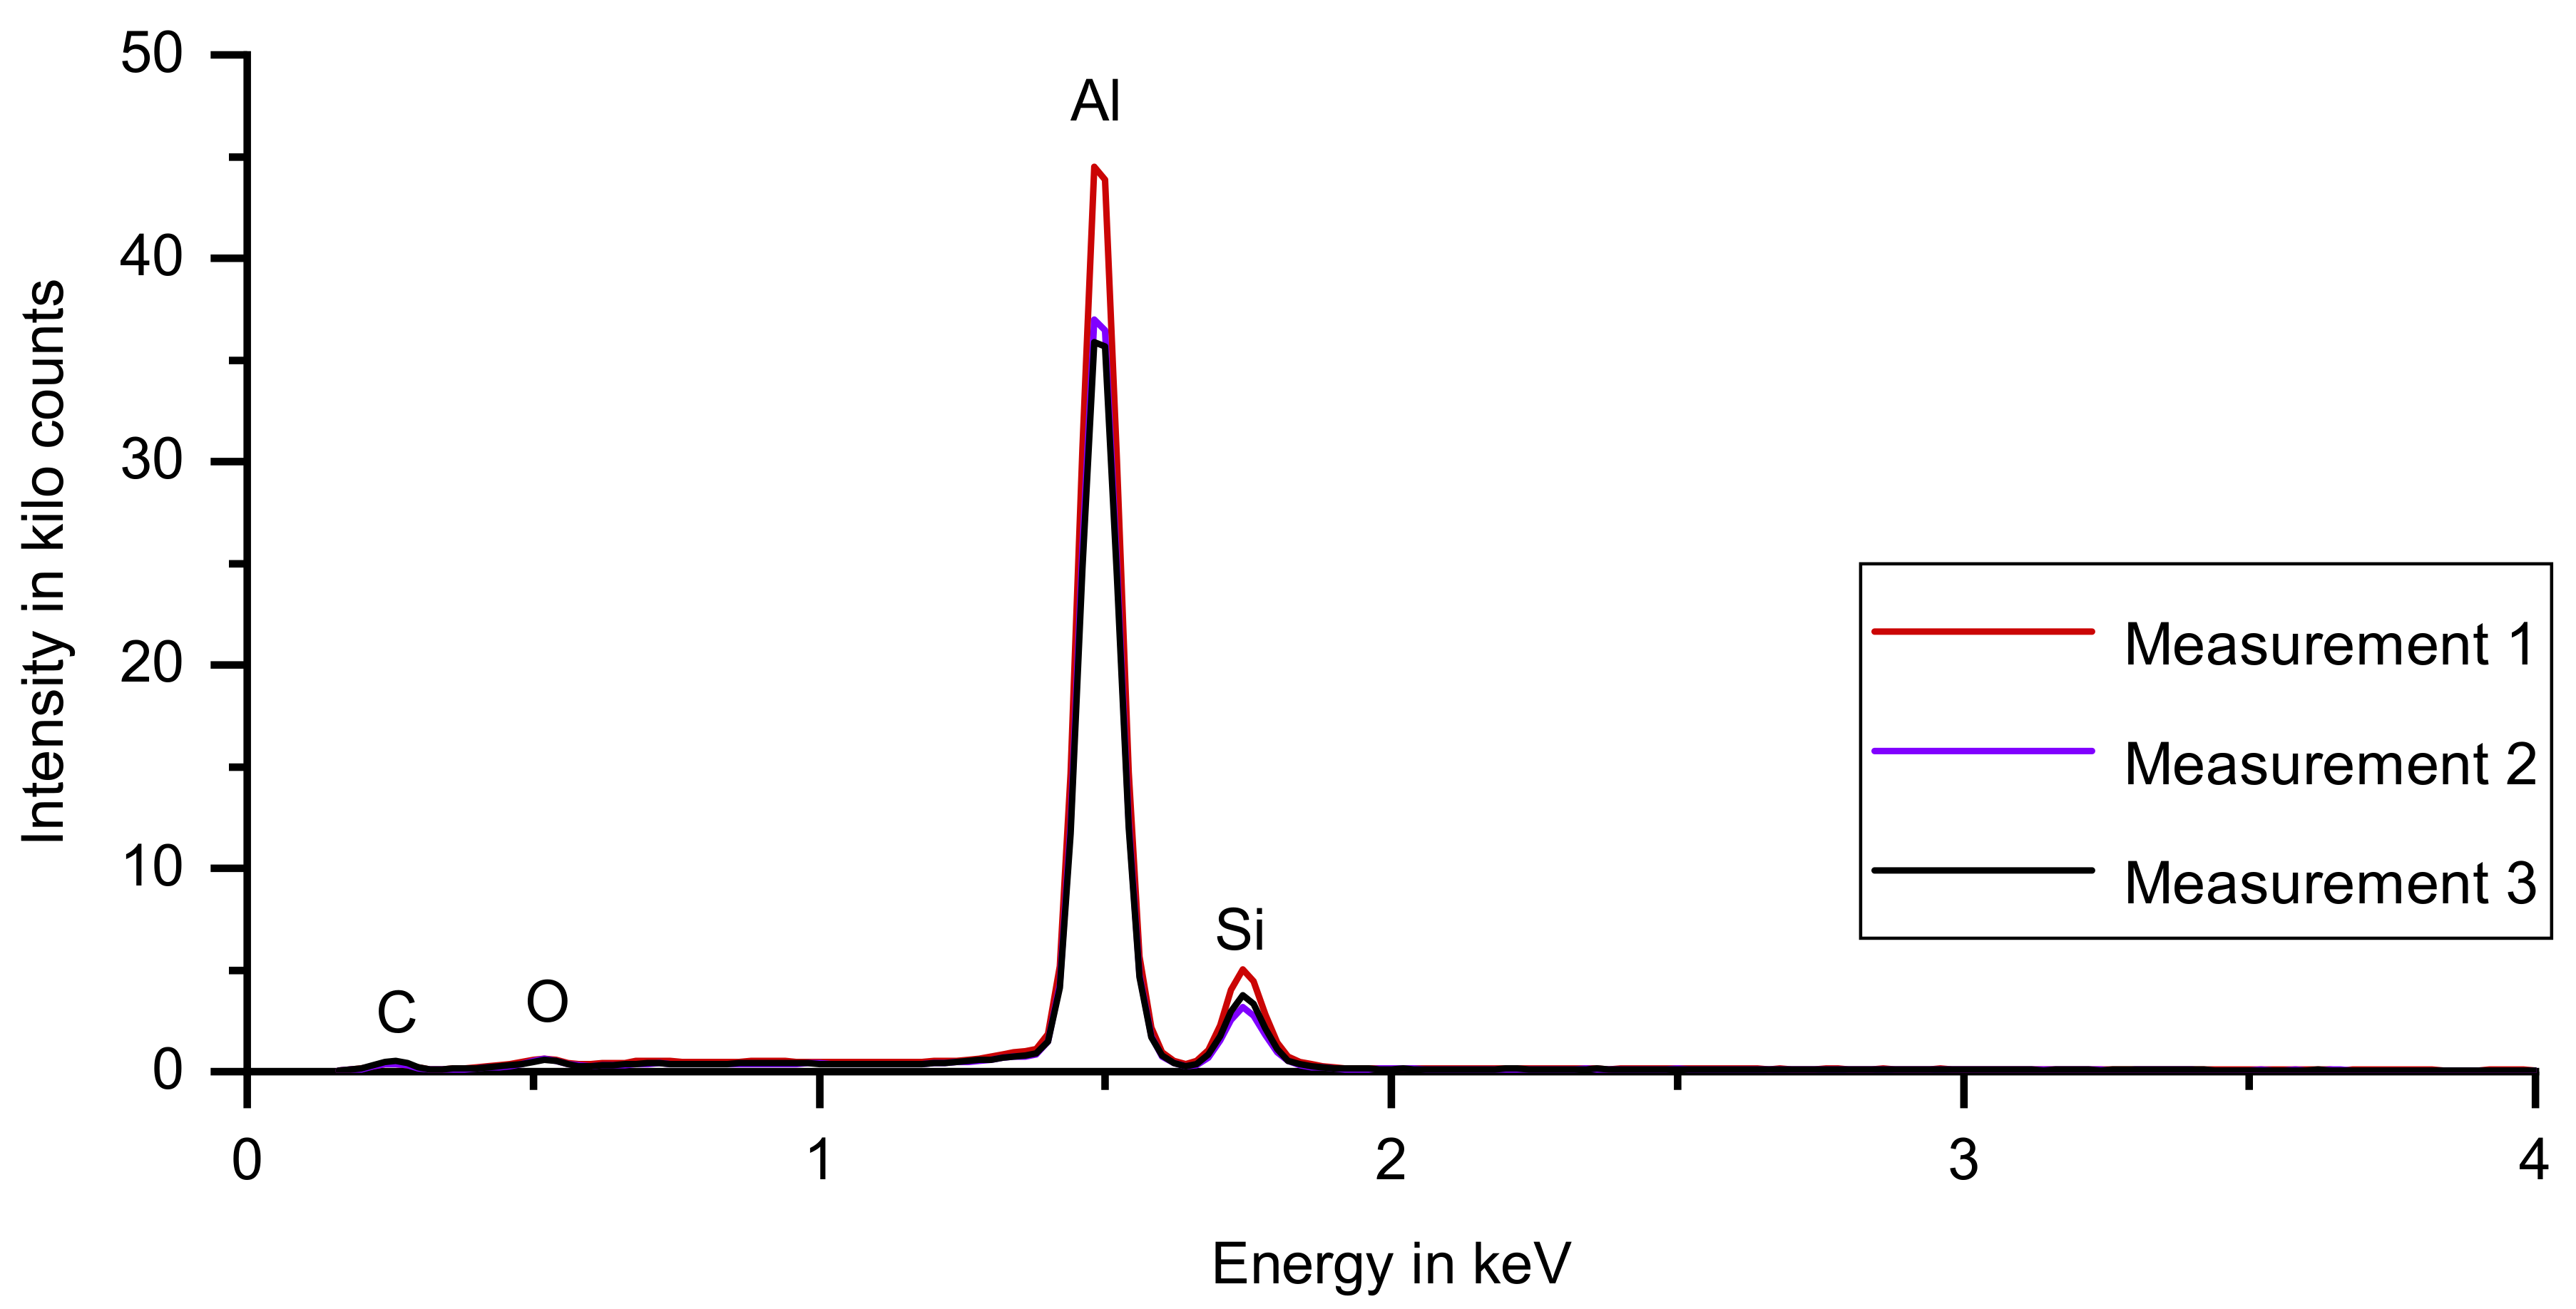
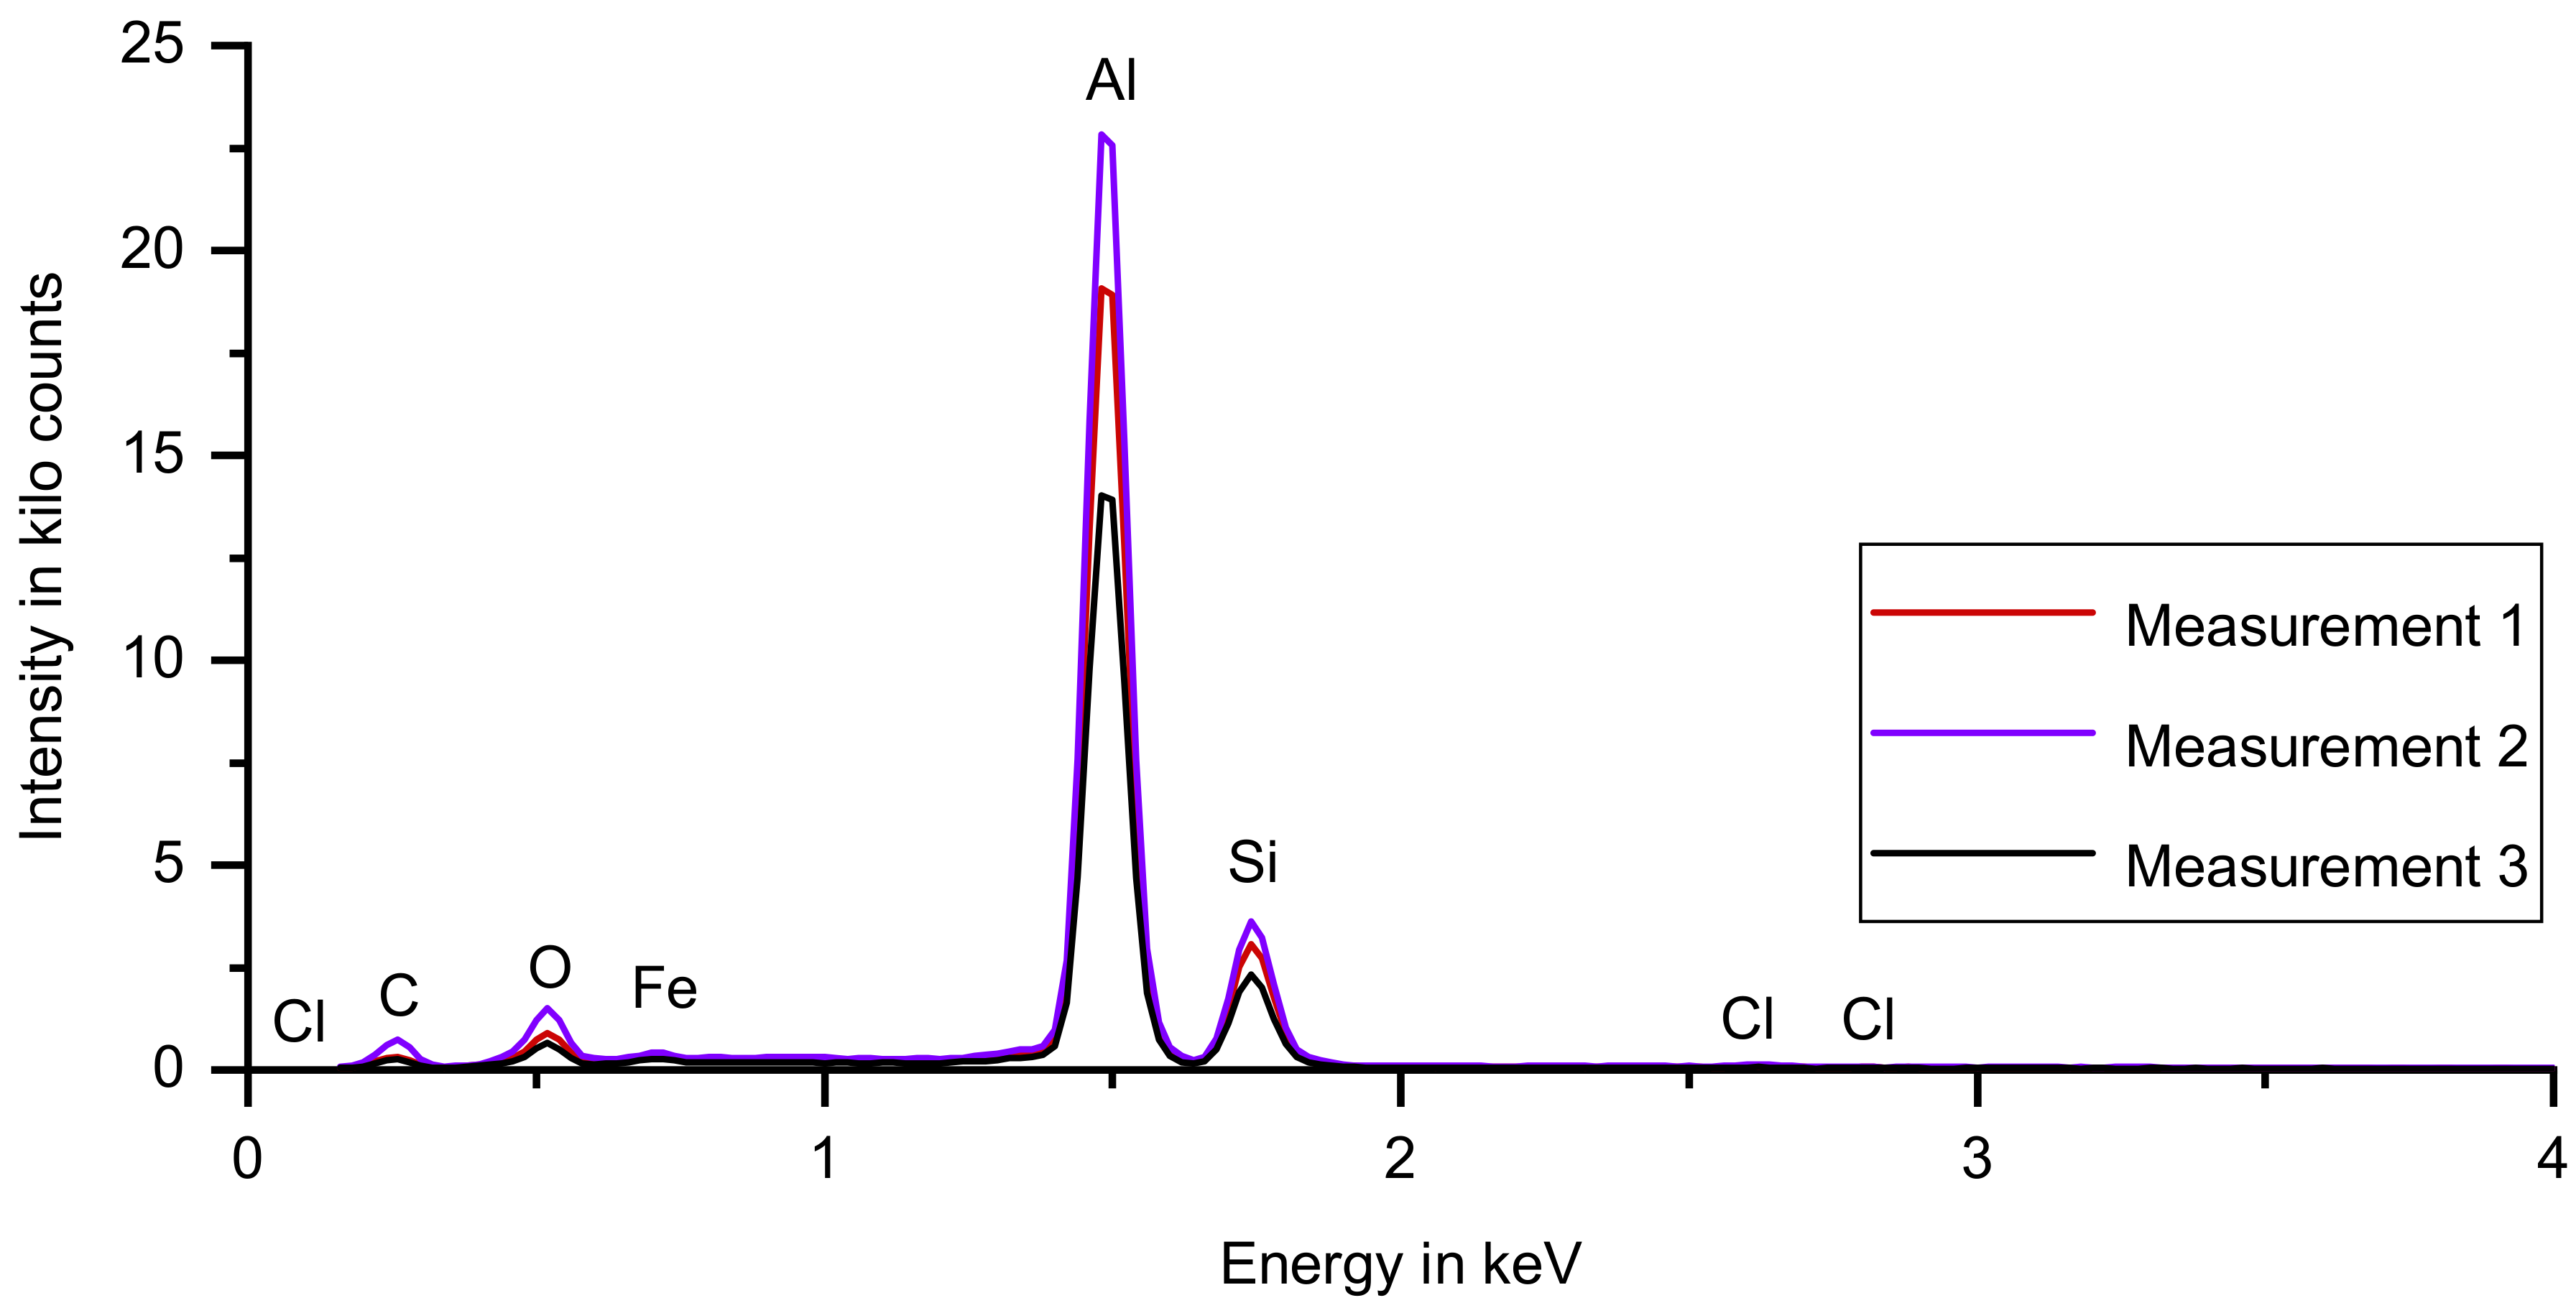
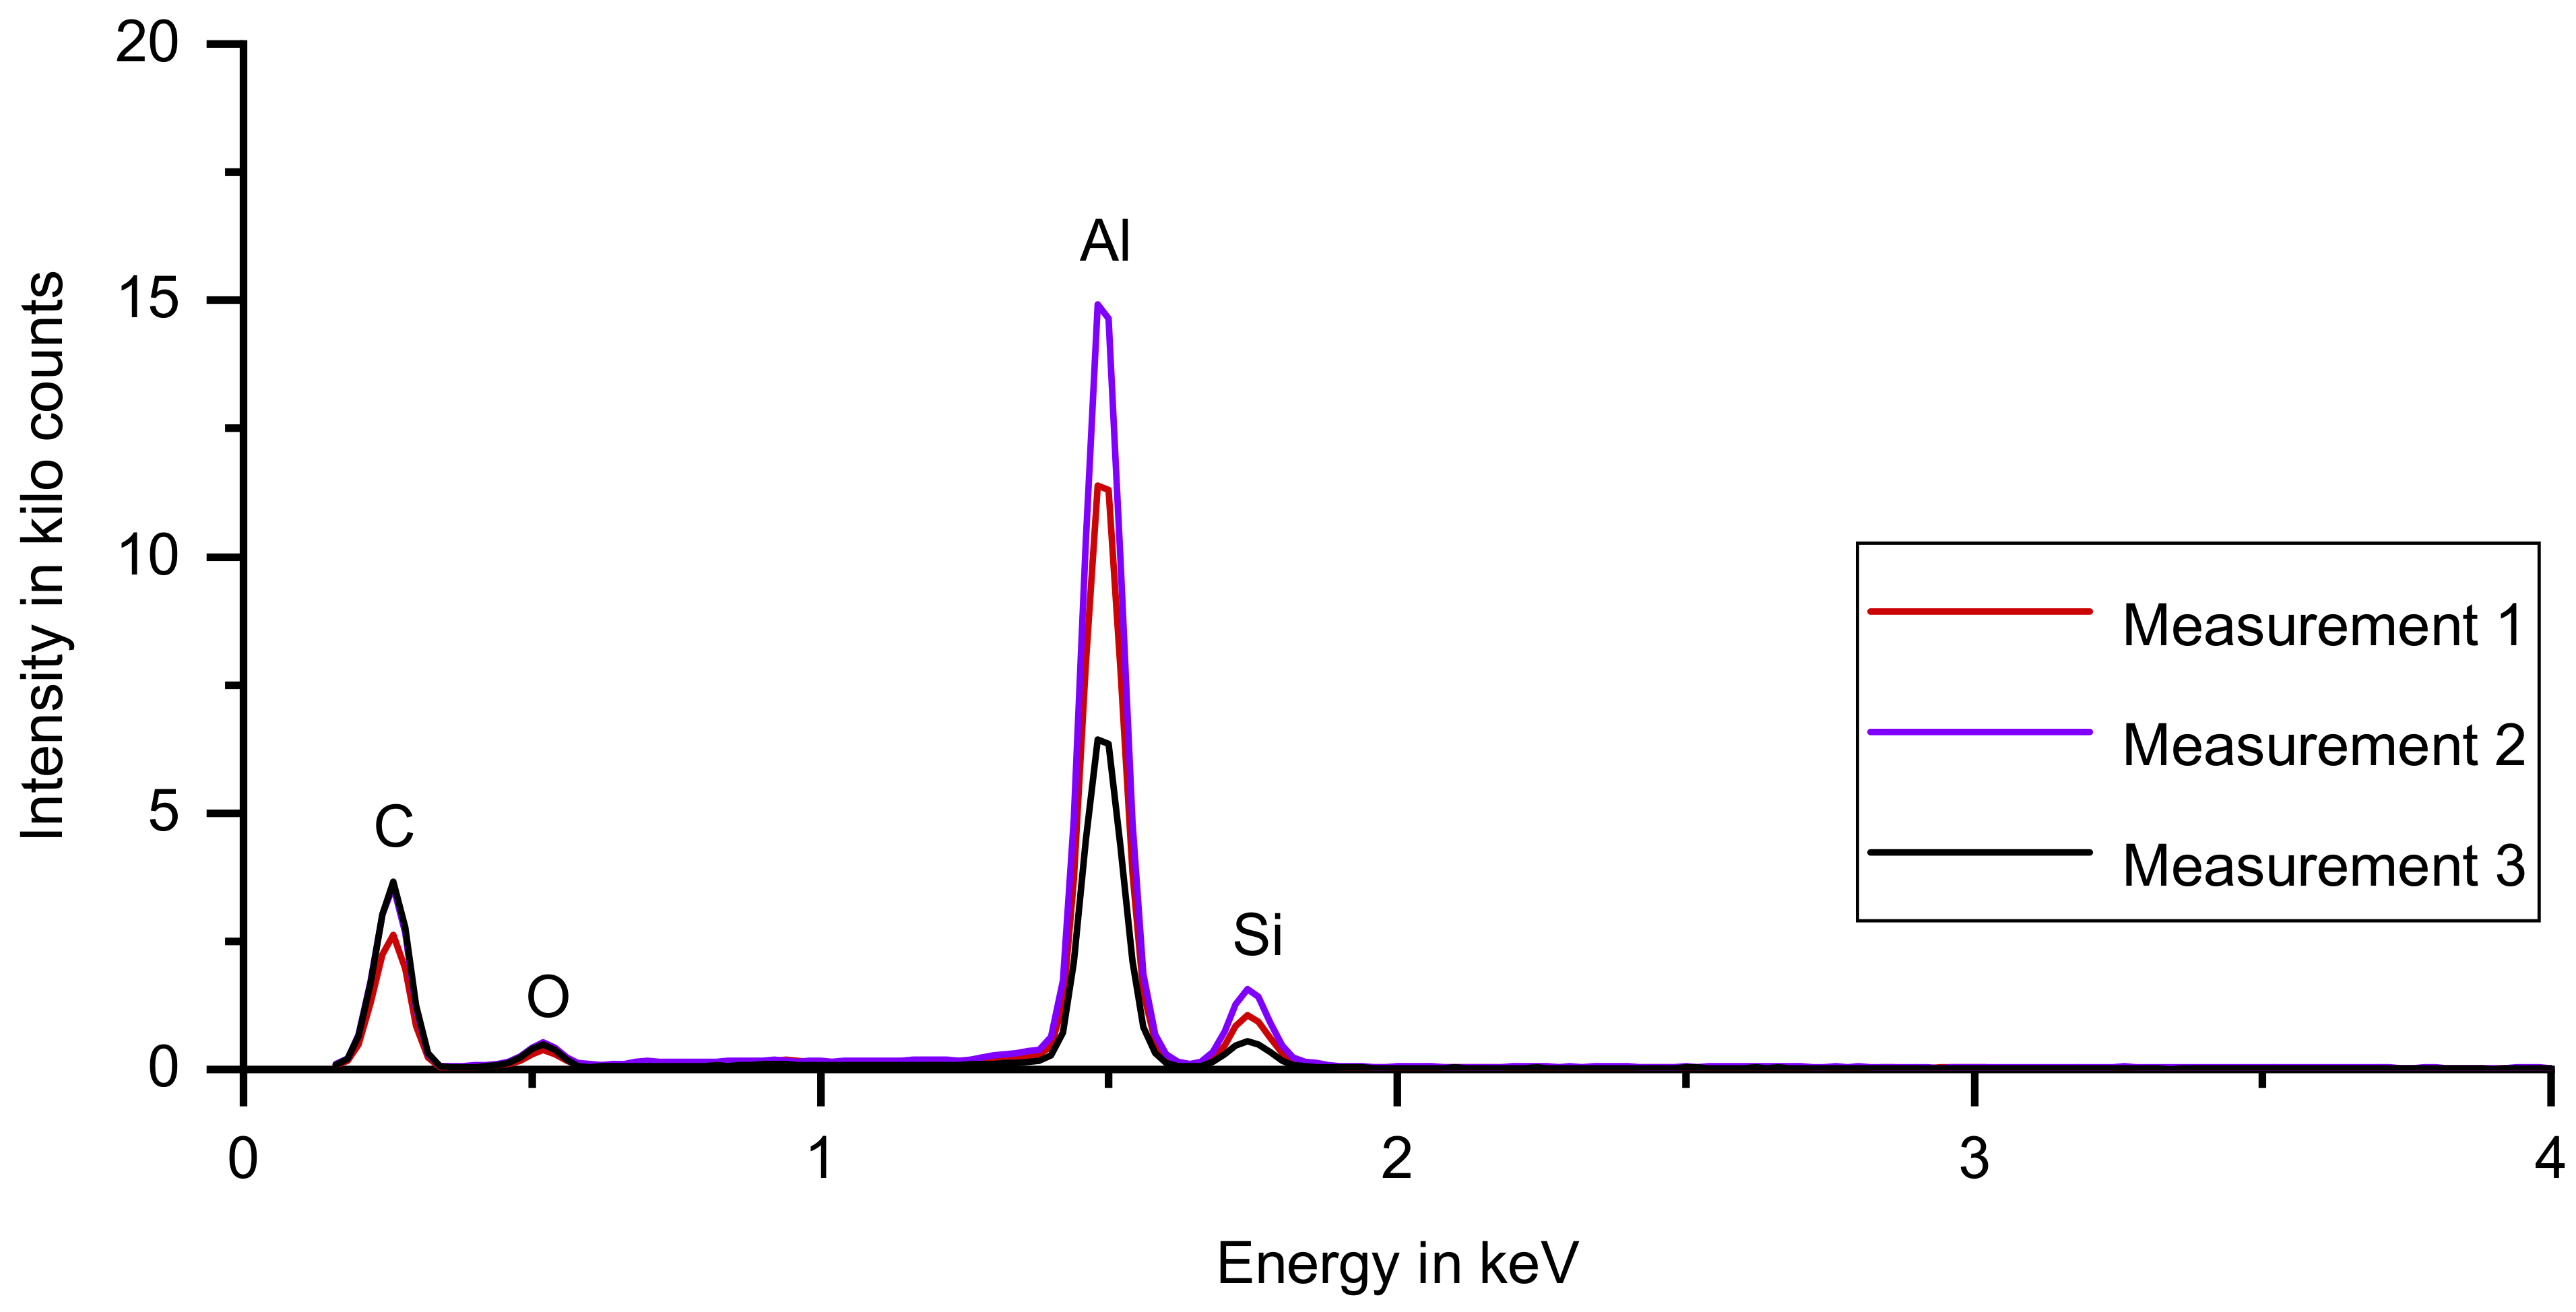
3.2. Energy-Dispersive X-Ray Spectroscopy
3.3. Confocal Laser Scanning Microscopy
3.4. Micro-Hardness Testing
4. Conclusions
Author Contributions
Funding
Institutional Review Board Statement
Informed Consent Statement
Data Availability Statement
Acknowledgments
Conflicts of Interest
Abbreviations
| 3D | Three-dimensional |
| Al | Aluminum |
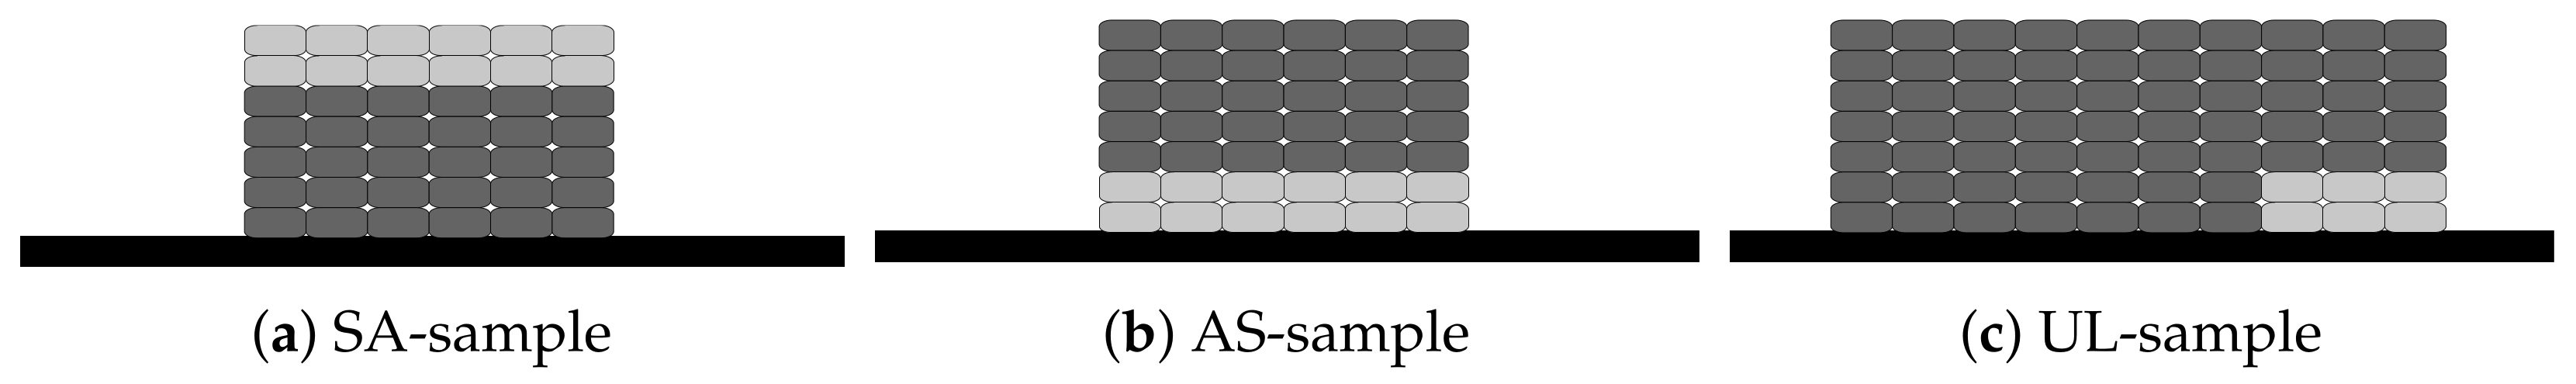
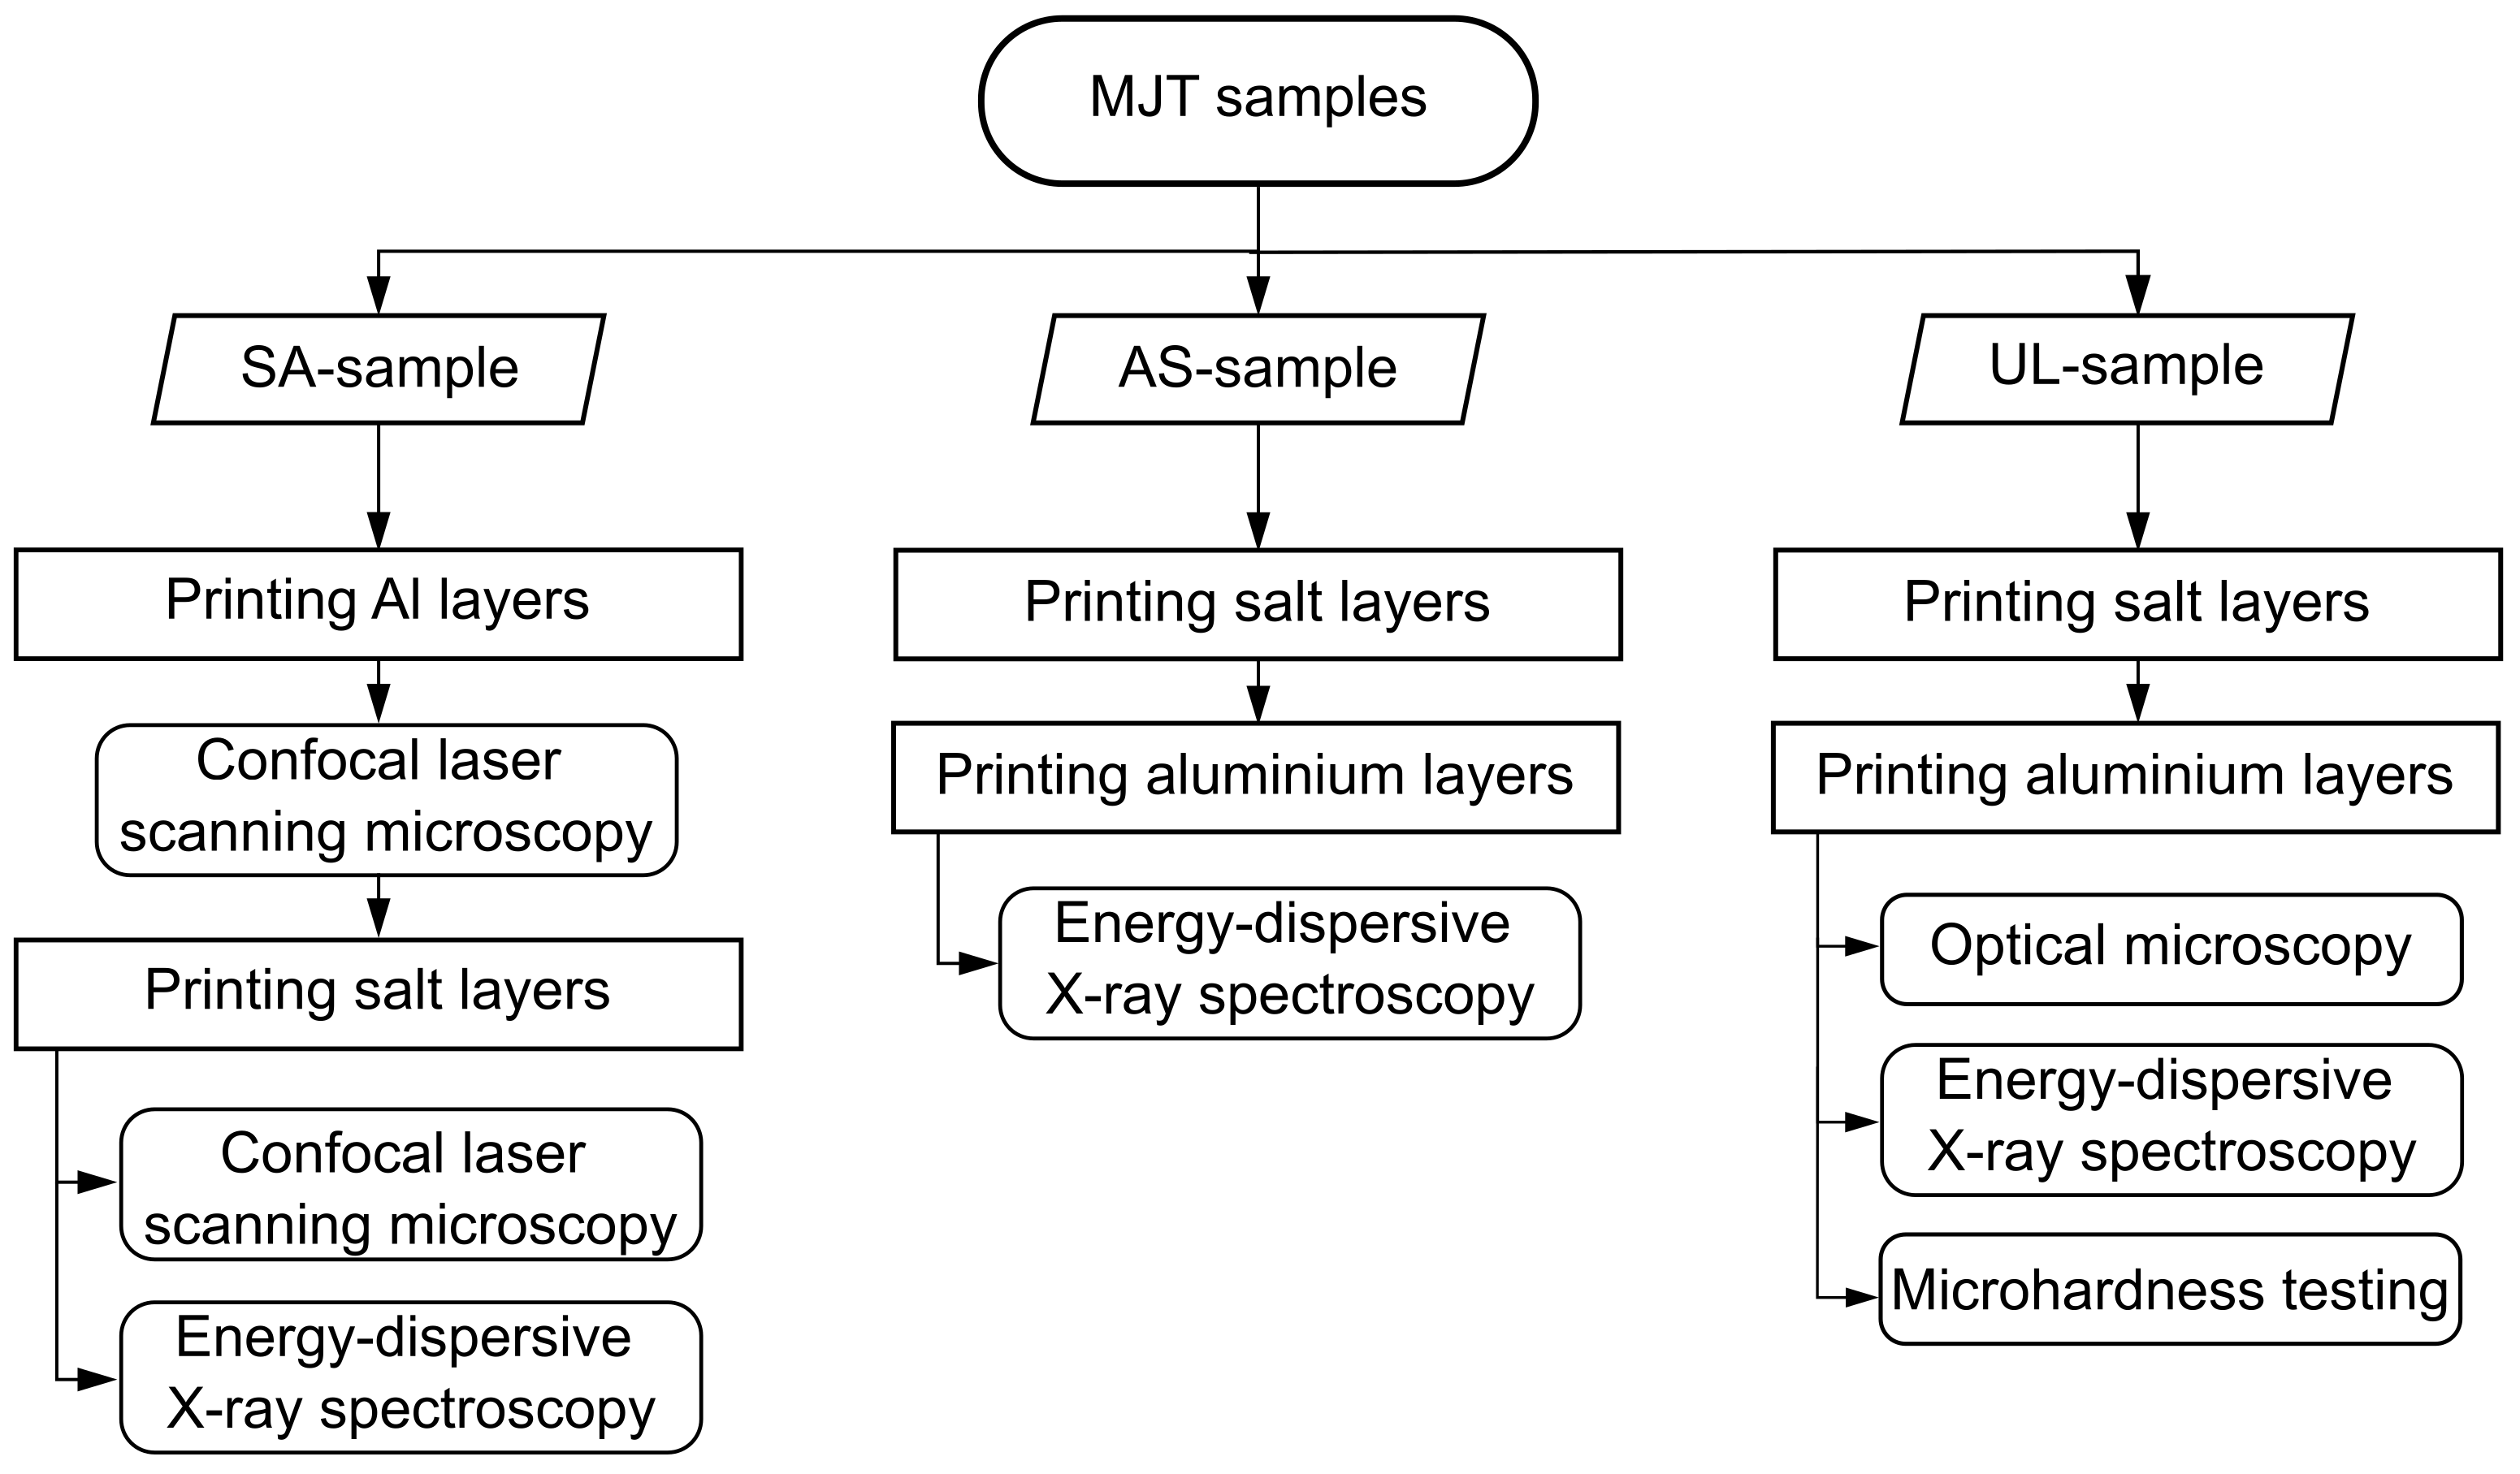
| AS-sample | Aluminum part with salt printed on top |
| Fe | Iron |
| KCl | Potassium chloride |
| MJT | Material jetting |
| NaCl | Sodium chloride |
| SA-sample | Salt support structure with aluminum printed on top |
| Si | Silicon |
| Sr | Strontium |
| Ti | Titanium |
| UL-sample | Aluminum part in the shape of an upside down letter “L”, partly printed on salt support structure |
References
- Wohlers, T.T.; Campbell, I.; Diegel, O.; Huff, R.; Kowen, J. Wohlers Report 2021: 3D Printing and Additive Manufacturing Global State of the Industry; Wohlers Associates: Fort Collins, CO, USA, 2021. [Google Scholar]
- Liu, Q.; Orme, M. On precision droplet-based net-form manufacturing technology. Proc. Inst. Mech. Eng. Part B J. Eng. Manuf. 2001, 215, 1333–1355. [Google Scholar] [CrossRef]
- Kirchebner, B.; Rehekampff, C.; Tröndle, M.; Lechner, P.; Volk, W. Analysis of salts for use as support structure in metal material jetting. Prod. Eng. 2021. [Google Scholar] [CrossRef]
- Jayabal, D.K.K.; Zope, K.; Cormier, D. Fabrication of support-less engineered lattice structures via jetting of molten aluminium droplets. In Proceedings of the 29th Annual International Solid Freeform Fabrication Symposium—An Additive Manufacturing Conference, Austin, TX, USA, 13–15 August 2018; Volume 1, pp. 757–764. [Google Scholar]
- Sukhotskiy, V.; Karampelas, I.H.; Garg, G.; Verma, A.; Tong, M.; Vader, S.; Vader, Z.; Furlani, E.P. Magnetohydrodynamic Drop-on-Demand Liquid Metal 3D Printing. In Proceedings of the 28th Annual International Solid Freeform Fabrication Symposium—An Additive Manufacturing Conference, Austin, TX, USA, 7–9 August 2017; Volume 1, pp. 1806–1811. [Google Scholar]
- Zhang, D.; Qi, L.; Luo, J.; Yi, H.; Hou, X. Direct fabrication of unsupported inclined aluminum pillars based on uniform micro droplets deposition. Int. J. Mach. Tools Manuf. 2017, 116, 18–24. [Google Scholar] [CrossRef]
- Jiang, J.; Xu, X.; Stringer, J. Support Structures for Additive Manufacturing: A Review. J. Manuf. Mater. Process. 2018, 2, 64. [Google Scholar] [CrossRef] [Green Version]
- Hussein, A.; Hao, L.; Yan, C.; Everson, R.; Young, P. Advanced lattice support structures for metal additive manufacturing. J. Mater. Process. Technol. 2013, 213, 1019–1026. [Google Scholar] [CrossRef]
- Duran, C.; Subbian, V.; Giovanetti, M.T.; Simkins, J.R.; Beyette, F.R., Jr. Experimental desktop 3D printing using dual extrusion and water-soluble polyvinyl alcohol. Rapid Prototyp. J. 2015, 21, 528–534. [Google Scholar] [CrossRef]
- Huang, R.; Zhang, B. Study on the Composition and Properties of Salt Cores for Zinc Alloy Die Casting. Int. J. Met. 2017, 11, 440–447. [Google Scholar] [CrossRef]
- Jelínek, P.; Adámková, E.; Mikšovský, F.; Beňo, J. Advances inTechnology of Soluble Coresfor Die Castings. Arch. Foundry Eng. 2015, 15, 29–34. [Google Scholar] [CrossRef] [Green Version]
- Yaokawa, J.; Miura, D.; Anzai, K.; Yamada, Y.; Yoshii, H. Strength of Salt Core Composed of Alkali Carbonate and Alkali Chloride Mixtures Made by Casting Technique. Mater. Trans. 2007, 48, 1034–1041. [Google Scholar] [CrossRef] [Green Version]
- Ozeryanaya, I.N. Corrosion of metals by molten salts in heat-treatment processes. Metal Sci. Heat Treat. 1985, 27, 184–188. [Google Scholar] [CrossRef]
- Janz, G.J. Molten Salts Handbook; Elsevier Science: Burlington, VT, USA, 1967. [Google Scholar]
- Shiran, M.K.G.; Khalaj, G.; Pouraliakbar, H.; Jandaghi, M.; Bakhtiari, H.; Shirazi, M. Effects of heat treatment on the intermetallic compounds and mechanical properties of the stainless steel 321–aluminum 1230 explosive-welding interface. Int. J. Miner. Metall. Mater. 2017, 24, 1267–1277. [Google Scholar] [CrossRef]
- Himmel, B.; Rumschoettel, D.; Volk, W. Tensile properties of aluminium 4047A built in droplet-based metal printing. Rapid Prototyp. J. 2019, 25, 427–432. [Google Scholar] [CrossRef]
- Mills, K.C. Recommended Values of Thermophysical Properties for Selected Commercial Alloys; Woodhead: Cambridge, UK, 2002. [Google Scholar]
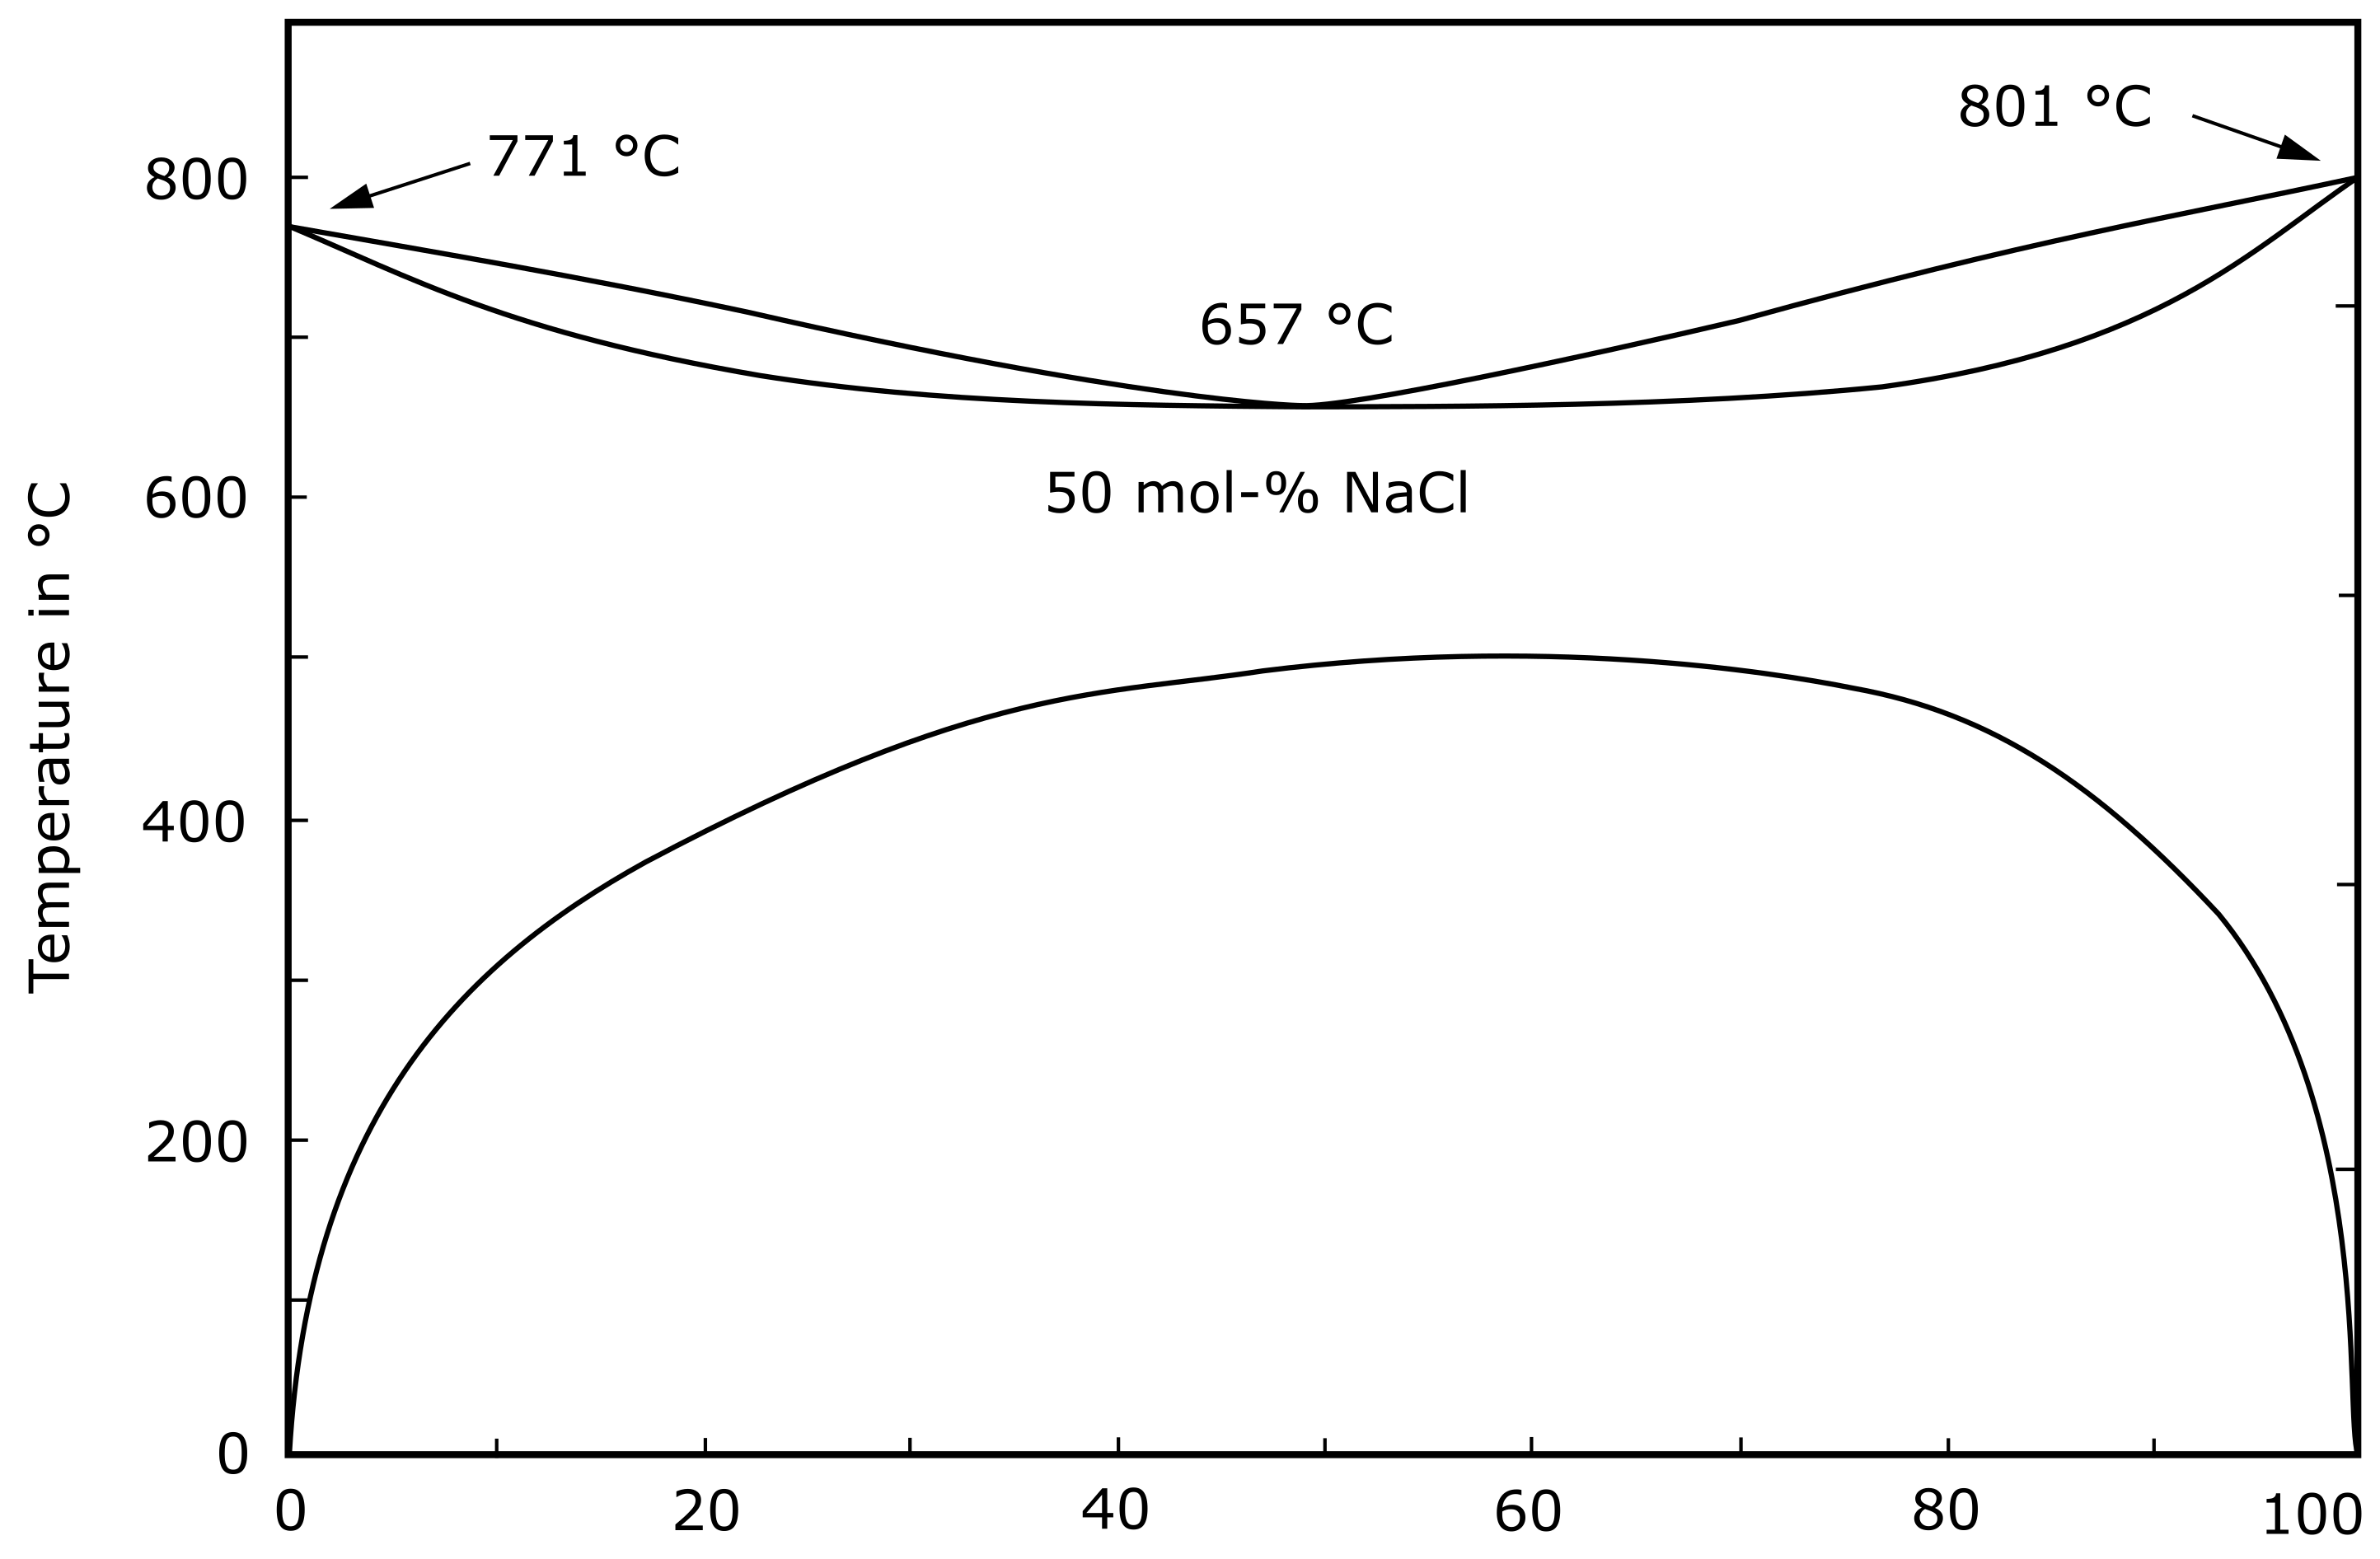
- Barrett, W.T.; Wallace, W.E. Studies of NaCl-KCl Solid Solutions. I. Heats of Formation, Lattice Spacings, Densities, Schottky Defects and Mutual Solubilities 1,2. J. Am. Chem. Soc. 1954, 76, 366–369. [Google Scholar] [CrossRef]
- Sergeev, D.; Kobertz, D.; Müller, M. Thermodynamics of the NaCl–KCl system. Thermochim. Acta 2015, 606, 25–33. [Google Scholar] [CrossRef]
- Bale, C.W.; Bélisle, E.; Chartrand, P.; Decterov, S.A.; Eriksson, G.; Gheribi, A.E.; Hack, K.; Jung, I.H.; Kang, Y.B.; Melançon, J.; et al. FactSage Thermochemical Software and Databases—2010–2016. Calphad 2016, 35–53. [Google Scholar] [CrossRef] [Green Version]
- Ansell, T.Y. Current Status of Liquid Metal Printing. J. Manuf. Mater. Process. 2021, 5, 31. [Google Scholar] [CrossRef]
- Weck, E.; Leistner, E. Metallographische Anleitung zum Farbätzen nach dem Tauchverfahren: = Metallographic Instructions for Colour Etching by Immersion; Vol. Bd. 77; Fachbuchreihe Schweisstechnik, Dt. Verl. für Schweisstechnik DVS-Verl.: Düsseldorf, Germany, 1986. [Google Scholar]
- Goldstein, J.I.; Newbury, D.E.; Michael, J.R.; Ritchie, N.W.; Scott, J.H.J.; Joy, D.C. Scanning Electron Microscopy and X-ray Microanalysis, 4th ed.; Springer: New York, NY, USA, 2018. [Google Scholar] [CrossRef]
- Jenkins, R.; Manne, R.; Robin, R.; Senemaud, C. IUPAC—Nomenclature system for x-ray spectroscopy. X-Ray Spectrom. 1991, 20, 149–155. [Google Scholar] [CrossRef]
- Bearden, J.A. X-ray Wavelengths. Rev. Mod. Phys. 1967, 39, 78–124. [Google Scholar] [CrossRef]


| Element | Average Concentration | Concentration in Measurement 1 | Concentration in Measurement 2 | Concentration in Measurement 3 |
|---|---|---|---|---|
| Al | 86.6 | 86.6 | 86.6 | 86.6 |
| Si | 13.1 | 13.0 | 13.1 | 13.1 |
| Fe | 0.134 | 0.137 | 0.128 | 0.136 |
| Sr | 0.022 | 0.027 | 0.019 | 0.021 |
| Ti | 0.018 | 0.018 | 0.017 | 0.018 |
| Description | Abbreviation |
|---|---|
| Salt printed on aluminum | SA-sample |
| Aluminum printed on salt | AS-sample |
| Aluminum printed both on salt and on printing plate | UL-sample |
Publisher’s Note: MDPI stays neutral with regard to jurisdictional claims in published maps and institutional affiliations. |
© 2021 by the authors. Licensee MDPI, Basel, Switzerland. This article is an open access article distributed under the terms and conditions of the Creative Commons Attribution (CC BY) license (https://creativecommons.org/licenses/by/4.0/).
Share and Cite
Kirchebner, B.; Ploetz, M.; Rehekampff, C.; Lechner, P.; Volk, W. Influence of Salt Support Structures on Material Jetted Aluminum Parts. Materials 2021, 14, 4072. https://doi.org/10.3390/ma14154072
Kirchebner B, Ploetz M, Rehekampff C, Lechner P, Volk W. Influence of Salt Support Structures on Material Jetted Aluminum Parts. Materials. 2021; 14(15):4072. https://doi.org/10.3390/ma14154072
Chicago/Turabian StyleKirchebner, Benedikt, Maximilian Ploetz, Christoph Rehekampff, Philipp Lechner, and Wolfram Volk. 2021. "Influence of Salt Support Structures on Material Jetted Aluminum Parts" Materials 14, no. 15: 4072. https://doi.org/10.3390/ma14154072
APA StyleKirchebner, B., Ploetz, M., Rehekampff, C., Lechner, P., & Volk, W. (2021). Influence of Salt Support Structures on Material Jetted Aluminum Parts. Materials, 14(15), 4072. https://doi.org/10.3390/ma14154072