
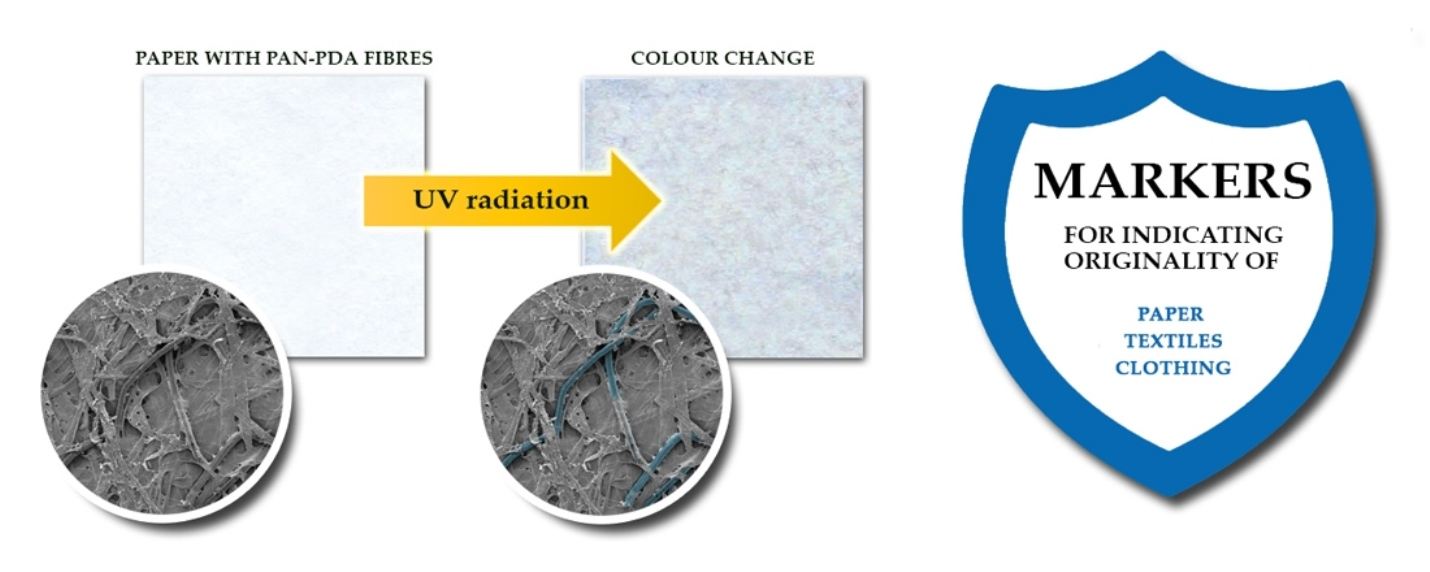
Paper Doped with Polyacrylonitrile Fibres Modified with 10,12–Pentacosadiynoic Acid


Abstract
: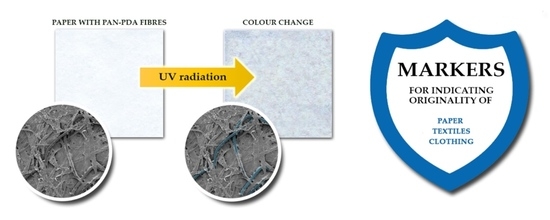
1. Introduction
2. Materials and Methods
2.1. Preparation of Samples
2.2. Basic Features of Modified Paper
2.3. Irradiation of Samples
2.4. Spectrophotometric Measurements
2.5. Scanning Electron Microscopy Measurements
2.6. Paper Surface Unevenness
3. Results
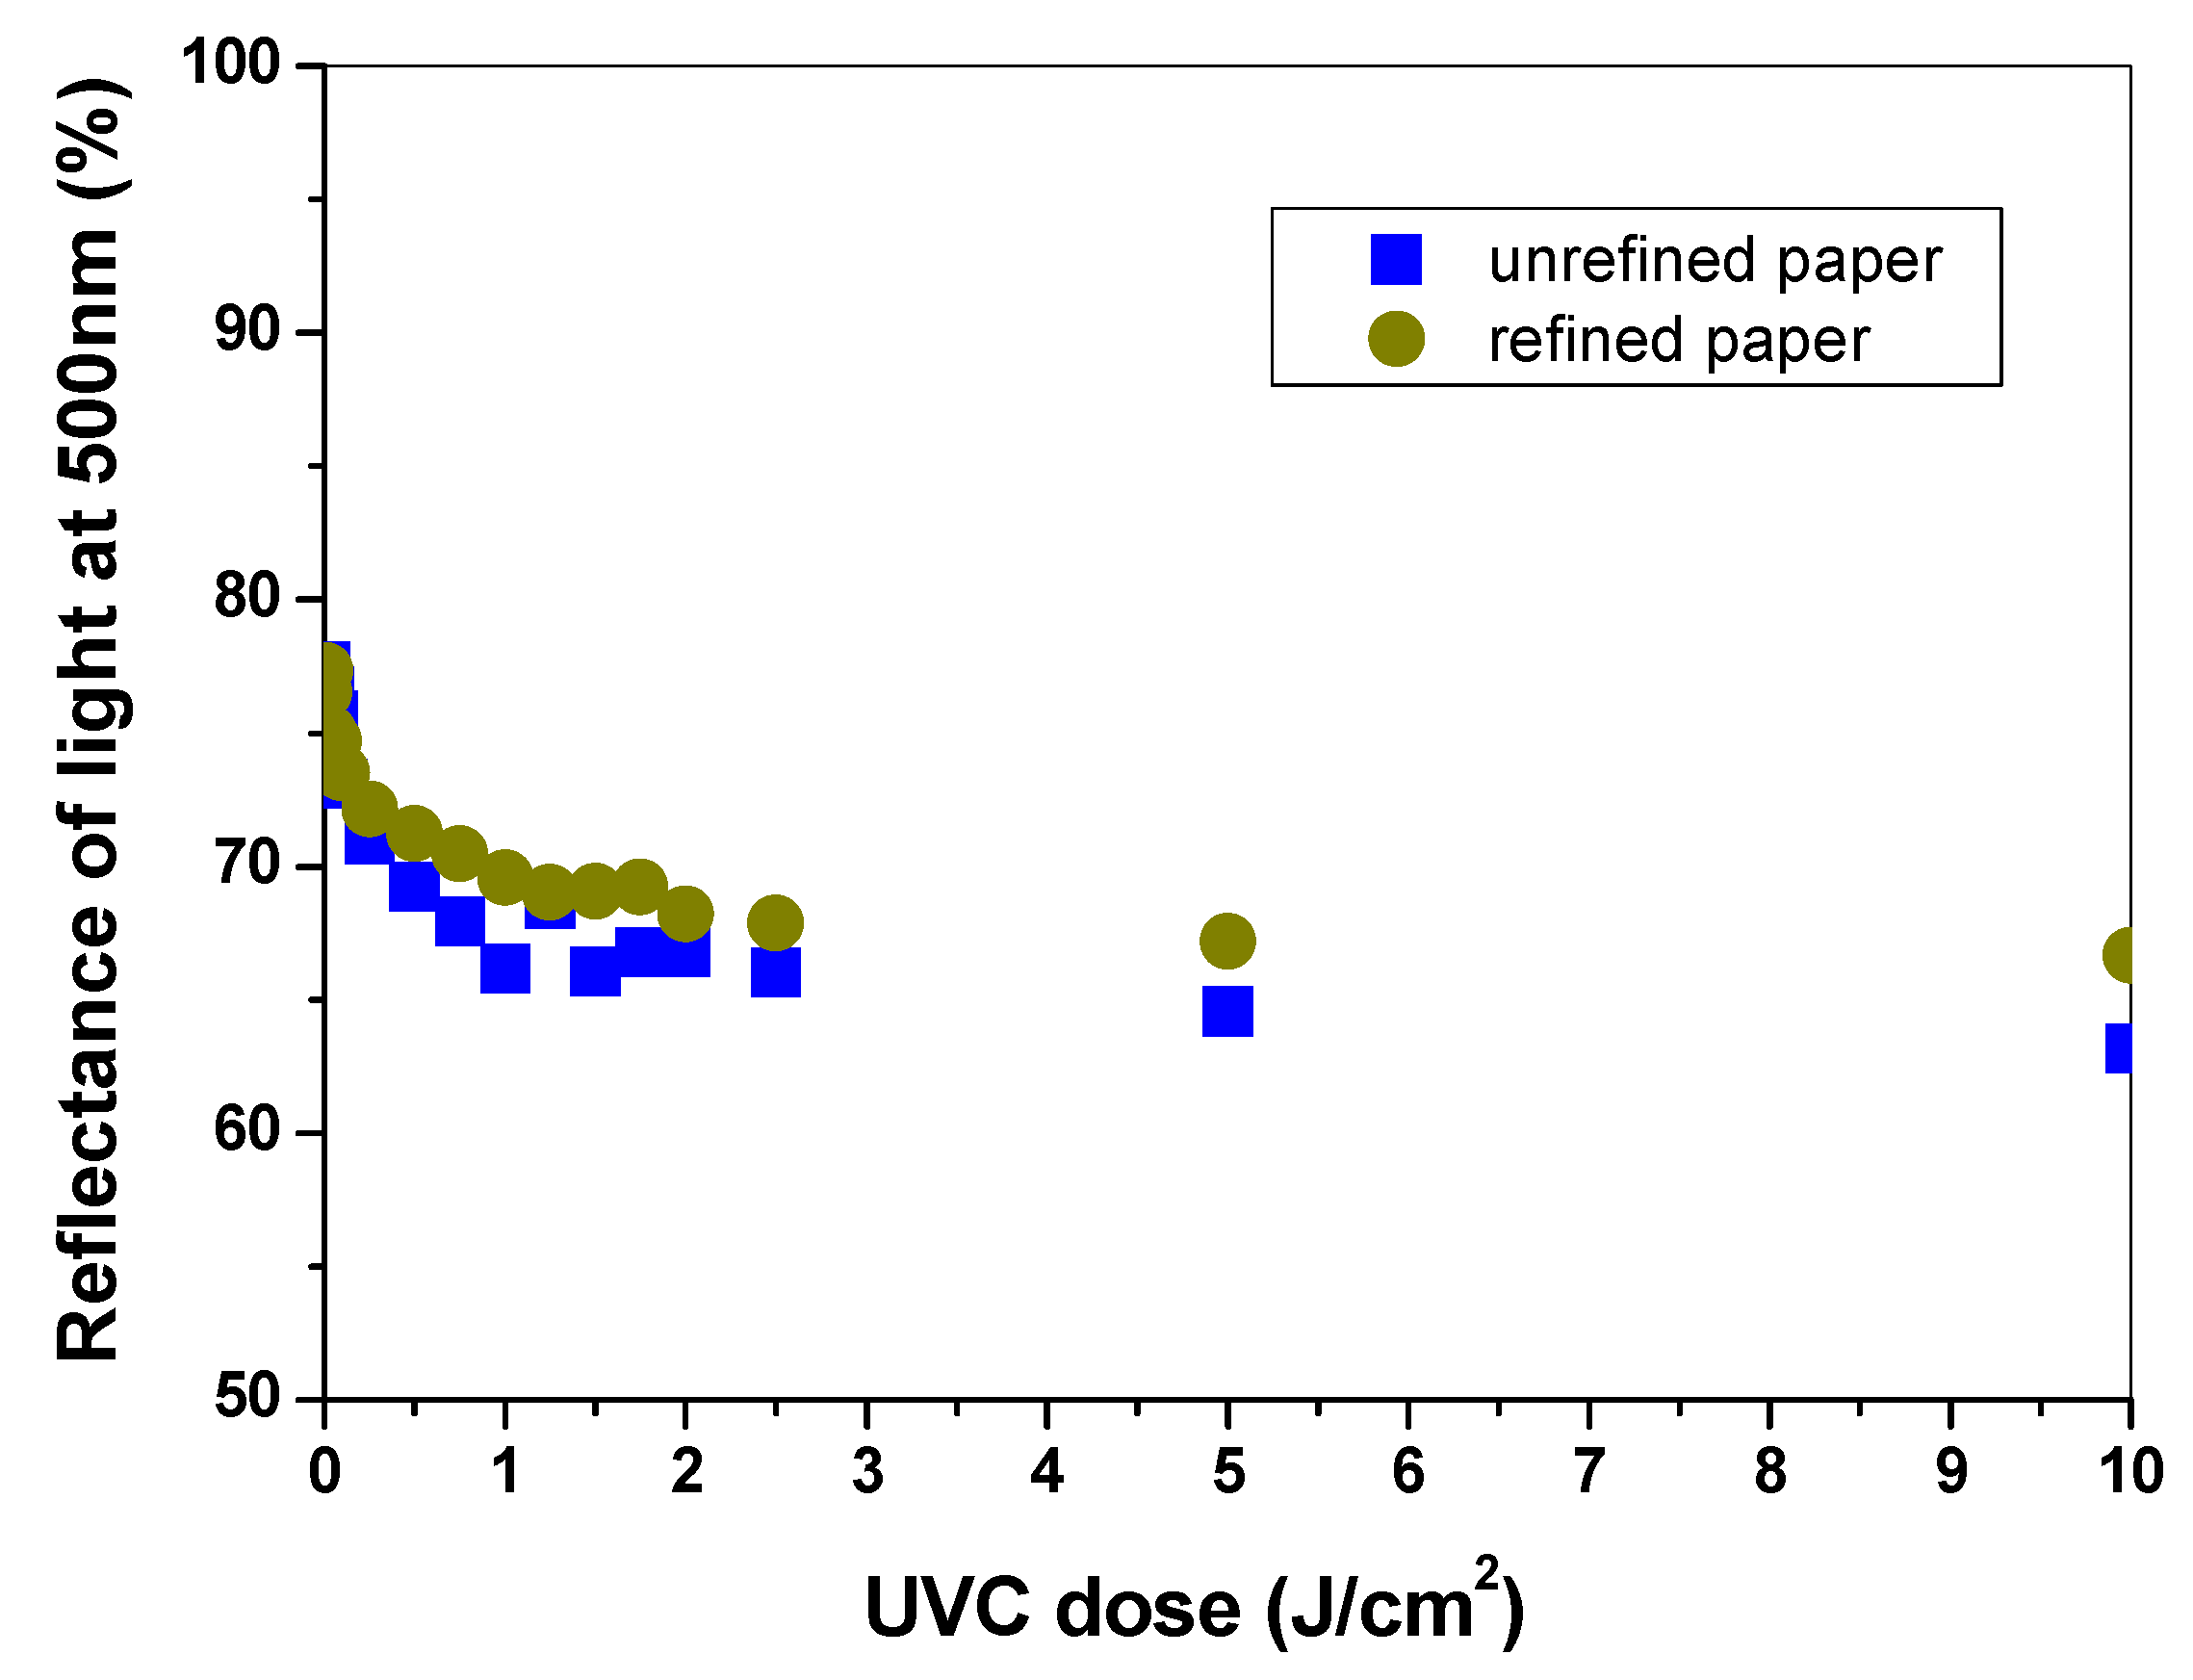
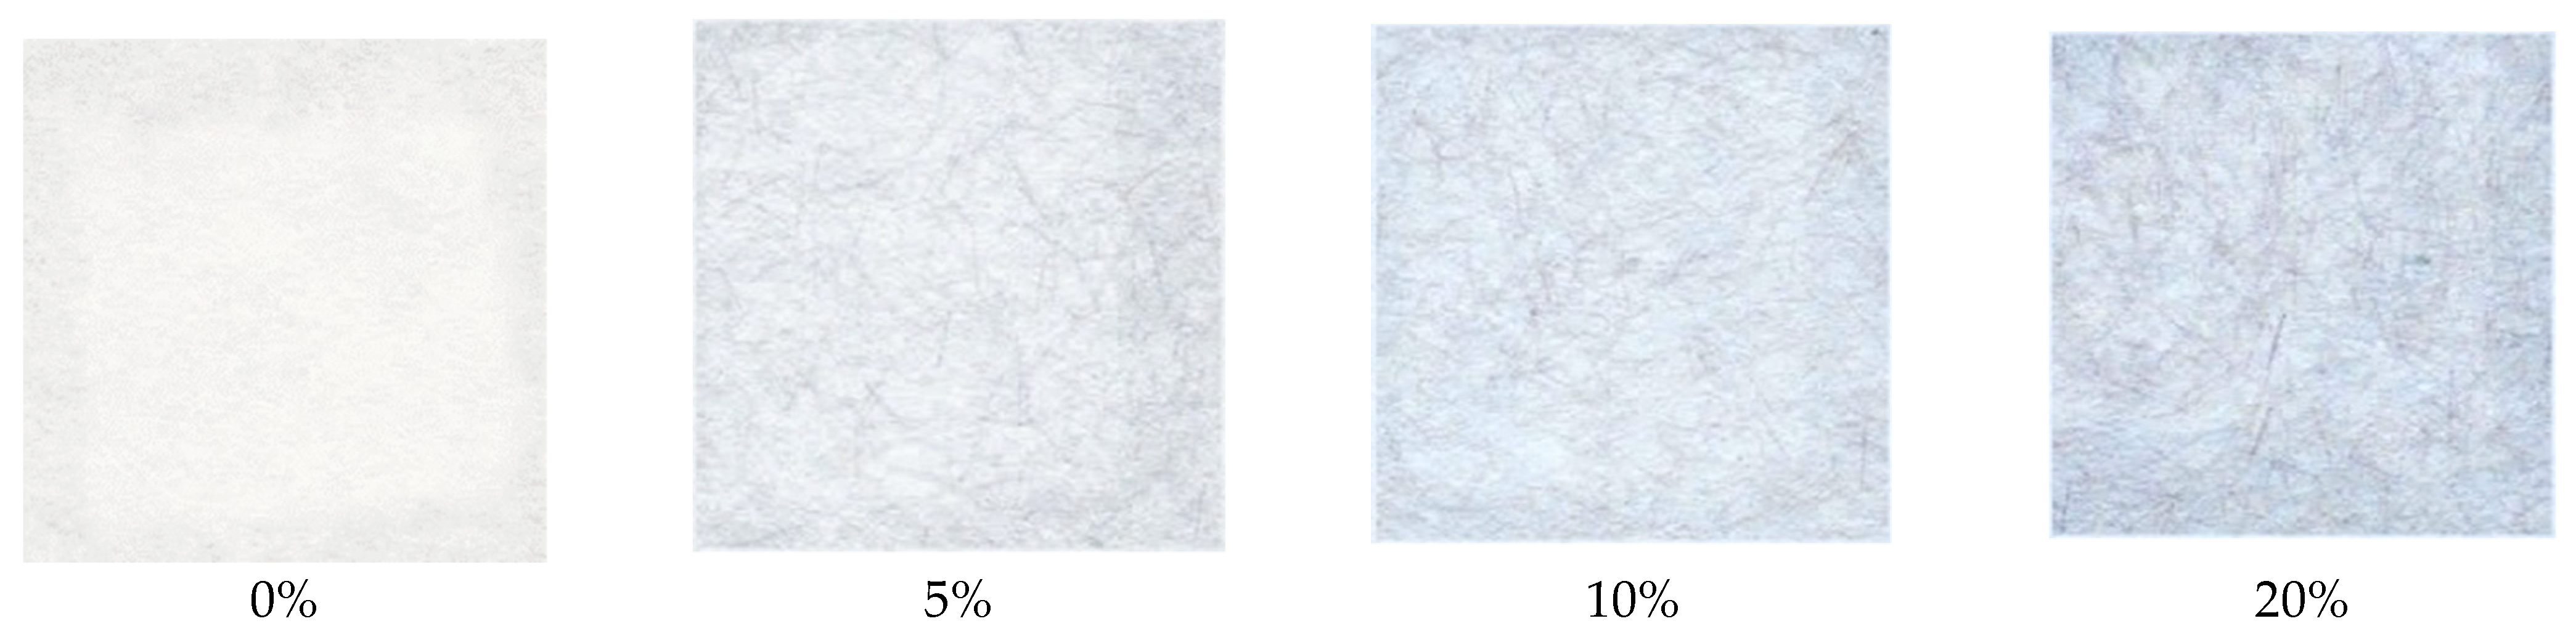
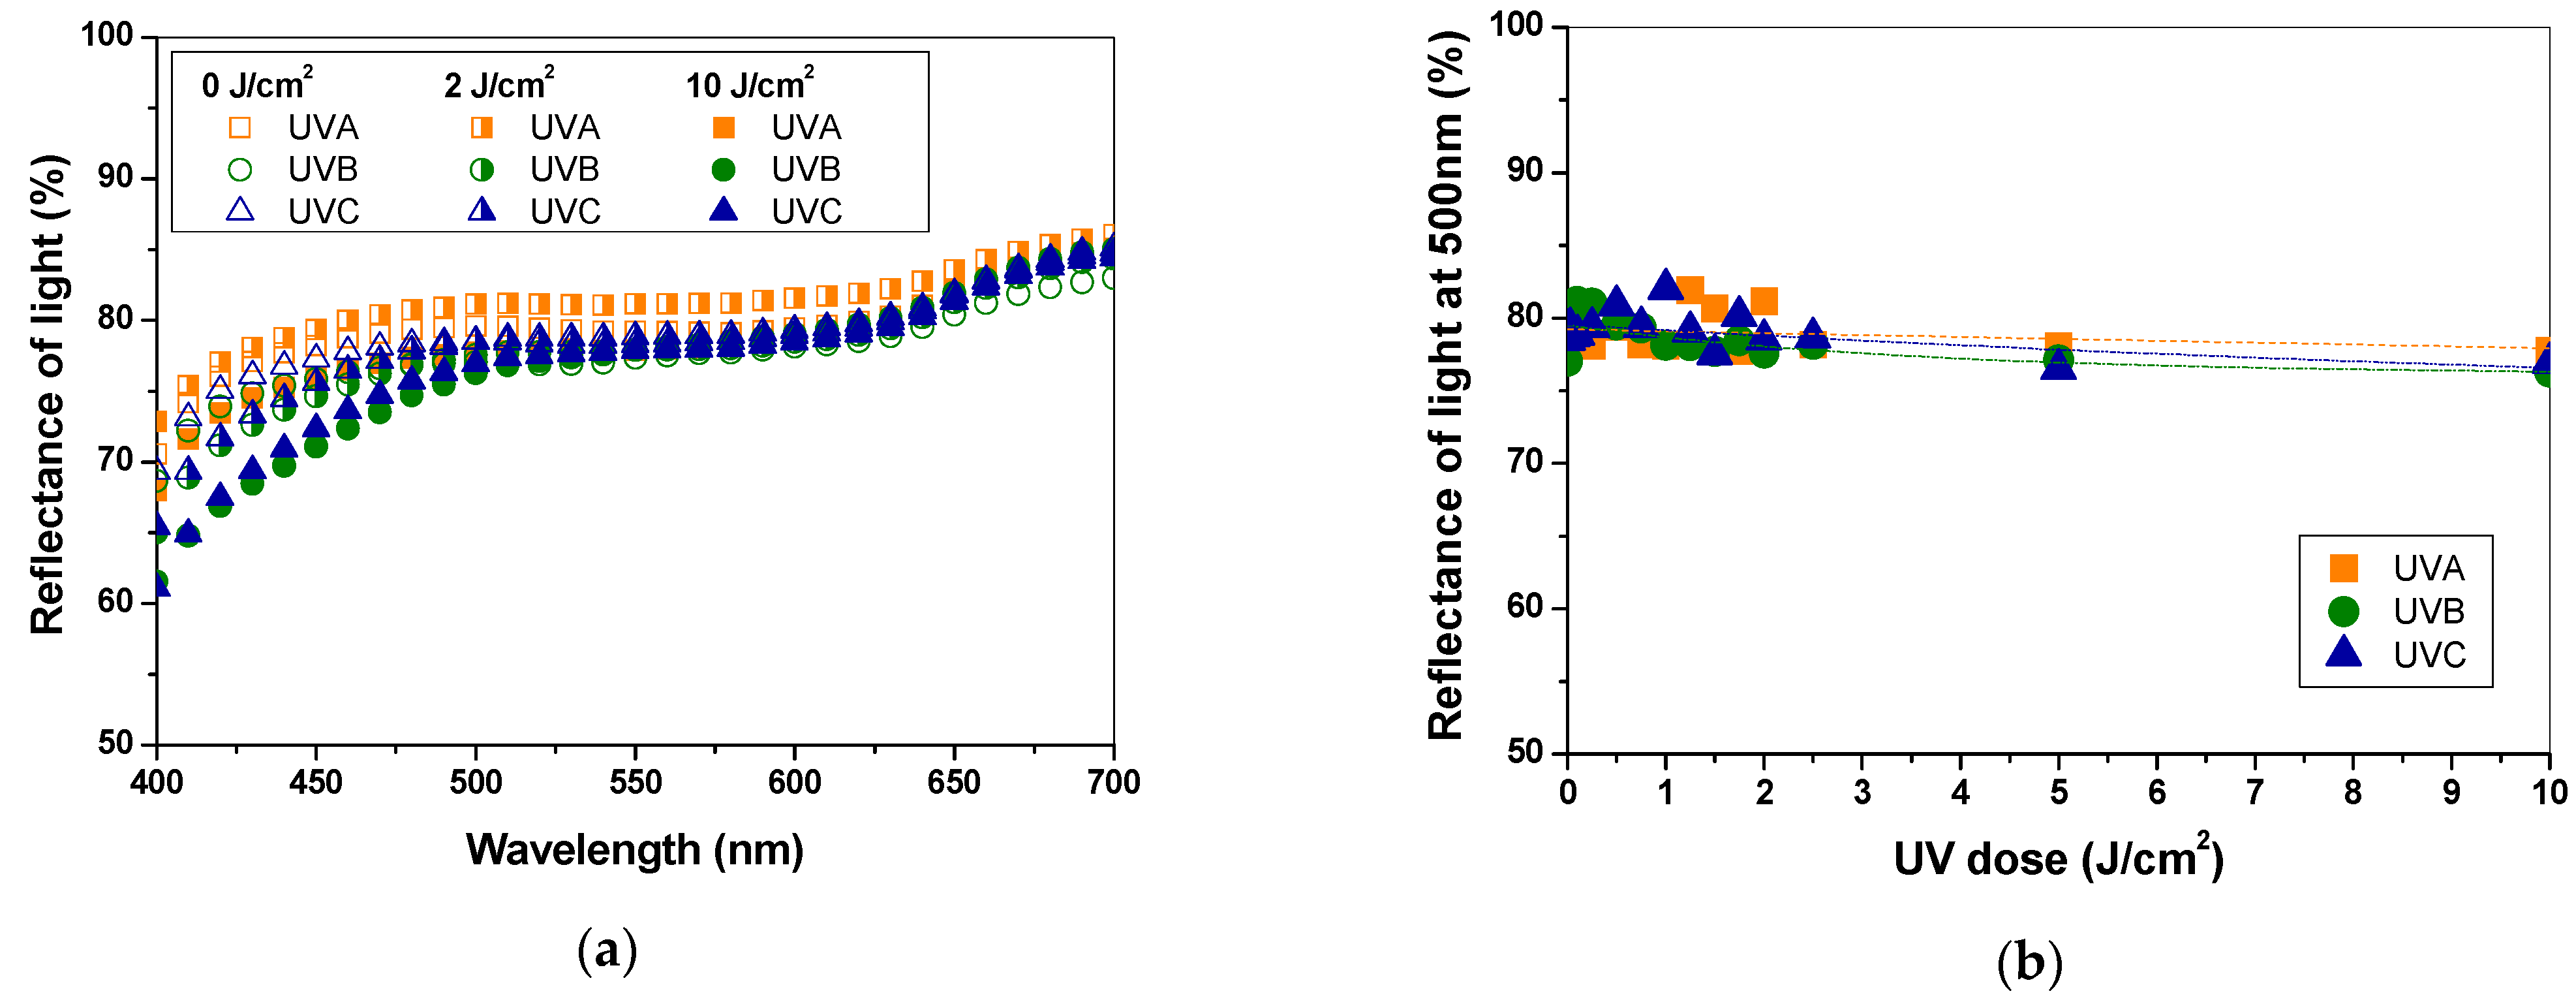
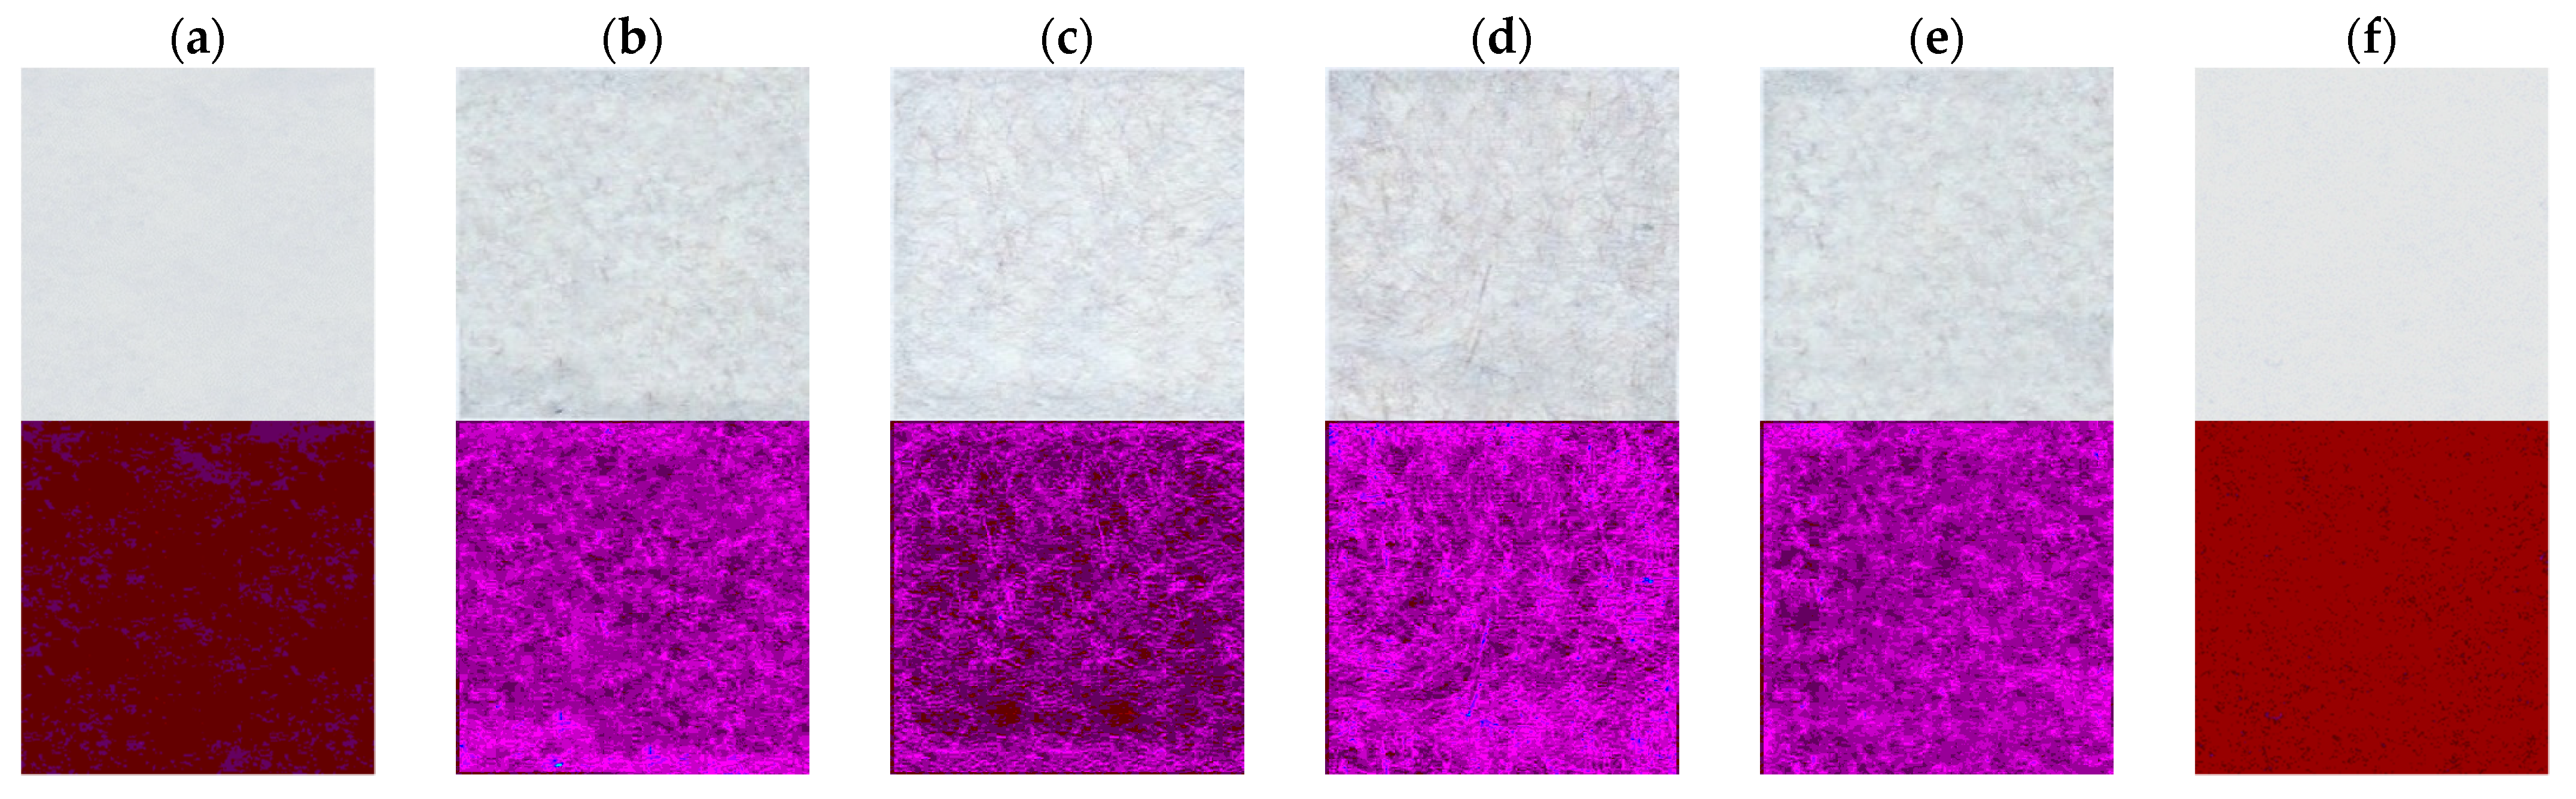
3.1. Dose Response of Paper–PAN–PDA Samples
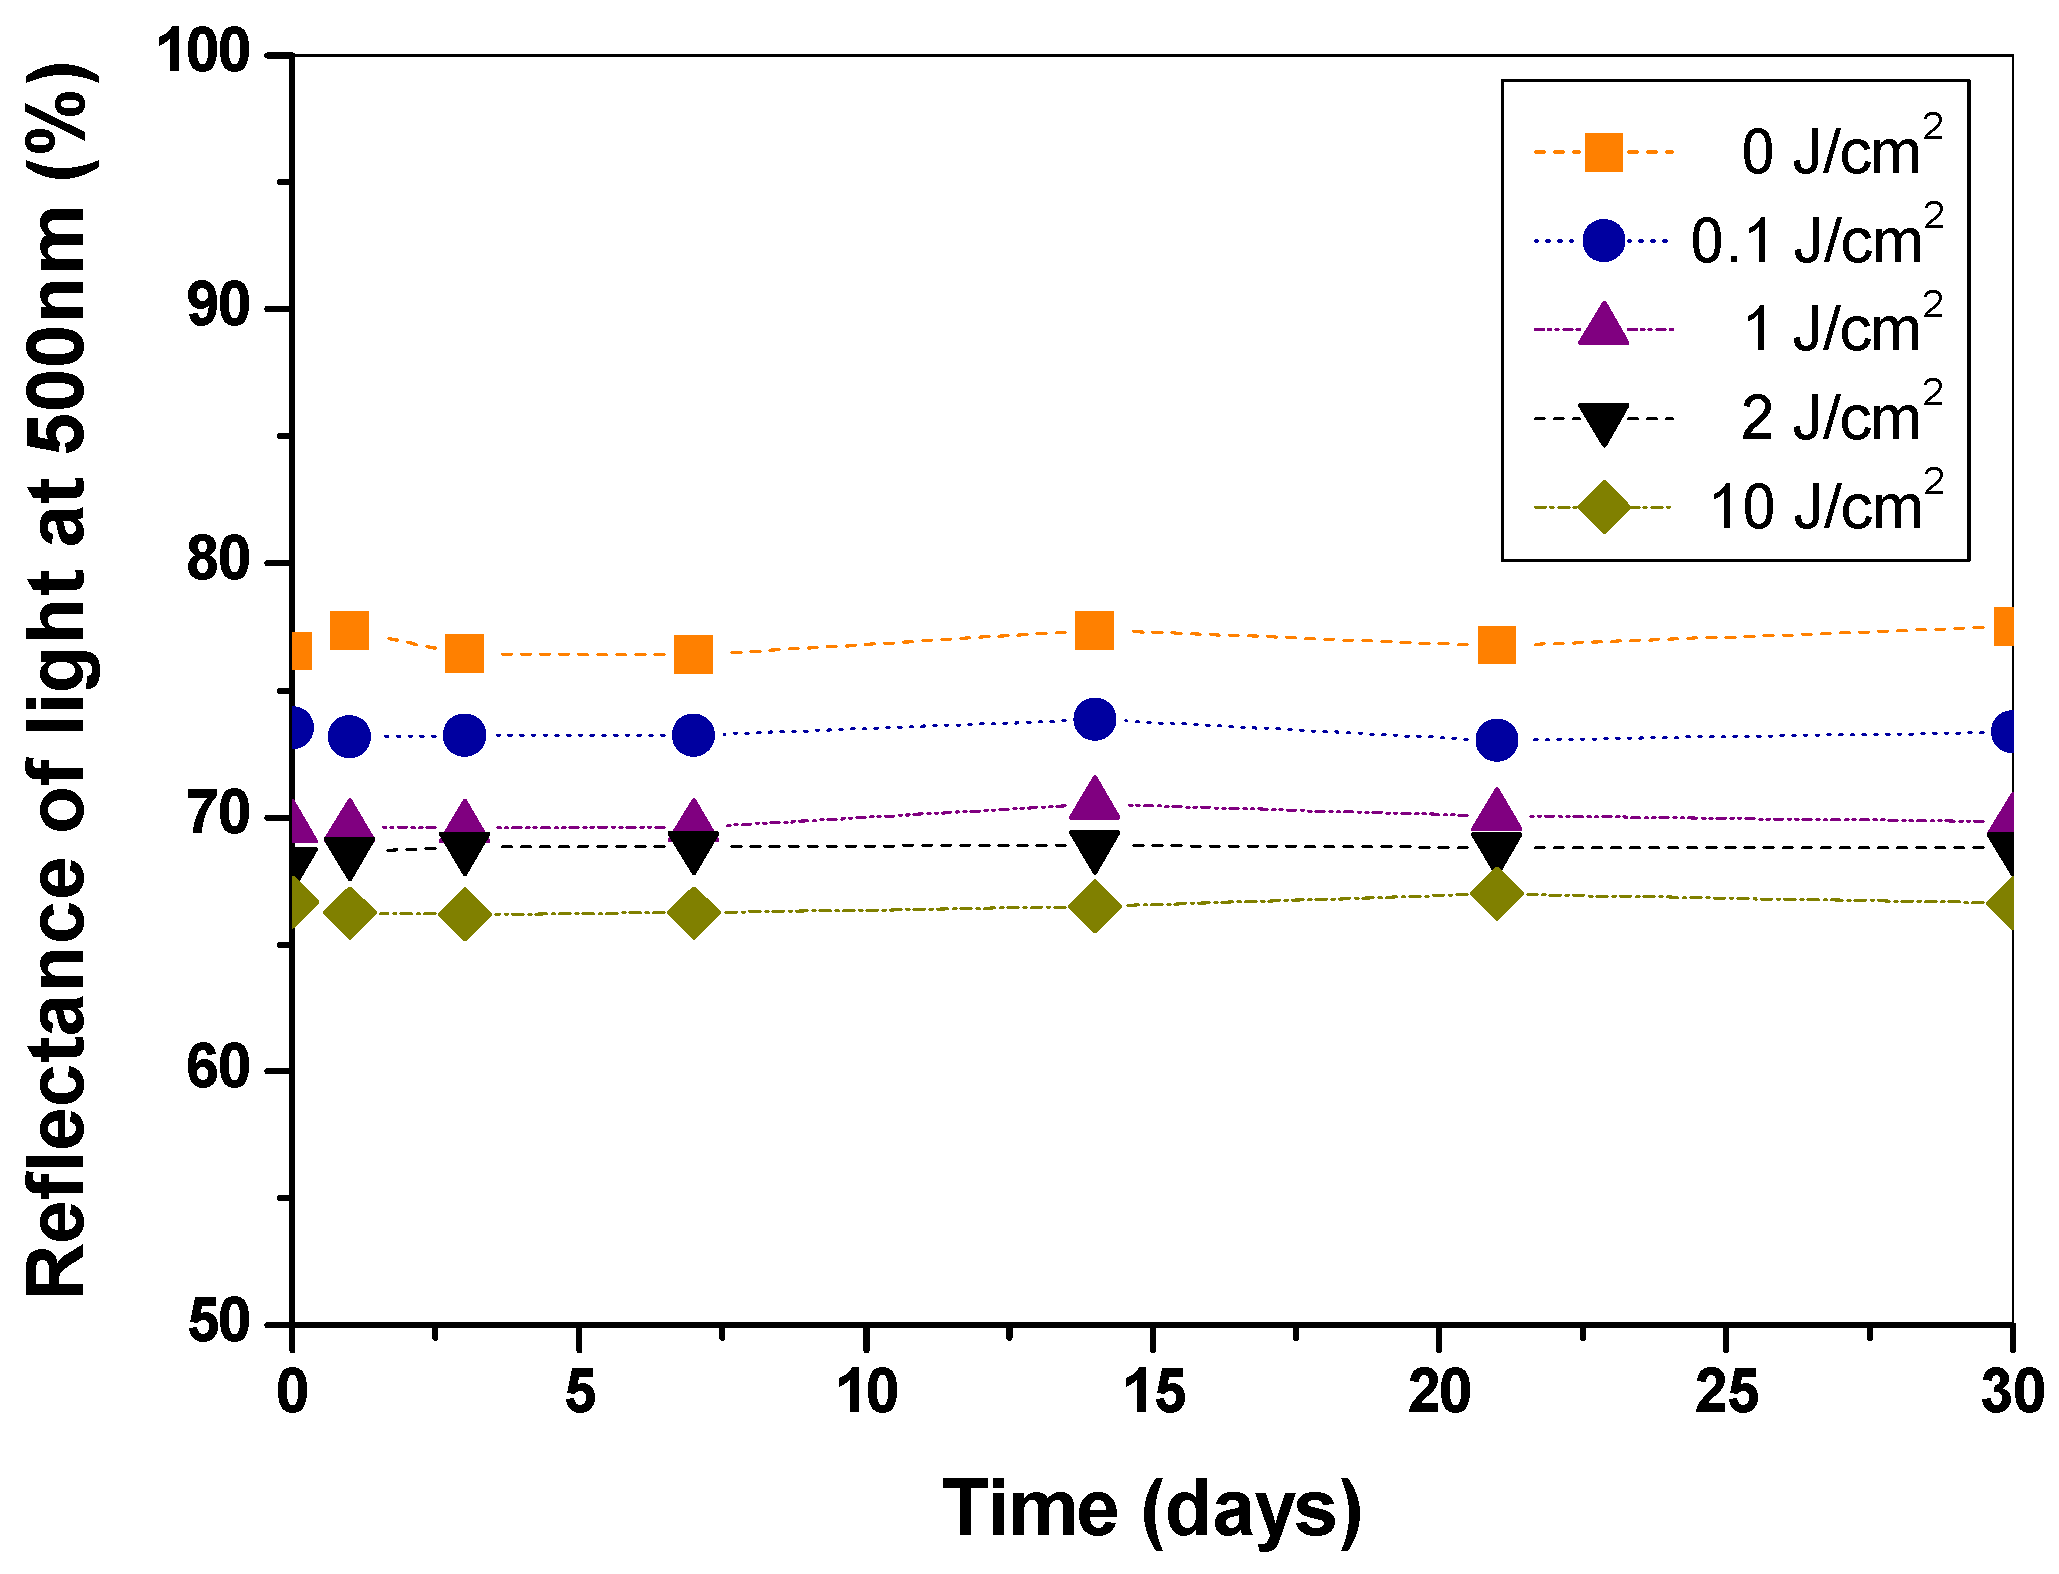
3.2. Long-Term Stability of the Doped Paper
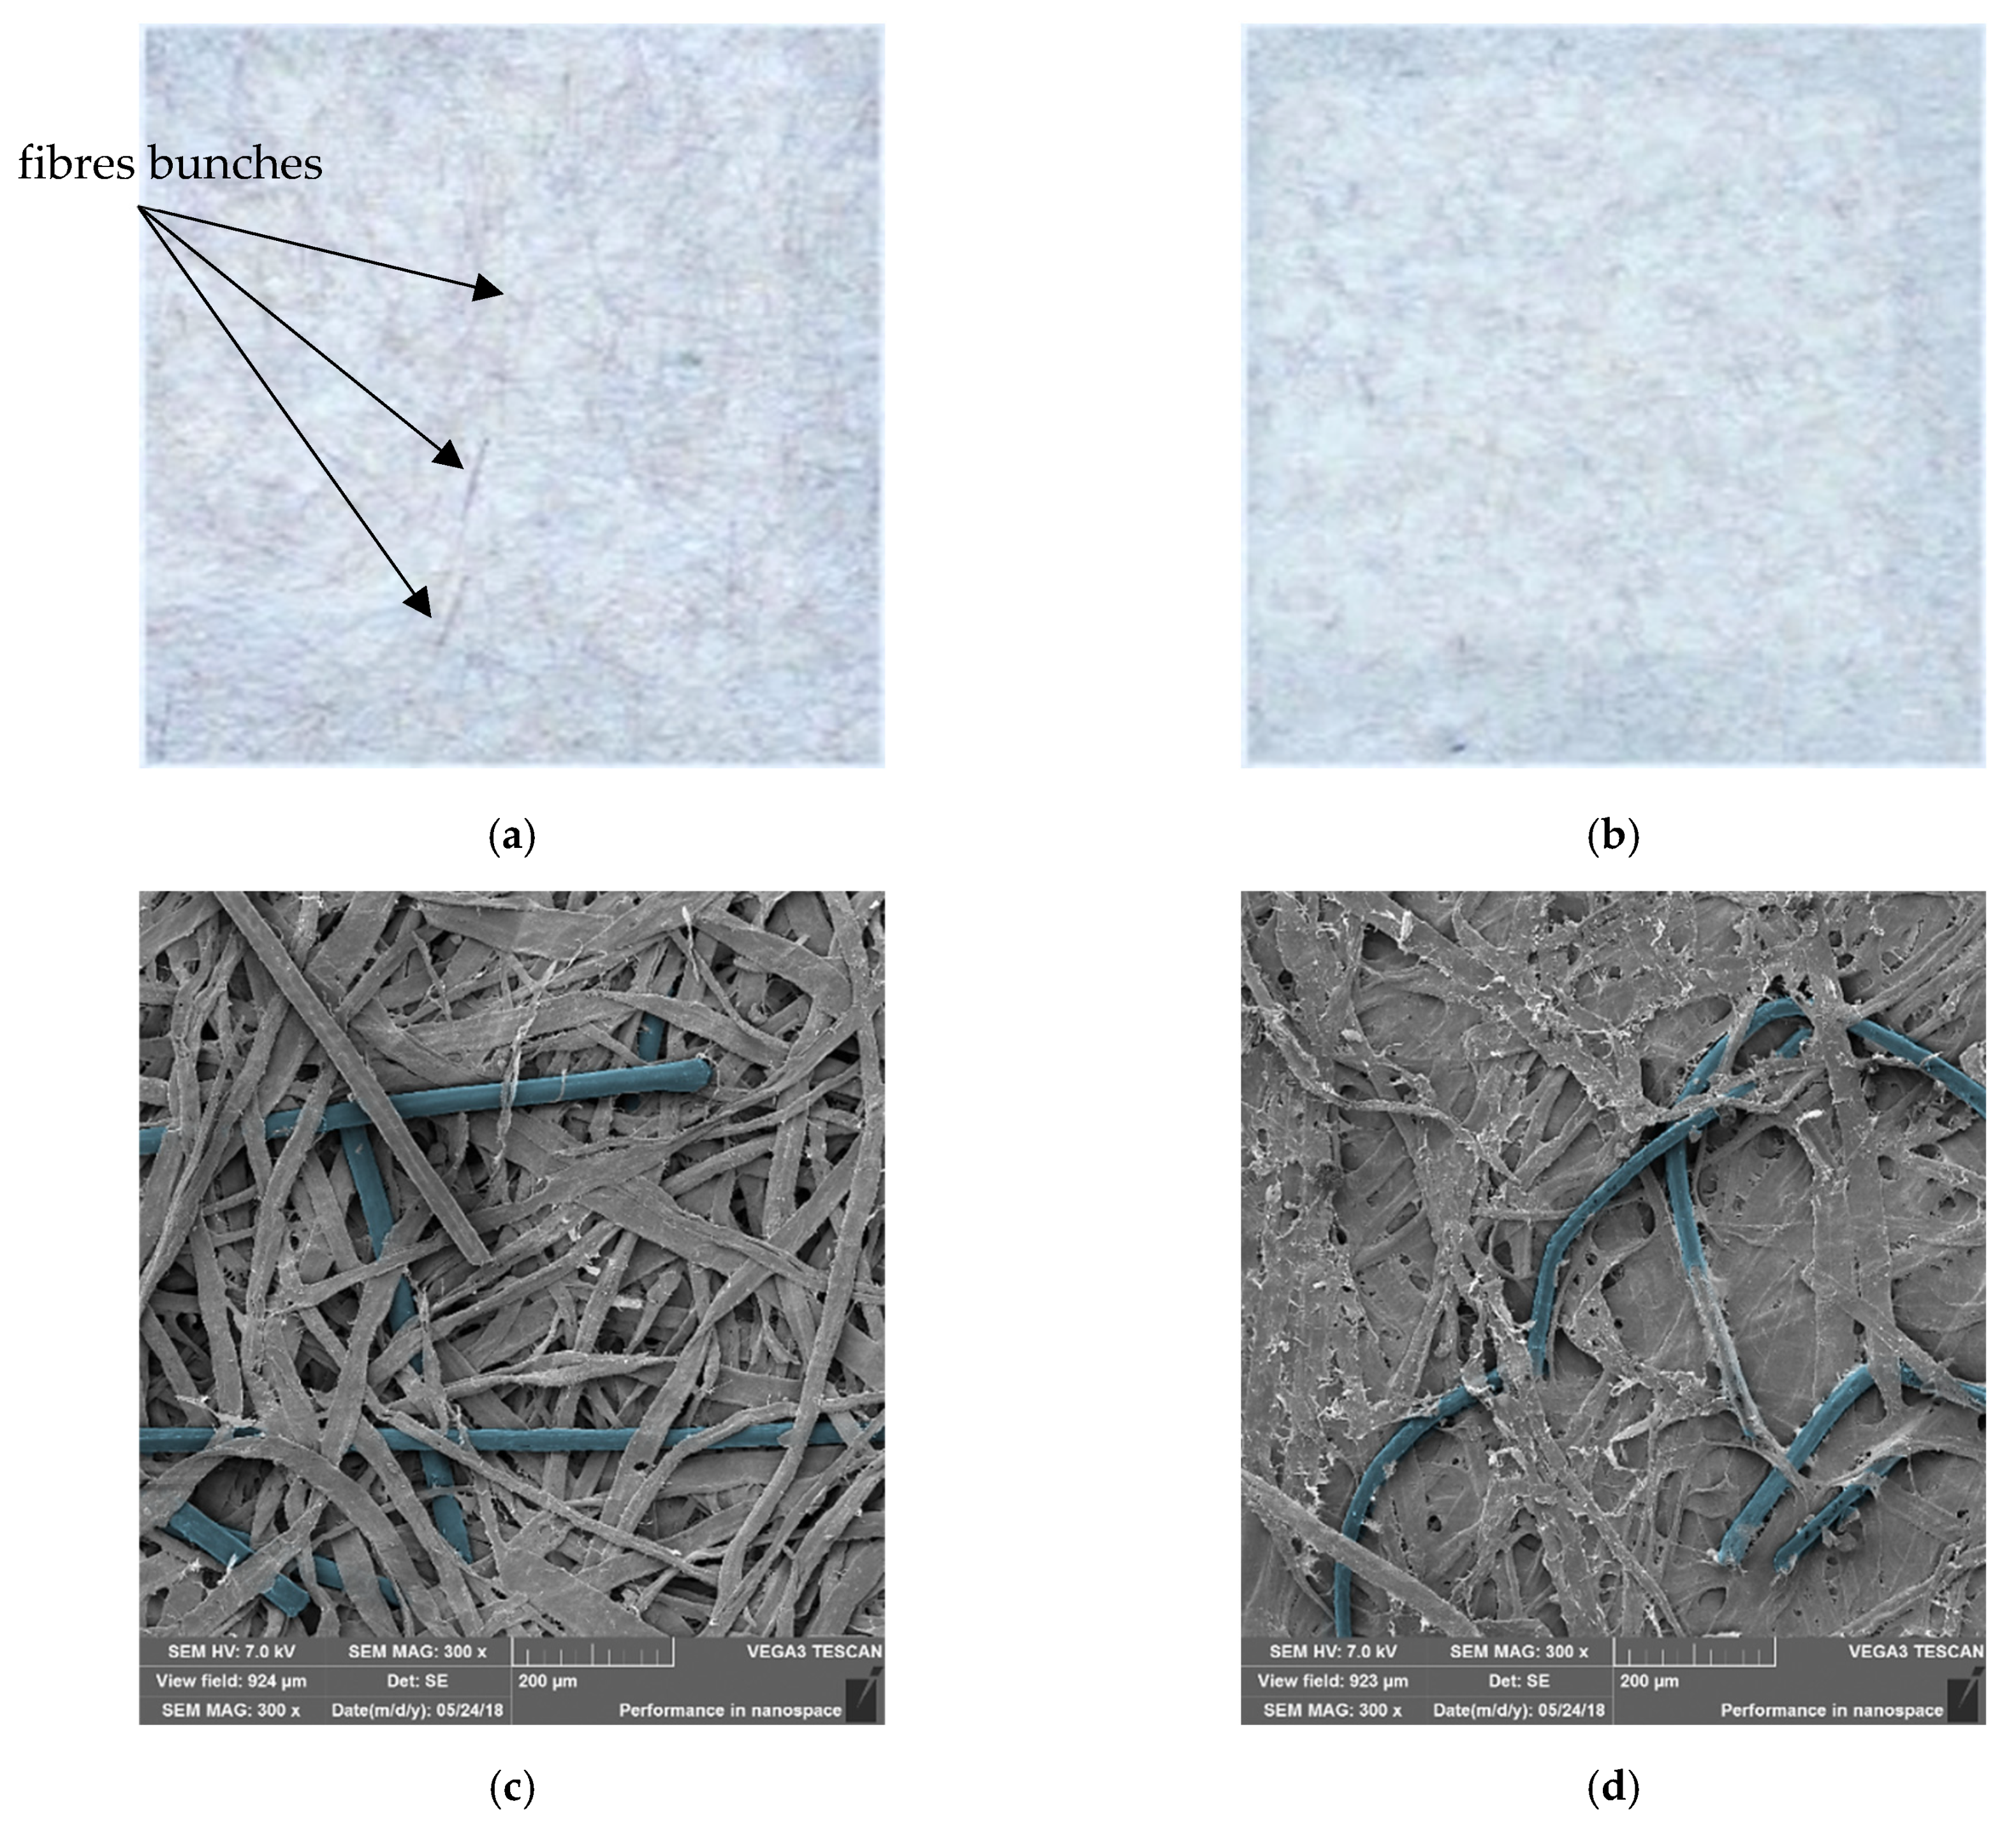
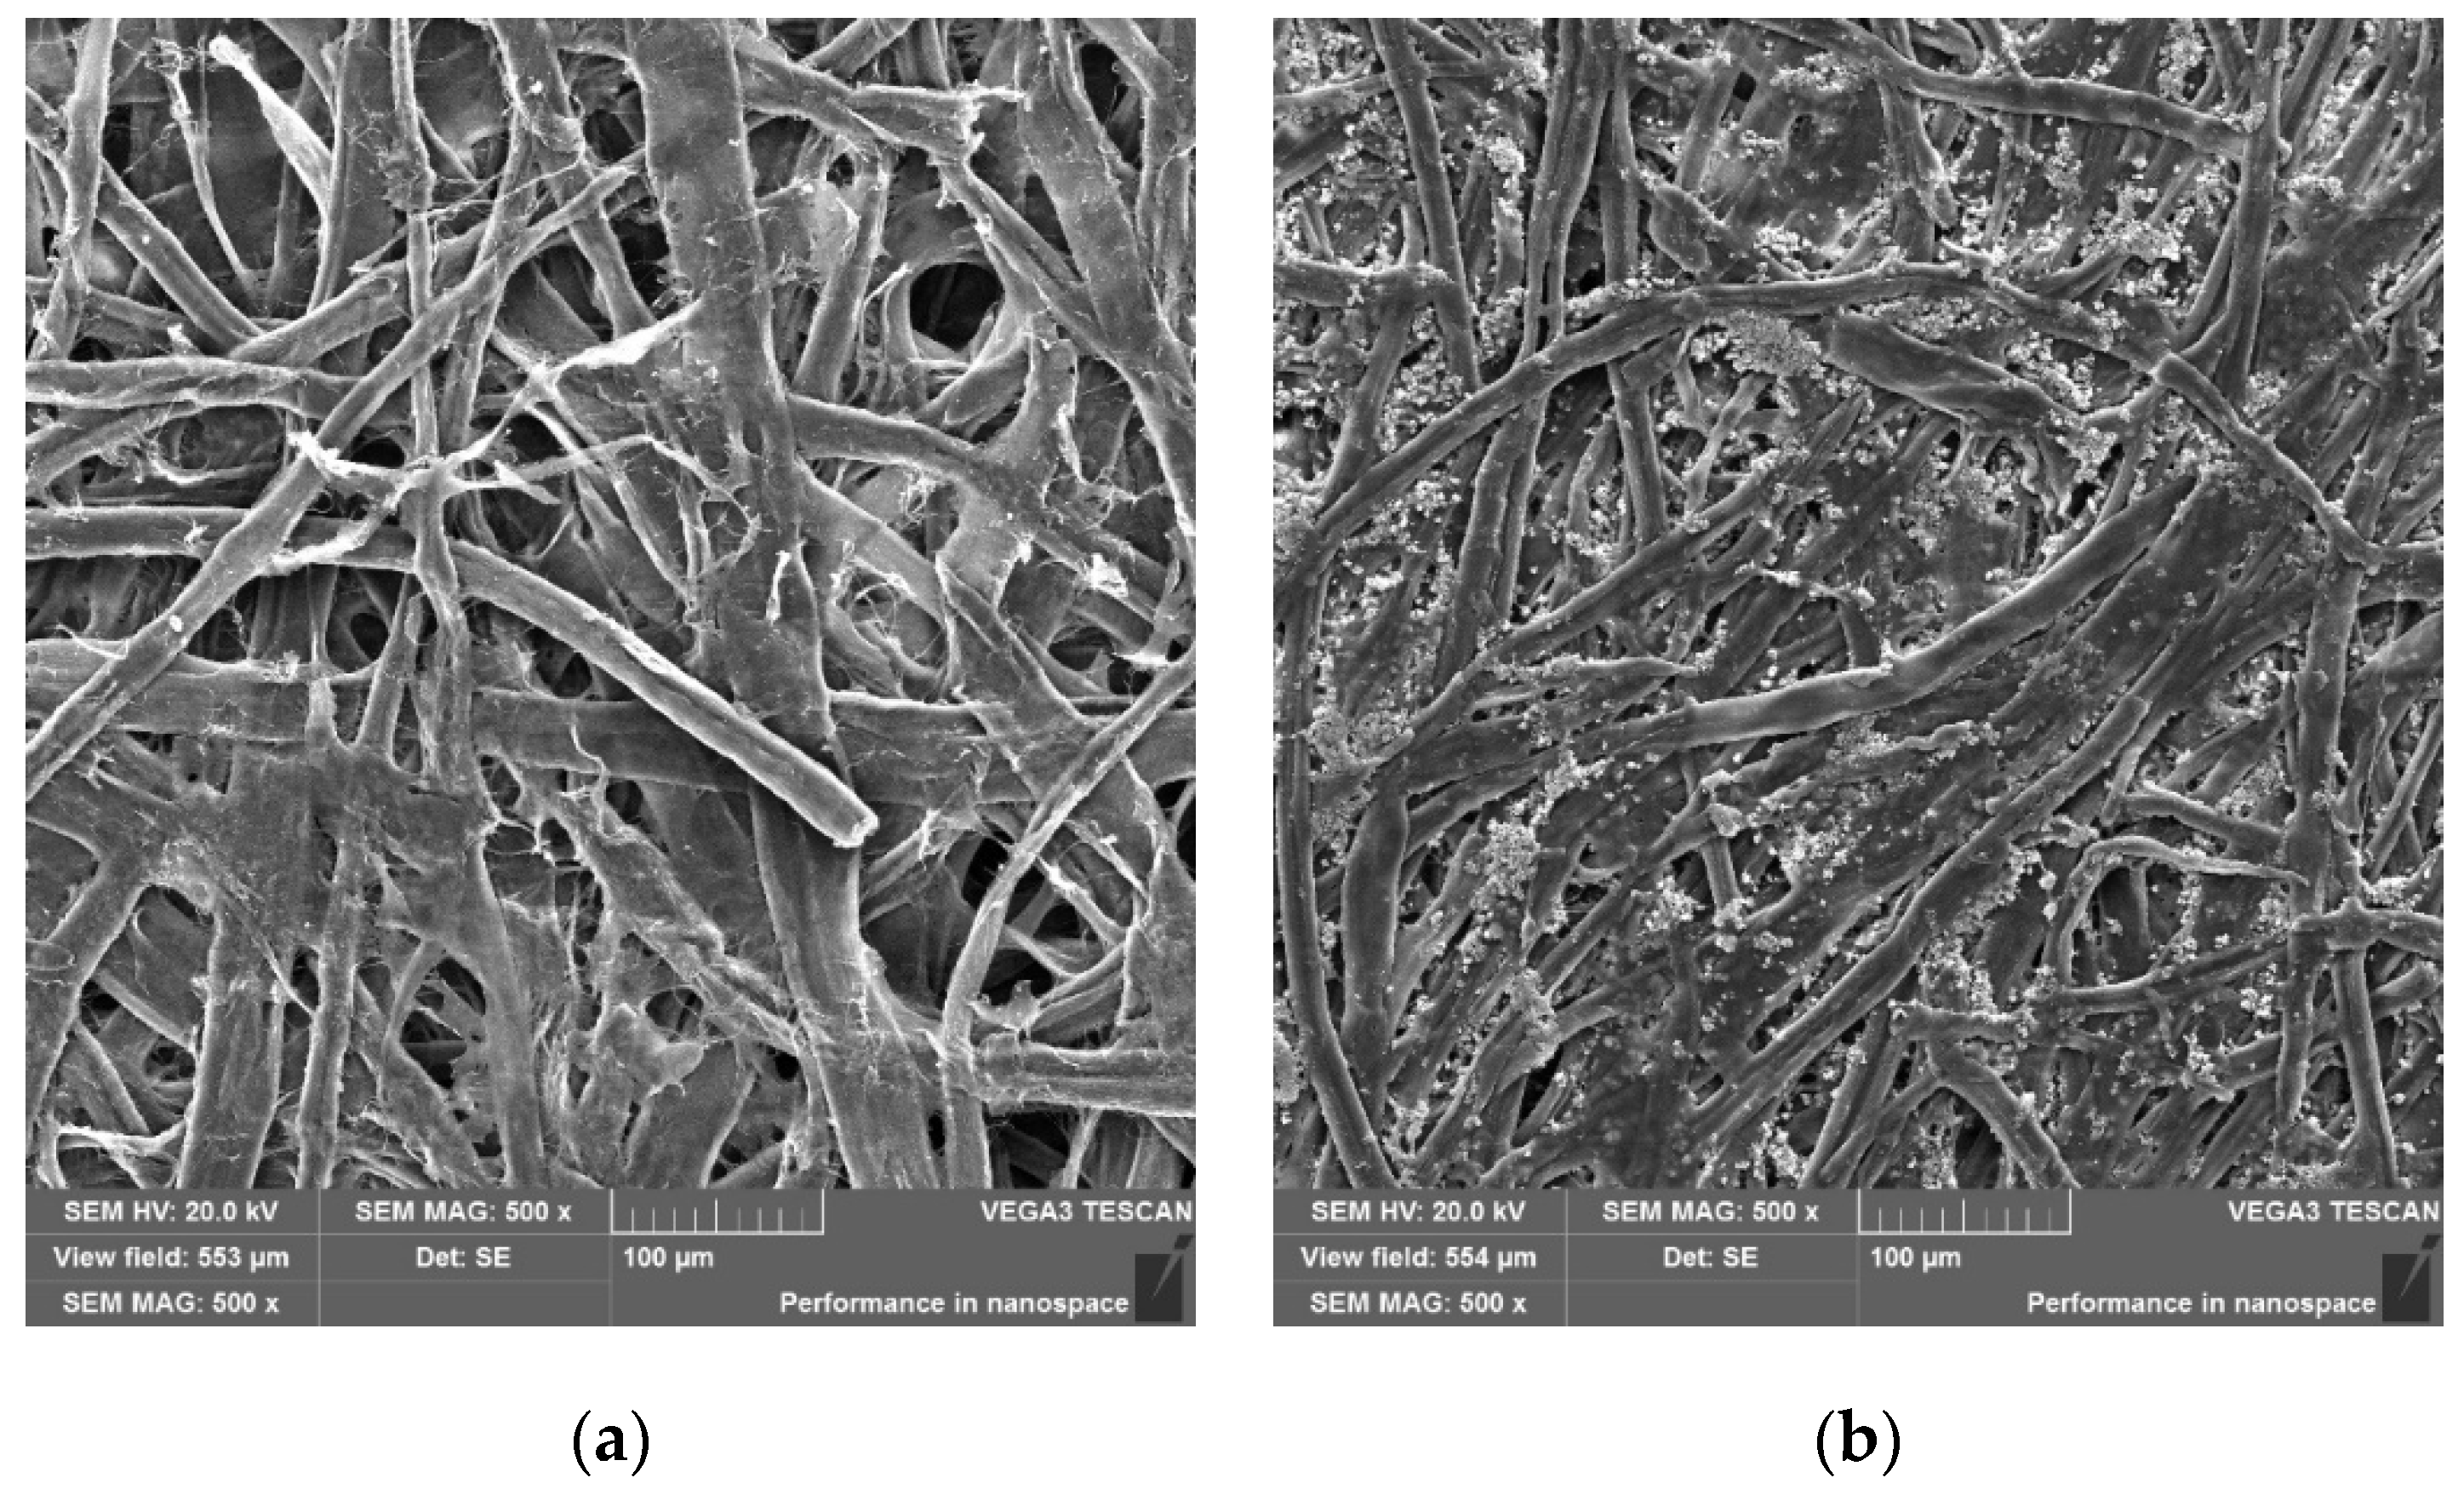
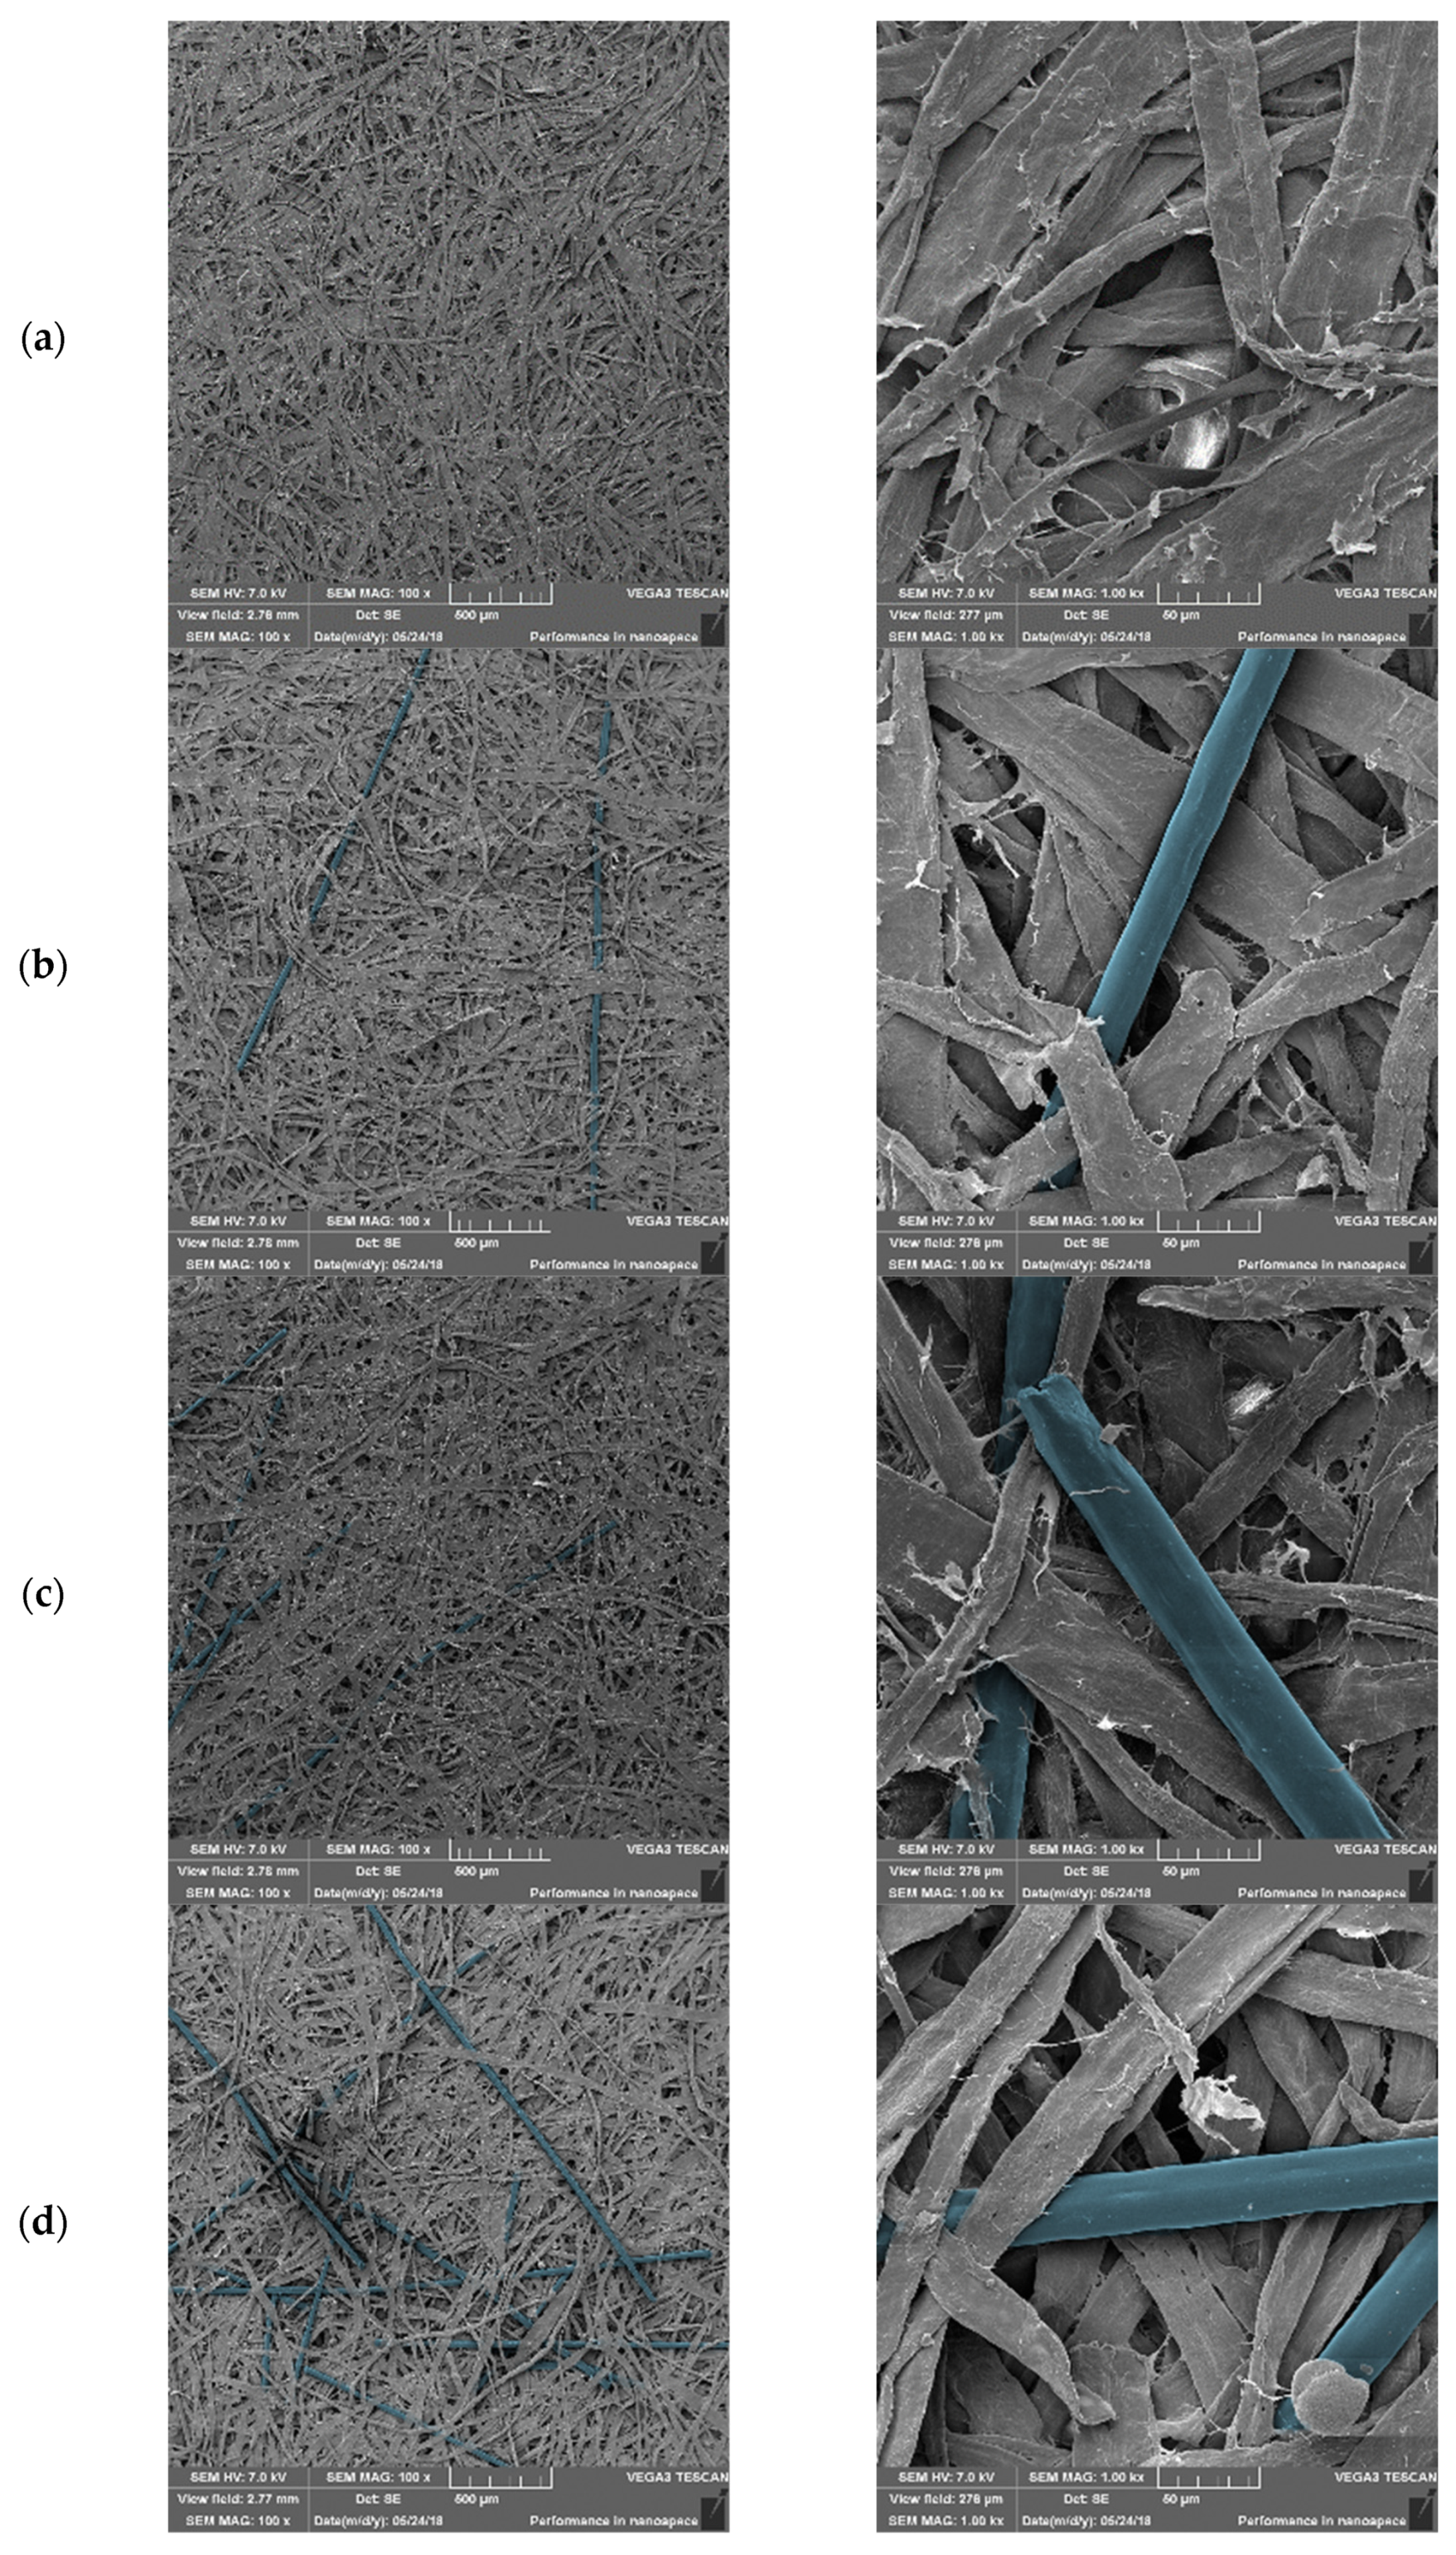
3.3. Morphology and Mechanical Properties of Paper–PAN–PDA Samples
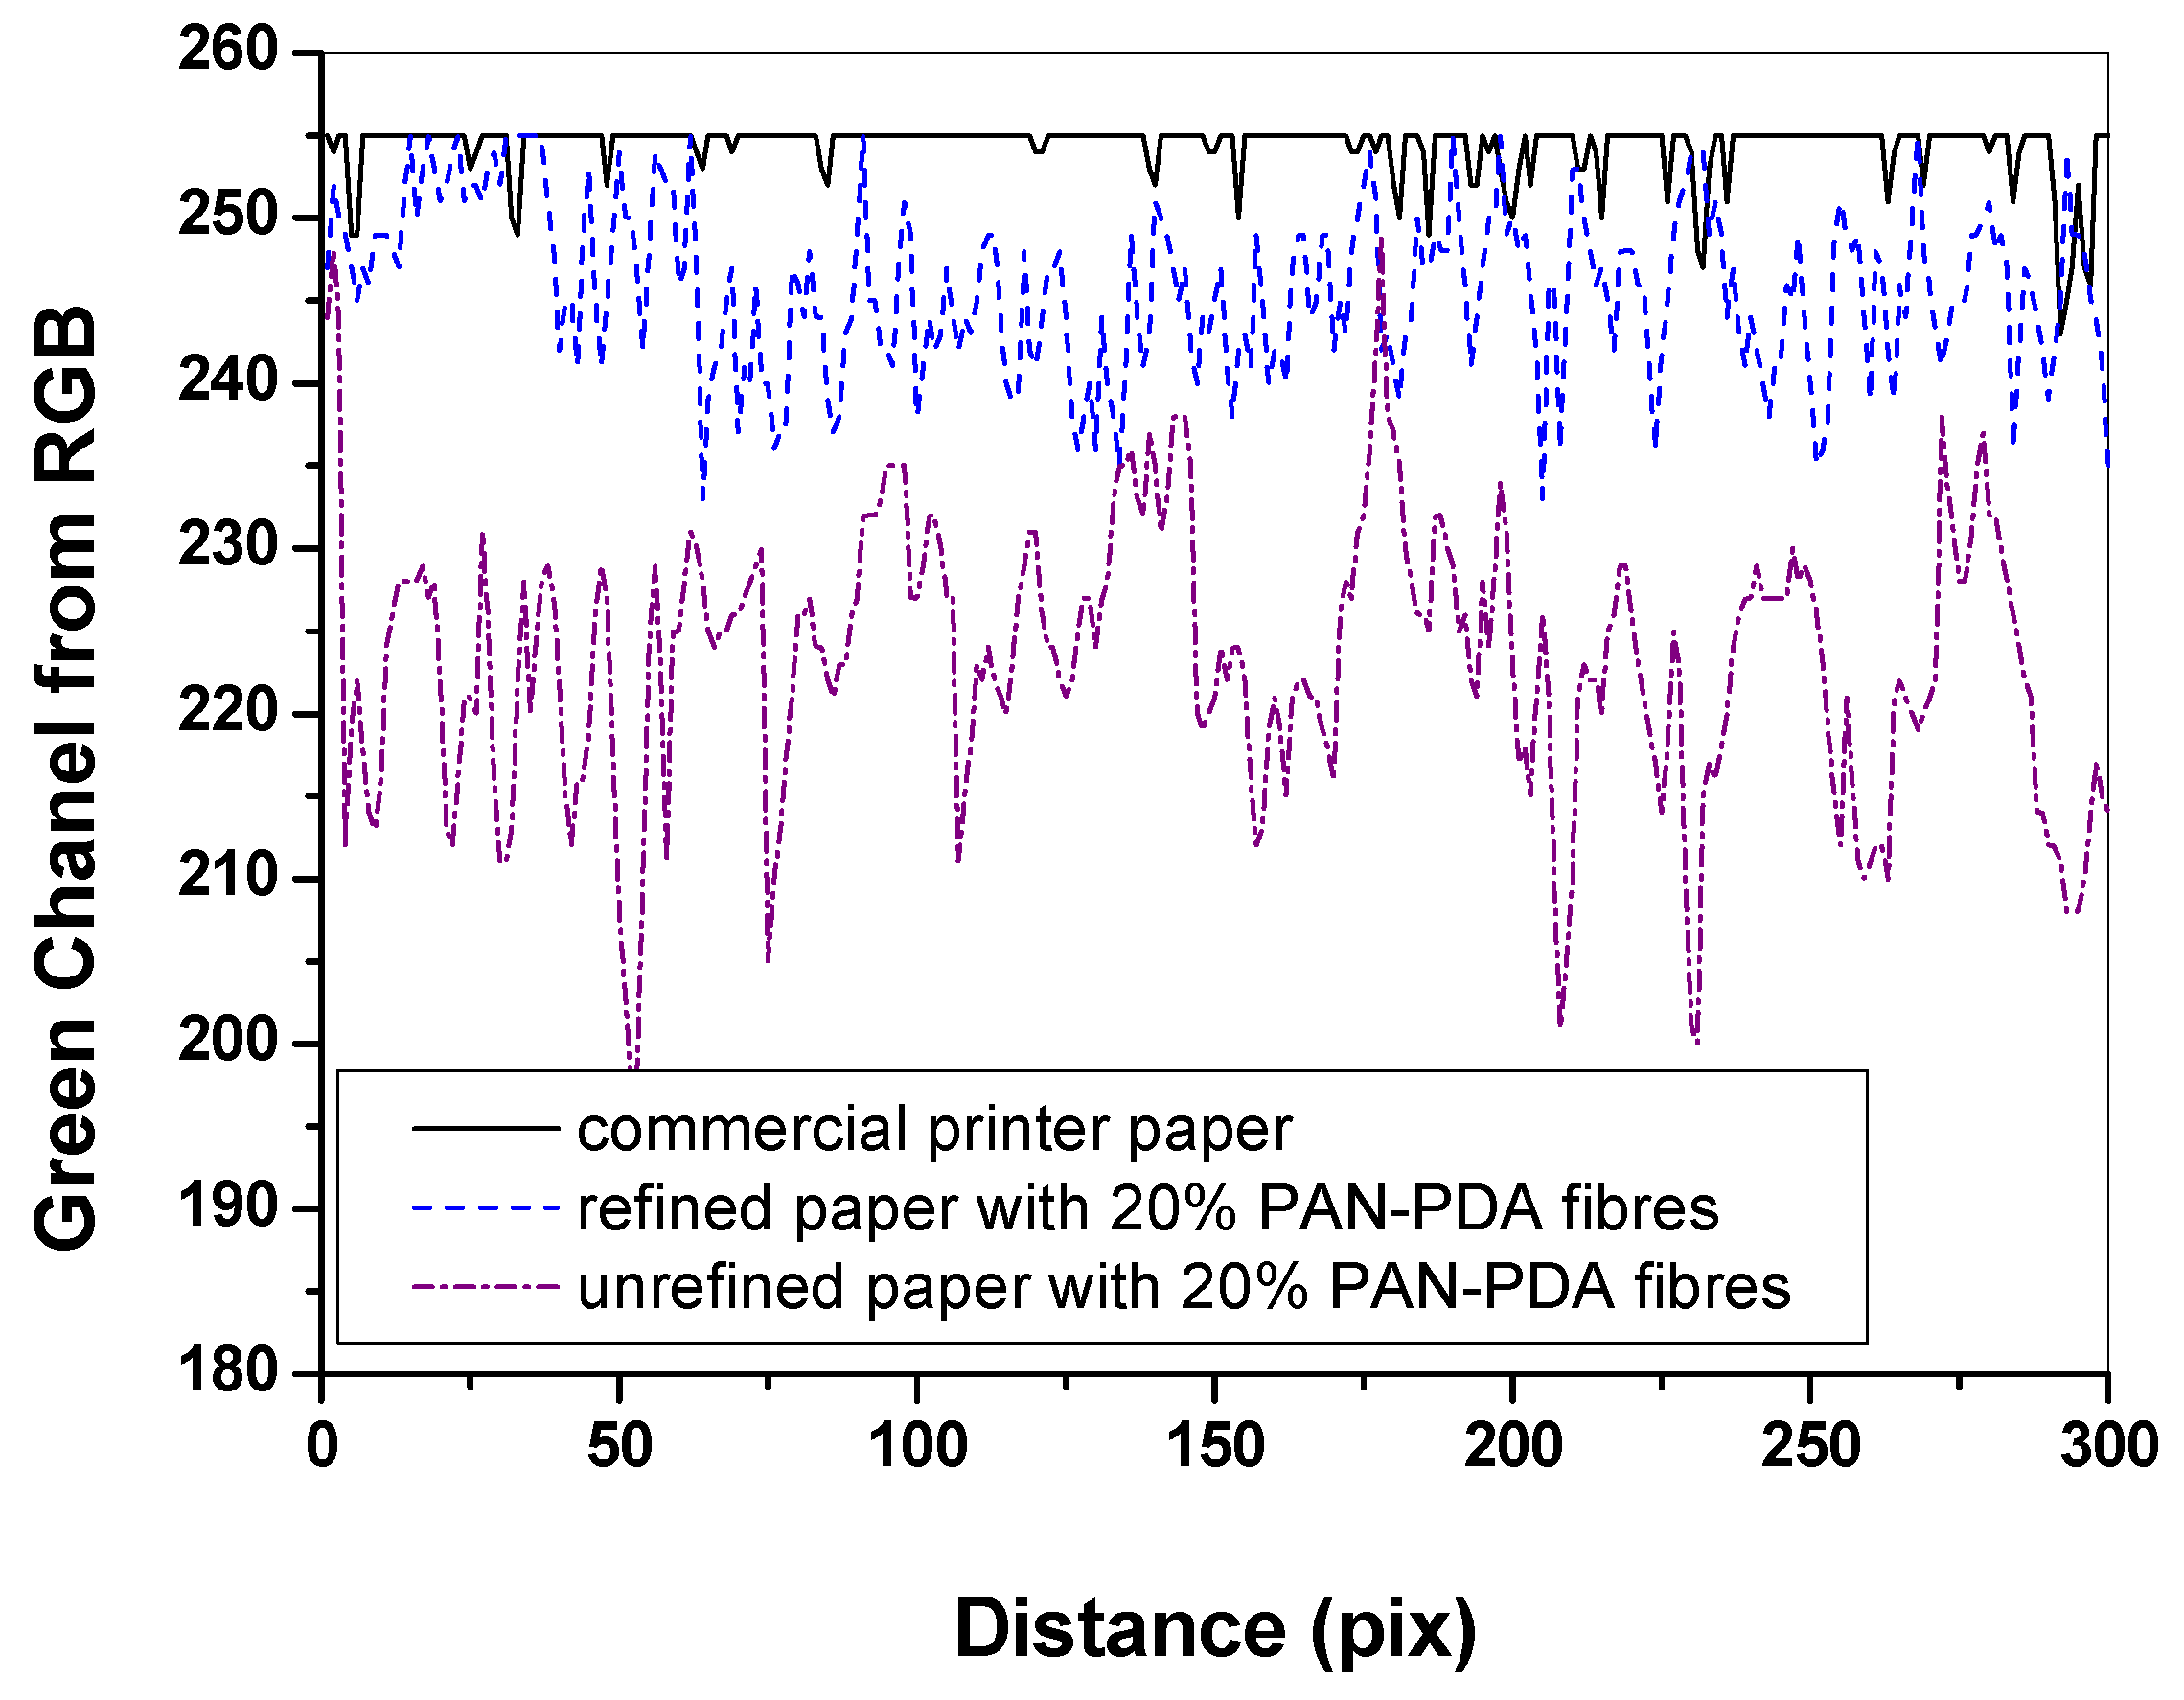
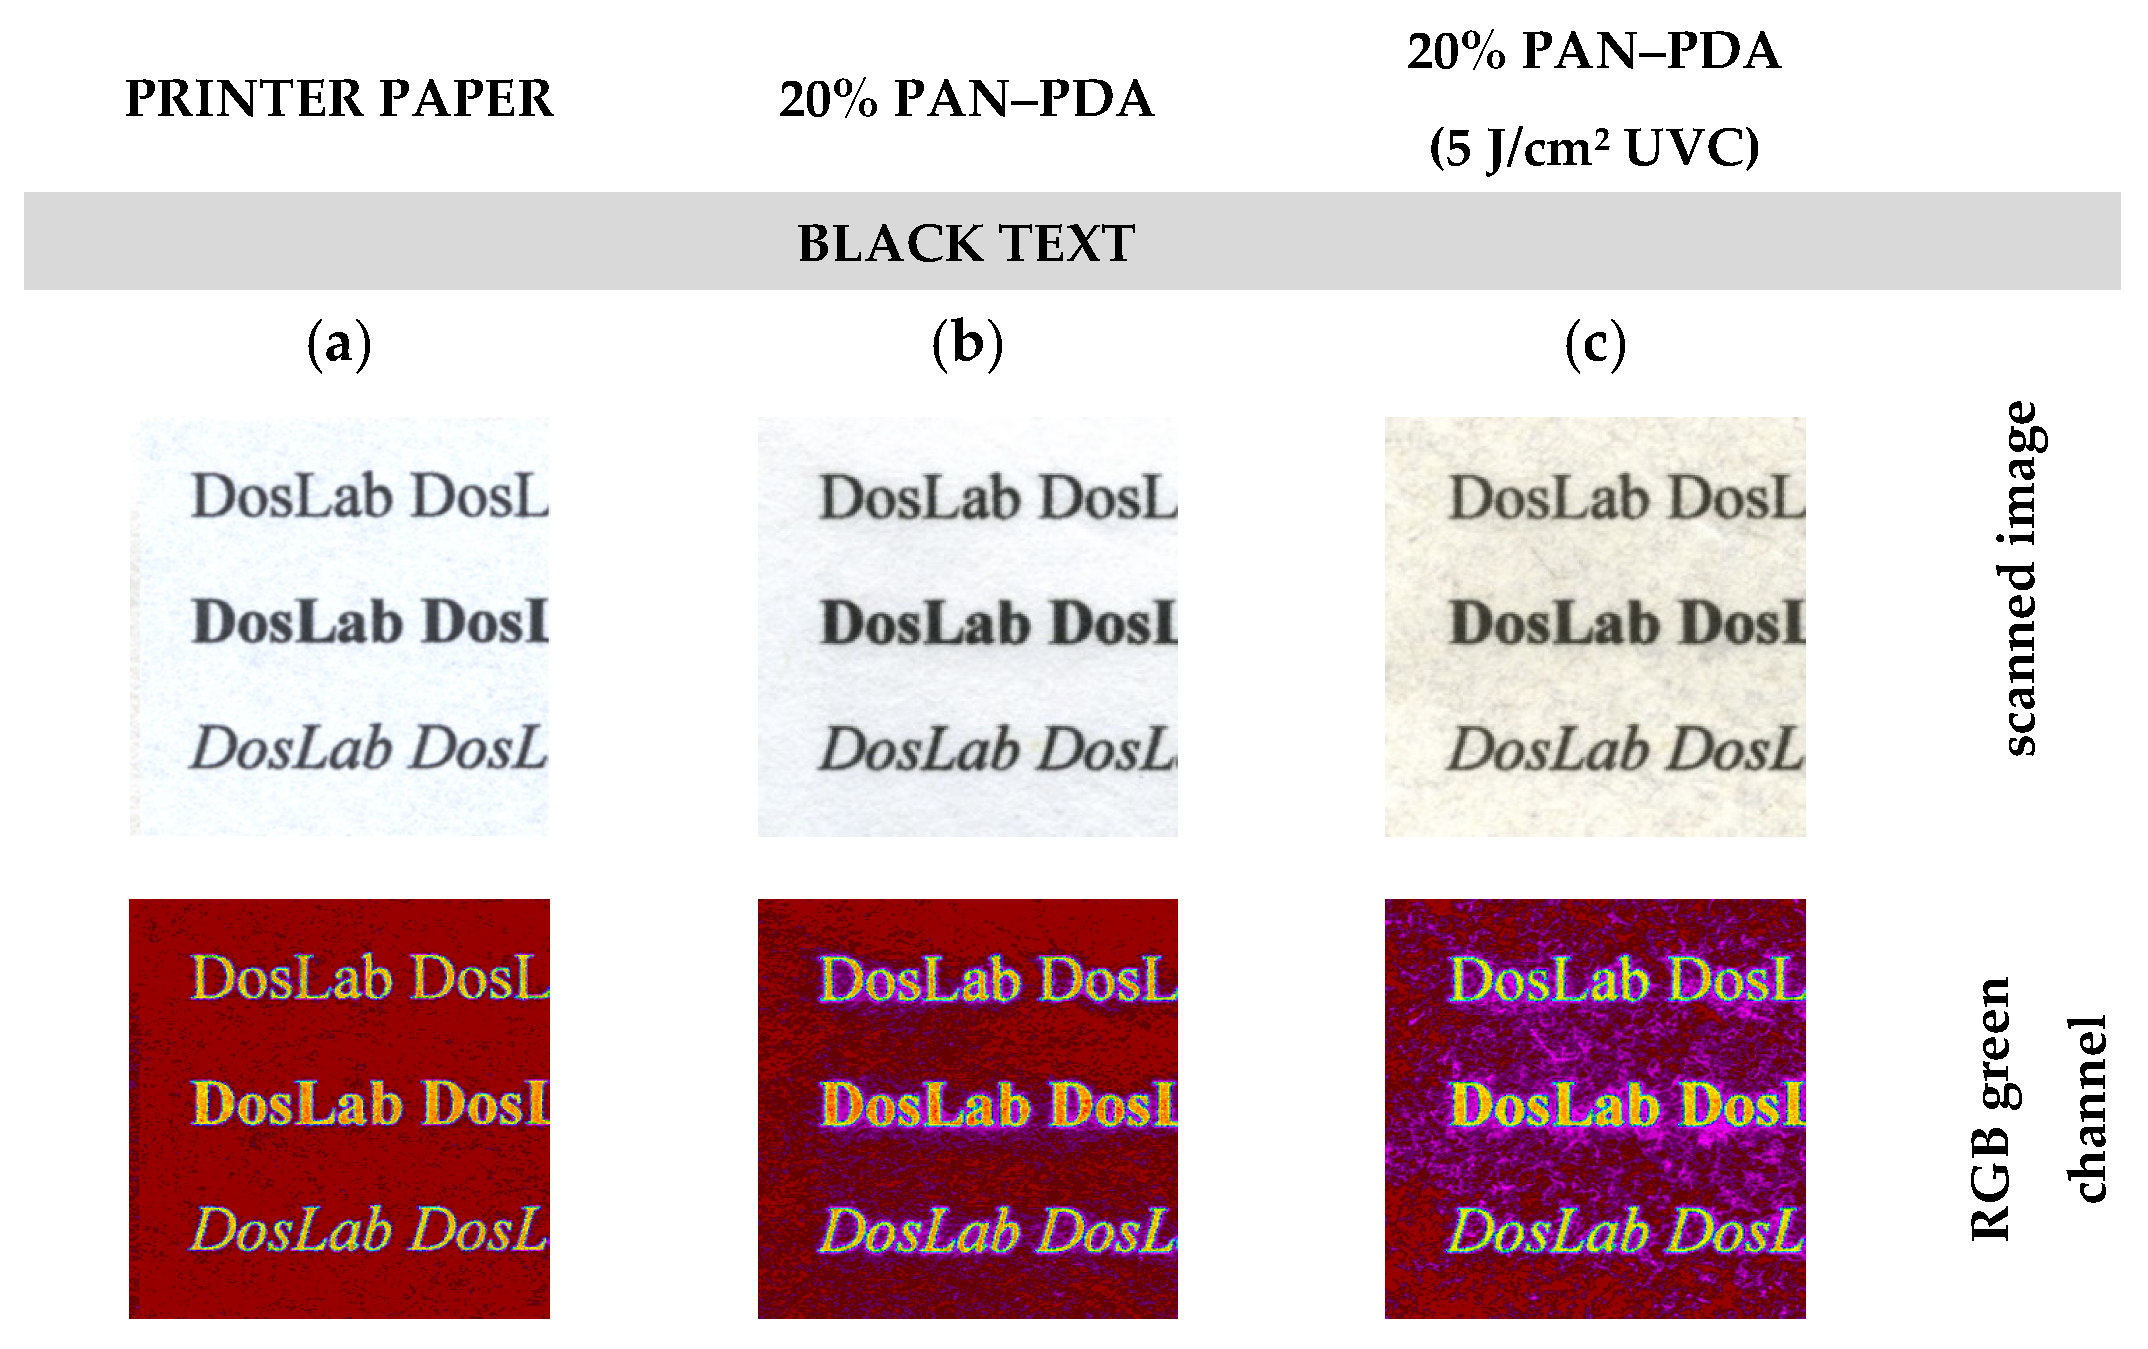
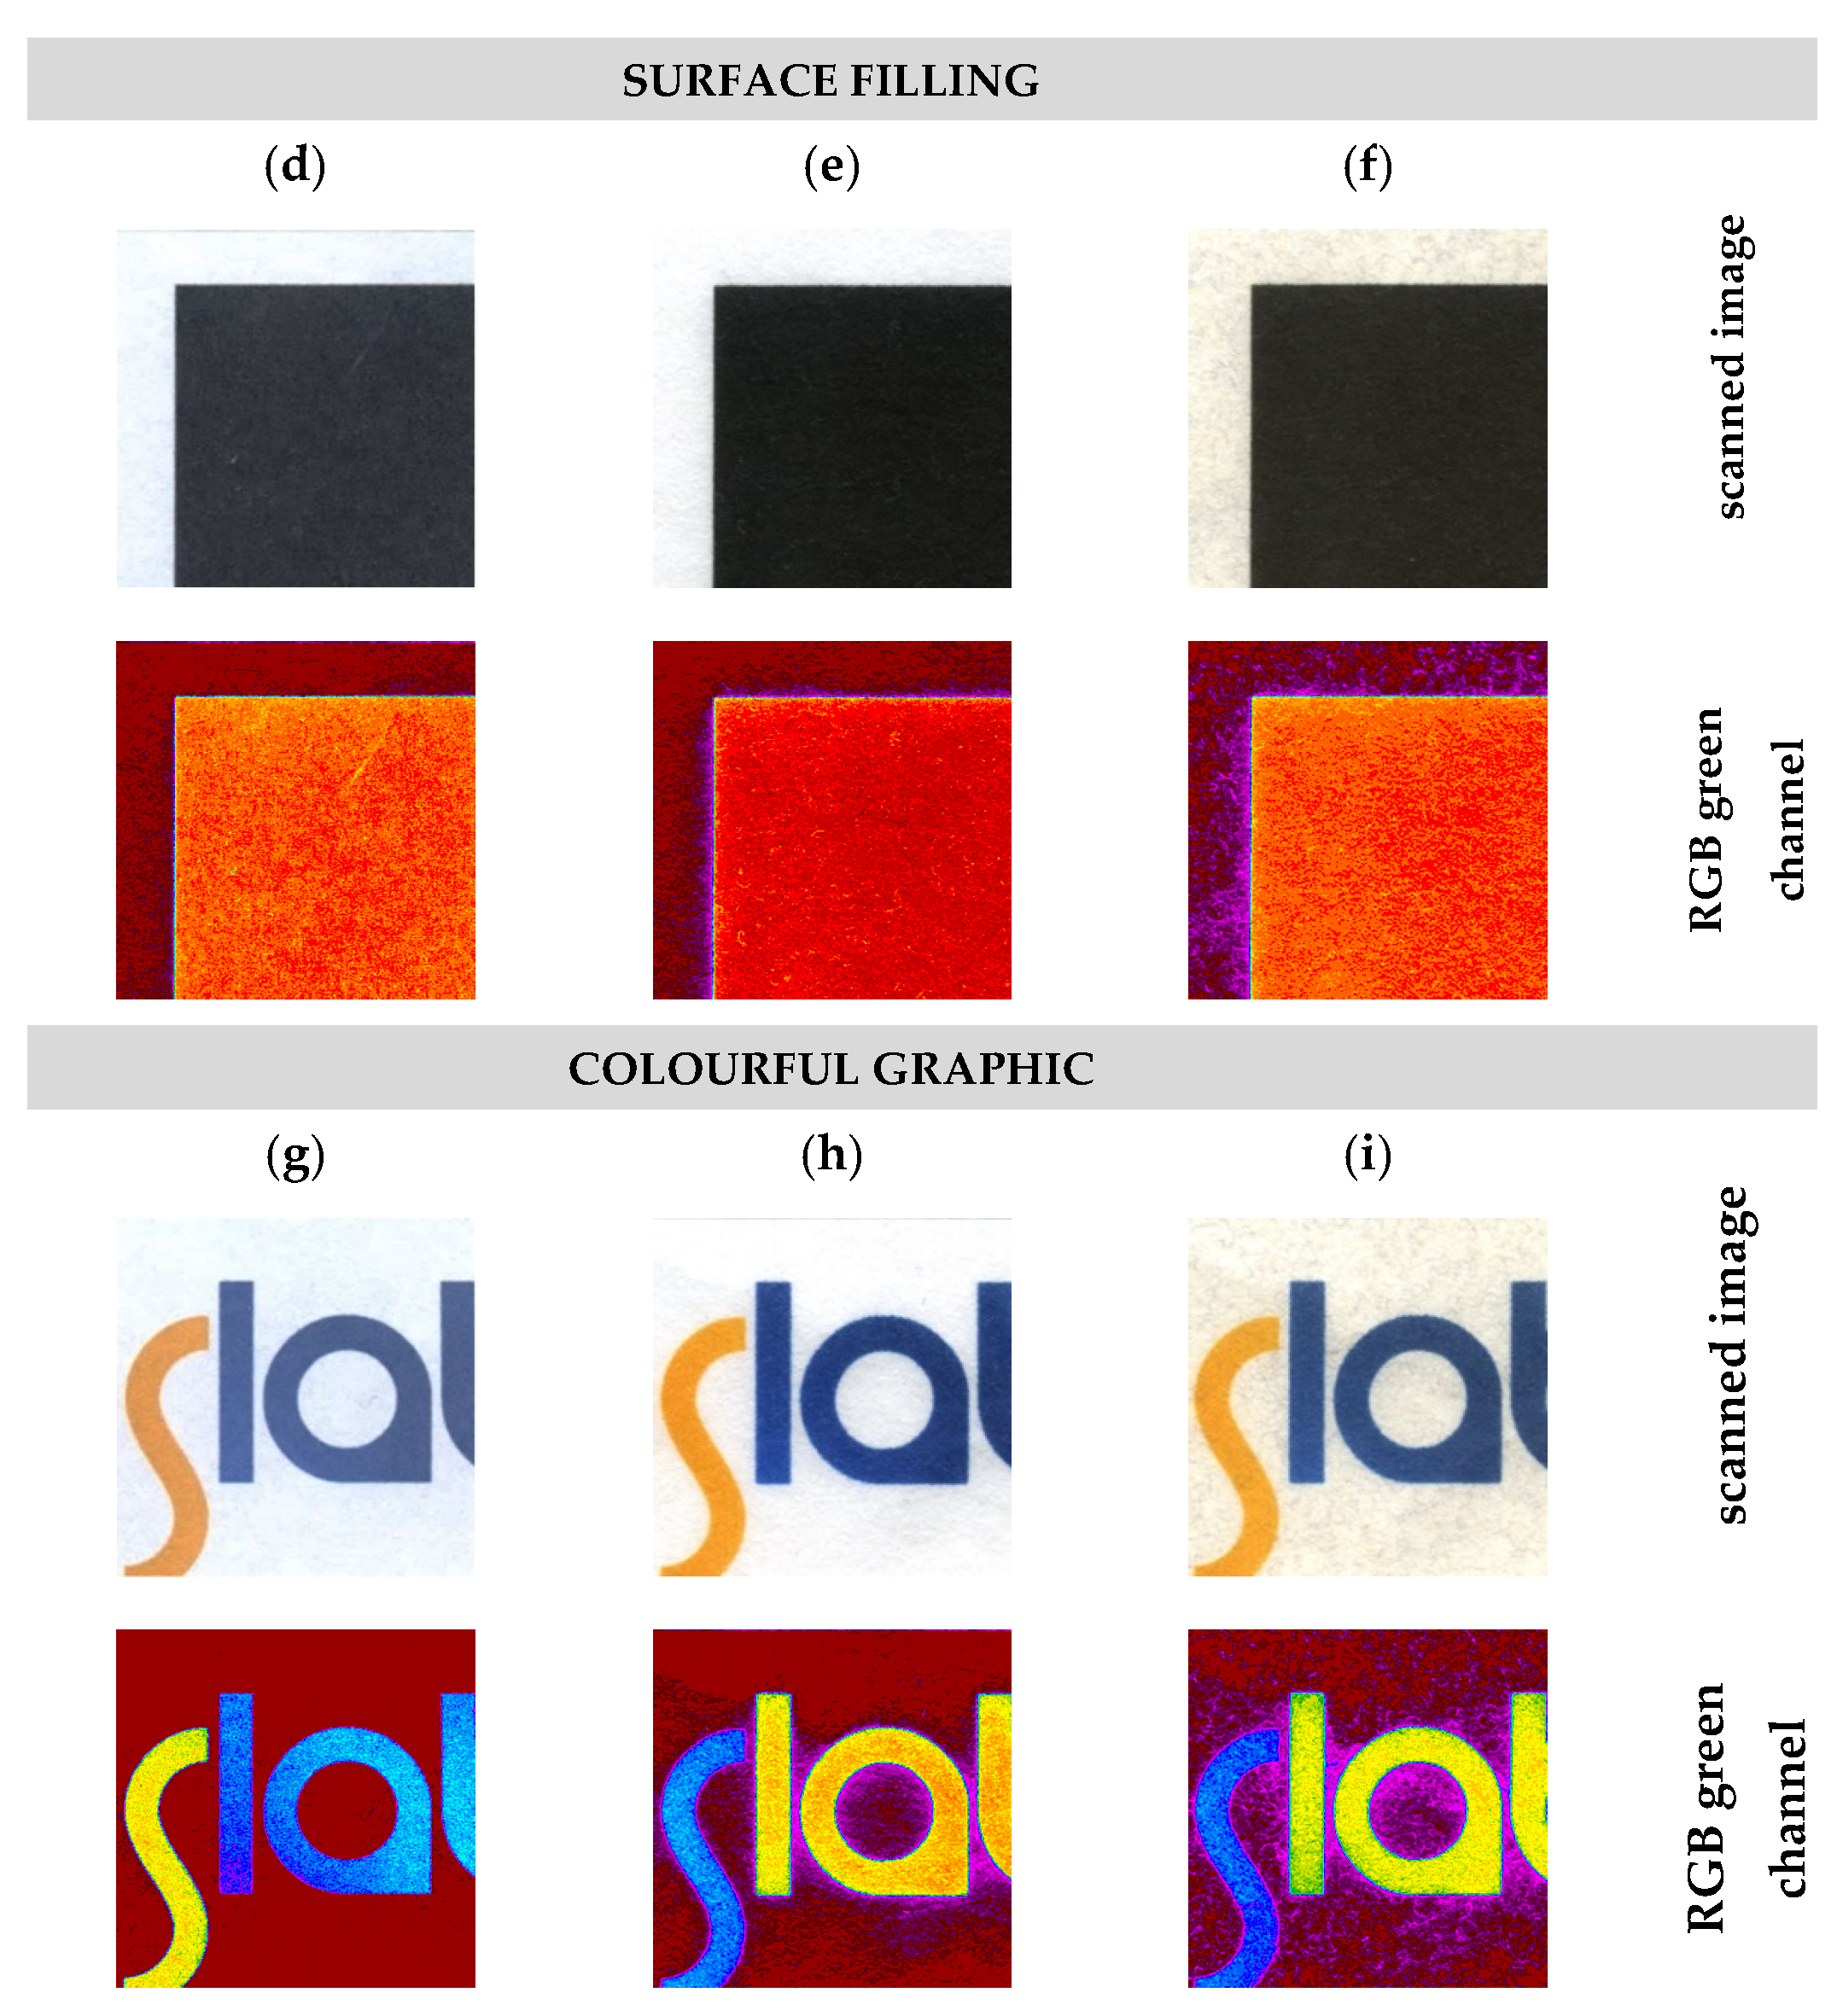
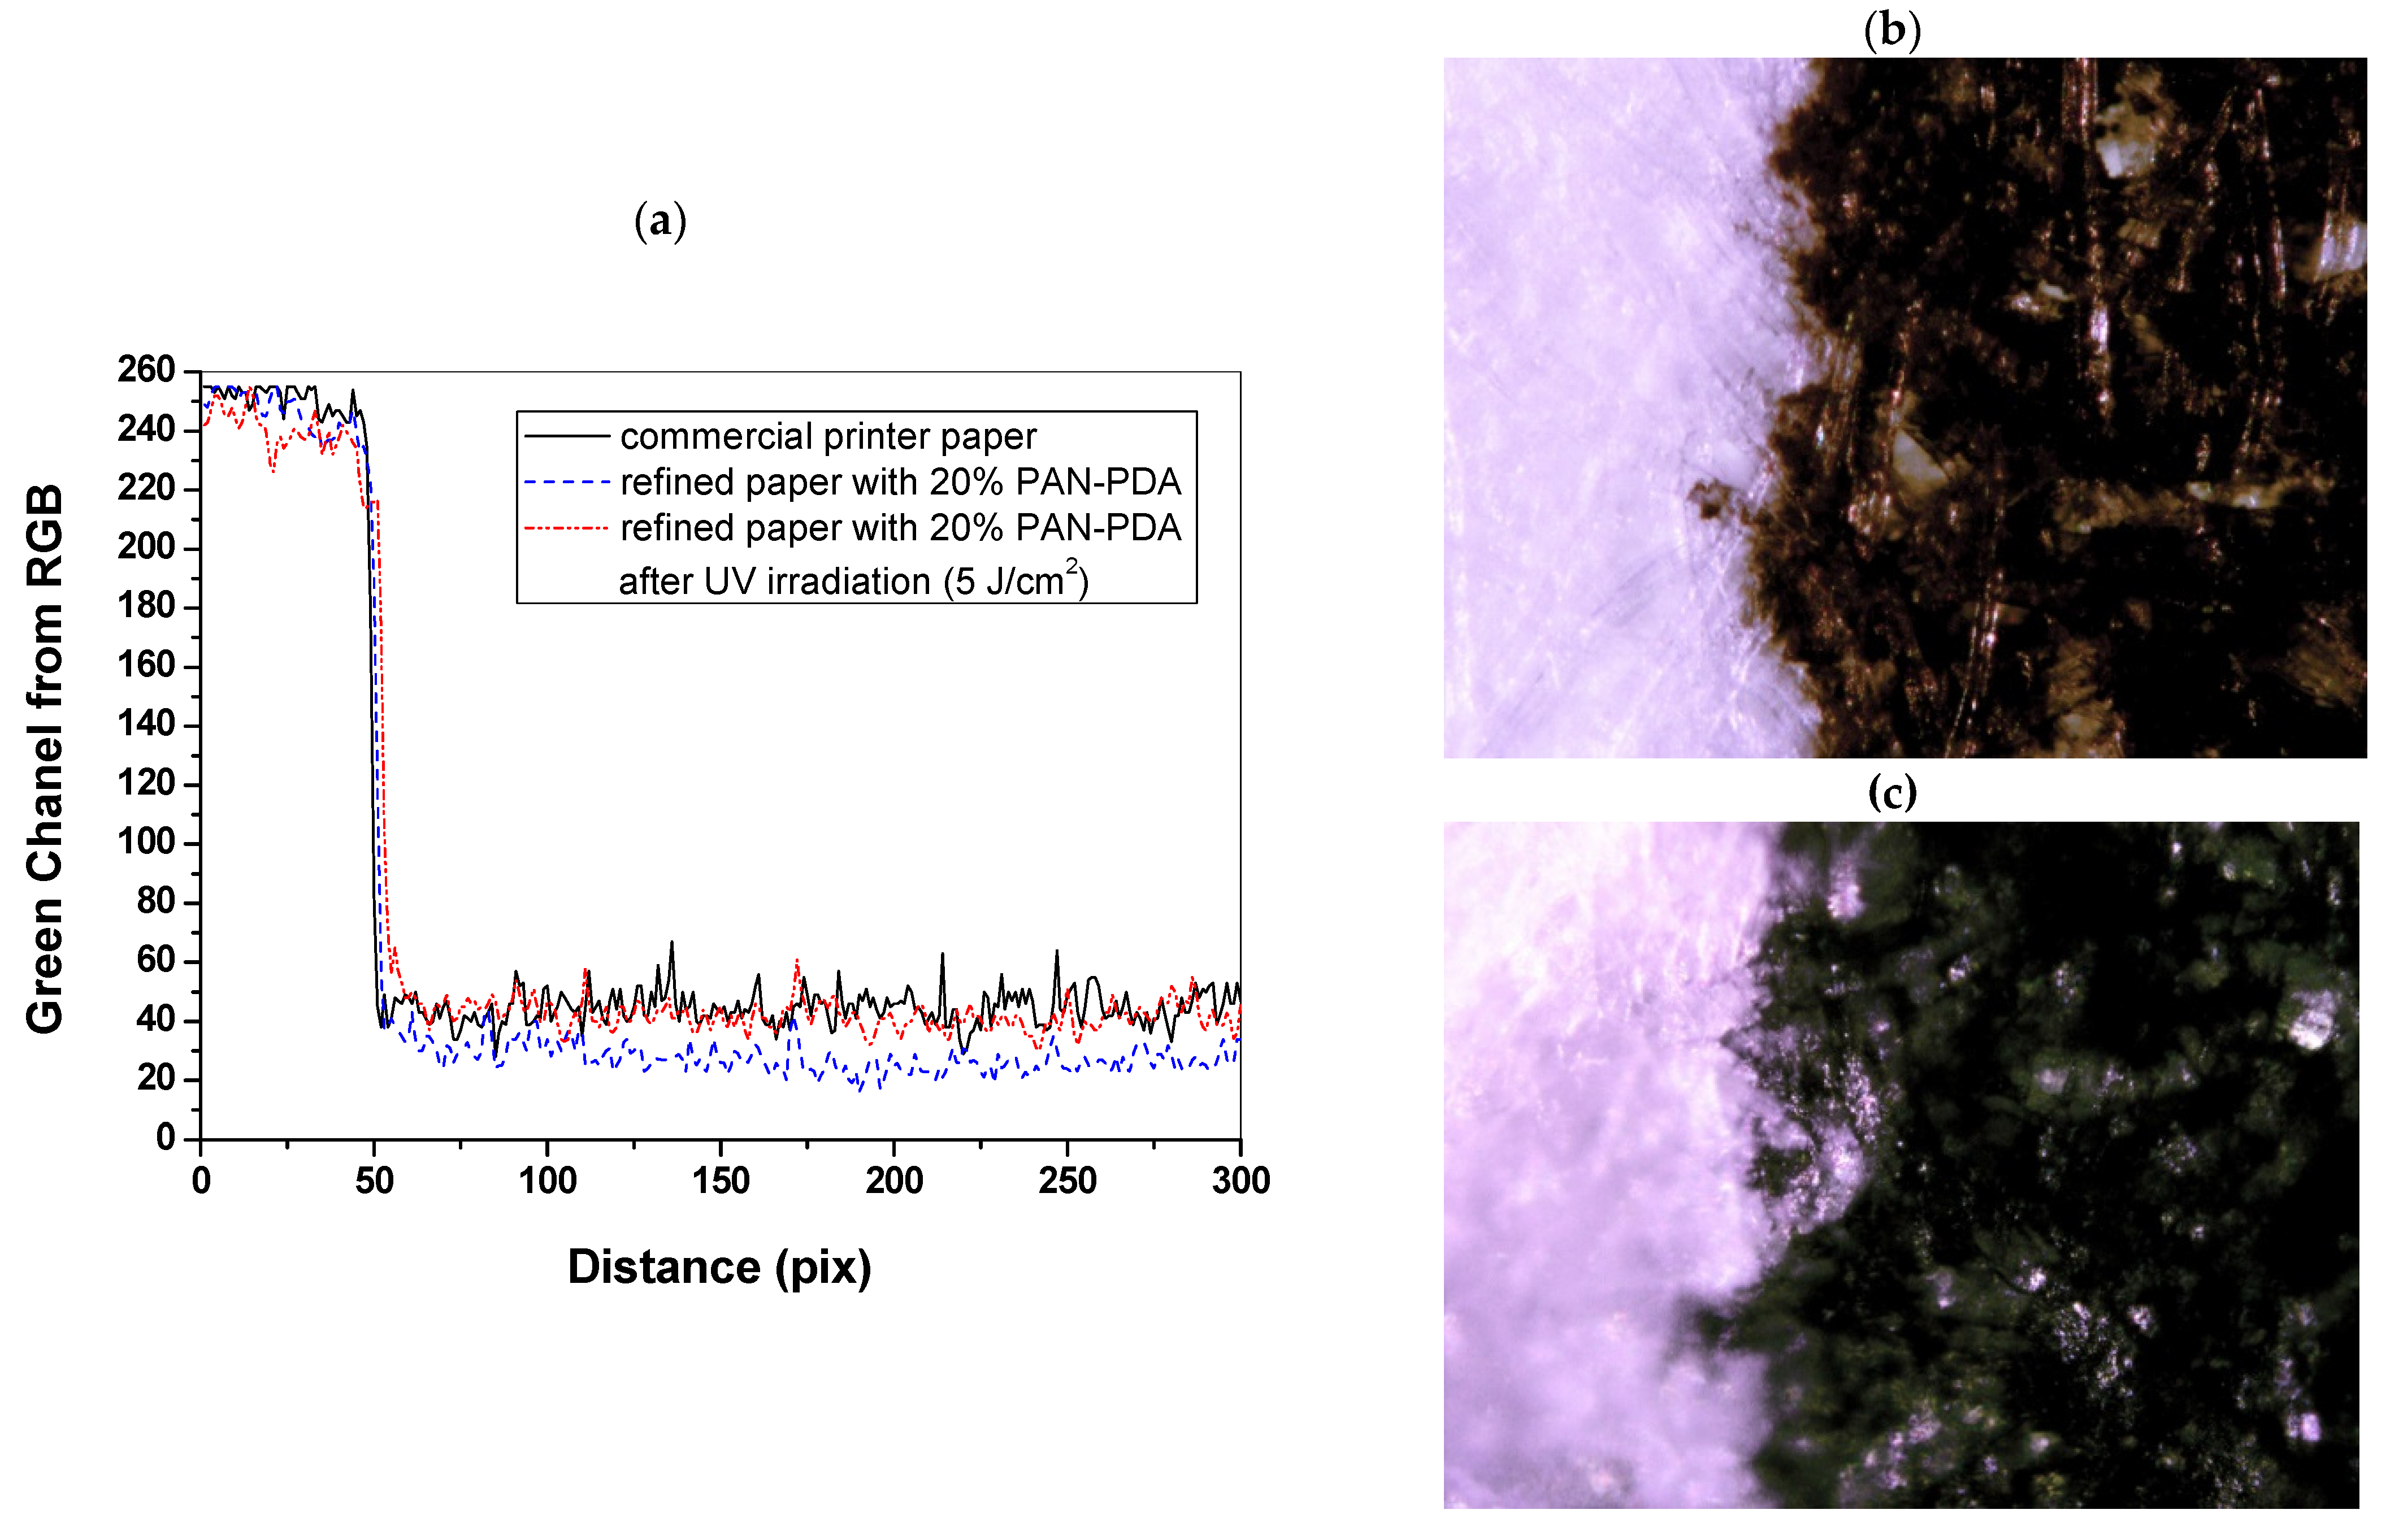
3.4. Evaluation of Paper Surface Unevenness
4. Conclusions
Author Contributions
Funding
Institutional Review Board Statement
Informed Consent Statement
Data Availability Statement
Conflicts of Interest
References
- Ghaani, M.; Gozzolino, C.A.; Castelli, G.; Farris, S. An overview of intelligent packaging technologies in the food sector. Trends Food Sci. Technol. 2016, 51, 1–11. [Google Scholar] [CrossRef] [Green Version]
- Ahvenainen, R. Active and Intelligent Packaging: Novel Food Packaging Techniques, 1st ed.; Woodhead Publishing Limited: Cambridge, UK, 2003. [Google Scholar]
- Biegańska, M.; Gwiazdowska, D.; Kozak, W.; Marchwińska, K. The use of TTI indicators for quality monitoring of freshly squeezed juices. In Proceedings of The International Forum on Agri–Food Logistics II Domestic Scientific Conference AGROLOGISTYKA 2014; Efficient Logistic as a Chance of Efficient Consumer Response in the Agri–Food Sector, Poznan, Poland, 9–13 September 2014; 2014. [Google Scholar]
- Bobalek, J.F.; Hamza, M.F. Paper Products: Security Applications. In Reference Module in Materials Science and Materials Engineering; Elsevier: Amsterdam, The Netherlands, 2016. [Google Scholar] [CrossRef]
- Jakucewicz, S.; Khadzhynova, S. Methods of Securing Documents; WPŁ: Lodz, Poland, 2020. (In Polish) [Google Scholar]
- Khan, R.A.; Lone, S.A. A comprehensive study of document security system, open issues and challenges. Multimed. Tools Appl. 2021, 80, 7039–7061. [Google Scholar] [CrossRef]
- Ahmed, H.A.; Jang, J.W. Higher educational certificate authentication system using QR code tag. Int. J. Appl. Eng. Res. 2017, 12, 9728–9734. [Google Scholar]
- Cozzella, L.; Simonetti, C.; Spagnolo, G.S. Drug packaging security by means of white–light speckle. Opt. Lasers Eng. 2012, 50, 1359–1371. [Google Scholar] [CrossRef]
- De Heij, H. Designing Banknote Identity; Netherlands Central Bank, Research Department: Amsterdam, The Netherlands, 2012. [Google Scholar]
- Van der Horst, F.; Snell, J.; Theeuwes, J. Finding counterfeited banknotes: The roles of vision and touch. Cogn. Res. Princ. Implic. 2020, 5, 2–14. [Google Scholar]
- Purington, E.; Bousfield, D.; Gramlich, W.G. Fluorescent Dye Adsorption in Aqueous Suspension to Produce Tagged Cellulose Nanofibers for Visualization on Paper. Cellulose 2019, 26, 5117–5131. [Google Scholar] [CrossRef] [PubMed]
- Zhang, M.; Wu, X.; Hu, Z.; Xiang, Z.; Song, T.; Lu, F. A Highly Efficient and Durable Fluorescent Paper Produced from Bacterial Cellulose/Eu Complex and Cellulosic Fibers. Nanomaterials 2019, 9, 1322. [Google Scholar] [CrossRef] [PubMed] [Green Version]
- Kozicki, M.; Sąsiadek, E. UV–assisted screen–printing of flat textiles. Color. Technol. 2012, 128, 251–260. [Google Scholar] [CrossRef]
- Kozicki, M.; Sąsiadek, E. Scanning of flat textile–based radiation dosimeters: Influence of parameters on the quality of results. Radiat. Meas. 2013, 58, 87–93. [Google Scholar] [CrossRef]
- Kozicki, M.; Sąsiadek, E.; Karbownik, I.; Maniukiewicz, W. Doped polyacrylonitrile fibres as UV radiation sensors. Sens. Actuators B. Chem. 2015, 213, 234–243. [Google Scholar] [CrossRef]
- Kozicki, M.; Sąsiadek, E.; Kadlubowski, S.; Dudek, M.; Karbownik, I. Radiation sensitive polyacrylonitrile microfibres doped with PDA nano–particles. Radiat. Phys. Chem. 2020, 169, 107751. [Google Scholar] [CrossRef]
- Kamphan, A.; Traiphol, N.; Traiphol, R. Versatile route to prepare reversible thermochromic polydiacetylenenanocomposite using low molecular weight poly(vinylpyrrolidone). Colloid Surf. A 2016, 497, 370–377. [Google Scholar] [CrossRef]
- Guo, J.; Zhu, L.; Jiang, M.; Chen, D. Deliberately designed processes to physically tether the carboxyl groups of poly(pentacosadiynoic acid) to a poly(vinyl alcohol) glassy matrix to make poly(pentacosadiynoic acid) thermochromically reversible in the matrix. Langmuir 2011, 27, 6651–6660. [Google Scholar] [CrossRef] [PubMed]
- Seto, K.; Hosoi, Y.; Furukawa, Y. Raman spectra of Langmuir–Blodgett and Langmuir–Schaefer films of polydiacetylene prepared from 10,12–pentacosadiynoic acid. Chem. Phys. Lett. 2007, 444, 328–332. [Google Scholar] [CrossRef]
- Sadagopan, K.; Sawant, S.N.; Kulshreshtha, S.K.; Jarori, G.K. Physical and chemical characterization of enolase immobilized polydiacetylene Langmuir–Blodgett film. Sens. Actuators B–Chem. 2006, 115, 526–533. [Google Scholar] [CrossRef]
- ISO 5263–1:2004. Pulps—Laboratory Wet Disintegration—Part 1: Disintegration of Chemical Pulps; International Organization for Standardization: Geneva, Switzerland, 2004. [Google Scholar]
- TAPPI/ANSI T 248 sp–15. Laboratory Beating of Pulp (PFI Mill Method); Test Method, TAPPI Standards: Norcross, GA, USA, 2015. [Google Scholar]
- ISO 5267–1:1999. Pulps—Determination of Drainability—Part 1: Schopper–Riegler Method; International Organization for Standardization: Geneva, Switzerland, 1999. [Google Scholar]
- ISO 5269–2:2005. Pulps—Preparation of Laboratory Sheets for Physical Testing—Part 2: Rapid–Köthen Method; International Organization for Standardization: Geneva, Switzerland, 2005. [Google Scholar]
- ISO 187:1999. Paper, Board and Pulps—Standard Atmosphere for Conditioning and Testing and Procedure for Monitoring the Atmosphere and Conditioning of Samples; International Organization for Standardization: Geneva, Switzerland, 1999. [Google Scholar]
- ISO 536:2019. Paper and Board—Determination of Grammage; International Organization for Standardization: Geneva, Switzerland, 2019. [Google Scholar]
- ISO 534:2011. Paper and Board—Determination of Thickness, Density and Specific Volume; International Organization for Standardization: Geneva, Switzerland, 2011. [Google Scholar]
- ISO 1924–2:2008. Paper and Board—Determination of Tensile Properties—Part 2: Constant Rate of Elongation Method (20 mm/min); International Organization for Standardization: Geneva, Switzerland, 2008. [Google Scholar]
- ISO 1974:2012. Paper—Determination of Tearing Resistance—Elmendorf Method; International Organization for Standardization: Geneva, Switzerland, 2012. [Google Scholar]
- ISO 8791–2:2013. Paper and Board—Determination of Roughness/Smoothness (Air Leak Methods)—Part 2: Bendtsen Method; International Organization for Standardization: Geneva, Switzerland, 2013. [Google Scholar]
- ISO 2758:2014. Paper—Determination of Bursting Strength; International Organization for Standardization: Geneva, Switzerland, 2014. [Google Scholar]
- Stankovska, M.; Gigac, J.; Letko, M.; Opalena, E. The effect of surface sizing on paper wettability and on properties of inkjet prints. Wood Res. 2014, 59, 67–76. [Google Scholar]
- Araghi, H.Y.; Giri, N.K.; Paige, M.F. Polarized fluorescence microscopy analysis of patterned, polymerized perfluorotetradecanoic acid–pentacosadiynoic acid thin films. Spectrochim. Acta Part A Mol. Biomol. Spectrosc. 2014, 129, 339–344. [Google Scholar] [CrossRef] [PubMed]
- Araghi, H.Y.; Paige, M.F. Insight into diacetylene photopolymerization in Langmuir- Blodgett films using simultaneous AFM and fluorescence microscopy imaging. Surf. Interface Anal. 2017, 49, 1108–1114. [Google Scholar] [CrossRef]
- Yeboah, A.; Sowah–Kuma, D.; Bu, W.; Paige, M.F. Single–Molecule Fluorescence Spectroscopy of Phase–Separated 10,12–Pentacosadiynoic Acid Films. J. Phys. Chem. B. 2021, 22, 3953–3962. [Google Scholar] [CrossRef] [PubMed]


| Dopant Content (%) | CIE Lab Values | UVA Dose (J/cm2) | UVB Dose (J/cm2) | UVC Dose (J/cm2) | ||||||
|---|---|---|---|---|---|---|---|---|---|---|
| 0 | 1 | 10 | 0 | 1 | 10 | 0 | 1 | 10 | ||
| 0 | L | 92.41 | 90.80 | 90.82 | 90.53 | 90.86 | 90.62 | 91.03 | 92.71 | 90.62 |
| a | −0.14 | −0.11 | 0.11 | 0.32 | −0.35 | −0.51 | 0.15 | −0.42 | −0.80 | |
| b | 1.04 | 1.27 | 1.86 | 1.40 | 2.05 | 5.26 | 1.17 | 2.53 | 4.39 | |
| 5 | L | 91.73 | 90.80 | 91.32 | 91.23 | 90.47 | 89.50 | 91.13 | 89.47 | 89.49 |
| a | −0.06 | 0.17 | −0.03 | −0.03 | −0.31 | −0.40 | −0.04 | −0.32 | −0.17 | |
| b | 1.36 | 1.55 | 1.72 | 1.17 | 1.74 | 3.64 | 1.55 | 2.09 | 4.11 | |
| 10 | L | 91.54 | 90.76 | 90.54 | 91.13 | 90.46 | 87.76 | 91.26 | 88.25 | 87.23 |
| a | −0.04 | −0.04 | 0.13 | 0.07 | −0.22 | 0.03 | 0.06 | 0.01 | 0.98 | |
| b | 1.49 | 1.78 | 1.90 | 1.65 | 1.90 | 2.46 | 1.51 | 0.91 | 3.60 | |
| 20 | L | 91.29 | 90.80 | 89.60 | 90.54 | 88.93 | 86.08 | 90.66 | 84.74 | 84.35 |
| a | 0.20 | 0.15 | 0.30 | 0.21 | −0.34 | 0.32 | 0.14 | 0.46 | 1.72 | |
| b | 1.56 | 1.83 | 1.74 | 1.72 | 1.18 | 1.84 | 1.84 | −0.01 | 3.34 | |
| UV Energy | PDA Dopant (%) | Threshold Dose (J cm–2) | Dynamic Range (J cm–2) | Quasi Linear Range (J cm–2) | A (% cm2 J–1) | A0 | R2 |
|---|---|---|---|---|---|---|---|
| UVA | 5 | – | – | – | – | – | – |
| 10 | 2 | 2–10 | – | – | – | – | |
| 20 | 2 | 2–10 | – | – | – | – | |
| UVB | 5 | 0.05 | 0.05–10 | 0.5–1.5 | –0.0017 ± 0.0004 | 79.37 | 0.8941 |
| 10 | 0.025 | 0.025–10 | 0.25–2.5 | –0.0013 ± 0.0003 | 78.61 | 0.9041 | |
| 20 | 0.025 | 0.025–10 | 0.1–2 | –0.0025 ± 0.0003 | 77.65 | 0.9570 | |
| UVC | 5 | 0.025 | 0.025–5 | 0.025–0.75 | –0.0074 ± 0.0015 | 78.82 | 0.9108 |
| 10 | 0.025 | 0.025–10 | 0.025–0.5 | –0.0119 ± 0.0017 | 78.45 | 0.9579 | |
| 20 | 0.025 | 0.025–10 | 0.025–0.5 | –0.0236 ± 0.0054 | 76.59 | 0.9519 |
| PAN–PDA Fibre Content (%) | Apparent Density (g/cm3) | Roughness (mL/min) | Tensile Index (N × m/g) | Elongation (%) | Tear Index (m2 × mN/g) | Bursting Index (kPa × m2/g) | |
|---|---|---|---|---|---|---|---|
| 0 | 0.508 | 315.33 | 20.32 | 3.27 | 3.82 | 1.22 | |
| 0.004 | 37.34 | 0.43 | 1.16 | 1.56 | 2.18 | SD | |
| 0.007 | 0.118 | 0.02 | 0.35 | 0.41 | 0.03 | COV, % | |
| 5 | 0.496 | 393.22 | 20.13 | 2.91 | 3.42 | 1.23 | |
| 0.009 | 39.544 | 0.82 | 0.41 | 0.02 | 5.27 | SD | |
| 0.018 | 0.101 | 0.04 | 0.14 | 0.01 | 0.07 | COV, % | |
| 10 | 0.490 | 505.11 | 16.55 | 2.85 | 3.30 | 1.12 | |
| 0.008 | 70.113 | 3.98 | 0.12 | 0.03 | 4.73 | SD | |
| 0.016 | 0.139 | 0.24 | 0.04 | 0.01 | 0.06 | COV, % | |
| 20 | 0.452 | 613.11 | 16.17 | 2.52 | 2.49 | 0.98 | |
| 0.009 | 91.820 | 0.83 | 0.50 | 0.09 | 3.82 | SD | |
| 0.019 | 0.150 | 0.05 | 0.20 | 0.04 | 0.06 | COV, % | |
| 20 * | 0.506 | 427.12 | 18.78 | 2.90 | 3.39 | 1.21 | |
| 0.009 | 32.93 | 0.96 | 0.27 | 0.03 | 0.08 | SD | |
| 1.760 | 7.71 | 5.13 | 9.31 | 0.89 | 6.62 | COV, % |
Publisher’s Note: MDPI stays neutral with regard to jurisdictional claims in published maps and institutional affiliations. |
© 2021 by the authors. Licensee MDPI, Basel, Switzerland. This article is an open access article distributed under the terms and conditions of the Creative Commons Attribution (CC BY) license (https://creativecommons.org/licenses/by/4.0/).
Share and Cite
Sąsiadek, E.; Olejnik, K.; Kozicki, M. Paper Doped with Polyacrylonitrile Fibres Modified with 10,12–Pentacosadiynoic Acid. Materials 2021, 14, 4006. https://doi.org/10.3390/ma14144006
Sąsiadek E, Olejnik K, Kozicki M. Paper Doped with Polyacrylonitrile Fibres Modified with 10,12–Pentacosadiynoic Acid. Materials. 2021; 14(14):4006. https://doi.org/10.3390/ma14144006
Chicago/Turabian StyleSąsiadek, Elżbieta, Konrad Olejnik, and Marek Kozicki. 2021. "Paper Doped with Polyacrylonitrile Fibres Modified with 10,12–Pentacosadiynoic Acid" Materials 14, no. 14: 4006. https://doi.org/10.3390/ma14144006
APA StyleSąsiadek, E., Olejnik, K., & Kozicki, M. (2021). Paper Doped with Polyacrylonitrile Fibres Modified with 10,12–Pentacosadiynoic Acid. Materials, 14(14), 4006. https://doi.org/10.3390/ma14144006