Article

Semi-Empirical Prediction of Turned Surface Residual Stress for Inconel 718 Grounded in Experiments and Finite Element Simulations

1
School of Mechanical Engineering, Jiulong Lake Campus, Southeast University, Nanjing 211189, China
2
Shenyang Liming Aero-Engine (Group) Ltd., Shenyang 110862, China
*
Authors to whom correspondence should be addressed.
Materials 2021, 14(14), 3937; https://doi.org/10.3390/ma14143937
Submission received: 31 May 2021 / Revised: 5 July 2021 / Accepted: 11 July 2021 / Published: 14 July 2021
(This article belongs to the Collection Machining and Manufacturing of Alloys and Steels)

Abstract

:
The surface residual stress after machining, especially for finishing, has a vital influence on the shape stability and fatigue life of components. The current study focuses on proposing an original empirical equation to predict turned surface residual stress for Inconel 718 material, taking tool parameters into consideration. The tool cutting-edge angle, rake angle, and inclination angle are introduced for the first time in the equation based on the Inconel 718 material turning experiments and finite element simulations. In this study, the reliability of simulation parameters’ setting is firstly calibrated by comparing the residual stresses and chips of the experiments and simulations. The changing trends of turned forces, temperatures of lathe tool nose, and surface residual stress with turning parameters are analyzed. Then, the predictive equation of surface residual stress is proposed considering relationships between the back-rake angle, the side-rake angle, and the tool cutting-edge angle, rake angle, and inclination angle. Moreover, the genetic algorithm optimizes the objective function to obtain the undetermined coefficients in the prediction equation. Finally, the predicted accuracy of the surface residual stress is proven by comparing the experimental, simulation, and prediction values. The results indicate that the predictive equation of surface residual stress has a good accuracy in predicting turned surface residual stress for Inconel 718 materials. The correlation coefficient, R, and absolute average error between the predicted and the simulated value are 0.9624 and 13.40%, respectively. In the range of cutting parameters studied and experimental errors, this study provides an accurate predictive equation of turned surface residual stress for Inconel 718 materials.

1. Introduction

Nickel-based superalloys are widely applied in the aviation industry, such as in the manufacture of aeroengines, because they have excellent mechanical performance under high temperature and pressure. Inconel 718 occupies more than half the proportion of the nickel alloys applied by major aeroengine manufacturers. Its stable mechanical properties at high temperature make it one of the important materials in the aviation industry [1,2,3,4]. Nonetheless, Inconel 718 is not only conducive to processing just for the ability to hold good high-temperature resistance mechanical performance. The cutting process produces vast heat on the machined surface of the components introduced by serious friction between tool, chip, and cut surface. Meanwhile, the heat resulting from the extrusion and sliding deformation of material is generated in the first shear zone. The material also adheres to the tool nose region as the cutting proceeds, further intensifying the heat accumulation in the tool nose region for deformation and friction [5]. This causes complex residual stress in the superficial layer of the component, which affects the stability of size of the components, especially for the thin-walled components. In particular, the tensile surface residual stress tends towards accelerating the growth of microcracks, shortening the service life of the parts [6,7]. Therefore, the surface residual stress plays a critical role in dimensional accuracy and working life of machined parts. Furthermore, in terms of machining Inconel 718, it is vital to study the prediction model of surface residual stress for controlling deformation and improving the working life of parts.
The machined surface residual stress for Inconel 718 is related to the parameters in machining and the parameters of lathe tools, including geometry parameters, coating of lathe tools, and wear condition in the machining process. The experiments and simulations about the surface residual stress for machining Inconel 718 have been carried out in many previous studies. The changes of residual stress with cutting parameters are affected by work hardening rate and yield strength under the action of initial load [8,9]. Meanwhile, the change trends of residual stress are different with rising feed, depth of cut, and cutting speed [10,11,12].
In the works of Madariaga et al. [8,9], the tensile residual stress remained stable under initial static load, but increased when it was close to the yield stress. The variation of the surface residual stress rested with the work-hardening rate and the yield strength of the surface and subsurface layer under the initial quasi-static load. Their other research [10] pointed out that when the feed rate climbed, the surface residual stress rose with the increasing cutting speed (the range of 30~70 m/min) or feed rate (the range of 0.15~0.25 mm/rev) in the feed direction. Hua and Liu [11] investigated the principal residual stress and fatigue properties of turning Inconel 718. Their research showed that the principal and surface residual stresses both increased with the growing feed rate (0.075~0.15 mm/rev). In da Silva’s study [12], a model of an orthogonal turning was founded to forecast the surface integrity for machining Inconel 718, and according to the model put forward by Wu [13] and Denguir [14], the change of the residual stress with cutting parameters was analyzed. The residual stress of material near the surface decreased slightly when the cutting speed rose, yet the surface residual stress climbed as the cutting depth grew.
In addition to the above research on the relationship between residual stresses and cutting parameters, the residual stresses affected by cutting tools have also been studied in recent years [2,12,15,16,17]. In the study of Sharman et al. [2], the increase of tool nose radius resulted in more distinct surface tensile residual stress and made the tensile stress layer deeper. The worn tool caused large tensile stress layers in machining shallow areas near the surface. The authors of [12] also revealed that the surface residual stress caused by the tool with negative rake angle was higher than that of the tool with positive rake angle. The coupled Euler–Lagrangian method was employed to simulate the residual stress resulting from tool geometry for Inconel 718 orthogonal cutting in [15]. The negative rake angle tended to form the compressive residual stress near the turned surface, as did the sharp cutting-edge radius. Moreover, ceramic-coated tools tended to remain in a large surface tensile stress state for machining Inconel 718 materials. Holmberg et al. [16] compared the residual stress levels of the sharp and blunt ceramic or carbide-tipped tools for milling Inconel 718. For the ceramic tool, the surface residual stress along the feed direction was lower than that along the perpendicular direction, and the surface residual stresses in both directions caused by the sharp tool were higher than that resulting from the worn tool. For the carbide-tipped tool, it was lower than that of the ceramic tool along both feed and perpendicular directions, but the surface residual stress caused by tool wear was higher than that of the sharp tool in the feed direction. In Madariaga’s study [17], the residual stress on the turned surface first increased to a threshold value and then decreased with growing flank wear along the turning direction.
In the research of Gupta et al. [18], the cutting forces of turning Inconel 800 alloy using minimum quantity lubrication decreased when the cutting speed and cutting tool angle rose and the feed rate declined. Furthermore, the tool wear became more severe as the cutting speed rose and therefore as feed grew. In our previous study [19], Lorentz function and random forest regression were used to predict the distribution of residual stress in the depth direction, which did not introduce the tool angles. Ma et al. [20] proposed a milling surface residual stress prediction model, including milling parameters, milling force, and milling temperature, after analyzing forces and temperatures during milling Inconel 718 under the varying feeds and cutting depths.
In summary, there are few studies on the prediction model, including tool parameters, cutting parameters, cutting forces, and cutting temperature, in terms of surface residual stress for turning Inconel 718 material. Therefore, this current study concentrates on developing an innovative turned surface residual stress prediction model for Inconel 718, (1) containing the tool parameters, (2) the turning parameters, (3) turning forces, and (4) temperature, based on the experiments and simulations. In this prediction model, tool parameters are introduced for the first time. Finally, comparing predicted, simulated, and measured results, the effectiveness of the prediction model in the cutting parameters studied in this paper is well-validated.

2. Methods

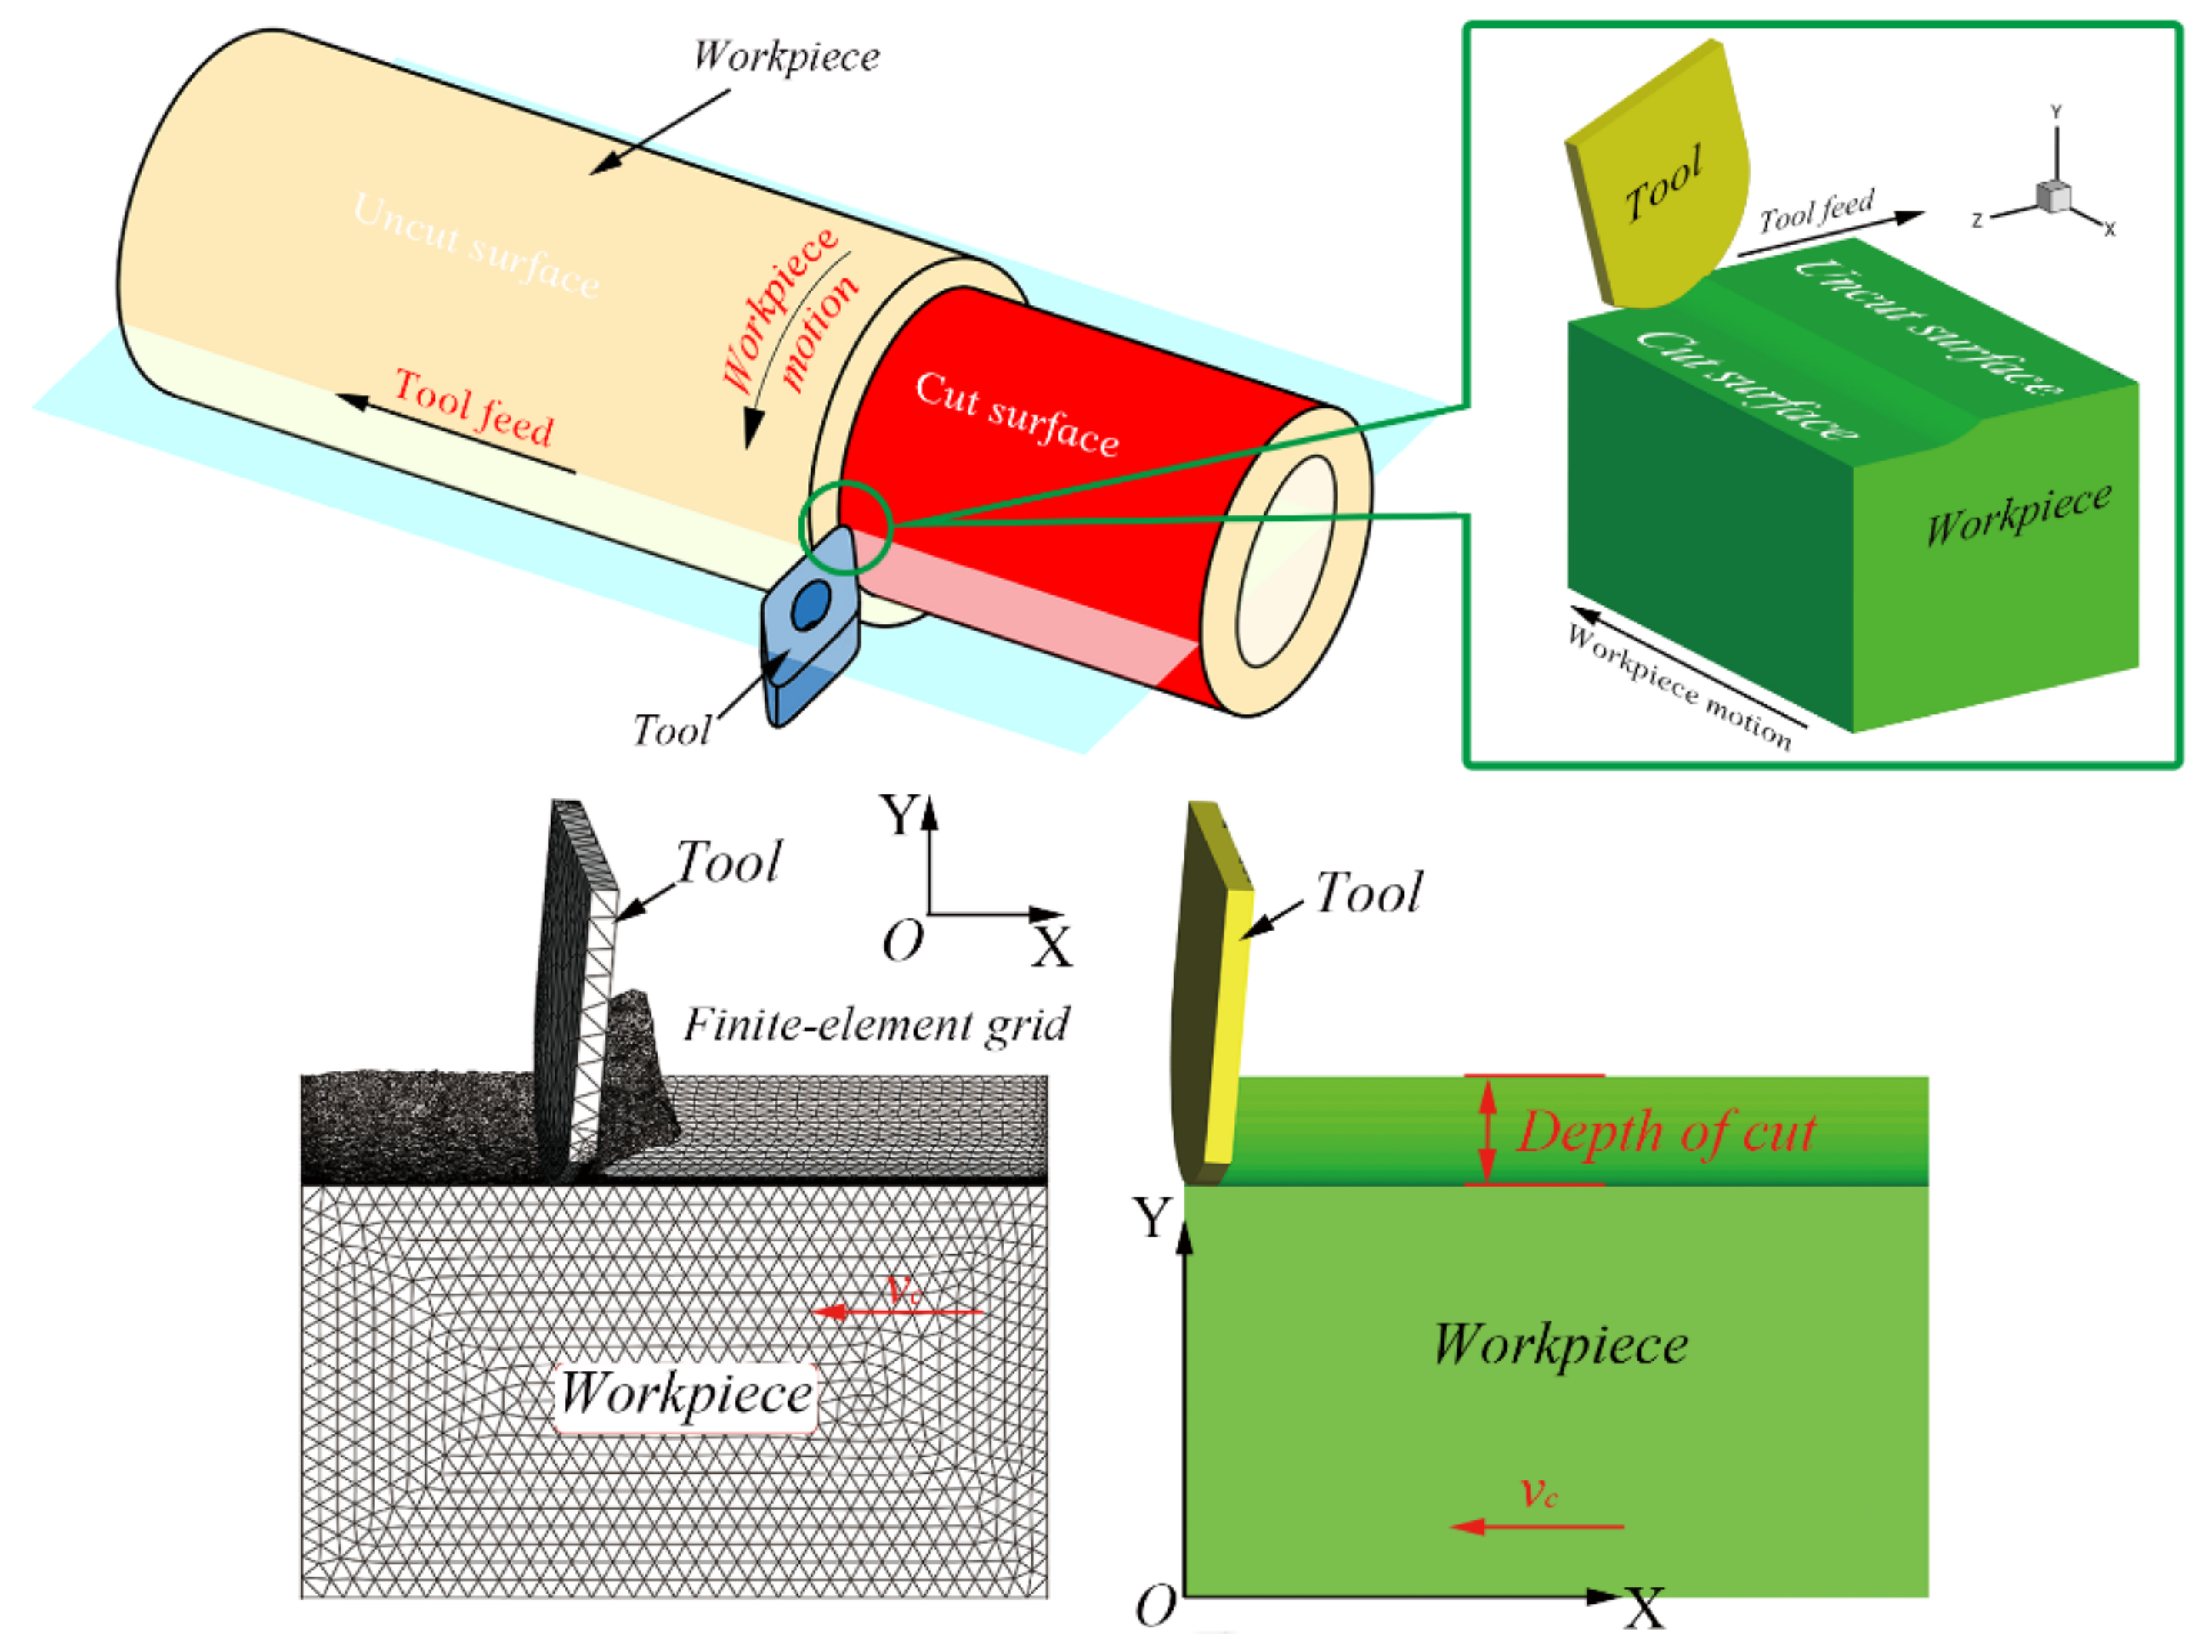
2.1. Three-Dimensional FEM Simulation

In terms of analyzing the residual stresses near turned surface for Inconel 718 materials, it is necessary to establish a three-dimensional (3D) finite element turning model. The tool nose area can be approximately regarded as a plane for larger diameter cylindrical turning. Therefore, a 3D finite element turning model was established considering the region near the tool nose, using AdvantEdge software (V7.4015, Third Wave Systems, Minneapolis, MN, USA). The length, width, and height remain at 5 × 3 × 2 mm in the turning model. The tetrahedral elements were applied with the upper and lower limits of 0.15 and 0.005 mm element sizes. Then, the software automatically divided the mesh and kept more precise mesh generation in the cutting area. As displayed in Figure 1, the same as the movement form of cylindrical turning, the workpiece moves along the opposite direction of the X-axis with speed vc, relative to the fixed tool in the simulation.
The Johnson-Cook constitutive model proposed in [22] was utilized for the simulation setup of the turning Inconel 718 material, which was expressed as Equation (1):
σ ¯ = A + B ε ¯ n S t r a i n   h a r d e n i n g 1 + C ε ¯ ˙ ε ¯ ˙ 0 S t r a i n   r a t e   h a r d e n i n g 1 T T r o o m T m e l t T r o o m m T h e r m a l   s o f t e n i n g
where σ ¯ denotes the equivalent flow stress (MPa). The equation includes three factors: (1) strain hardening term, (2) strain rate hardening term, and (3) thermal softening term. The strain hardening term involves yield strength (A), strain hardening coefficient (B), equivalent plastic strain ( ε ¯ ), and strain hardening exponent (n). Additionally, the strain rate hardening term relates to strain rate hardening coefficient (C), equivalent plastic strain rate ( ε ¯ ˙ ), and reference equivalent plastic strain rate ( ε ¯ ˙ 0 ). Besides, the thermal softening term contains temperature ( T ), room temperature ( T r o o m , with 20 °C), melting temperature ( T m e l t ), and thermal softening exponent (m). In the present study, five parameters [23]: A, B, C, m, and n, as well as ε ¯ ˙ 0 , were taken as 1290 MPa, 895 MPa, 0.016, 1.55, 0.526, and 0.03 s 1 , respectively [24]. The density of Inconel 718 is 8240 kg/m3 and the Young’s modulus and Poisson’s ratio are 214.58 GPa and 0.305, obtained separately in the X-ray residual stress measurement. The other material properties of Inconel 718 used in the simulation are shown in Table 1, and were obtained by X-ray diffractometer. The thermal conductivity varies at different temperatures, and so does the specific heat. Moreover, the coefficient of thermal expansion varies in different temperature ranges.
The D-type insert (55° top angle, grade: Carbide-Grade-M) was employed in the turning simulation as a rigid body, keeping nose radius 1.2 mm and edge radius 0.02 mm. Table 2 shows other tool geometrical parameters in turning simulations and experiments. The friction between insert and workpiece adopted the coulomb friction model and the coefficient was set at 0.23, and the tool elements adopted the tetrahedral mesh automatic generation technology in the AdvantEdge software, keeping the upper and lower limits of element sizes twice as large as those of the workpiece. Then, the software automatically generated the mesh and made it finer in the contact region between the insert and component. During the simulation, the workpiece moved 6 mm along the negative x-direction displayed in Figure 1, including 1 mm empty cutting, so that the chip completely separated from the workpiece.

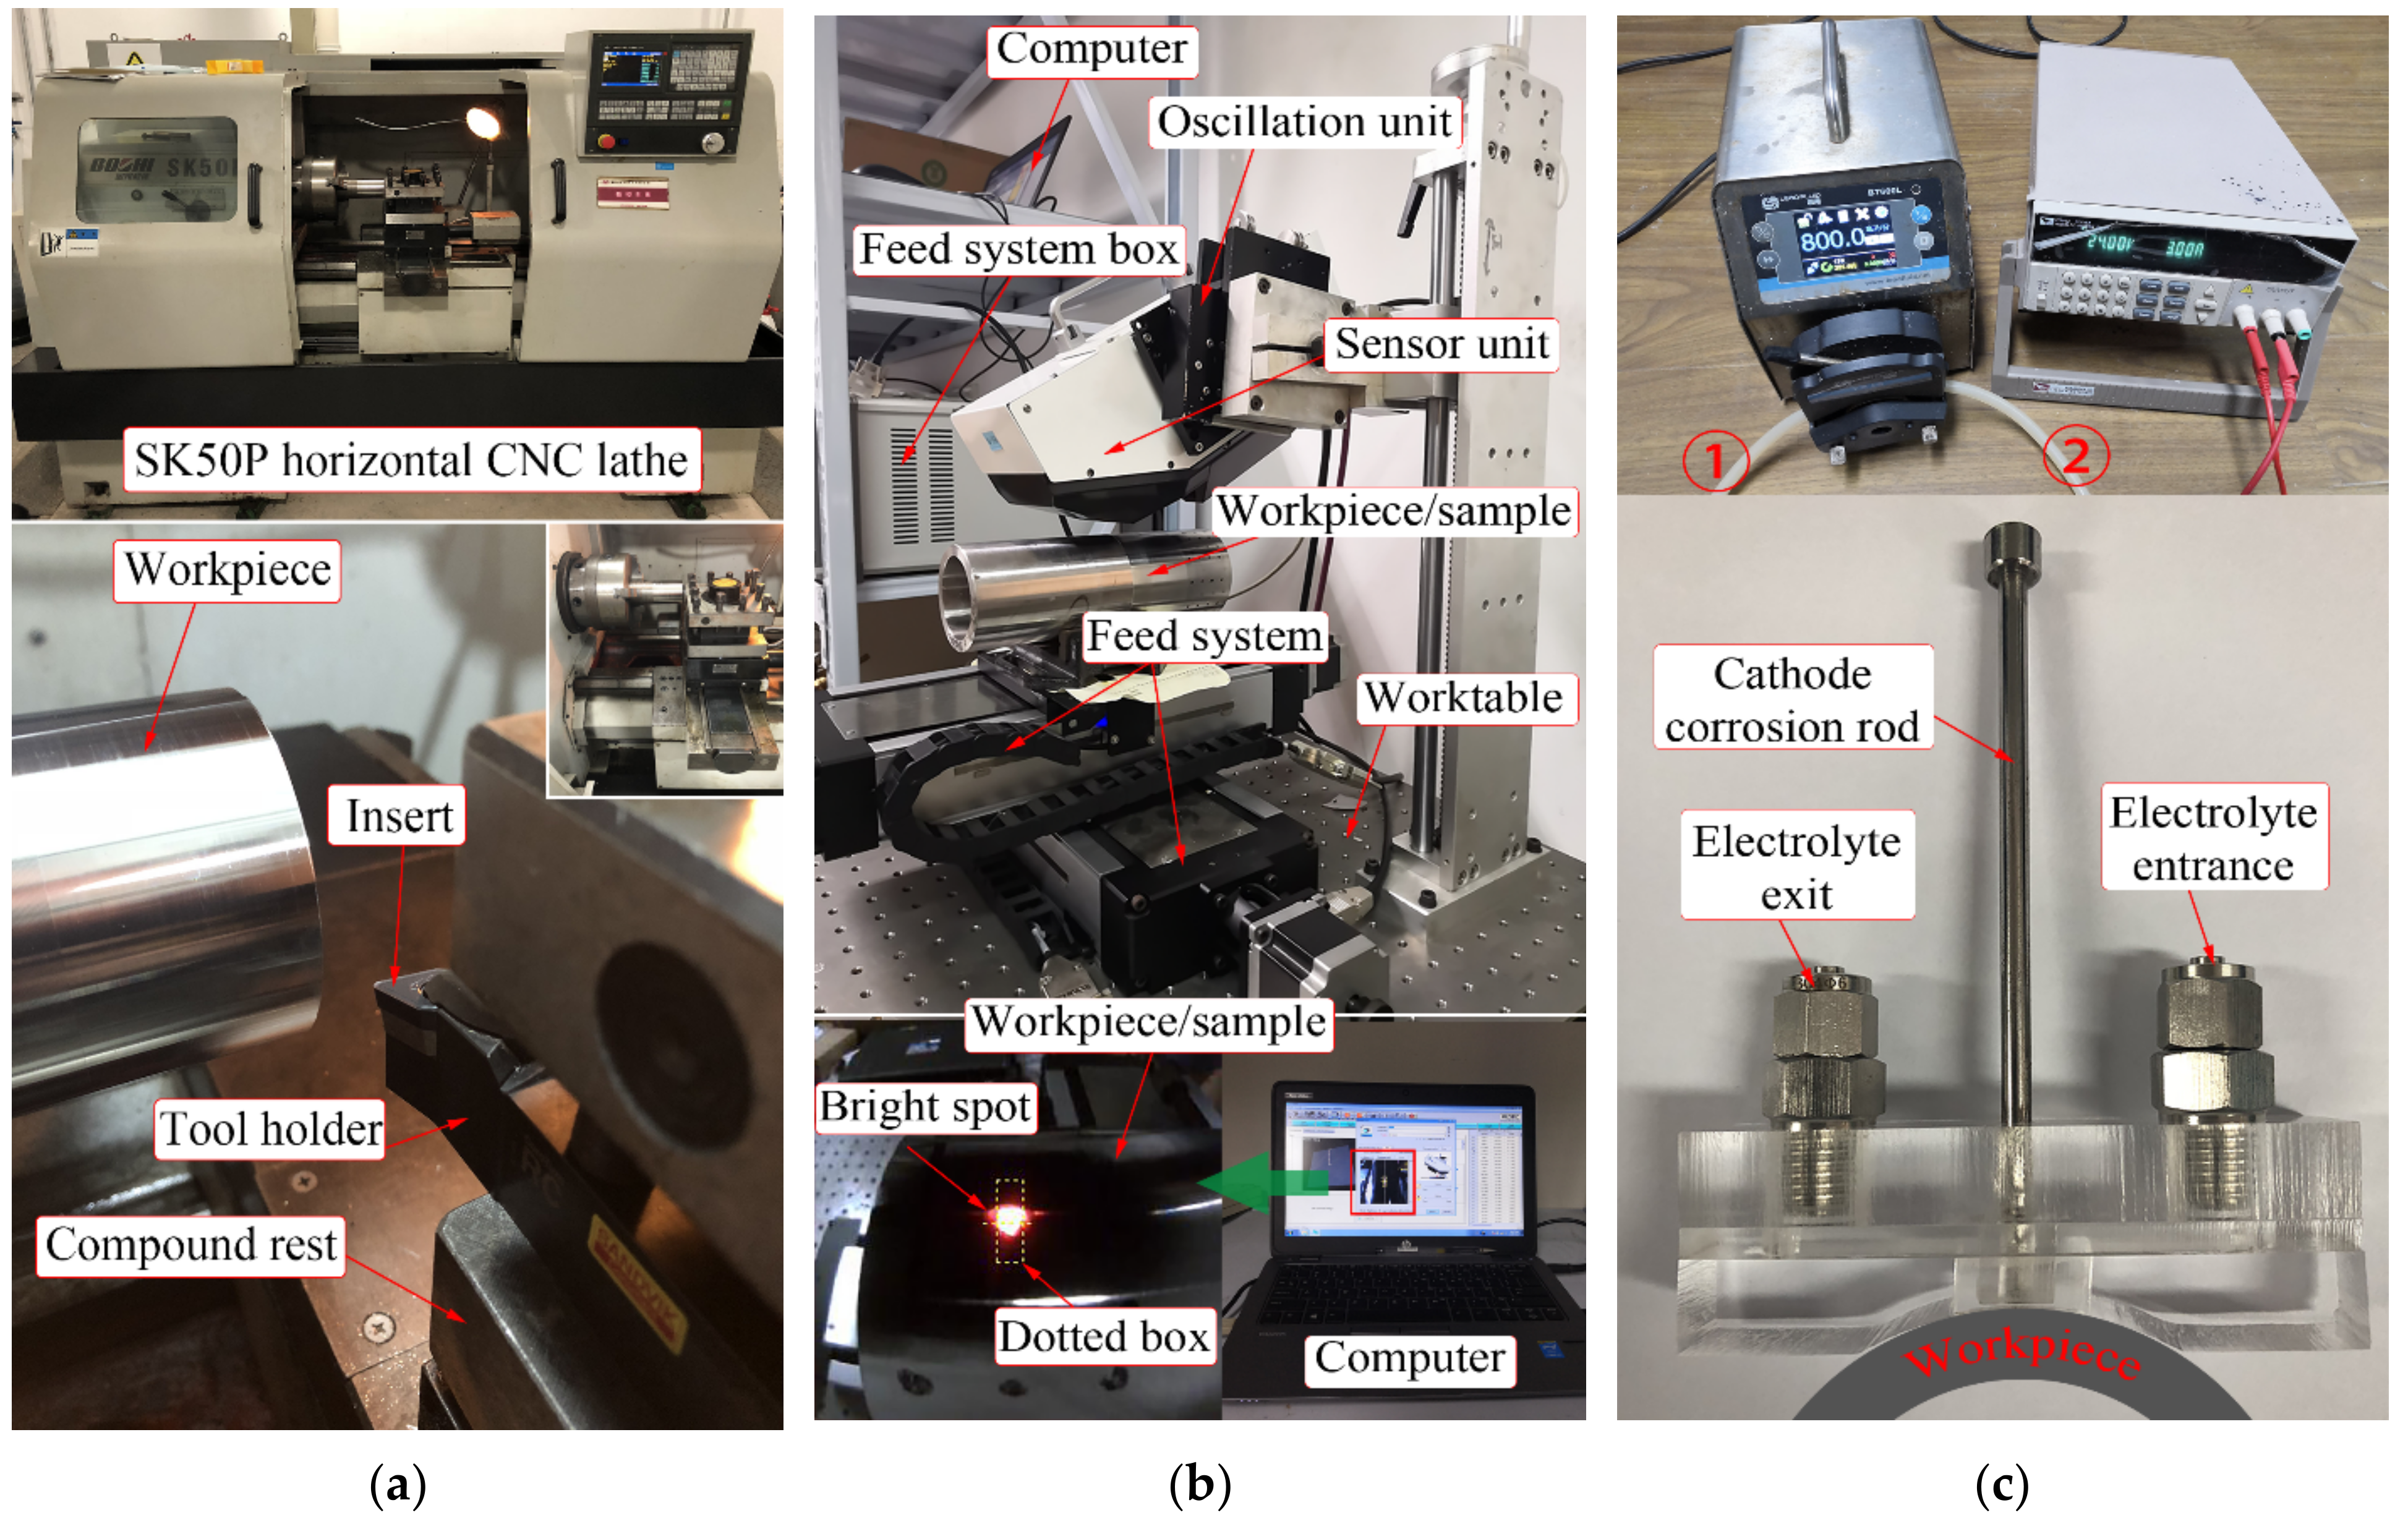
2.2. Turning Experiments and Measuring Residual Stresses
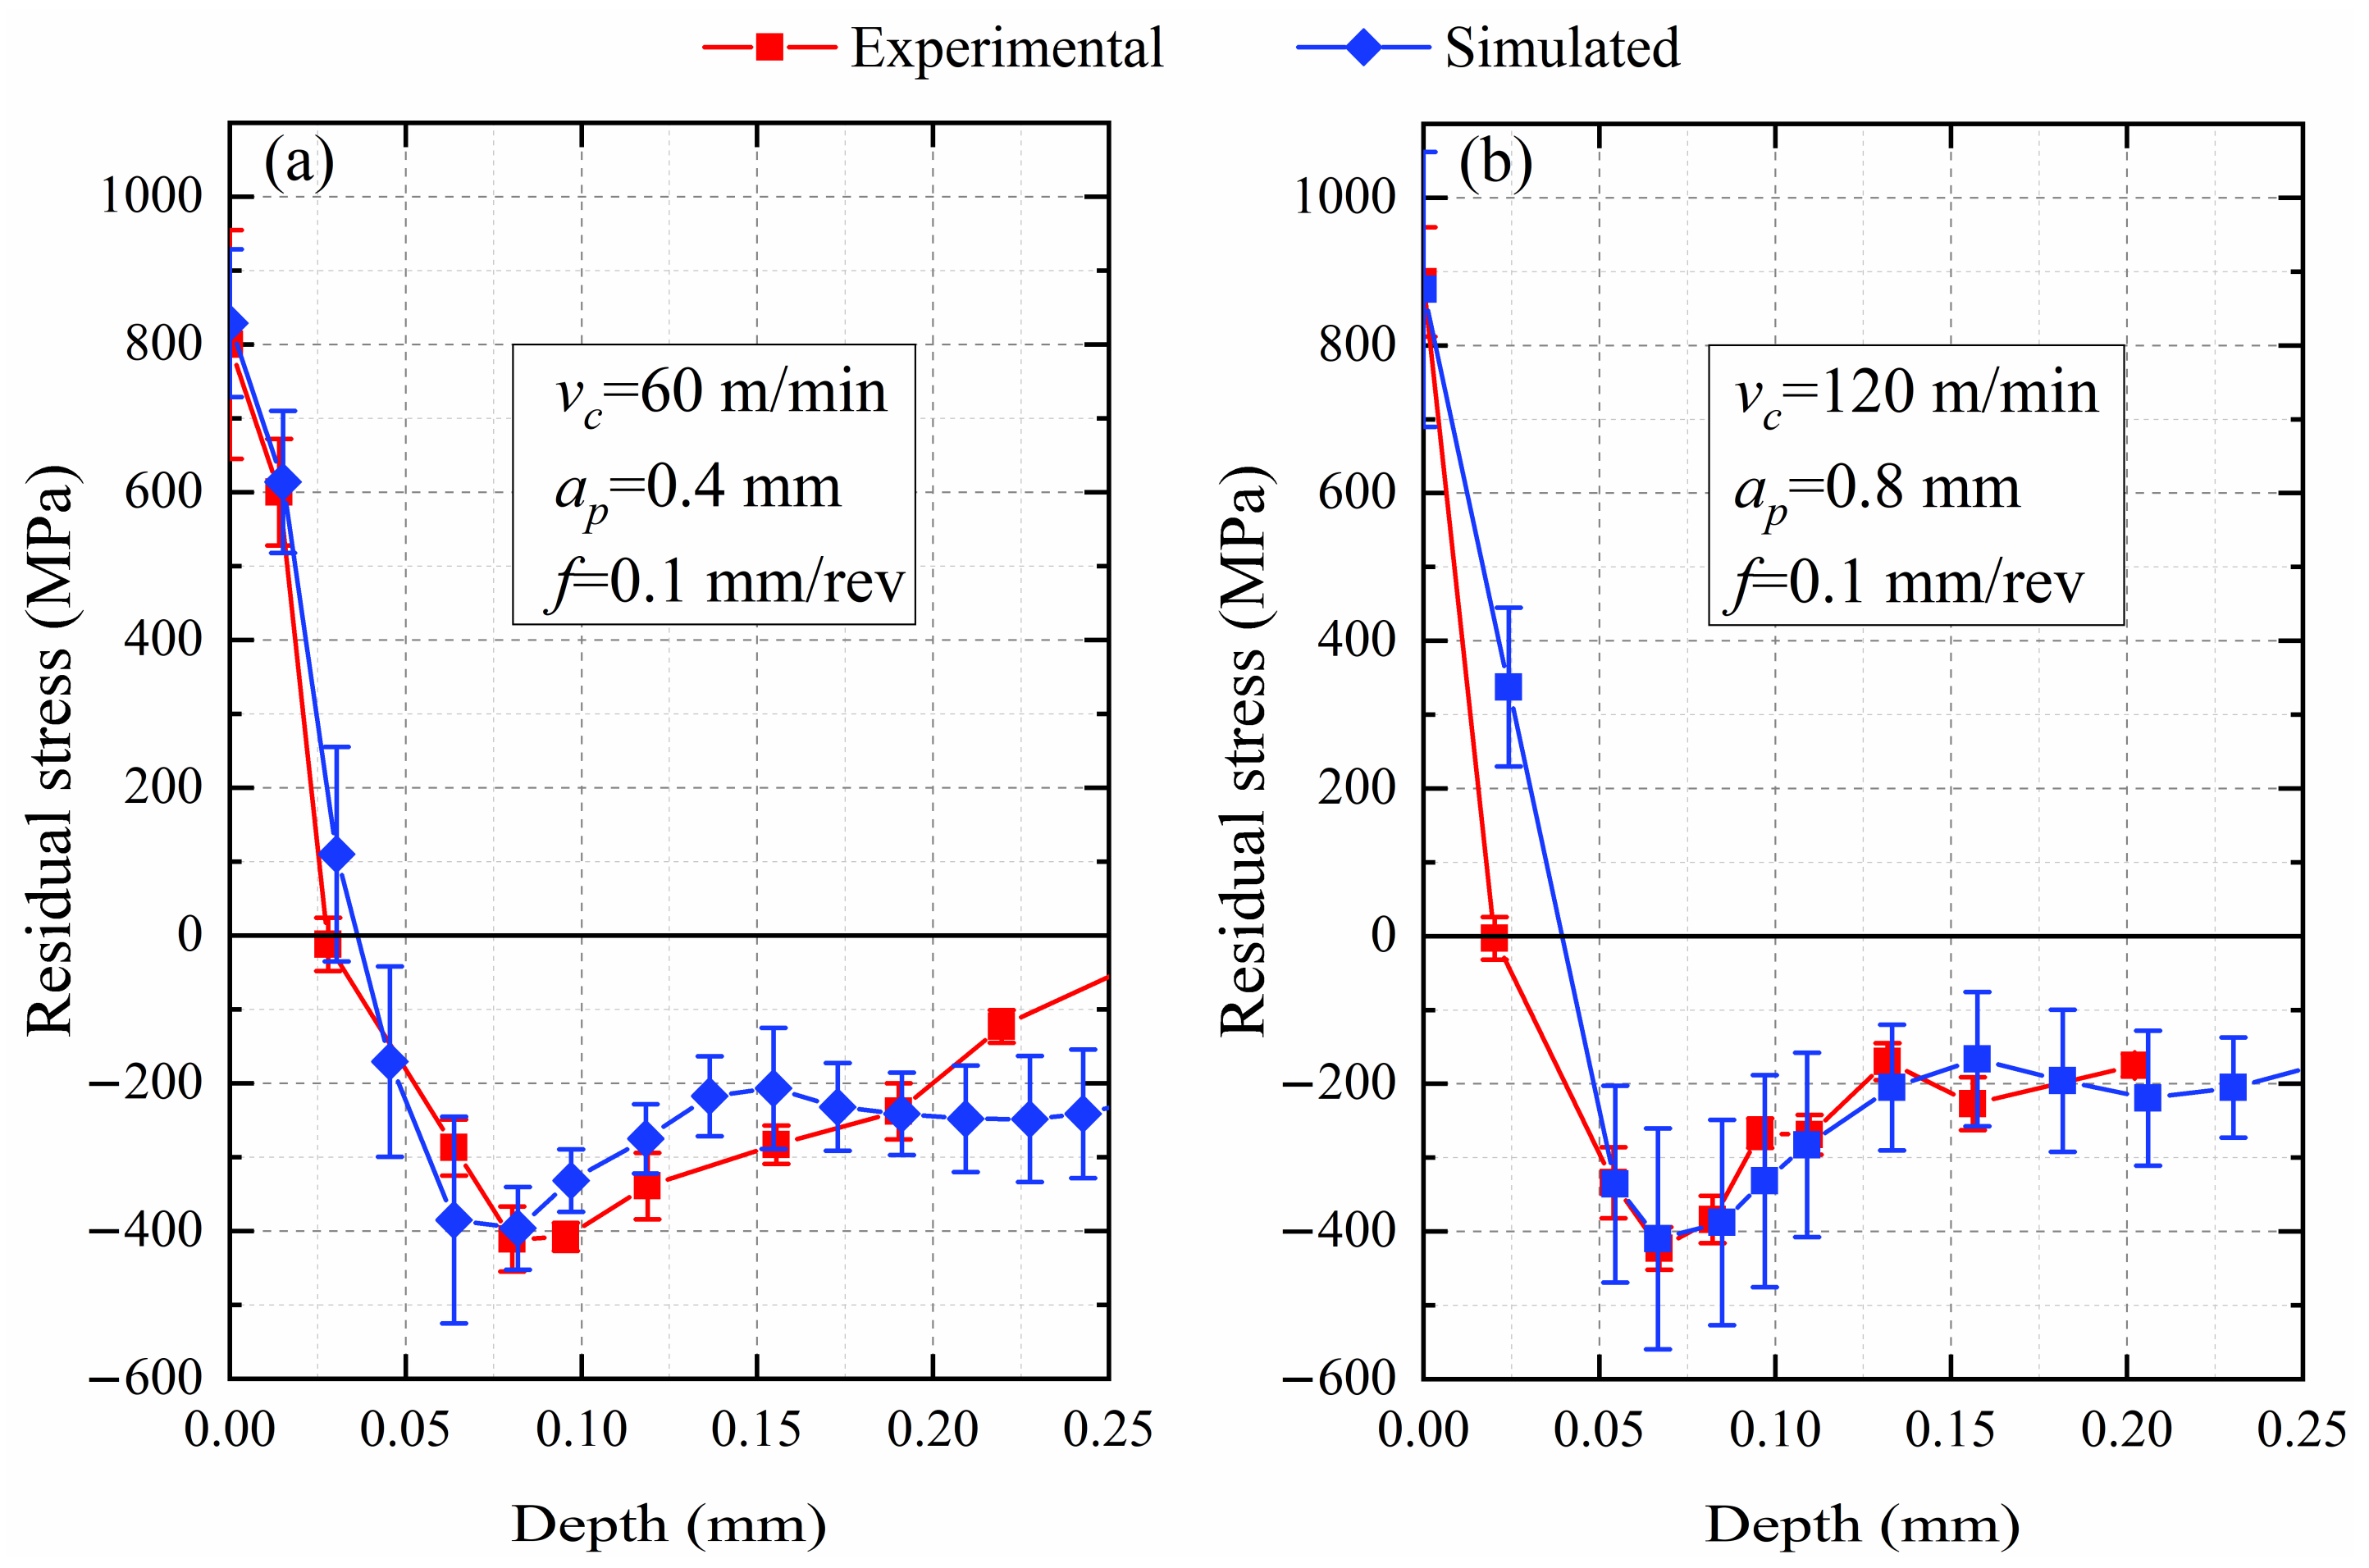
Two experiments, as shown in Table 3, were carried out to verify the simulation parameters for turning Inconel 718 pipes (outer diameter × length × wall thickness: 76 × 200 × 8 mm). The Inconel 718 pipes experienced the heat treatment, were annealed, warmed at 720 °C for 8 h, cooled down to 620 °C at 50 °C/h, held at 620 °C for 8 h and quick cooled, and kept at 43 HRC. The main elements and weight of Inconel 718 pipes used in experiments are shown in Table 4. Then, the SK50P horizontal CNC lathe was applied to the turning experiments, as shown in Figure 2a. The workpiece rotates and the compound rest feeds with the tool. The tool holder provided by Sandivk company is DDHNR 2525M 1504. The insert (DNMG 15 04 12-SMR 1105, M-Grade) with physical vapor deposition 0.002 mm TiAlN remains at a 55° top angle and a 1.1906 mm tool nose radius. The other tool geometrical parameters in experiments are displayed in Table 2, consistent with simulations. Moreover, the new sharp insert was used in each turning test.
In this study, an X-ray diffractometer (μ—360n type provided by Pulstec Industrial Co., Ltd., Hamamatsu, Japan) was introduced to acquire residual stress, as displayed in Figure 2b. The X-ray approach is able to assess the residual stress by measuring the lattice character without destroying the material. The Cr K-Beta tube in the X-ray diffractometer generated an X-ray (wavelength 2.08480 Å), and the voltage was maintained at 30 kV and the current at 1.2 mA. In the process of measuring residual stress, the workpiece was placed on the feed system worktable after adjusting the height of the sensor unit with the lead screw. The feed system control box was applied to make the X-ray emitted by the sensor unit coincide with the marked point on the workpiece surface. When the bright spot is in the middle of the dotted box in the computer, the measurement can be started. The oscillation unit continuously adjusted the angle between the X-ray and workpiece surface so that X-rays were irradiated to the 311-crystal plane at a diffraction angle of 150.876° (2-theta) and a diffraction lattice angle of 29.124°. In this manner, the sensor unit measured the lattice character, and the residual stress was calculated using the cosα method by the sensor unit and the computer. The principle of the X-ray residual stress measurement by the cosα method can be found in [11].
In addition, the electrolytic etching method was adopted to strip layers so as to obtain the tendency of residual stress along the negative Y-axis in the turned shallow surface in the experiments, without introducing new stress. When the electrolytic etching was carried out, the electrolytic corrosion device was attached to the cut surface of the workpiece, as shown in Figure 2c. The cathode corrosion rod and the workpiece as an anode were linked to the negative terminal and positive terminal belonging to the itech DC power supply, separately. The electrolyte was 10% NaCl aqueous solution. Moreover, the voltage of 24 V and current of 3 A were maintained during electrolysis. The electrolyte flowed from ① to ② (in Figure 2c) at a speed of 80 mL/min driven by the peristaltic pump, then entered the electrolytic corrosion device from the electrolyte entrance, and flowed through the workpiece surface, and eventually entered the electrolytic cell from the electrolyte exit. The whole workpiece and electrolytic corrosion device were placed in the electrolytic cell. The electrolysis polishing rate was kept at 0.005 mm/s.

2.3. FEM Validation

The distribution trend of residual stress along the negative Y-axis in the turned shallow surface is approximately hook-shaped for Inconel 718 material [26], as exhibited in Figure 3a. The cutting process is coupled with thermal-mechanical loads. The thermal load is conductive to be tensile and the mechanical load tends to be compressive for the residual stress [10]. Moreover, the affection of thermal load on residual stresses near the surface is higher than that of mechanical load, but it is opposite to the subsurface. Therefore, the residual stress near the shallow surface of the workpiece gradually falls off from tensile to compressive stress, then increases and approaches a constant value along the depth direction [27]. The cutting forces during the turning tend to be stable within the regions of about 0.5~4.5 mm, as shown in Figure 3b, including circumferential force (Fc) whose direction is collinear with vc, radial force (Fr) whose direction is consistent with ap, and whose direction is axial force (Fa) consistent with f. Therefore, the residual stress was extracted in the steady cutting. The extraction method of residual stress has been presented in previous research [19,28].
The residual stresses extracted from simulations and measured in experiments are shown in Figure 4, both presenting hook-shaped distributions. The residual stresses near the turned shallow surface are tensile, the direction of residual stresses becomes compressive with the increase of depth, and the compressive stresses climb slowly after reaching extreme values. The simulated residual stresses are slightly higher than those measured in the experiments before the depth of 0.05 mm because the actual electrolytic depth caused by the cylindrical surface of the workpiece is slightly deeper than the product of electrolysis polishing rate and electrolytic time. Moreover, the relative error of the surface residual stresses between the experiment and the simulation is less than 5%, the relative error of the peak compressive residual stresses is within 5%, and the relative error of the depths of compressive stress extreme values below the machined surface is also not beyond 5%, as shown in Figure 4.
Figure 5 exhibits the chip morphology in the simulations and turning experiments under two groups of cutting parameters. Furthermore, the heat in the cutting process is mainly concentrated in the contact areas between the rake face and the chips (the friction among the rake face and the chips along the secondary zone), and between the flank face and the turned surface of the workpiece (the friction of the tertiary zone). Besides, the heat includes the turned temperature resulting from deformation between the tool nose and the workpiece along the primary zone or shear plane. The error of the chip thickness in the two groups of parameters is 6.1% (vc, ap, and f equal 60 m/min, 0.4 mm, and 0.1 mm/rev, respectively) and 3.2% (vc, ap, and f equal 120 m/min, 0.8 mm, and 0.1 mm/rev, respectively), as shown in Figure 5. In summary, the simulation parameter setting is effective, comparing the distribution of residual stresses, including maximum tensile residual stress on turned surface and compressive stress extreme values, and chips’ thickness in simulations and experiments. Therefore, the following research was further carried out.

2.4. Simulation Planning

The analysis of Section 2.3 shows that the parameter setting of Section 2.1 is reasonable. Therefore, the surface residual stress after turning Inconel 718 material was studied in the current work on the basis of the small feed rate as well as the small cutting depth. The simulation planning was designed as in Table 5, containing 24 (4 × 3 × 2) sets of parameters. The simulations were performed on a computer with two Intel Xeon E5 2.3 GHz processors. The cutting forces, cutting temperatures, and surface residual stresses extracted from 24 simulations are analyzed in Section 3.

3. Results and Discussion

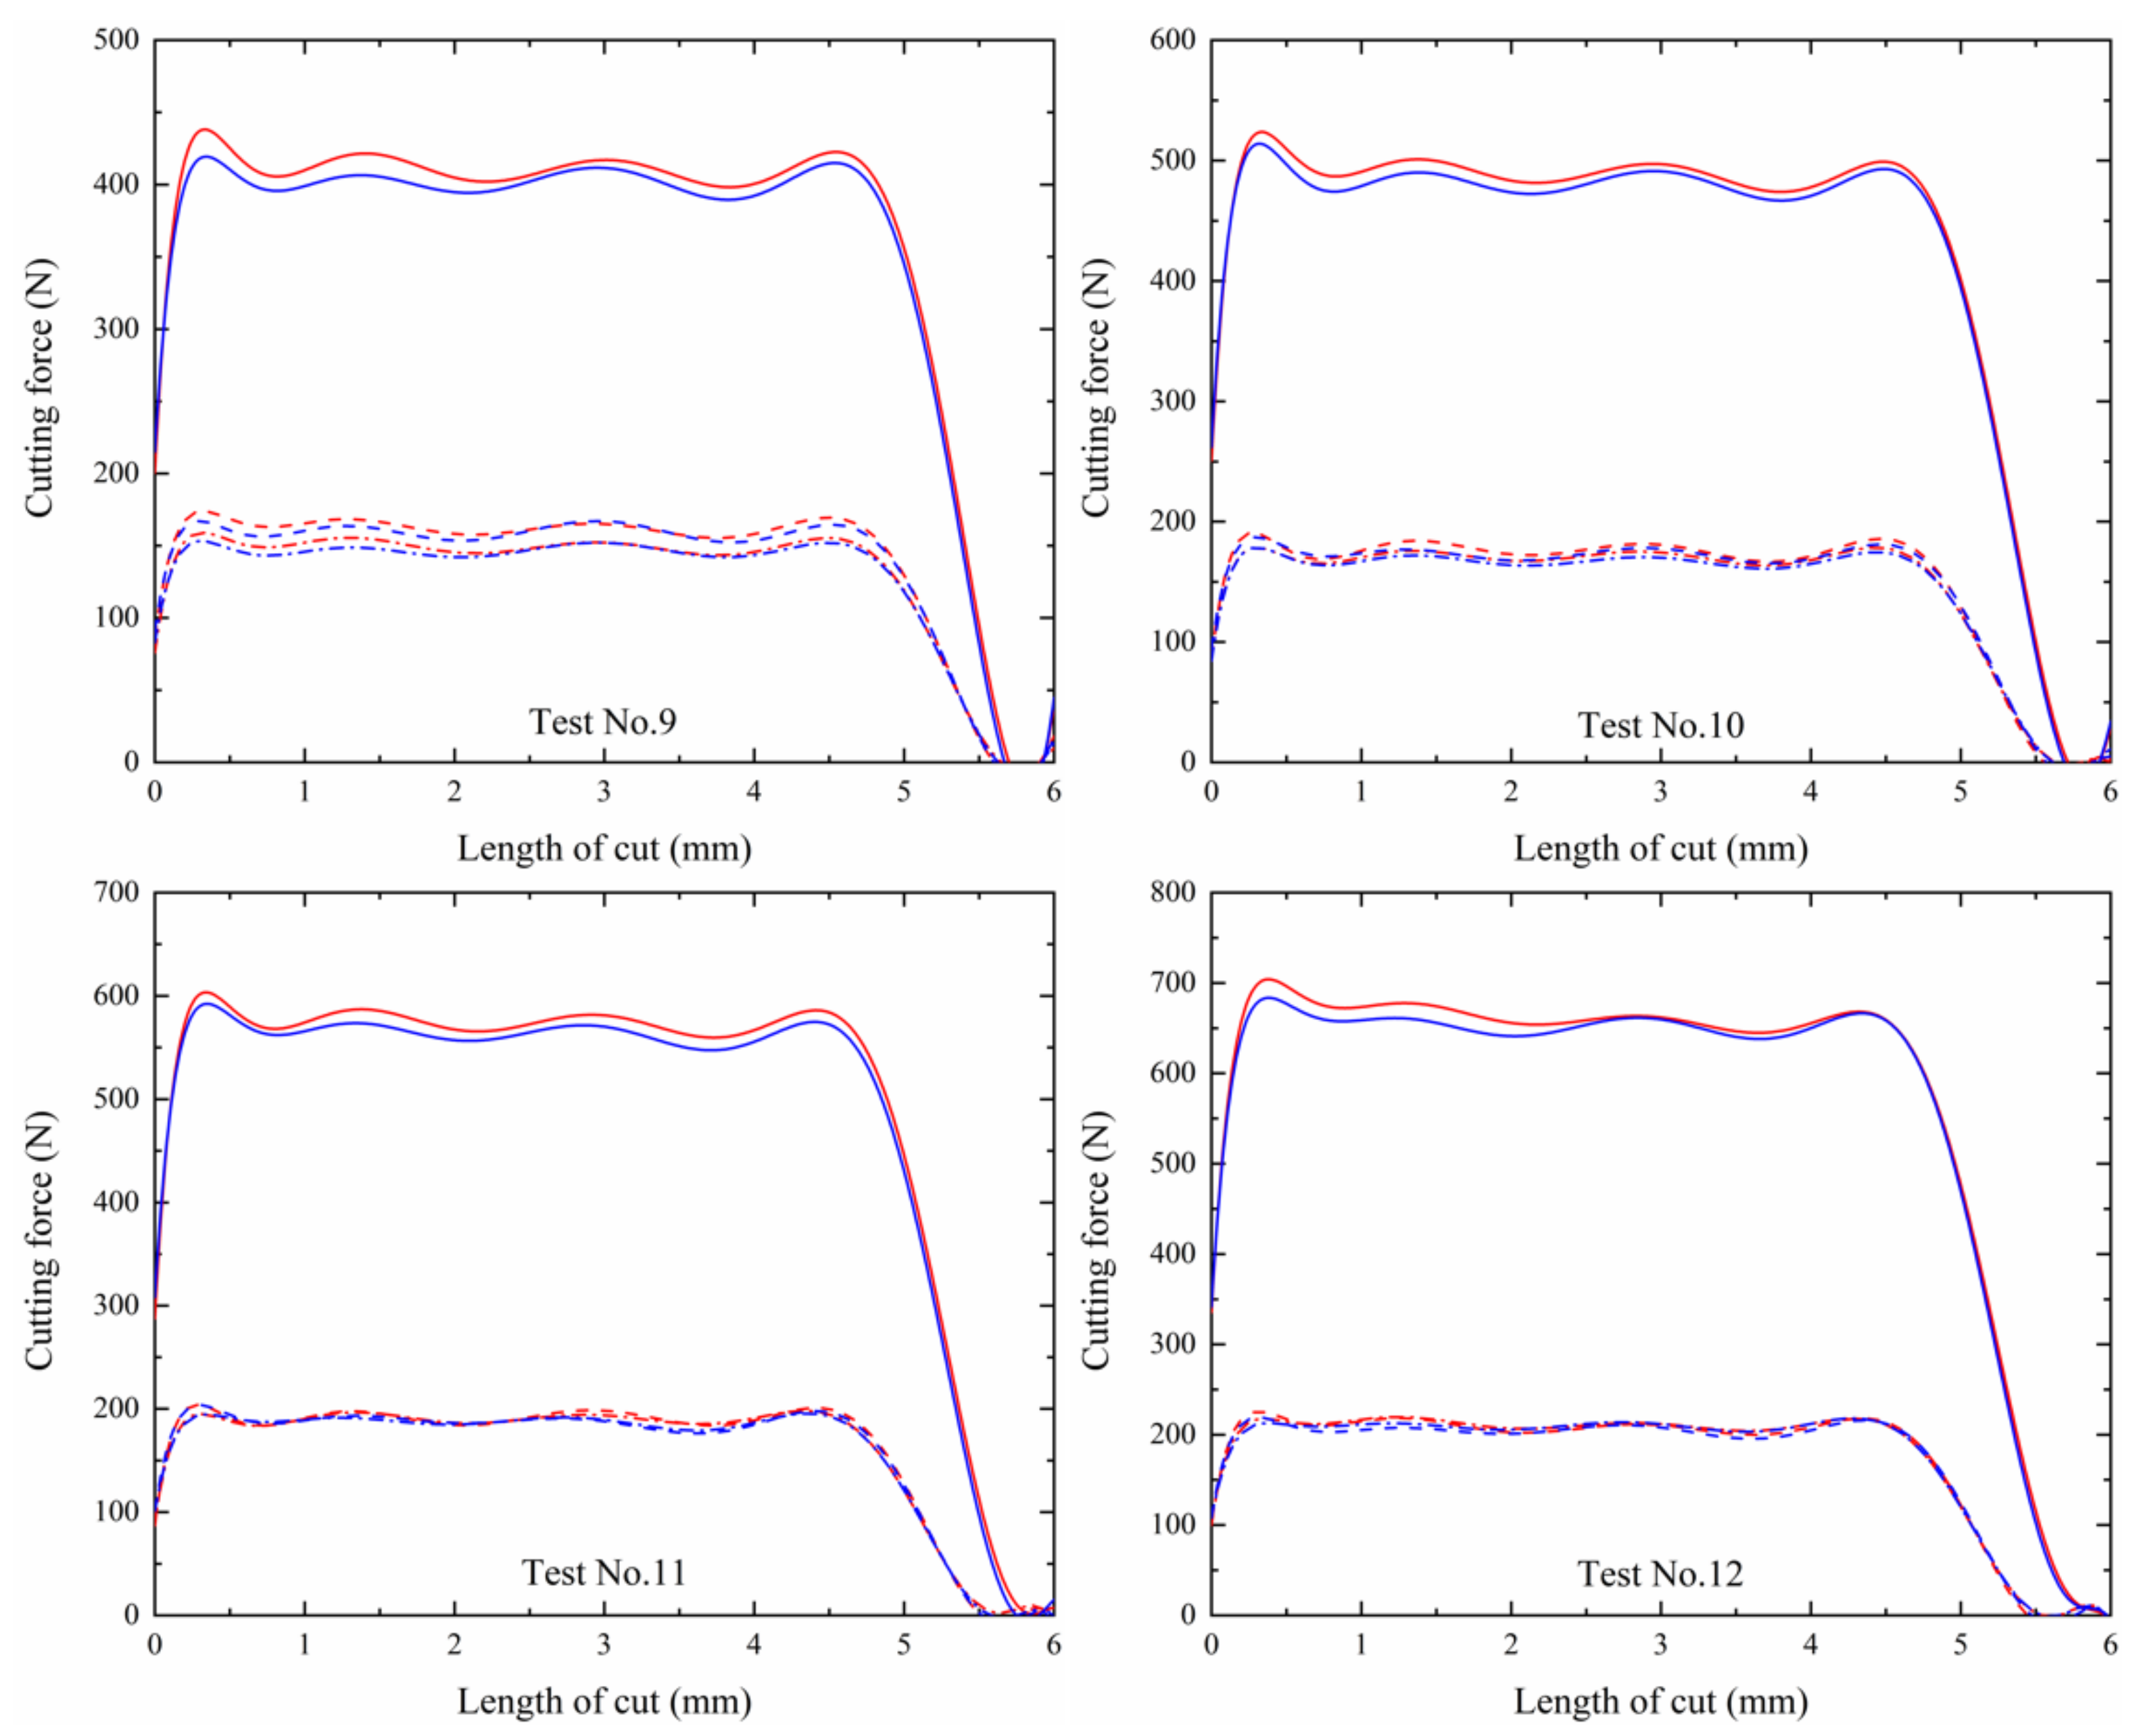
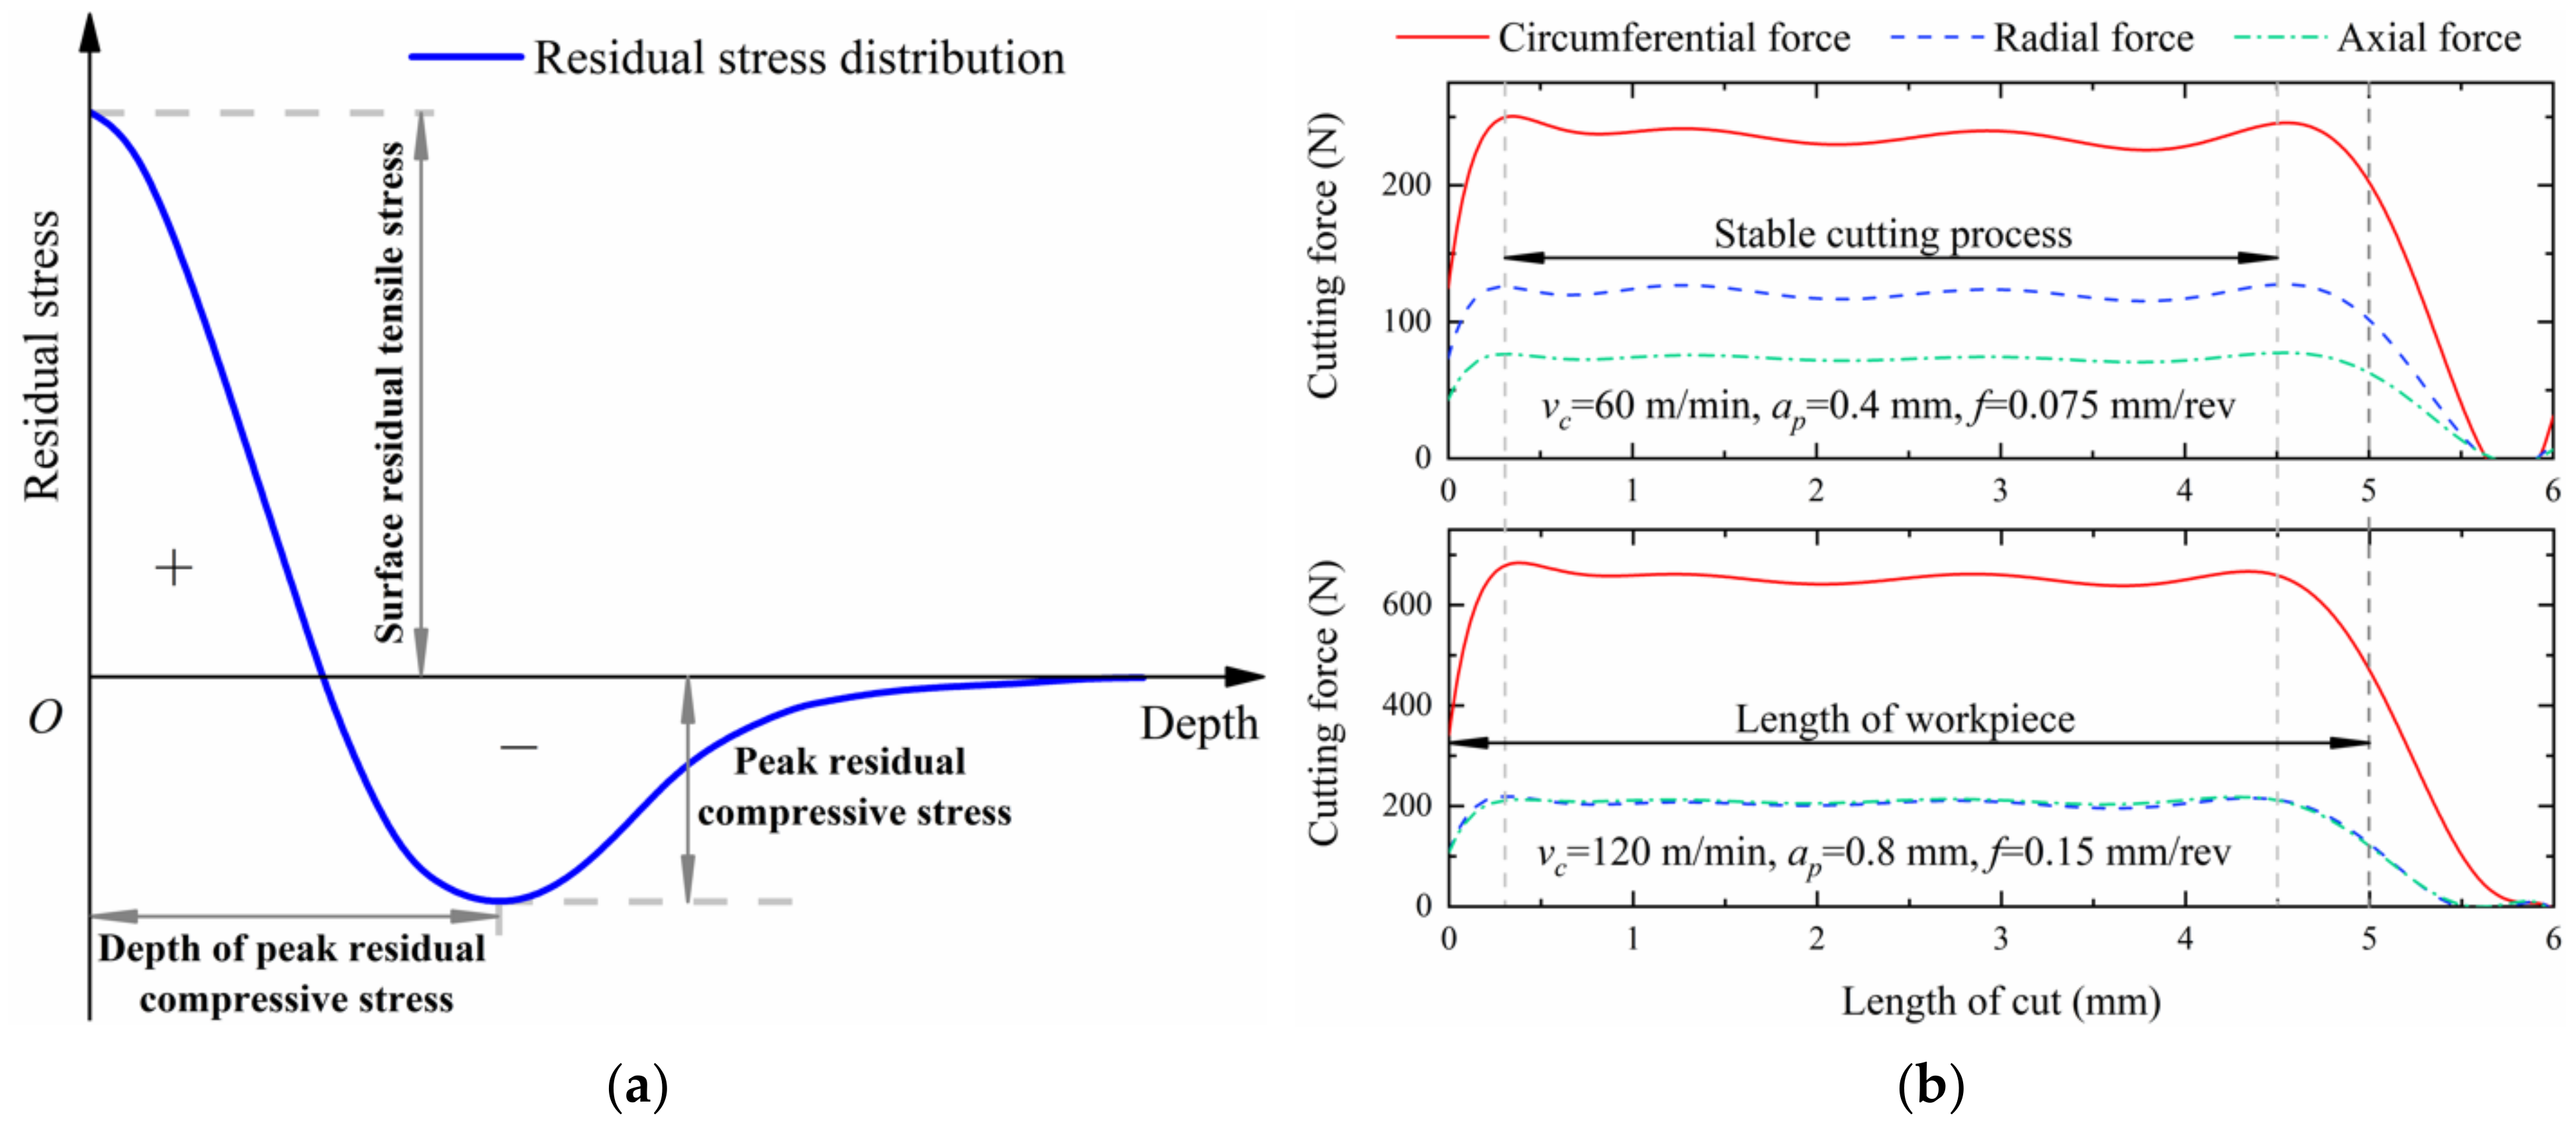
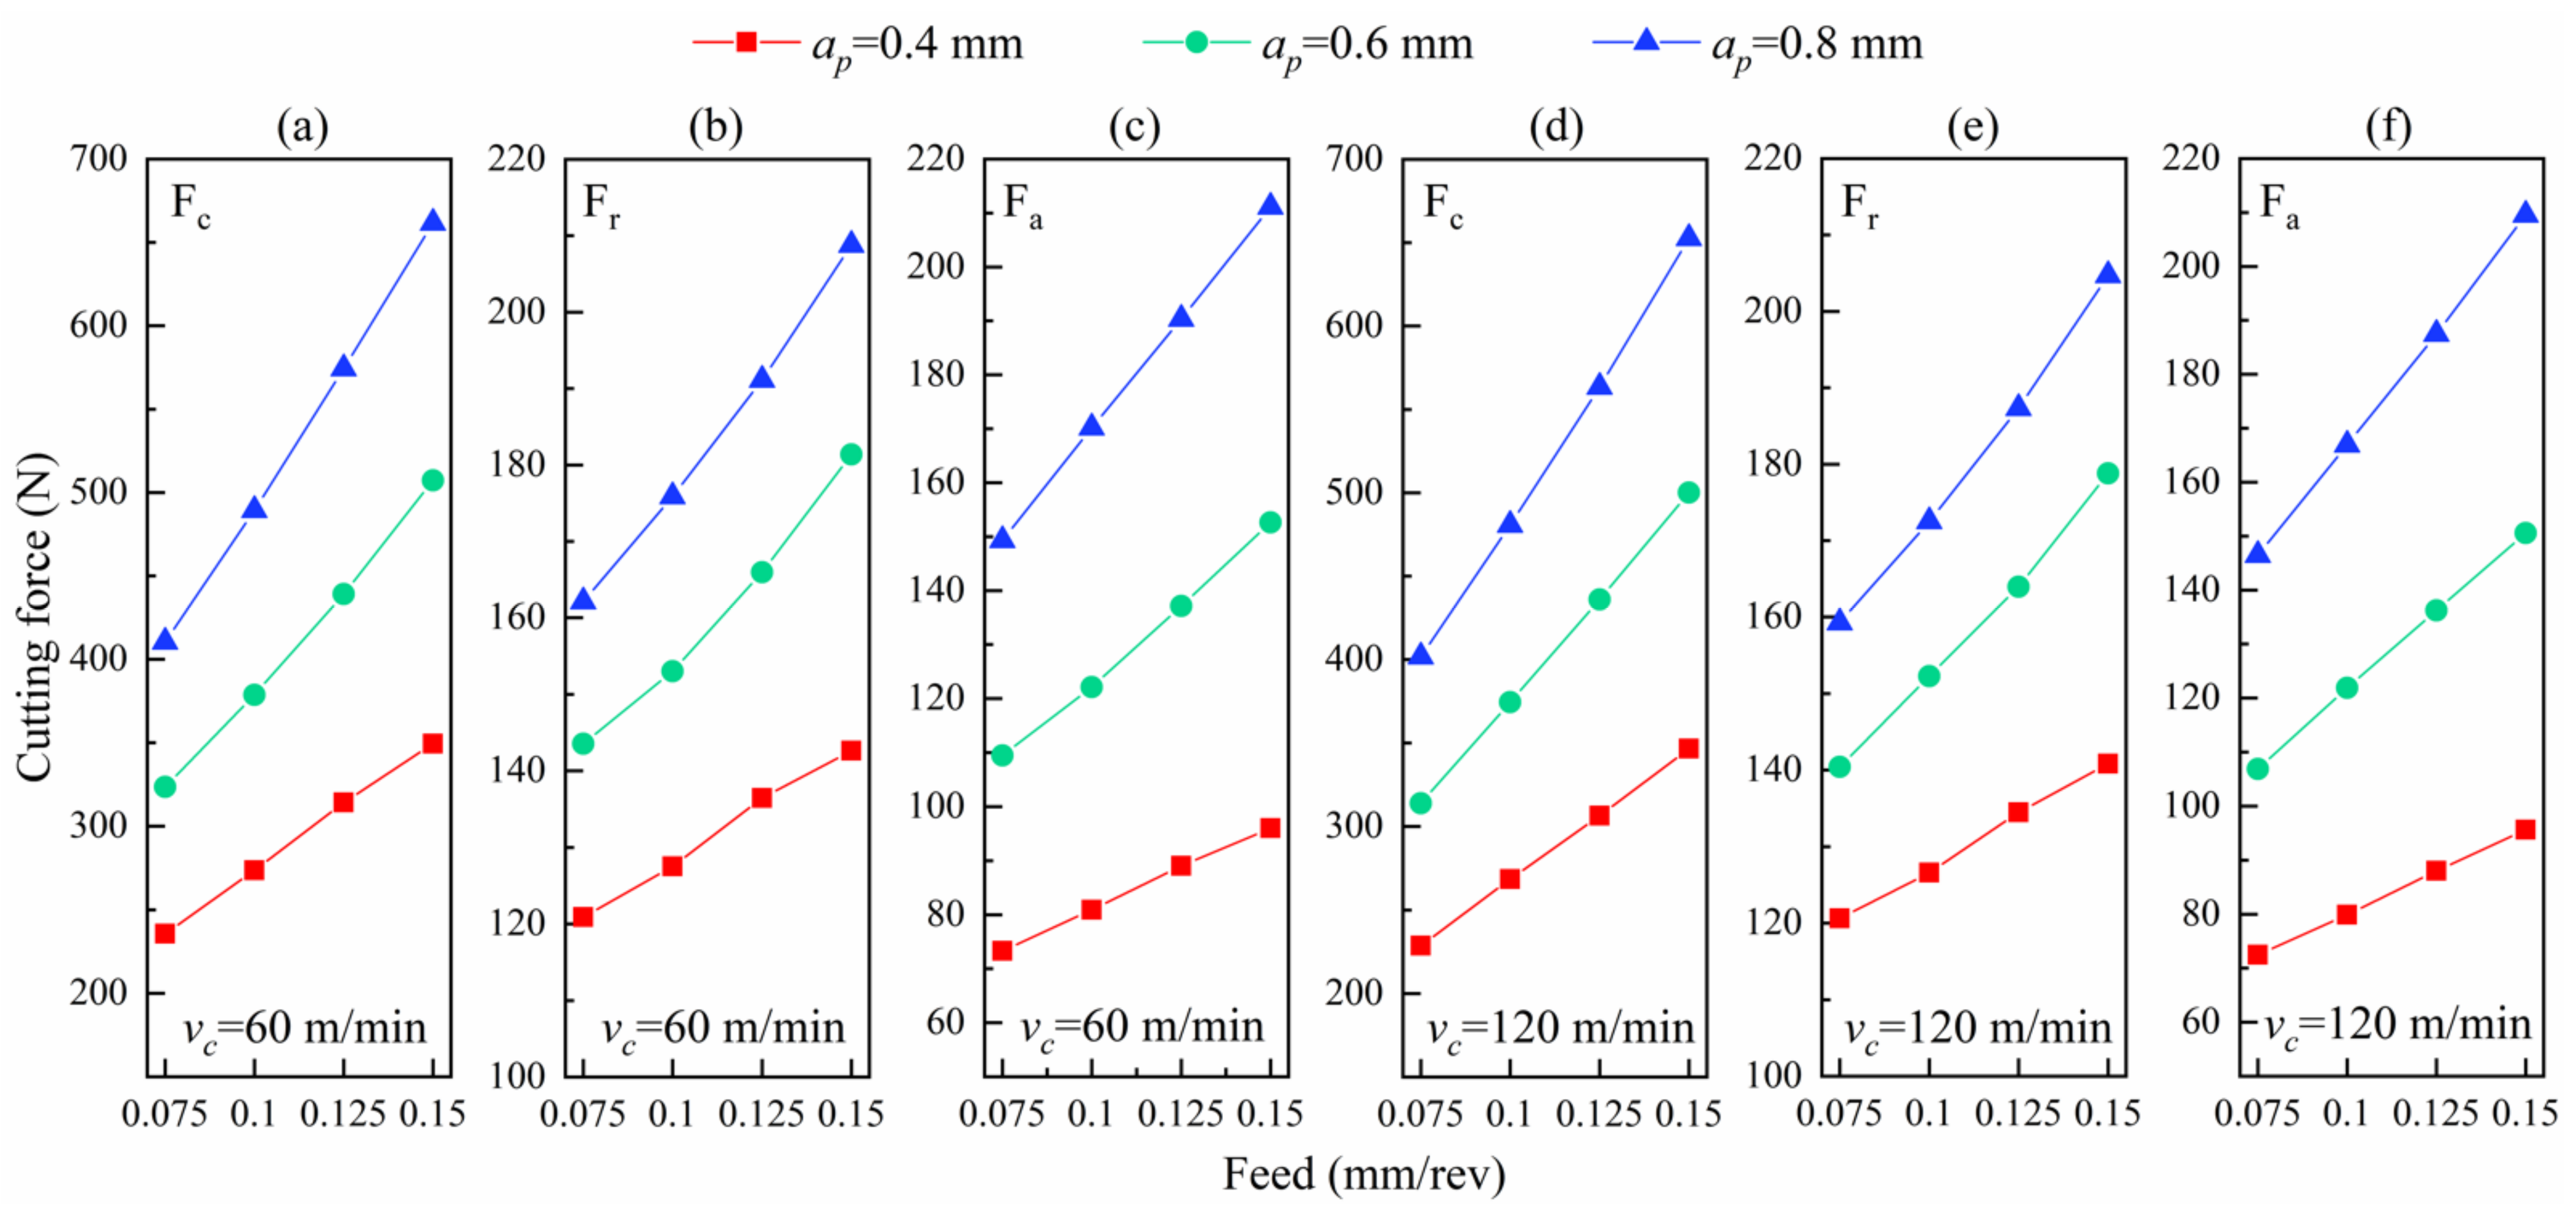
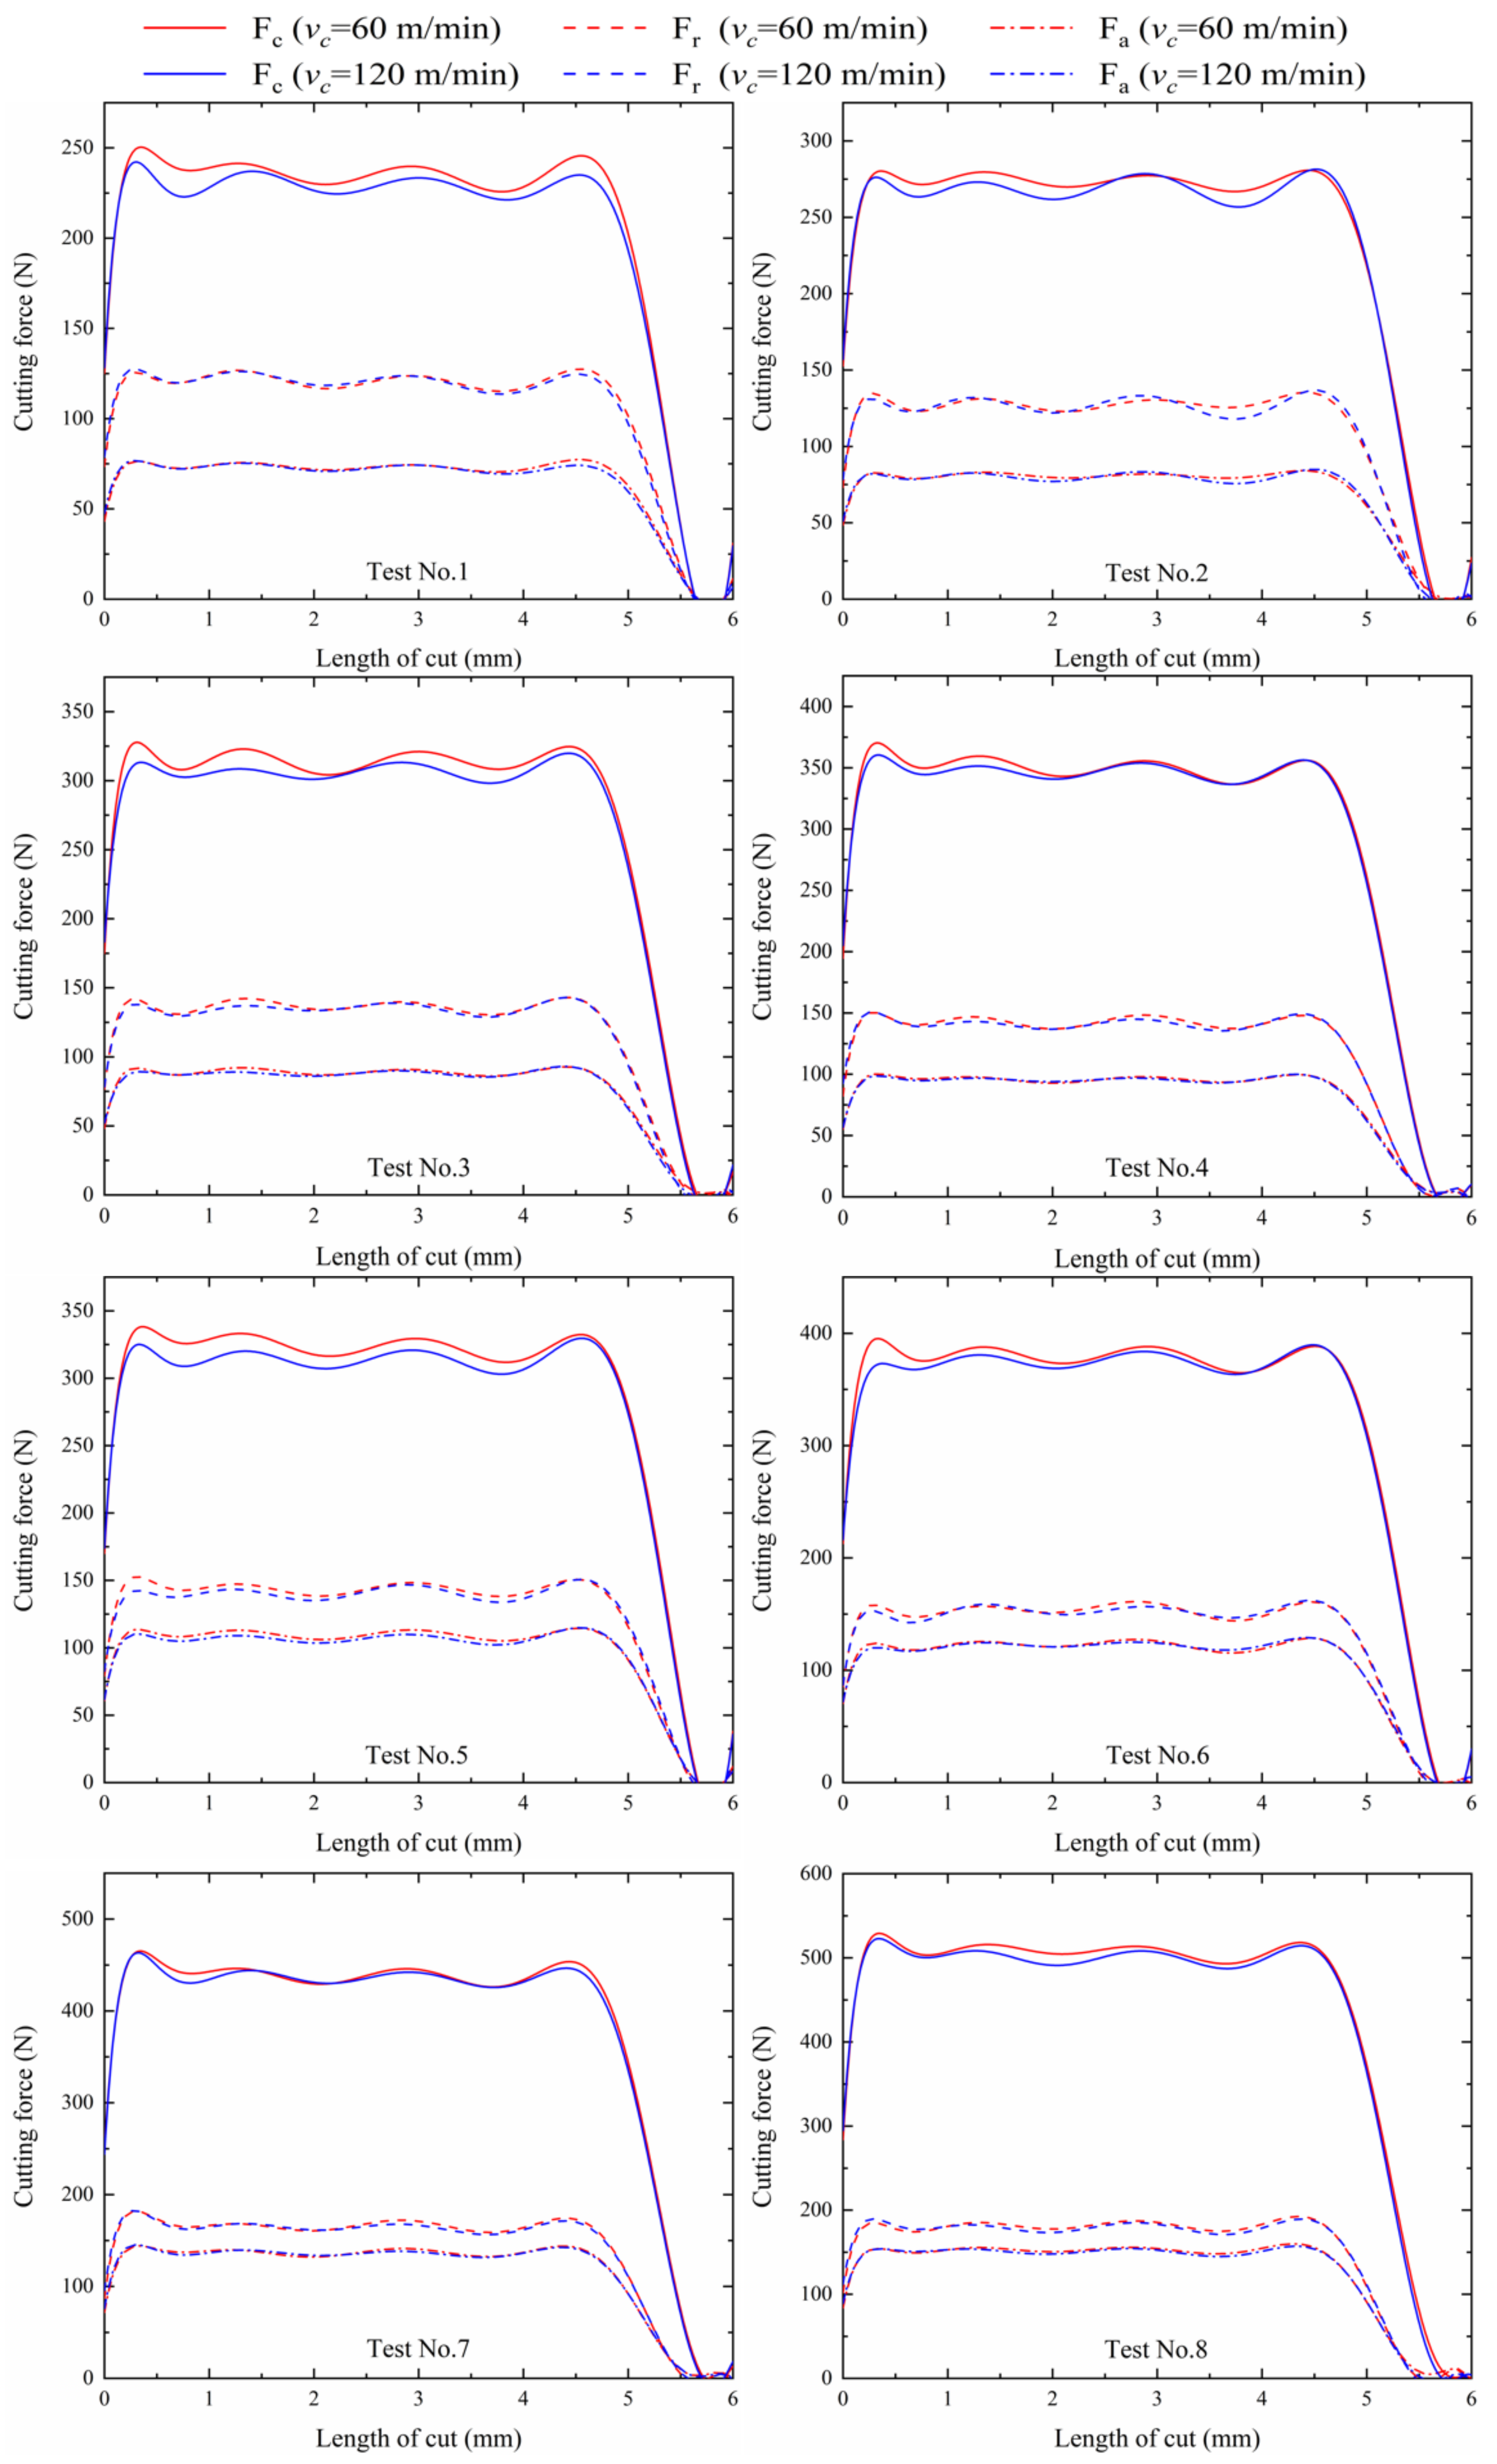
3.1. Analysis of Cutting Forces

The cutting forces extracted in simulations consist of three parts: the circumferential force (Fc), the radial force (Fr), and the axial force (Fa), as shown in Appendix A Figure A1. The changes of cutting forces with feed rate are shown in Figure 6 in the process of the cutting simulation. Figure 6a reveals that the circumferential force (Fc) rises with the growing feed rate (in the region of 0.075~0.15 mm/rev) when cutting speed remains at 60 m/min. Meanwhile, Fc arises with the increasing depth of cut, because the larger the cutting depth is, the more obvious the slope is. Similarly, the radial force (Fr) and the axial force (Fa) also rise with the growth of the feed rate, and their changes are more obvious with the rise of the feed rate when the depth of the cut goes up, as shown in Figure 6b,c. The circumferential, radial, and axial forces also show the same trends at the high cutting speed in Figure 6d–f.
The circumferential cutting forces at low speed (60 m/min) are higher than those at high speed (120 m/min), as seen from Figure 7a, which is also reflected in the radial component of the cutting forces in Figure 7b, as well as the axial component in Figure 7c. The reason for these is that the change of cutting forces with cutting speed is closely related to the cutting temperature. The cutting temperatures at high speed are higher than those at low speed, which causes a more intense thermal softening effect. Thus, the cutting forces are lower at the high than the low cutting speed.

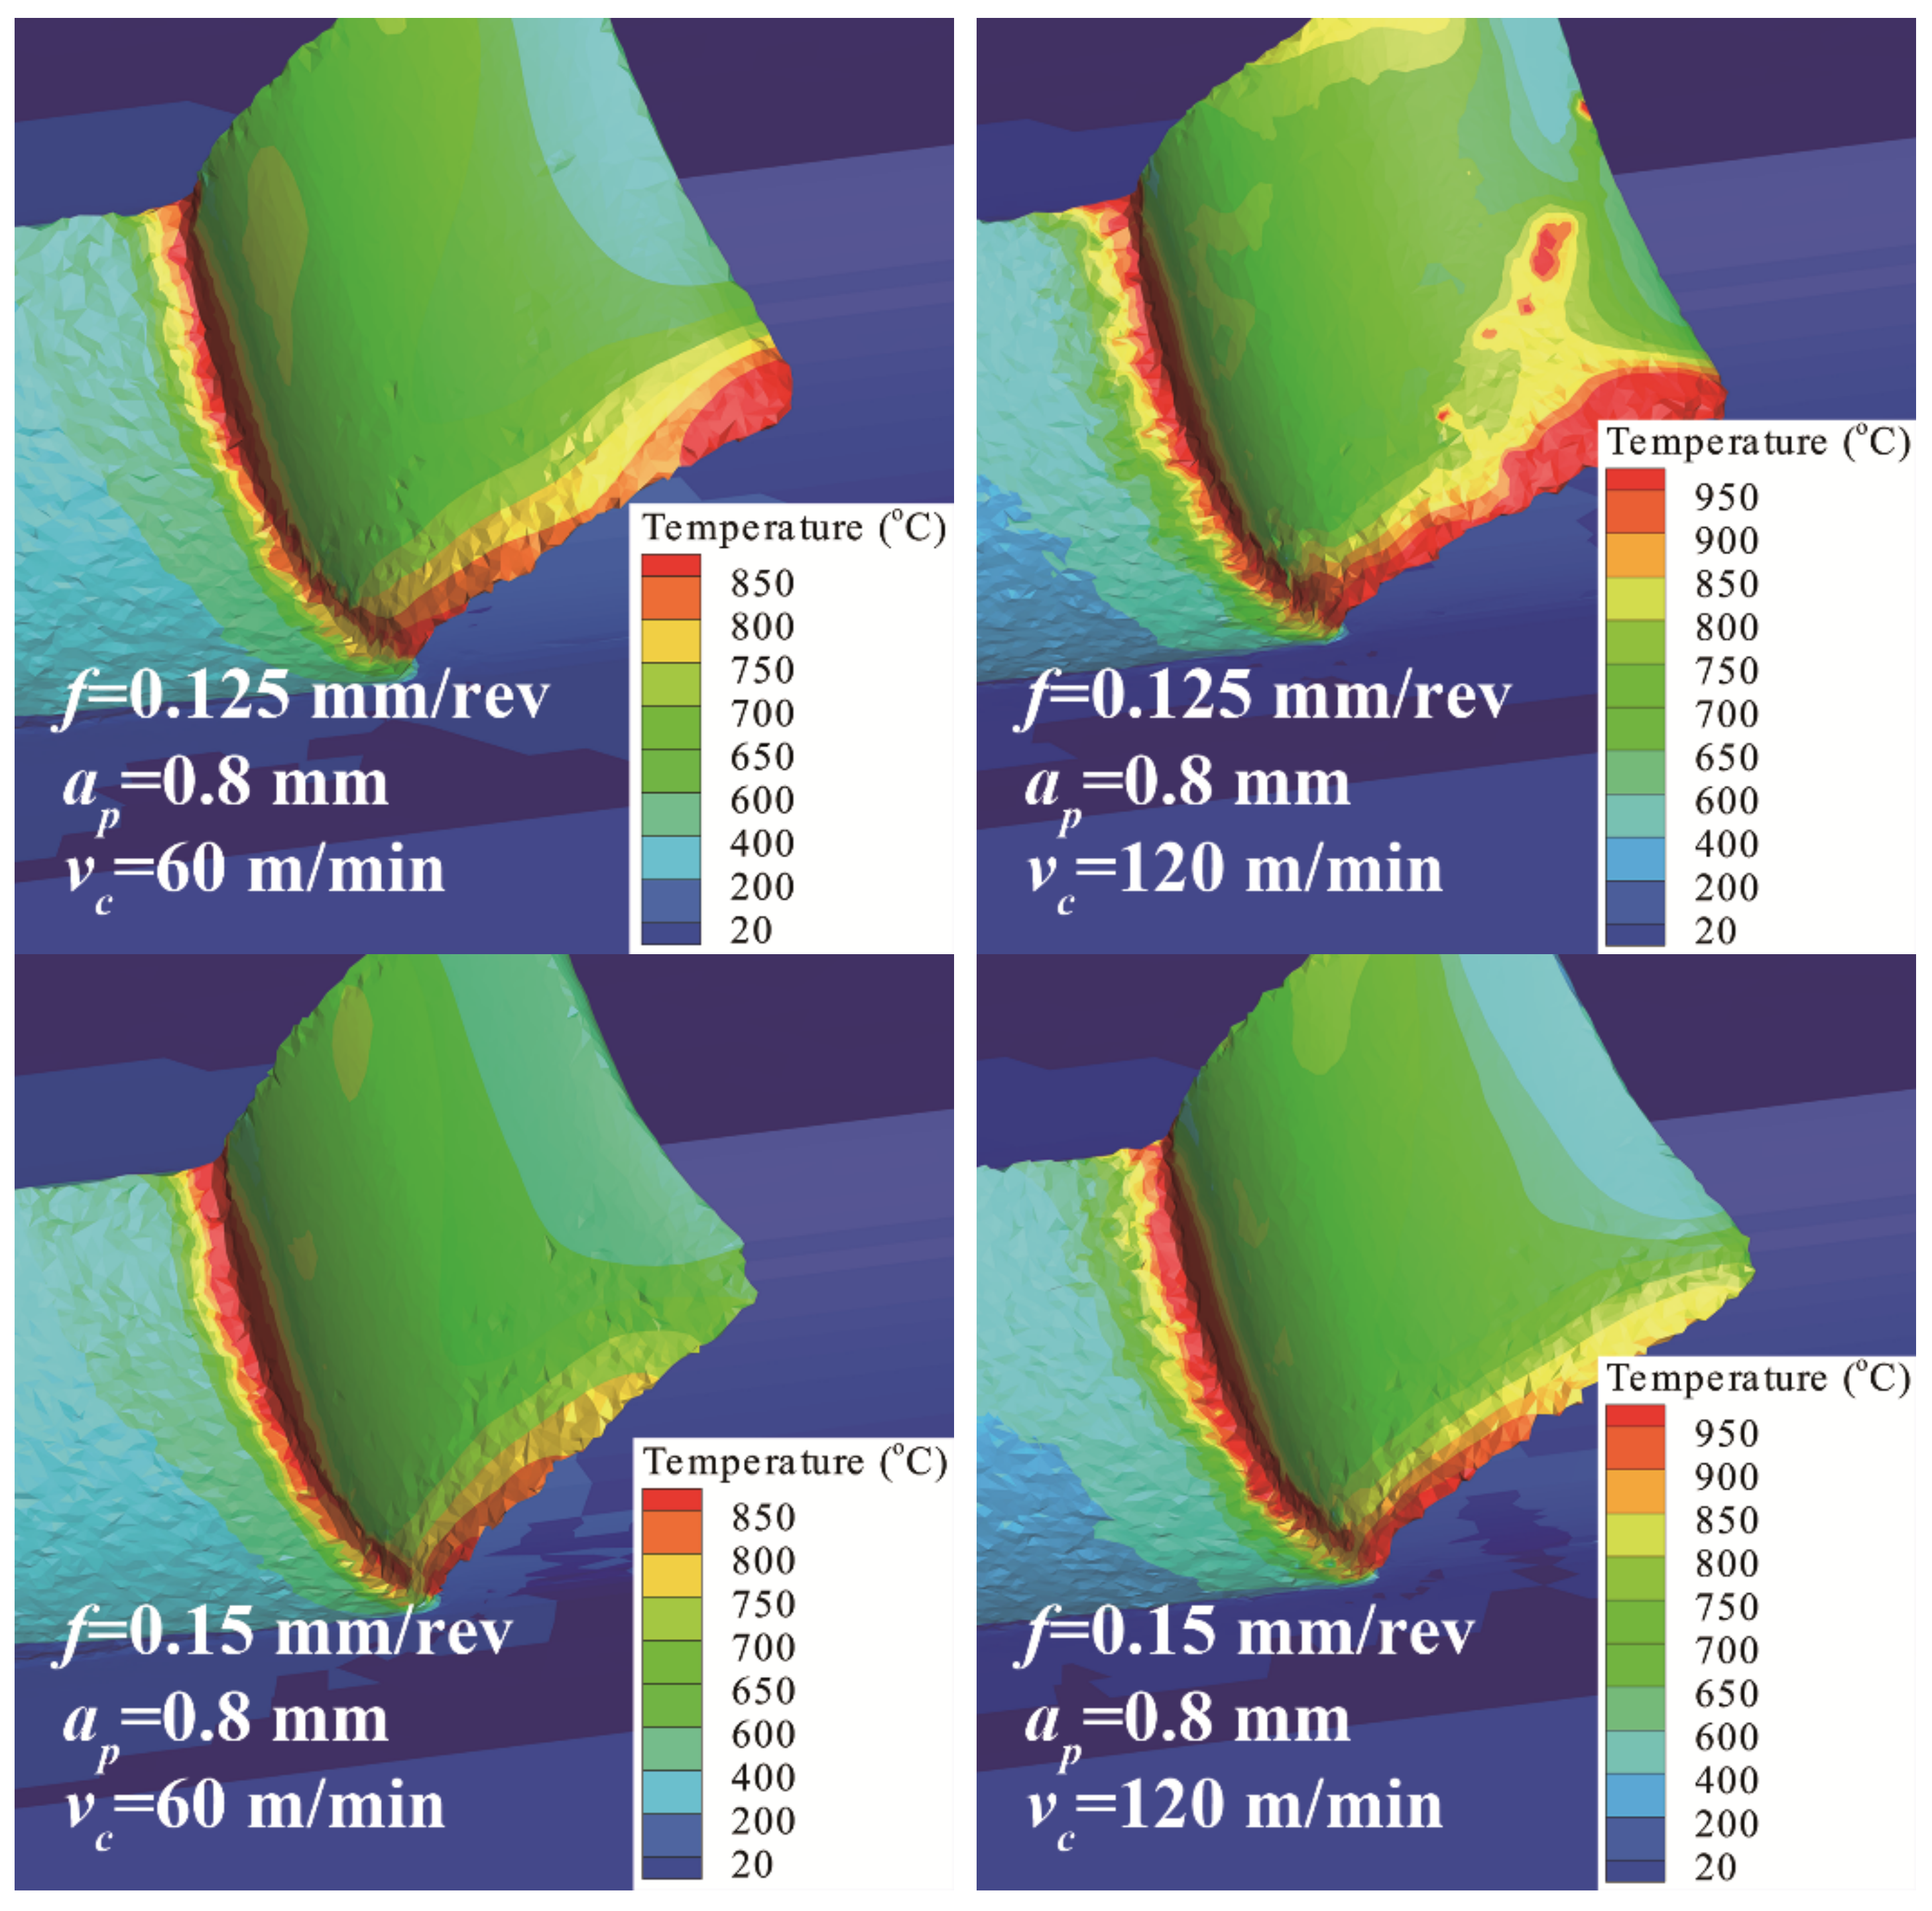
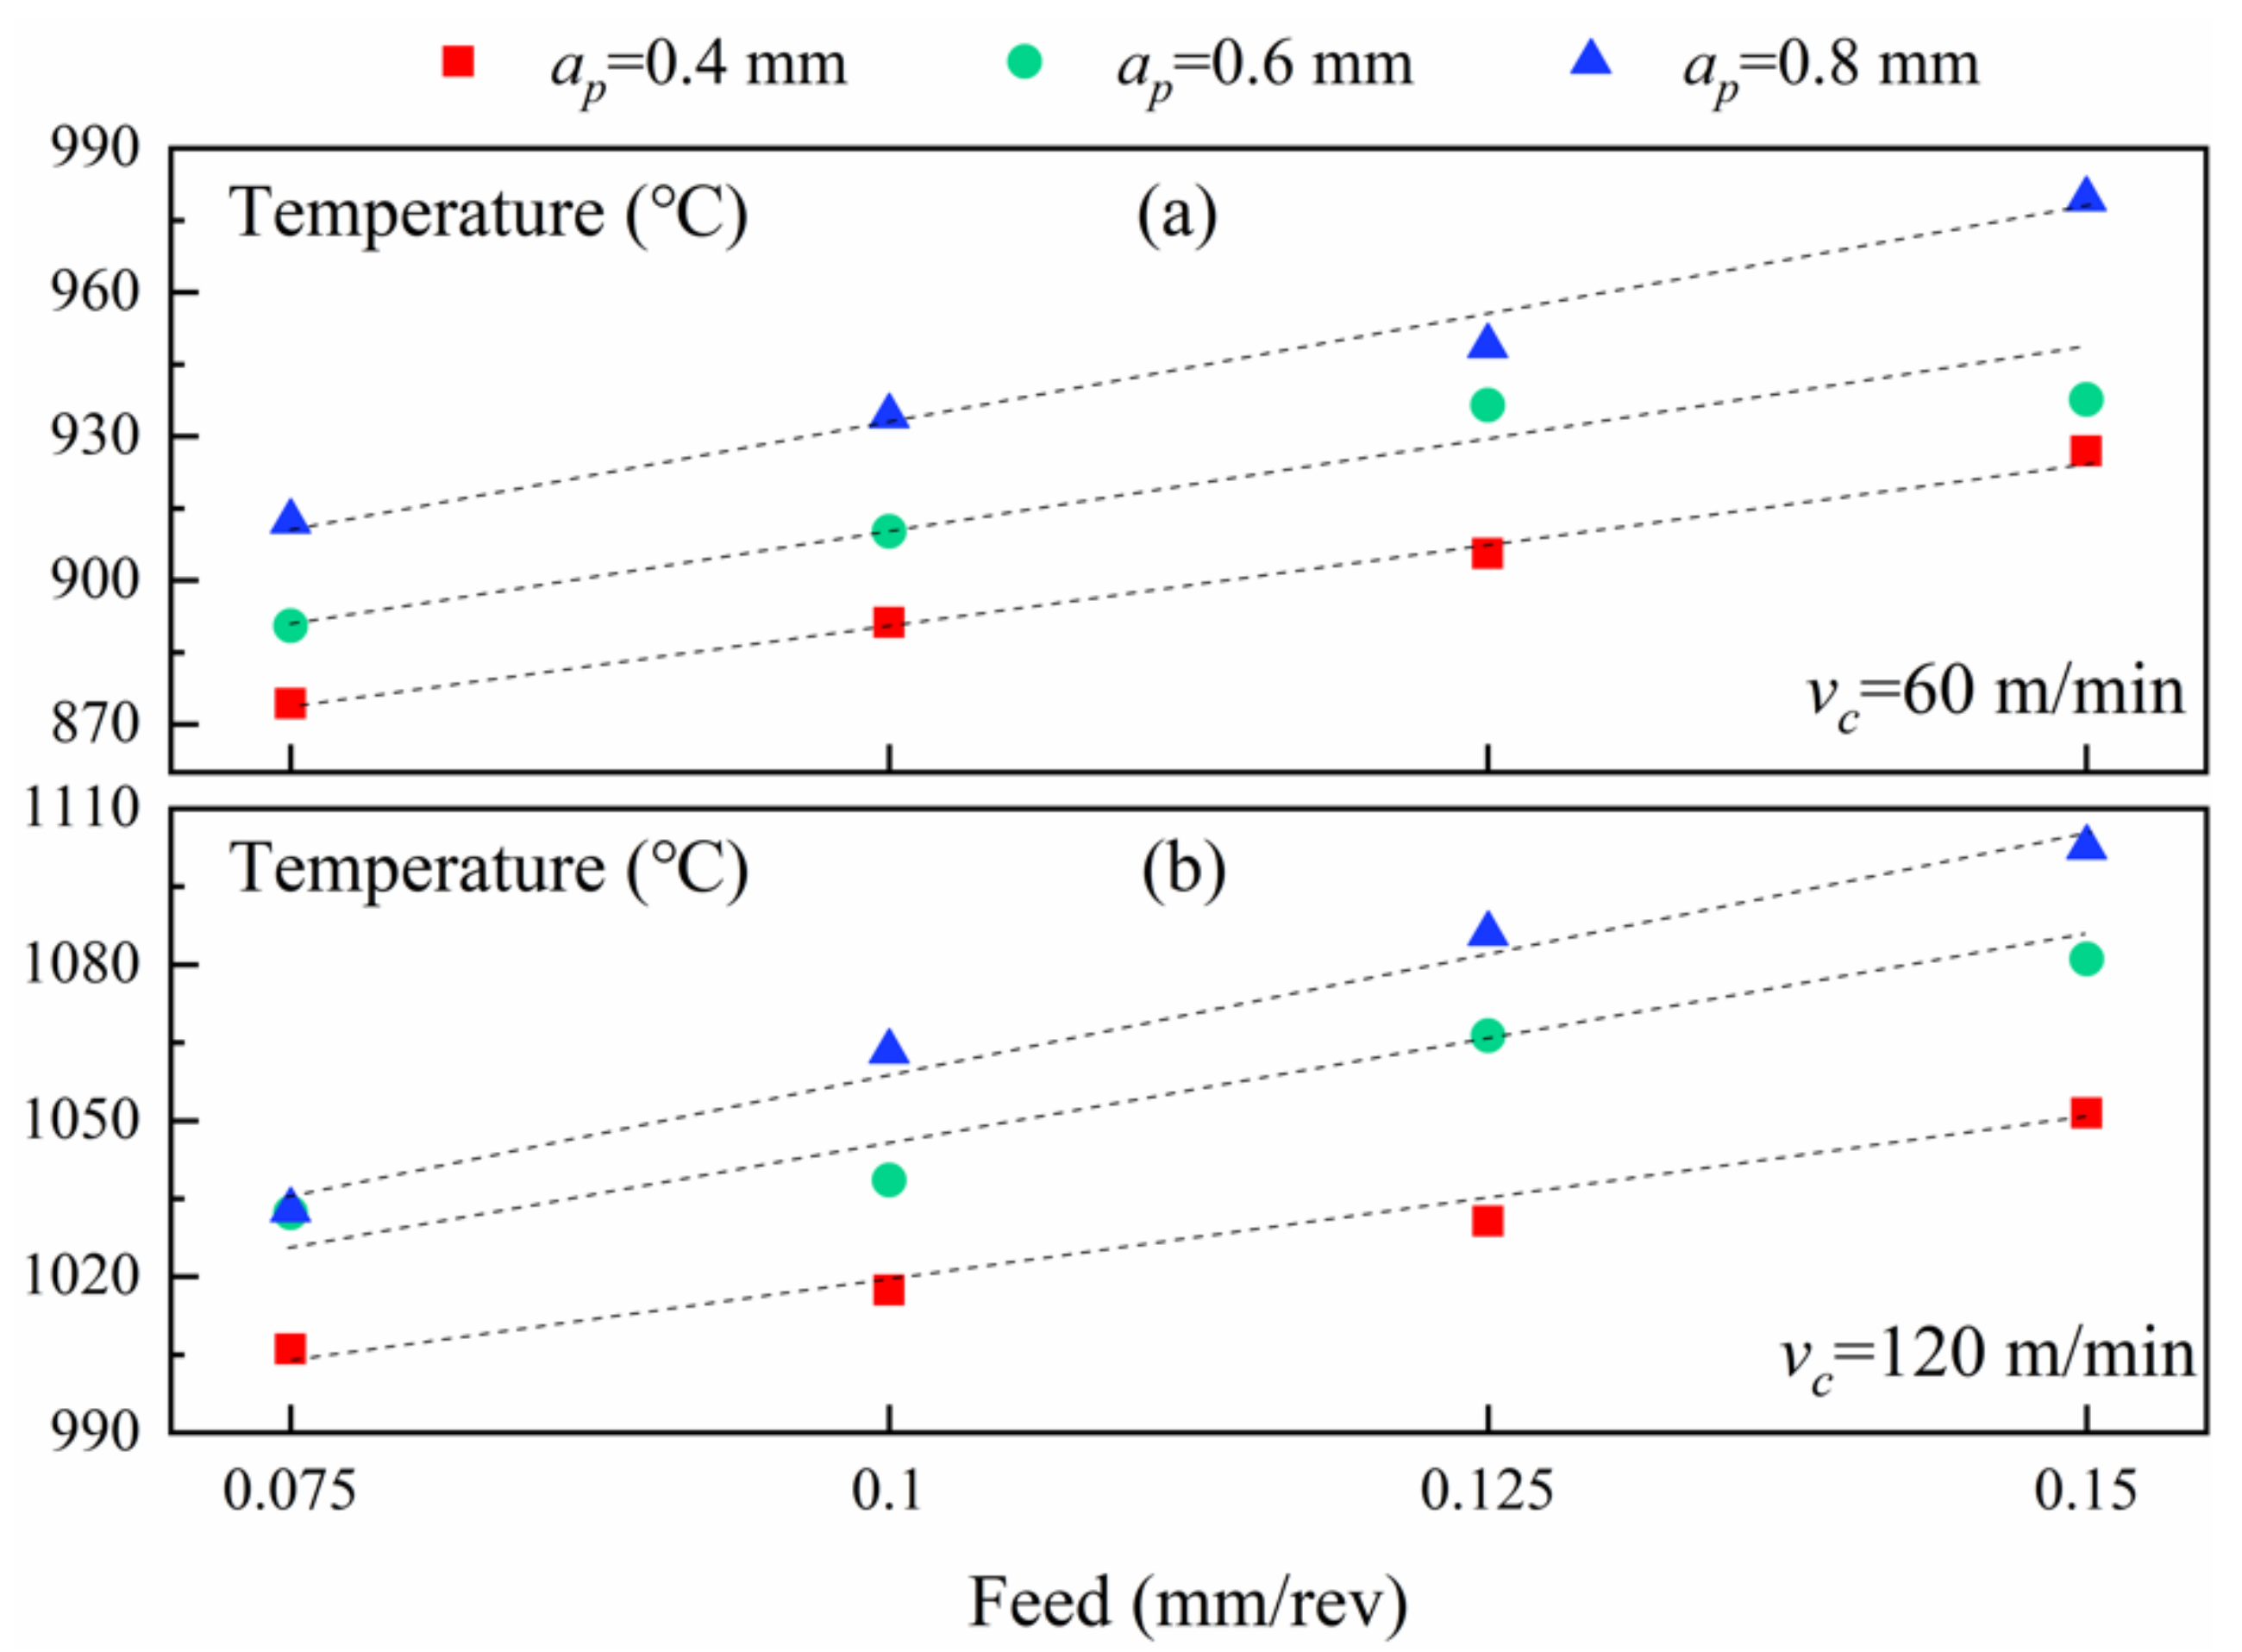
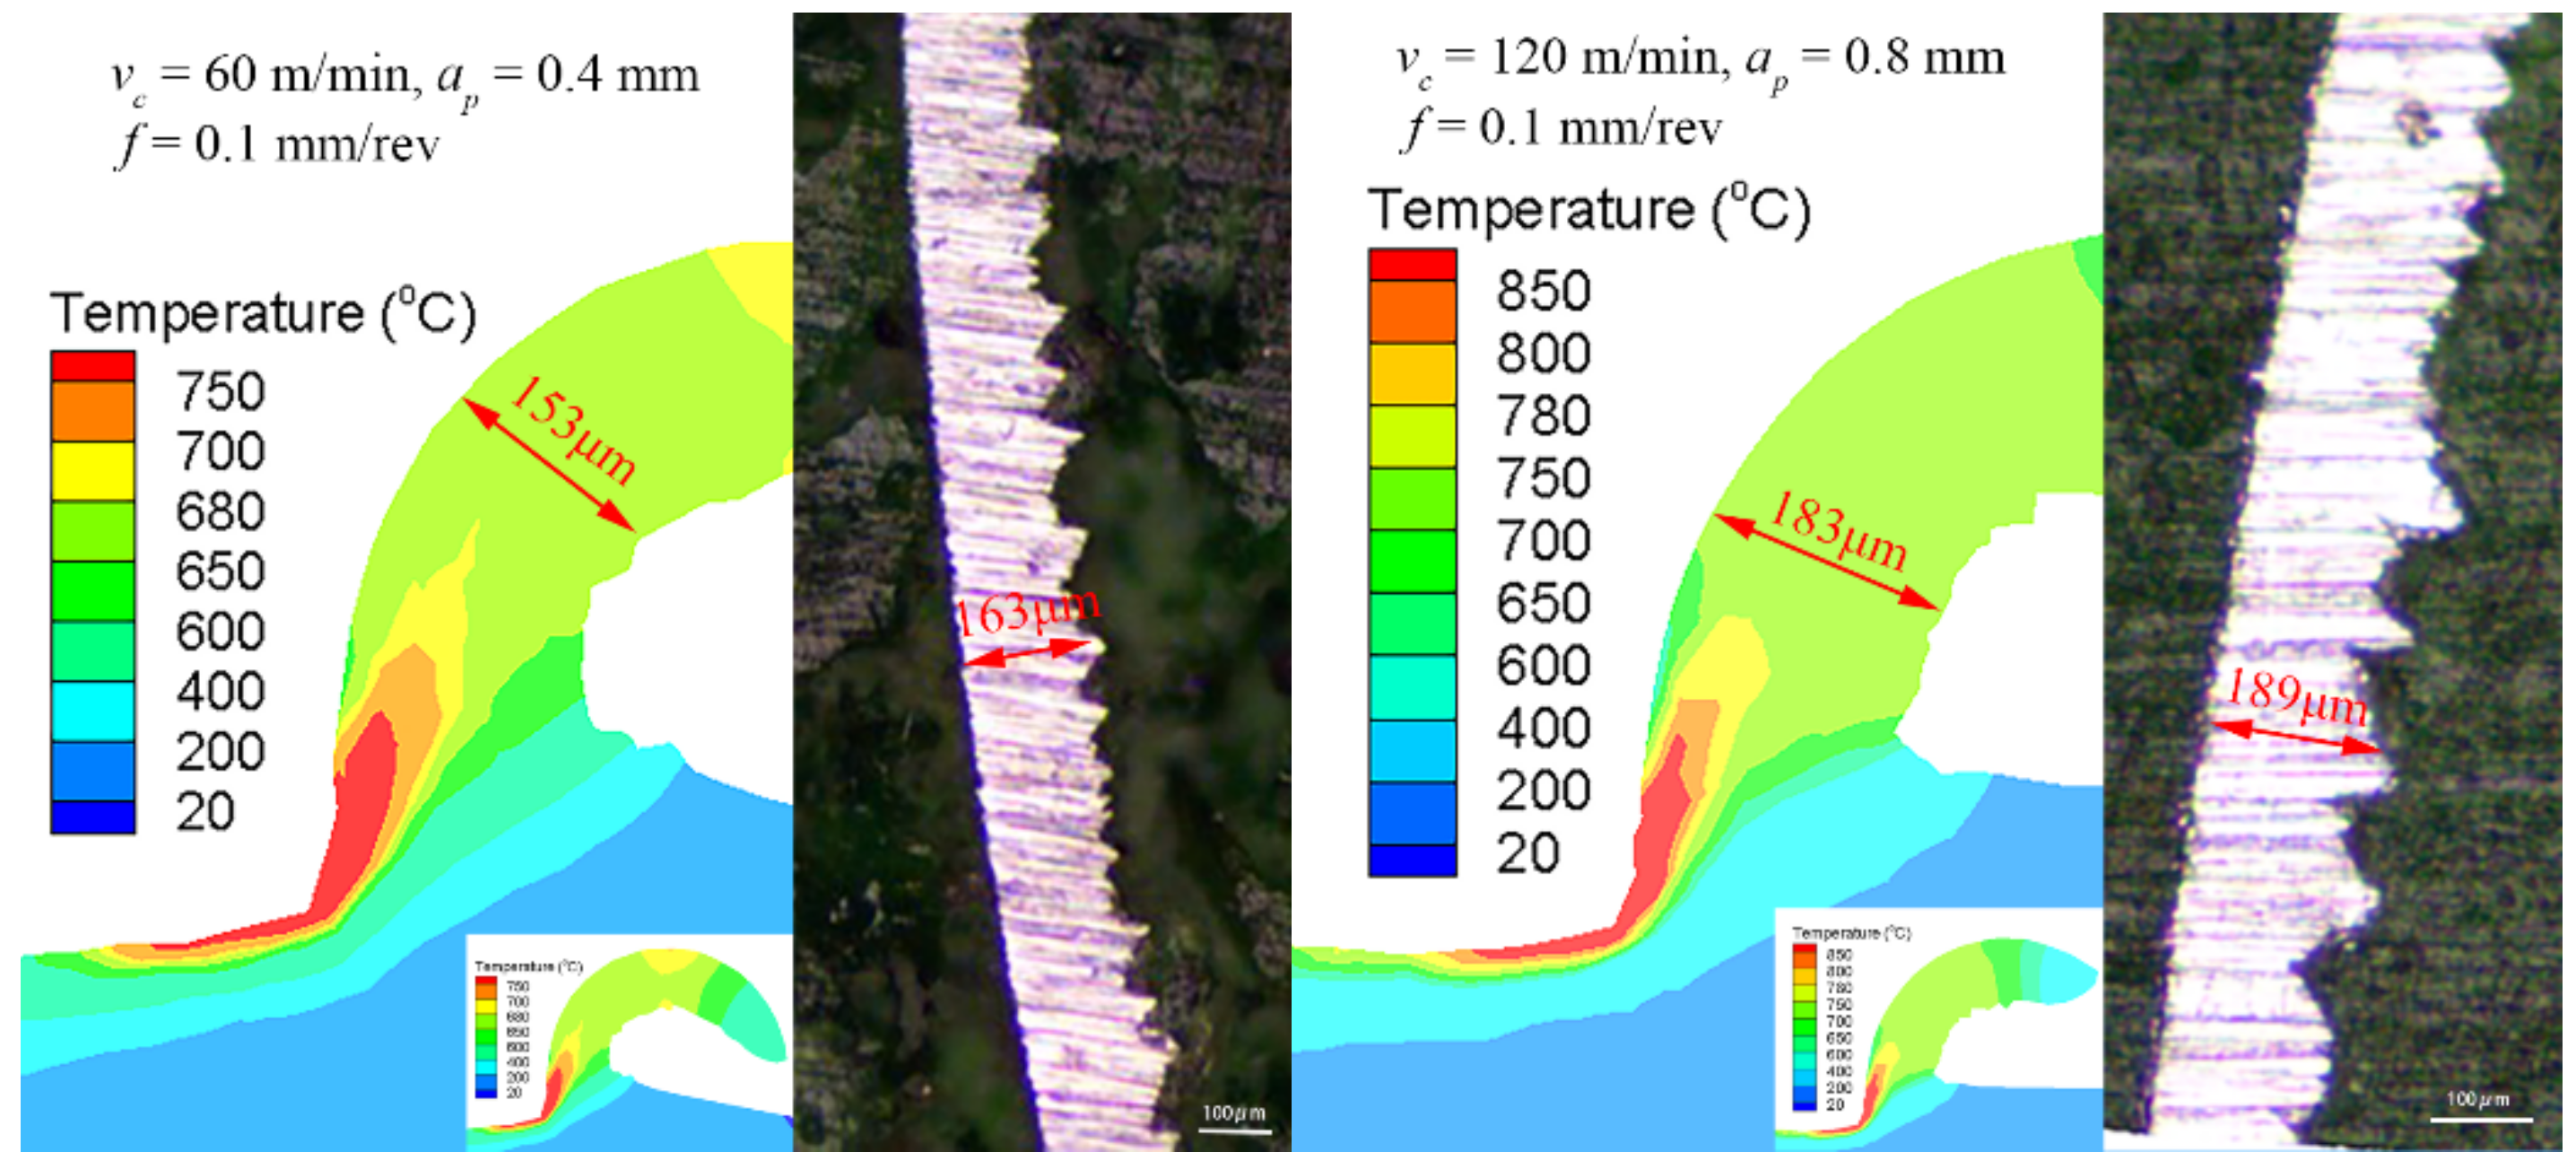
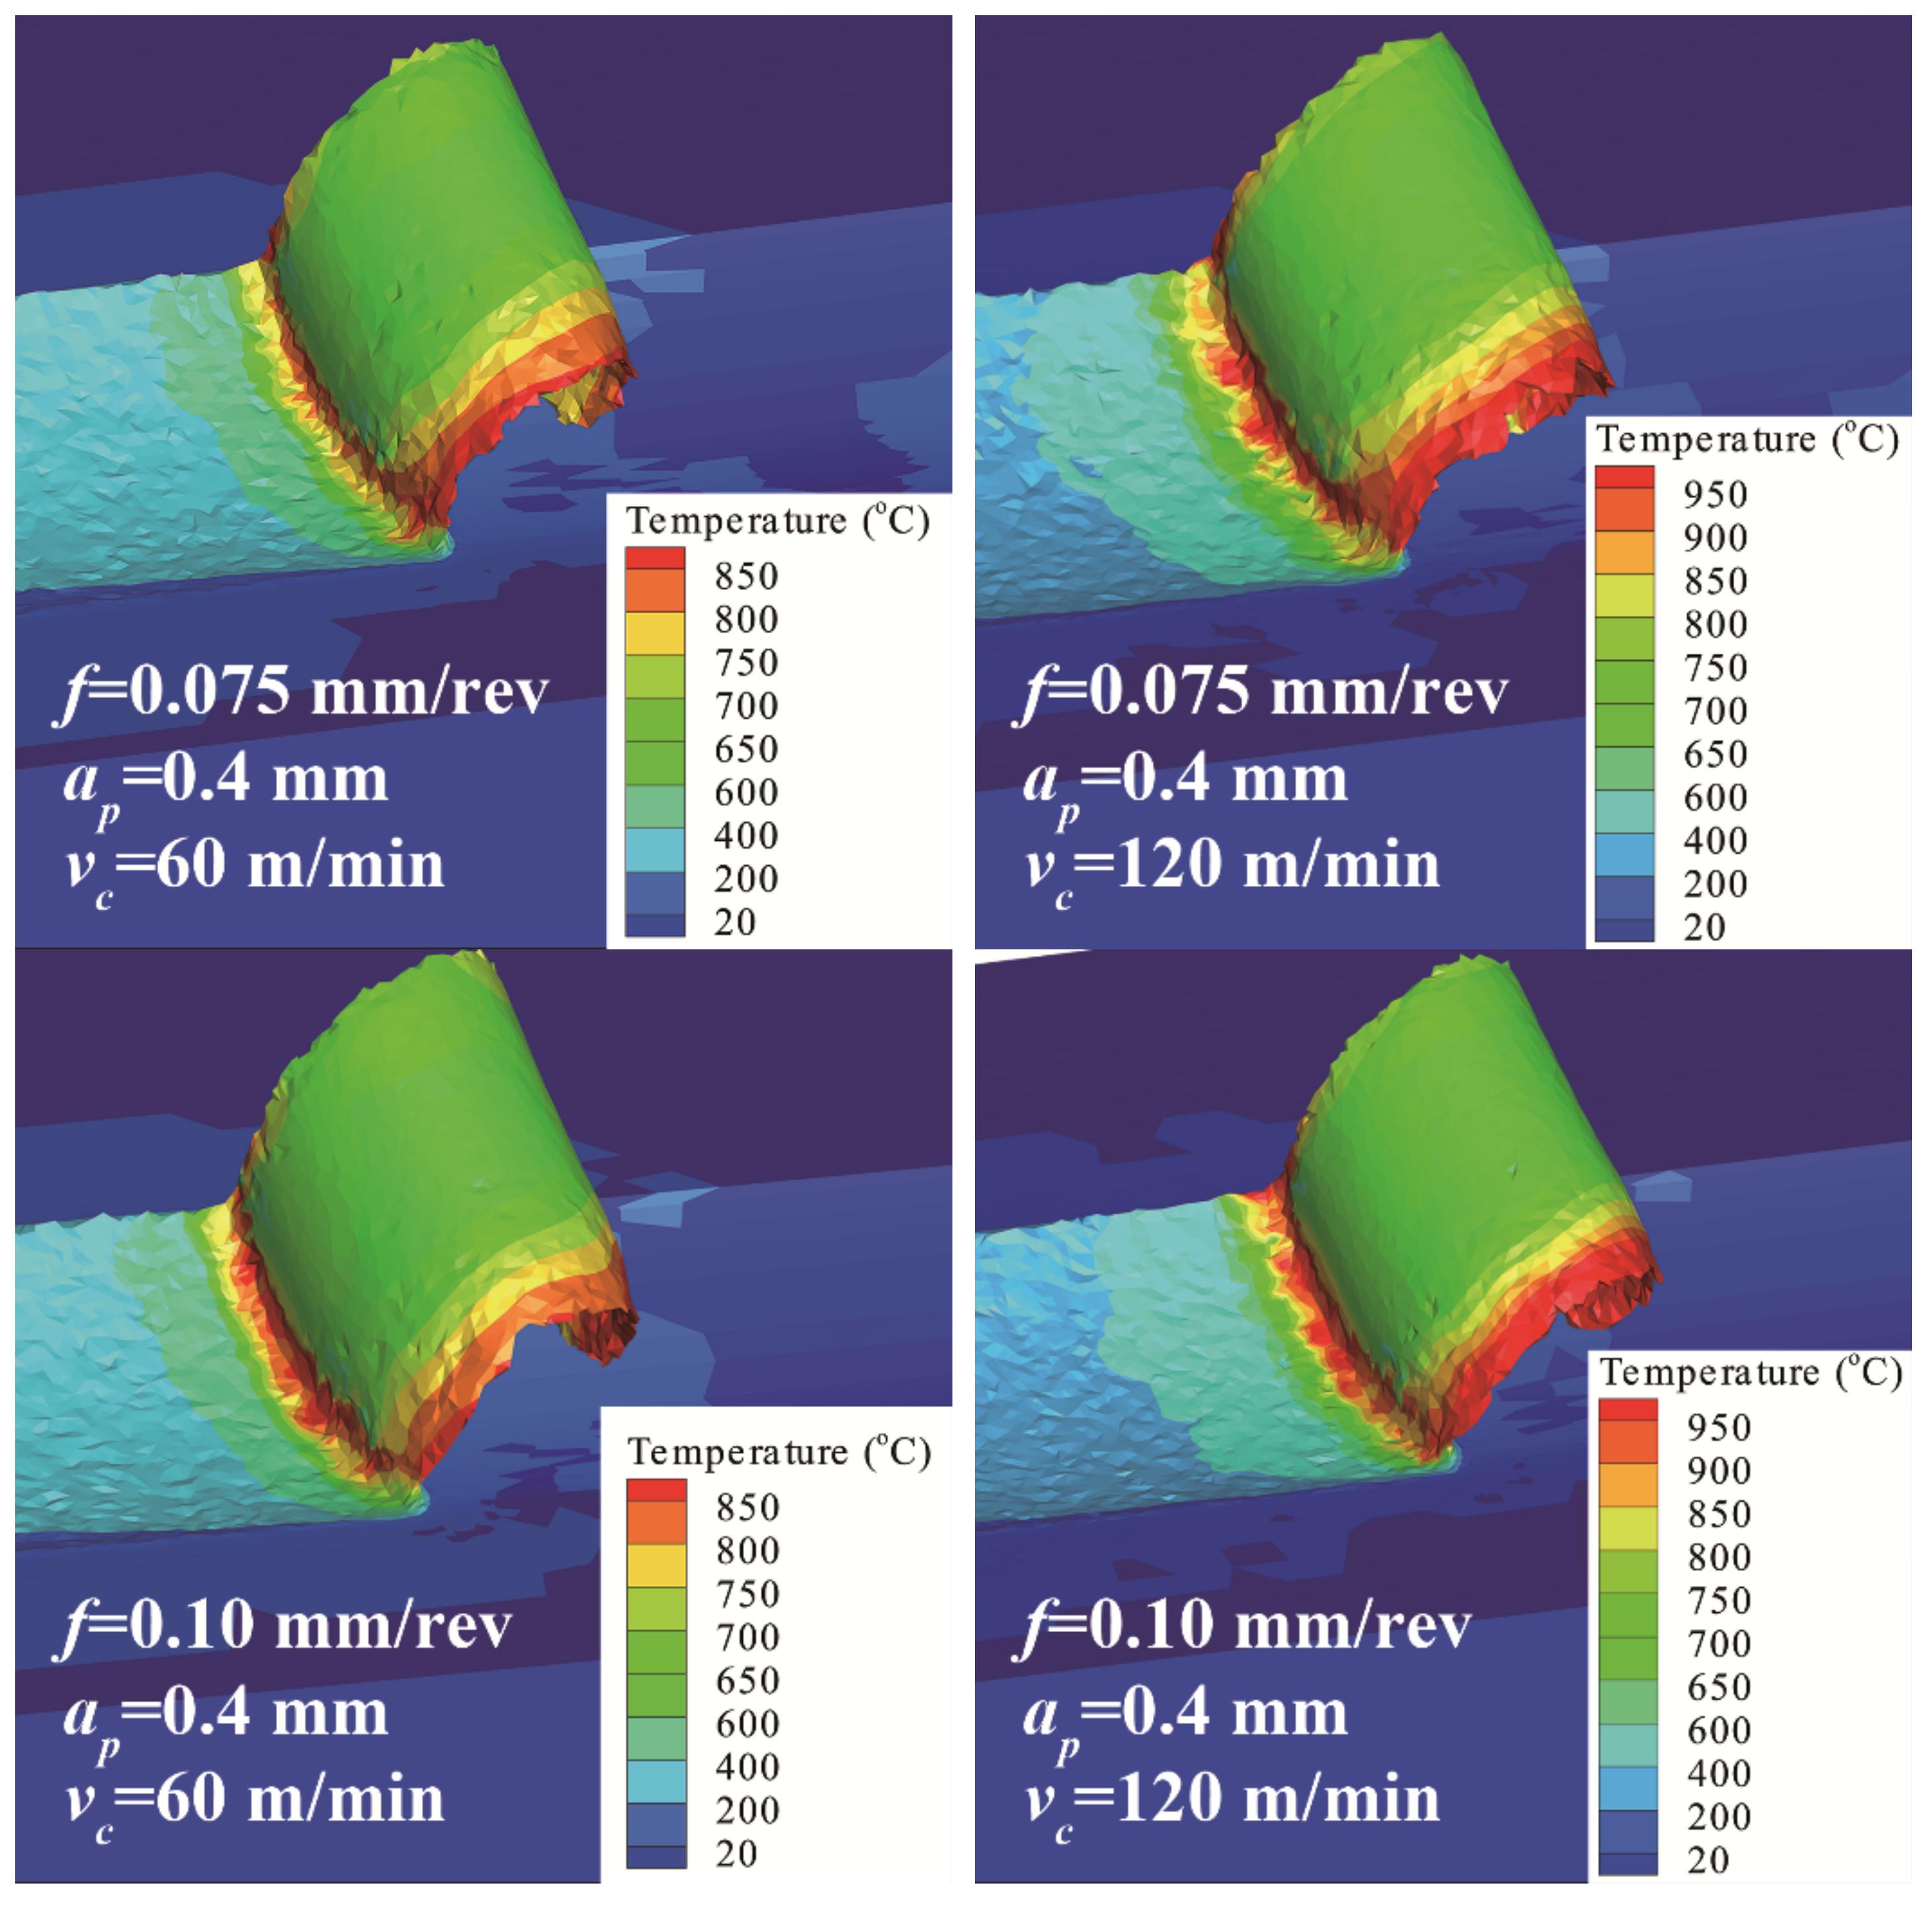
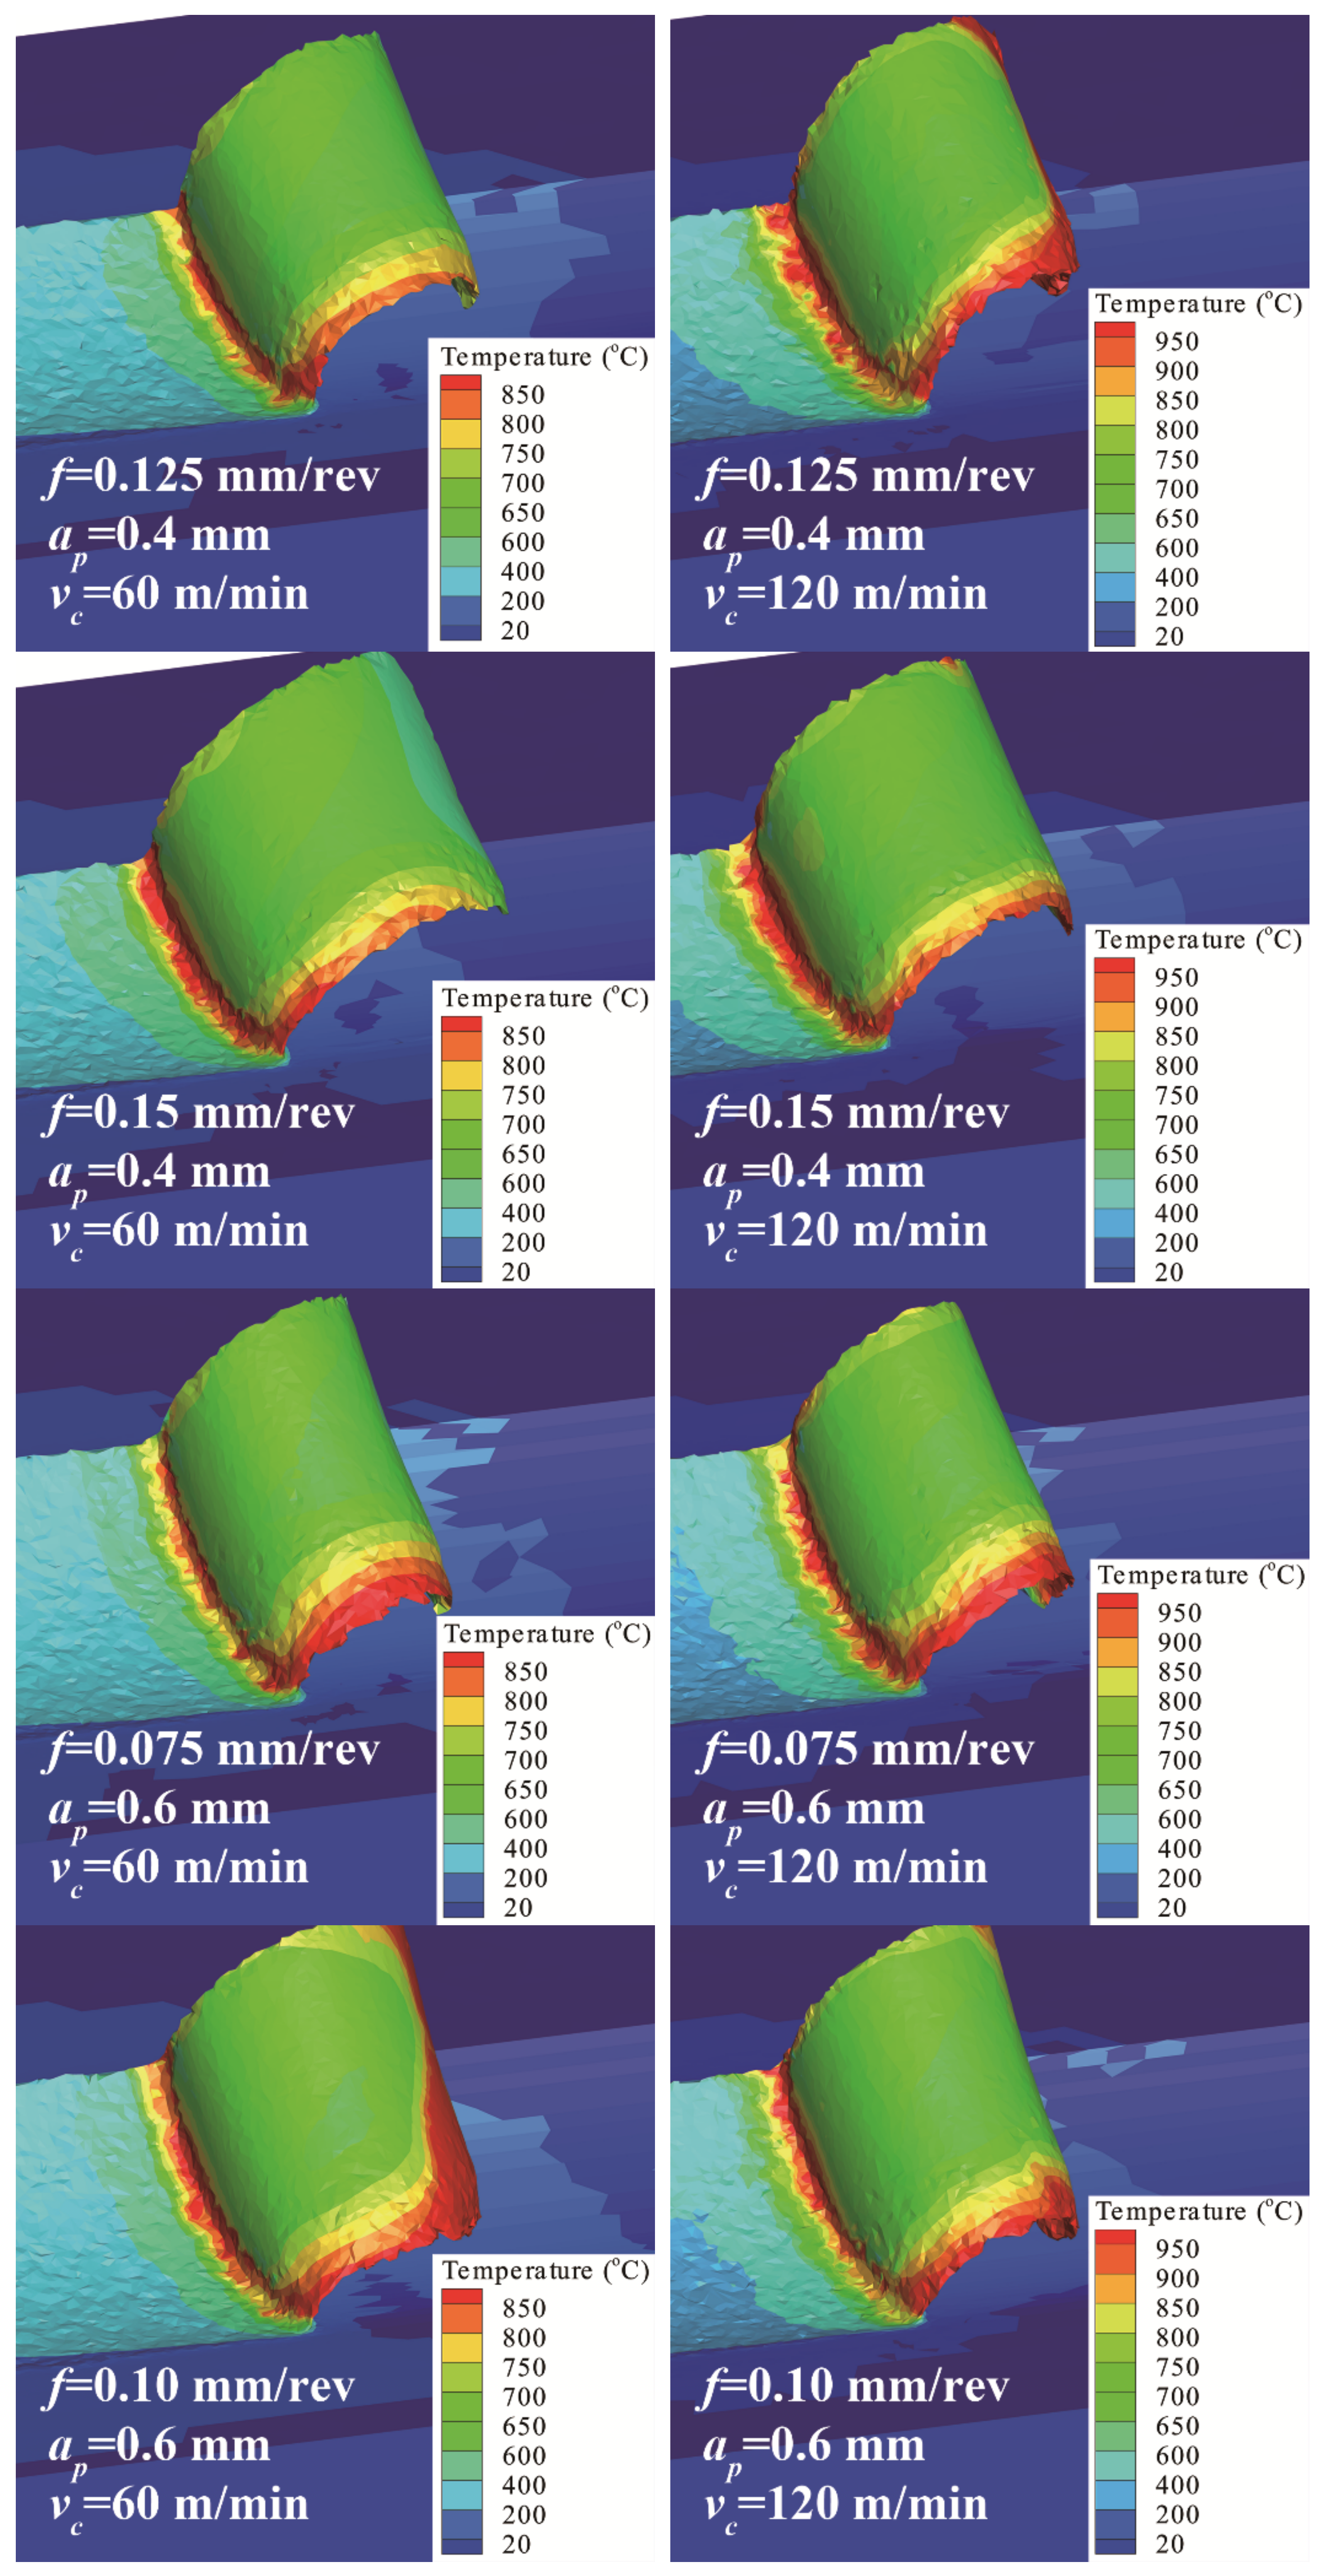
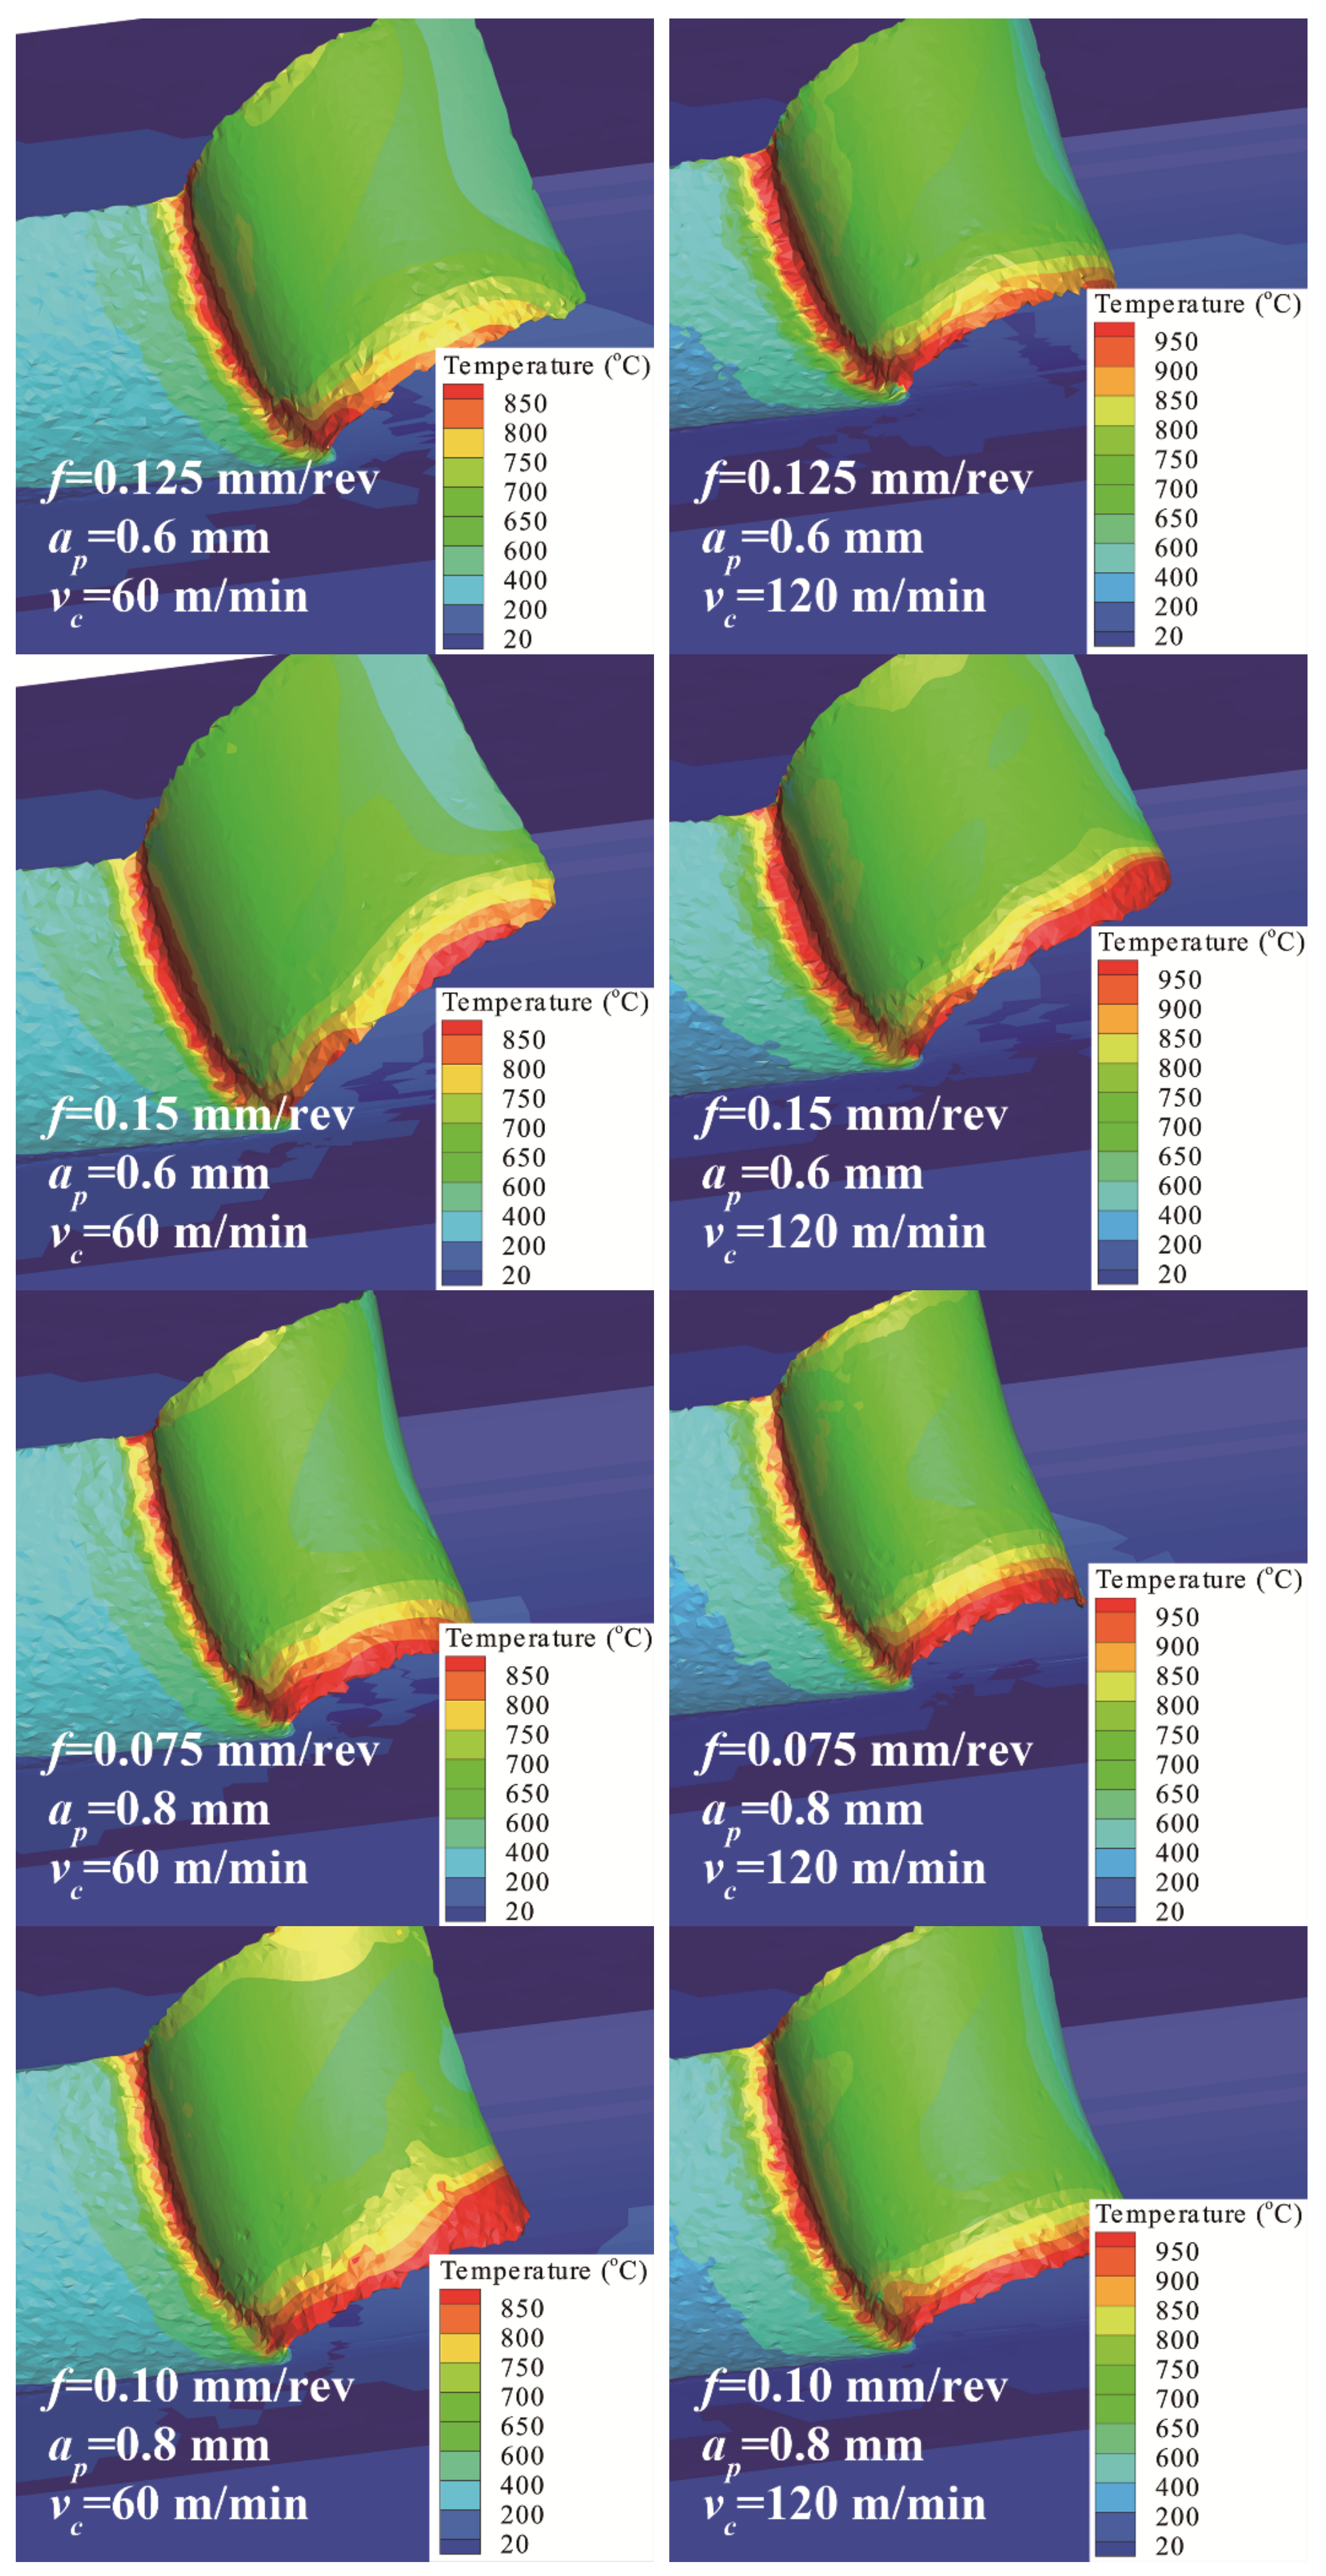
3.2. Analysis of Cutting Temperatures

The tool extrudes material on the front of the tool nose for turning. As the extrusion process continues, the material on the front of the tool nose slides along the shear plane, undergoes plastic deformation, and accumulates continuously to form chips. Meanwhile, the friction at contact of the chips and insert, and the friction among the insert and workpiece, also accompany this process. As shown in Figure 8, the material in the primary zone produces plastic deformation, which induces the temperature increase in the cutting region. Moreover, the friction among the rake face and chips in the secondary zone also raises the temperature of the cutting region. The increasing temperature further arises from the friction generated by the machined workpiece surface and tool flank face in the tertiary zone. The tool nose temperatures in the cutting process in the simulations are shown in Appendix A Figure A2. Figure 9a exhibits the changes of cutting temperature with raising the feed rate under the varying depth of cut at the speed of 60 m/min. The temperature in the cutting area climbs slowly with the feed rate for each depth of cut (the dotted lines in Figure 9 are not fitting lines, only changing trends). Of course, the temperature also decreases slightly for the 0.6 mm cutting depth and 0.15 mm/rev feed. Besides, the temperature in the cutting area rises with the growing cutting depth, which is correlated with degree of extrusion and sliding deformation in shear regions. Figure 9b displays the relationship between cutting temperature and feed when the cutting speed is 120 m/min. Generally, the cutting temperature climbs slowly with the rising feed rate. Moreover, the cutting temperature at 120 m/min grows with the rising depth of cut, which is parallel to that at 60 m/min.
The temperatures of material in the contact region of the tool nose during turning are high at 120 m/min, compared to significantly lower temperatures at 60 m/min, as displayed in Figure 7d. The frictions in the secondary zone and tertiary zone are further intensified when the cutting speed increases. Therefore, more heat is accumulated in the material at the front of the tool nose at high turning speed. The cutting temperature is higher at high cutting speed than the low speed for the same heat dissipation conditions.

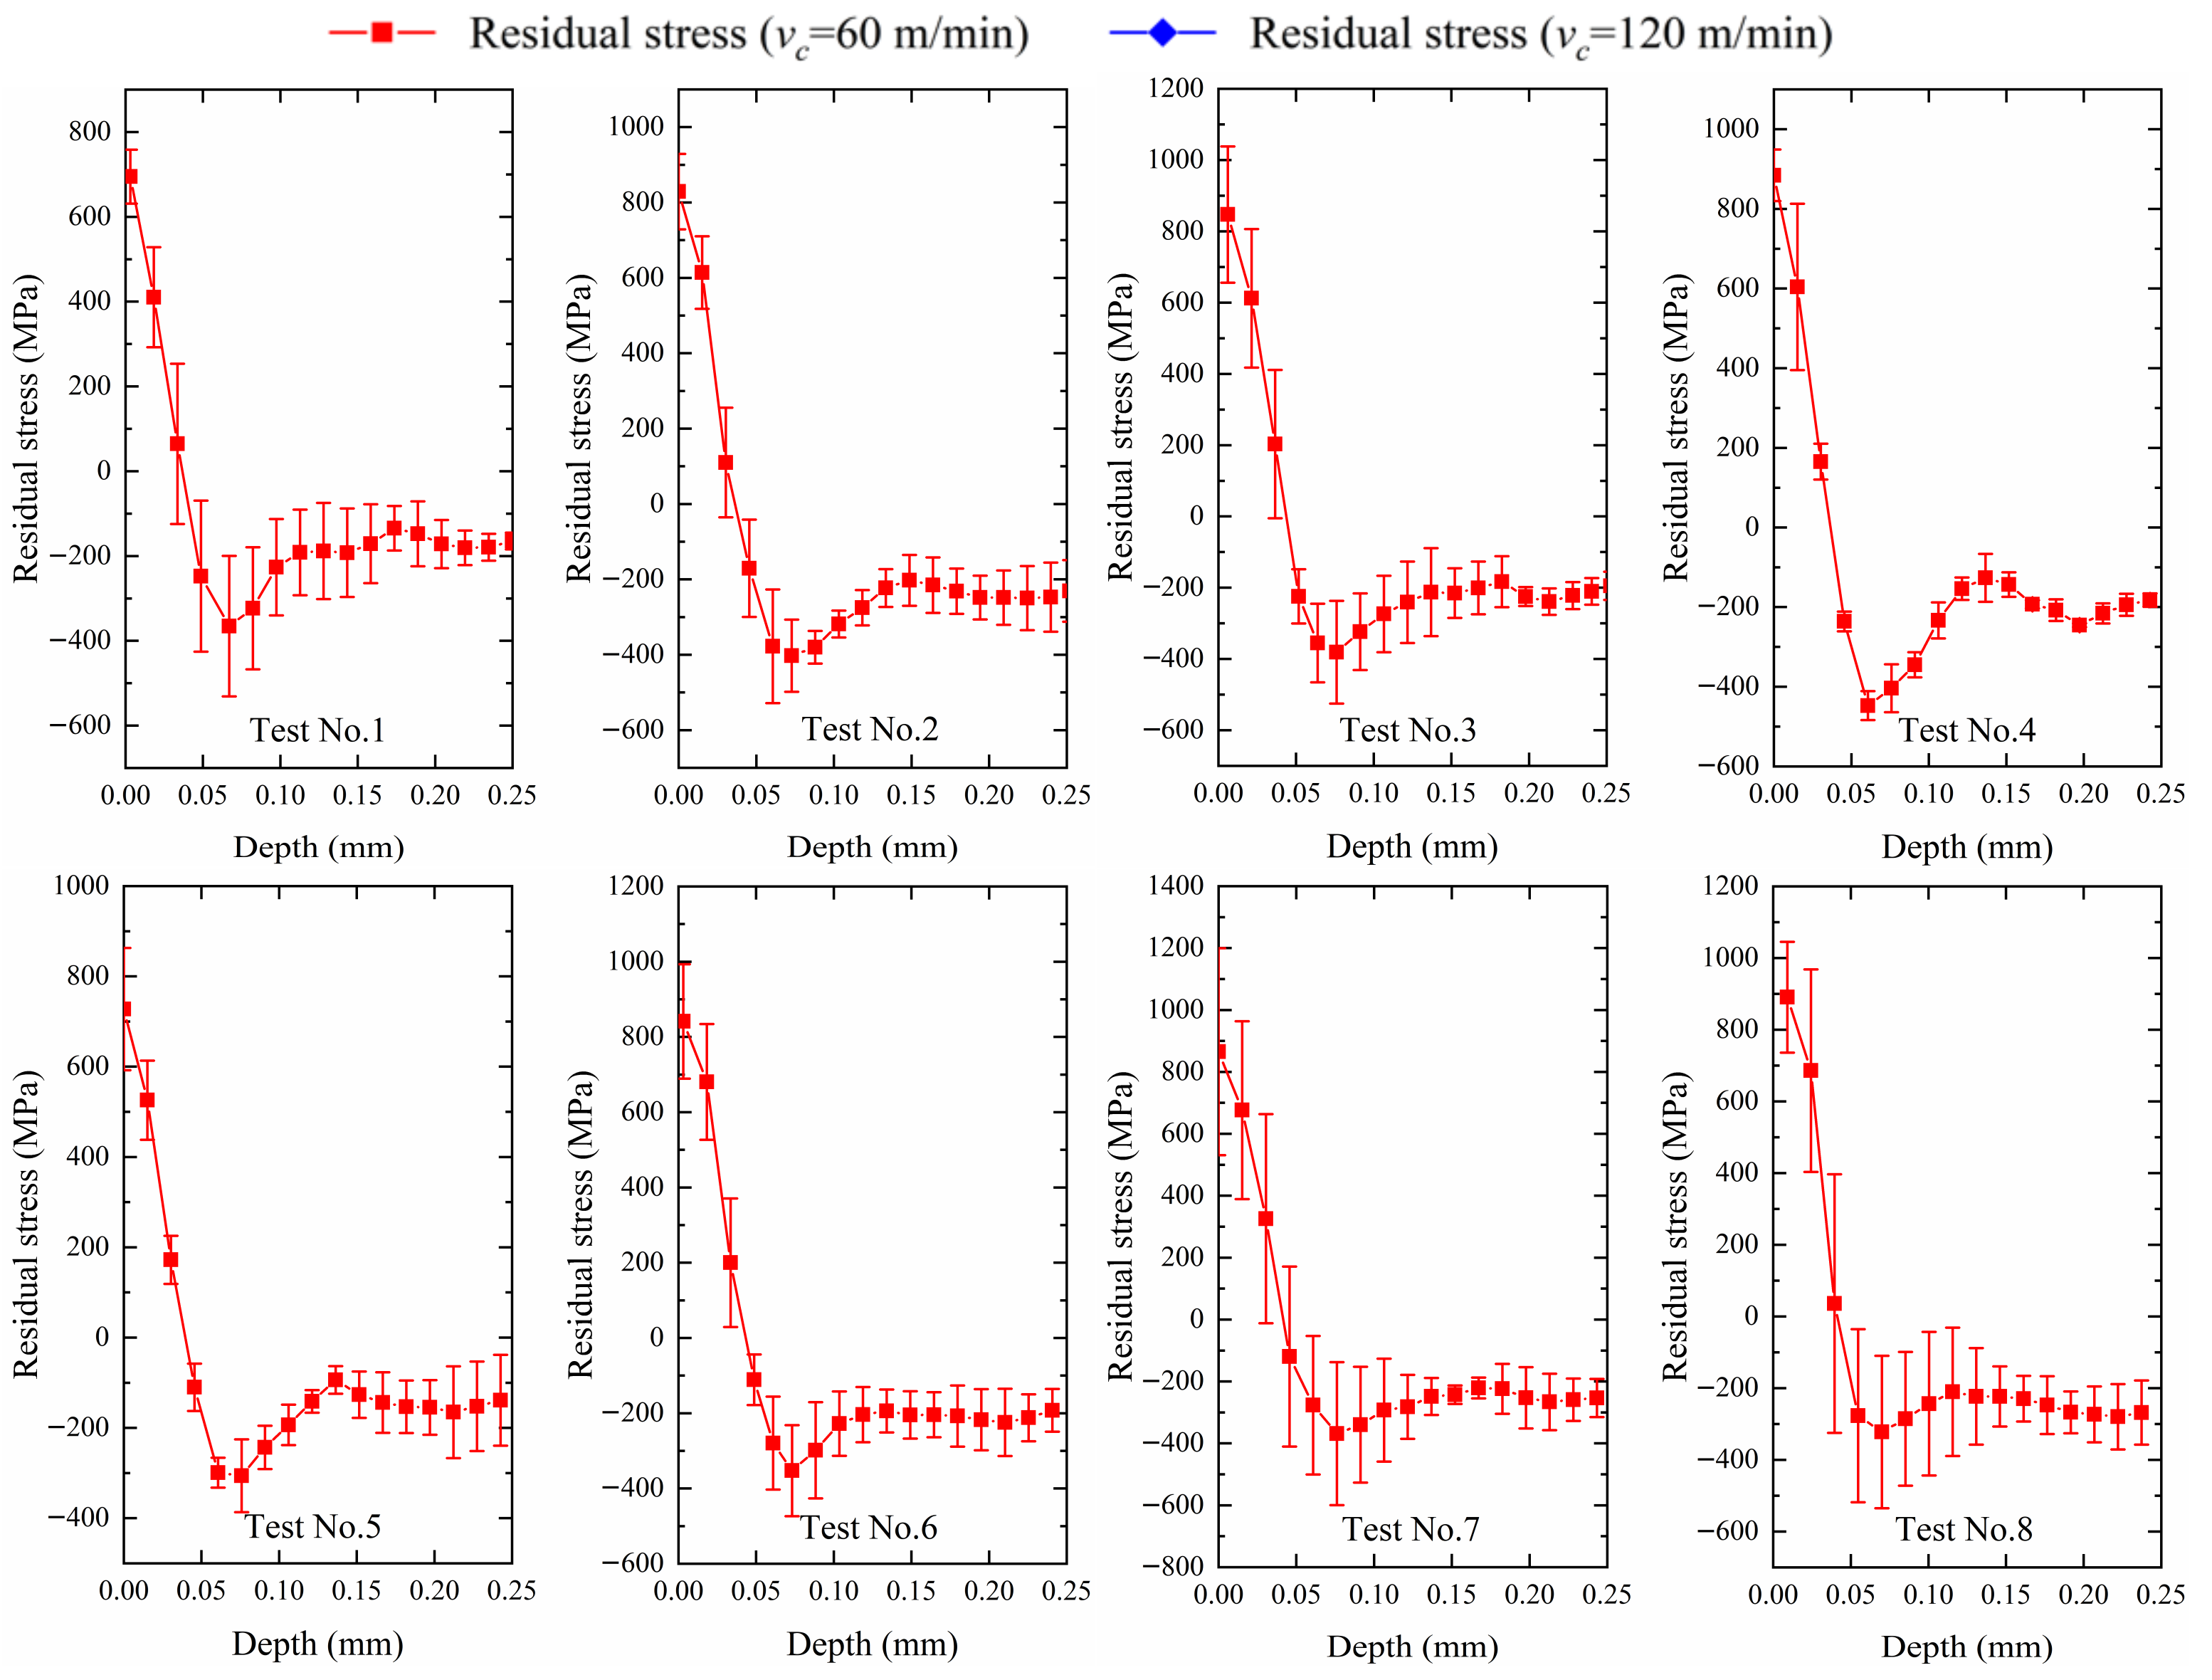
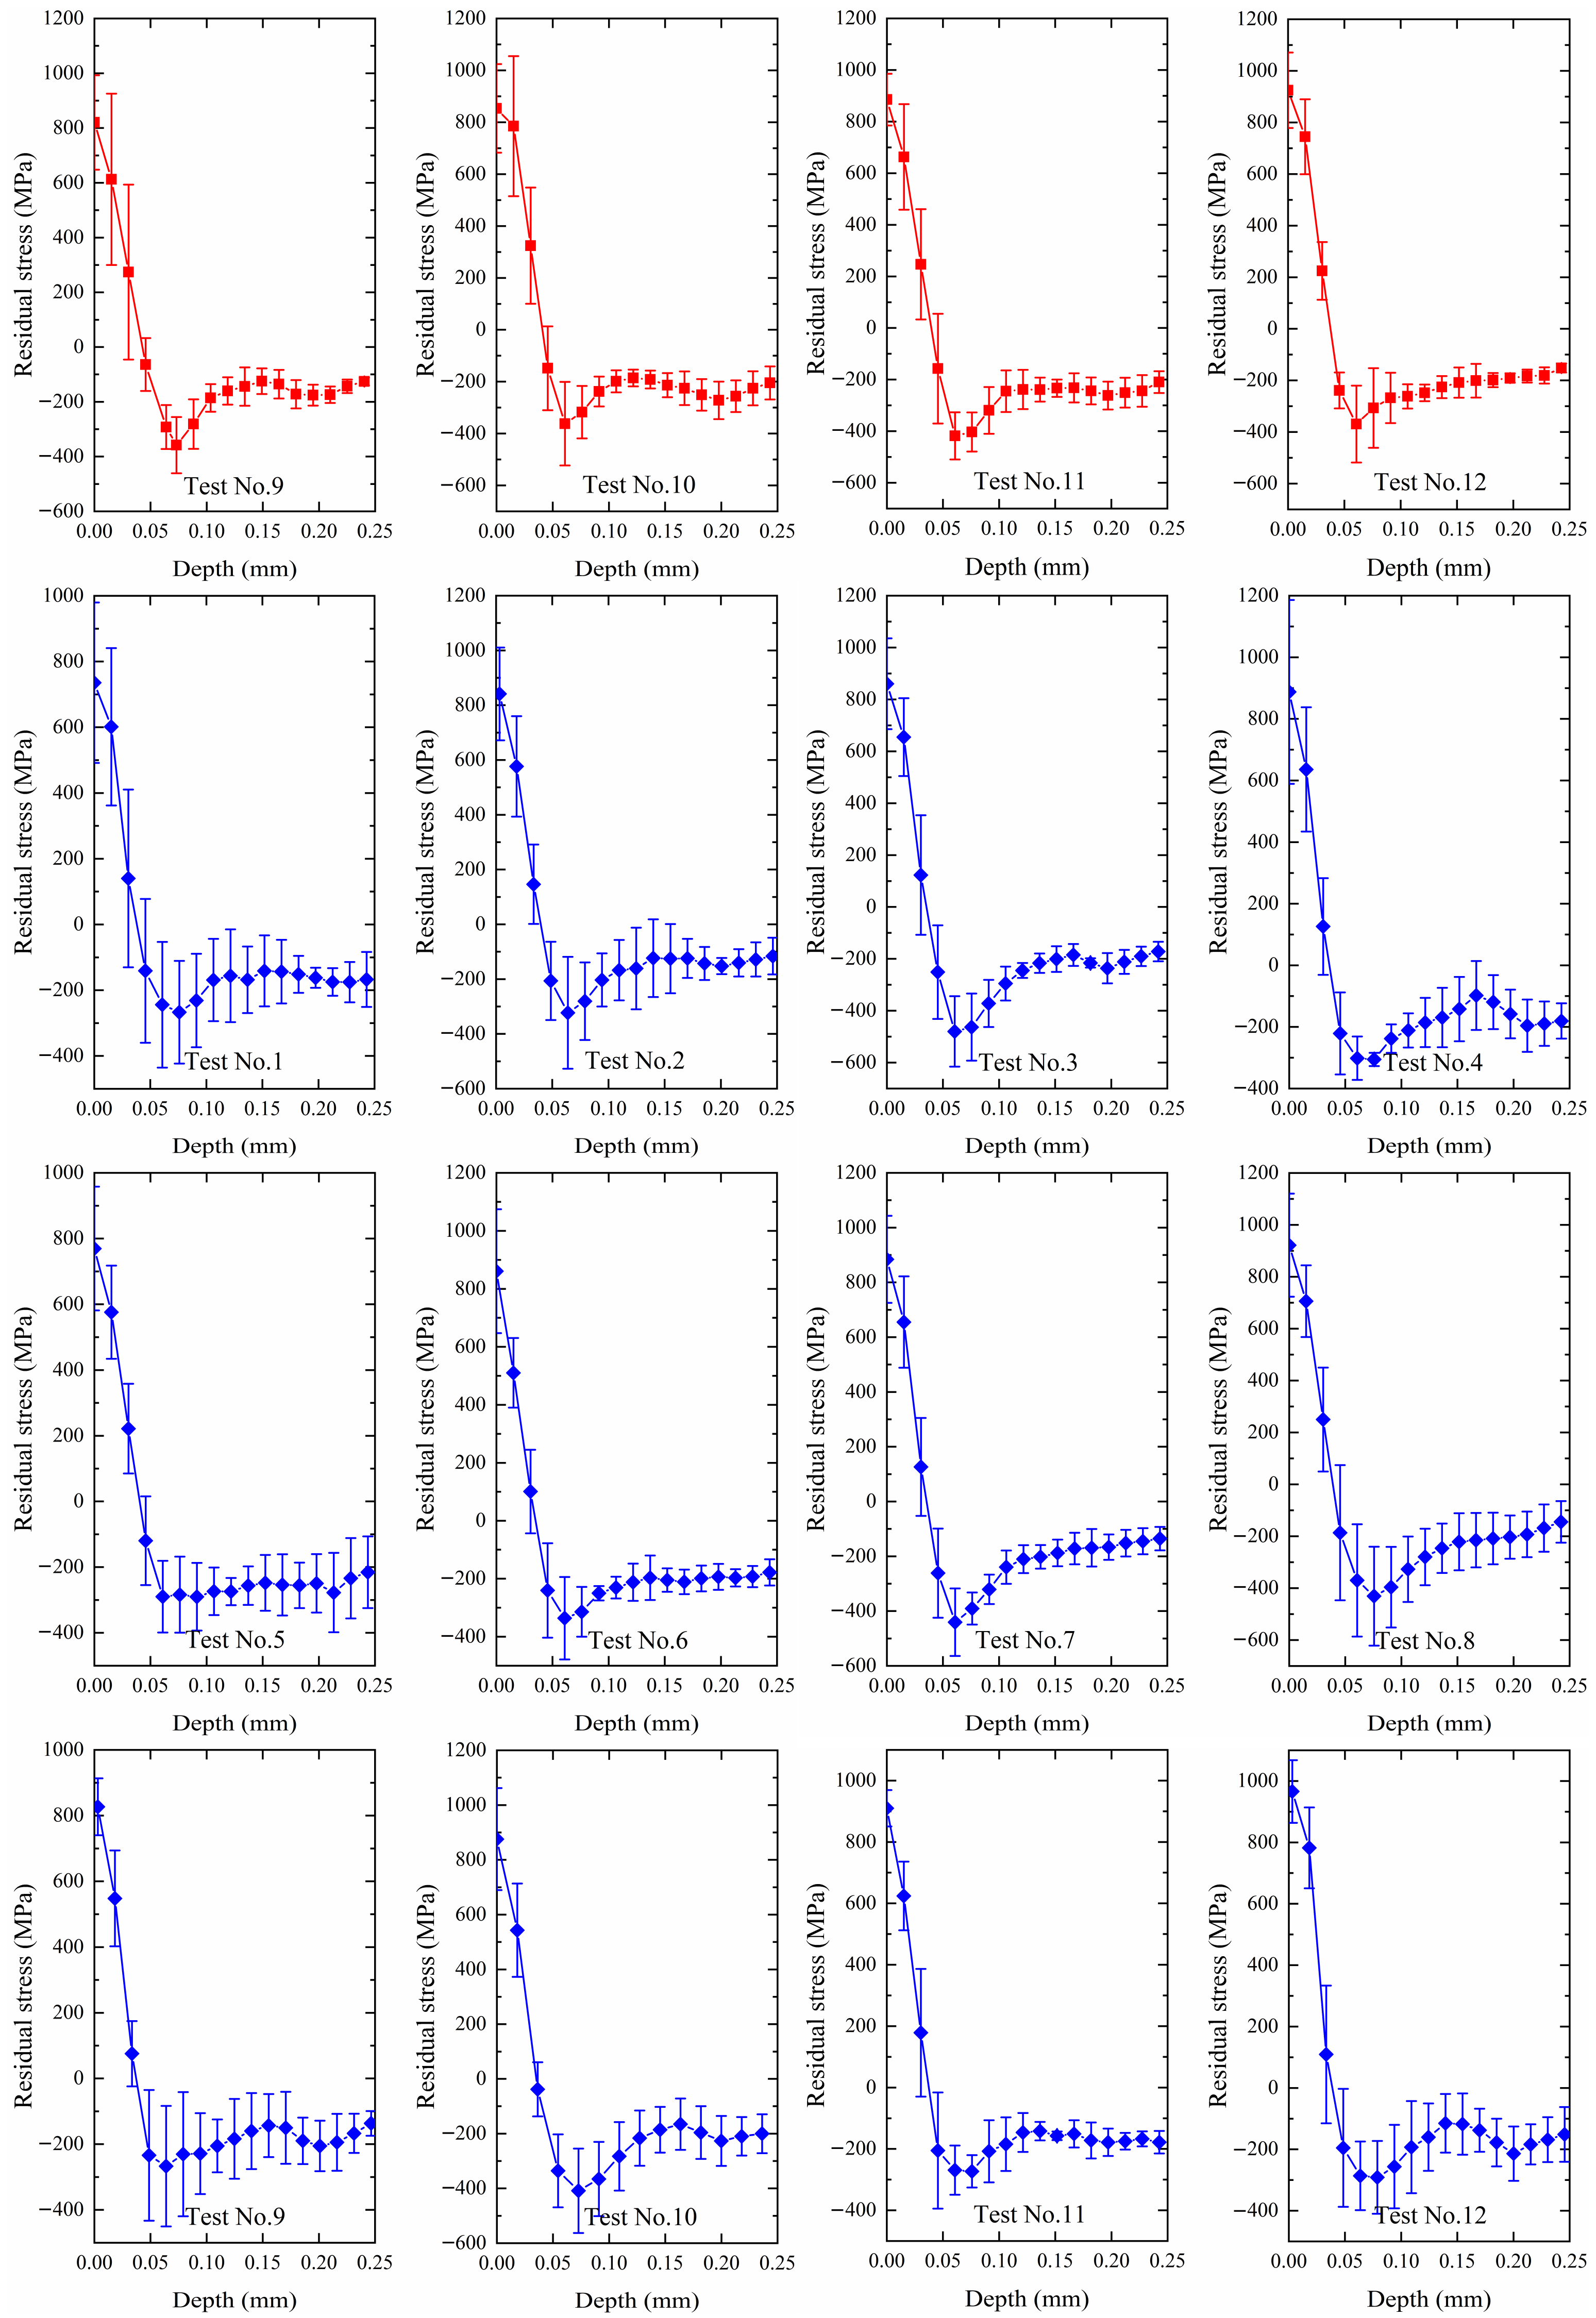
3.3. Analysis of Surface Residual Stress

The thermal effect is beneficial for generating tensile residual stress, while the mechanical load tends to be compressive [10]. The surface residual stress on the workpiece arises from the coupling of the thermal-mechanical load. Therefore, the tensile residual stress was generated on the shallow surface region of material for turning Inconel 718 pipes in the present study, which showed that the thermal load had a more obvious effect on the formation of residual stress near the shallow surface region than the mechanical load. Further, the residual stresses’ distributions extracted in the simulations are shown in Appendix A Figure A3. The surface circumferential residual stresses climb with rising feed rate for each cutting depth at 60 m/min, as illustrated in Figure 7e. Besides, when the depth of cut is 0.4 or 0.6 mm, the residual stress rises more for 0.075~0.10 mm/rev than other feed rates. The residual stress rises more evenly with the growing feed for an 0.8 mm cutting depth. The same trends were also shown in [11,29] concerning the variation of residual stress with feed rate. In a similar manner, the surface residual stresses have similar trends with the change of feed at 120 m/min, but the amplitudes of residual stresses are slightly higher than that at 60 m/min because the thermal effect is more significant at high than at low speed. The relationship between residual stress and cutting speed is consistent with that in [30].

4. Establishment of Prediction Model

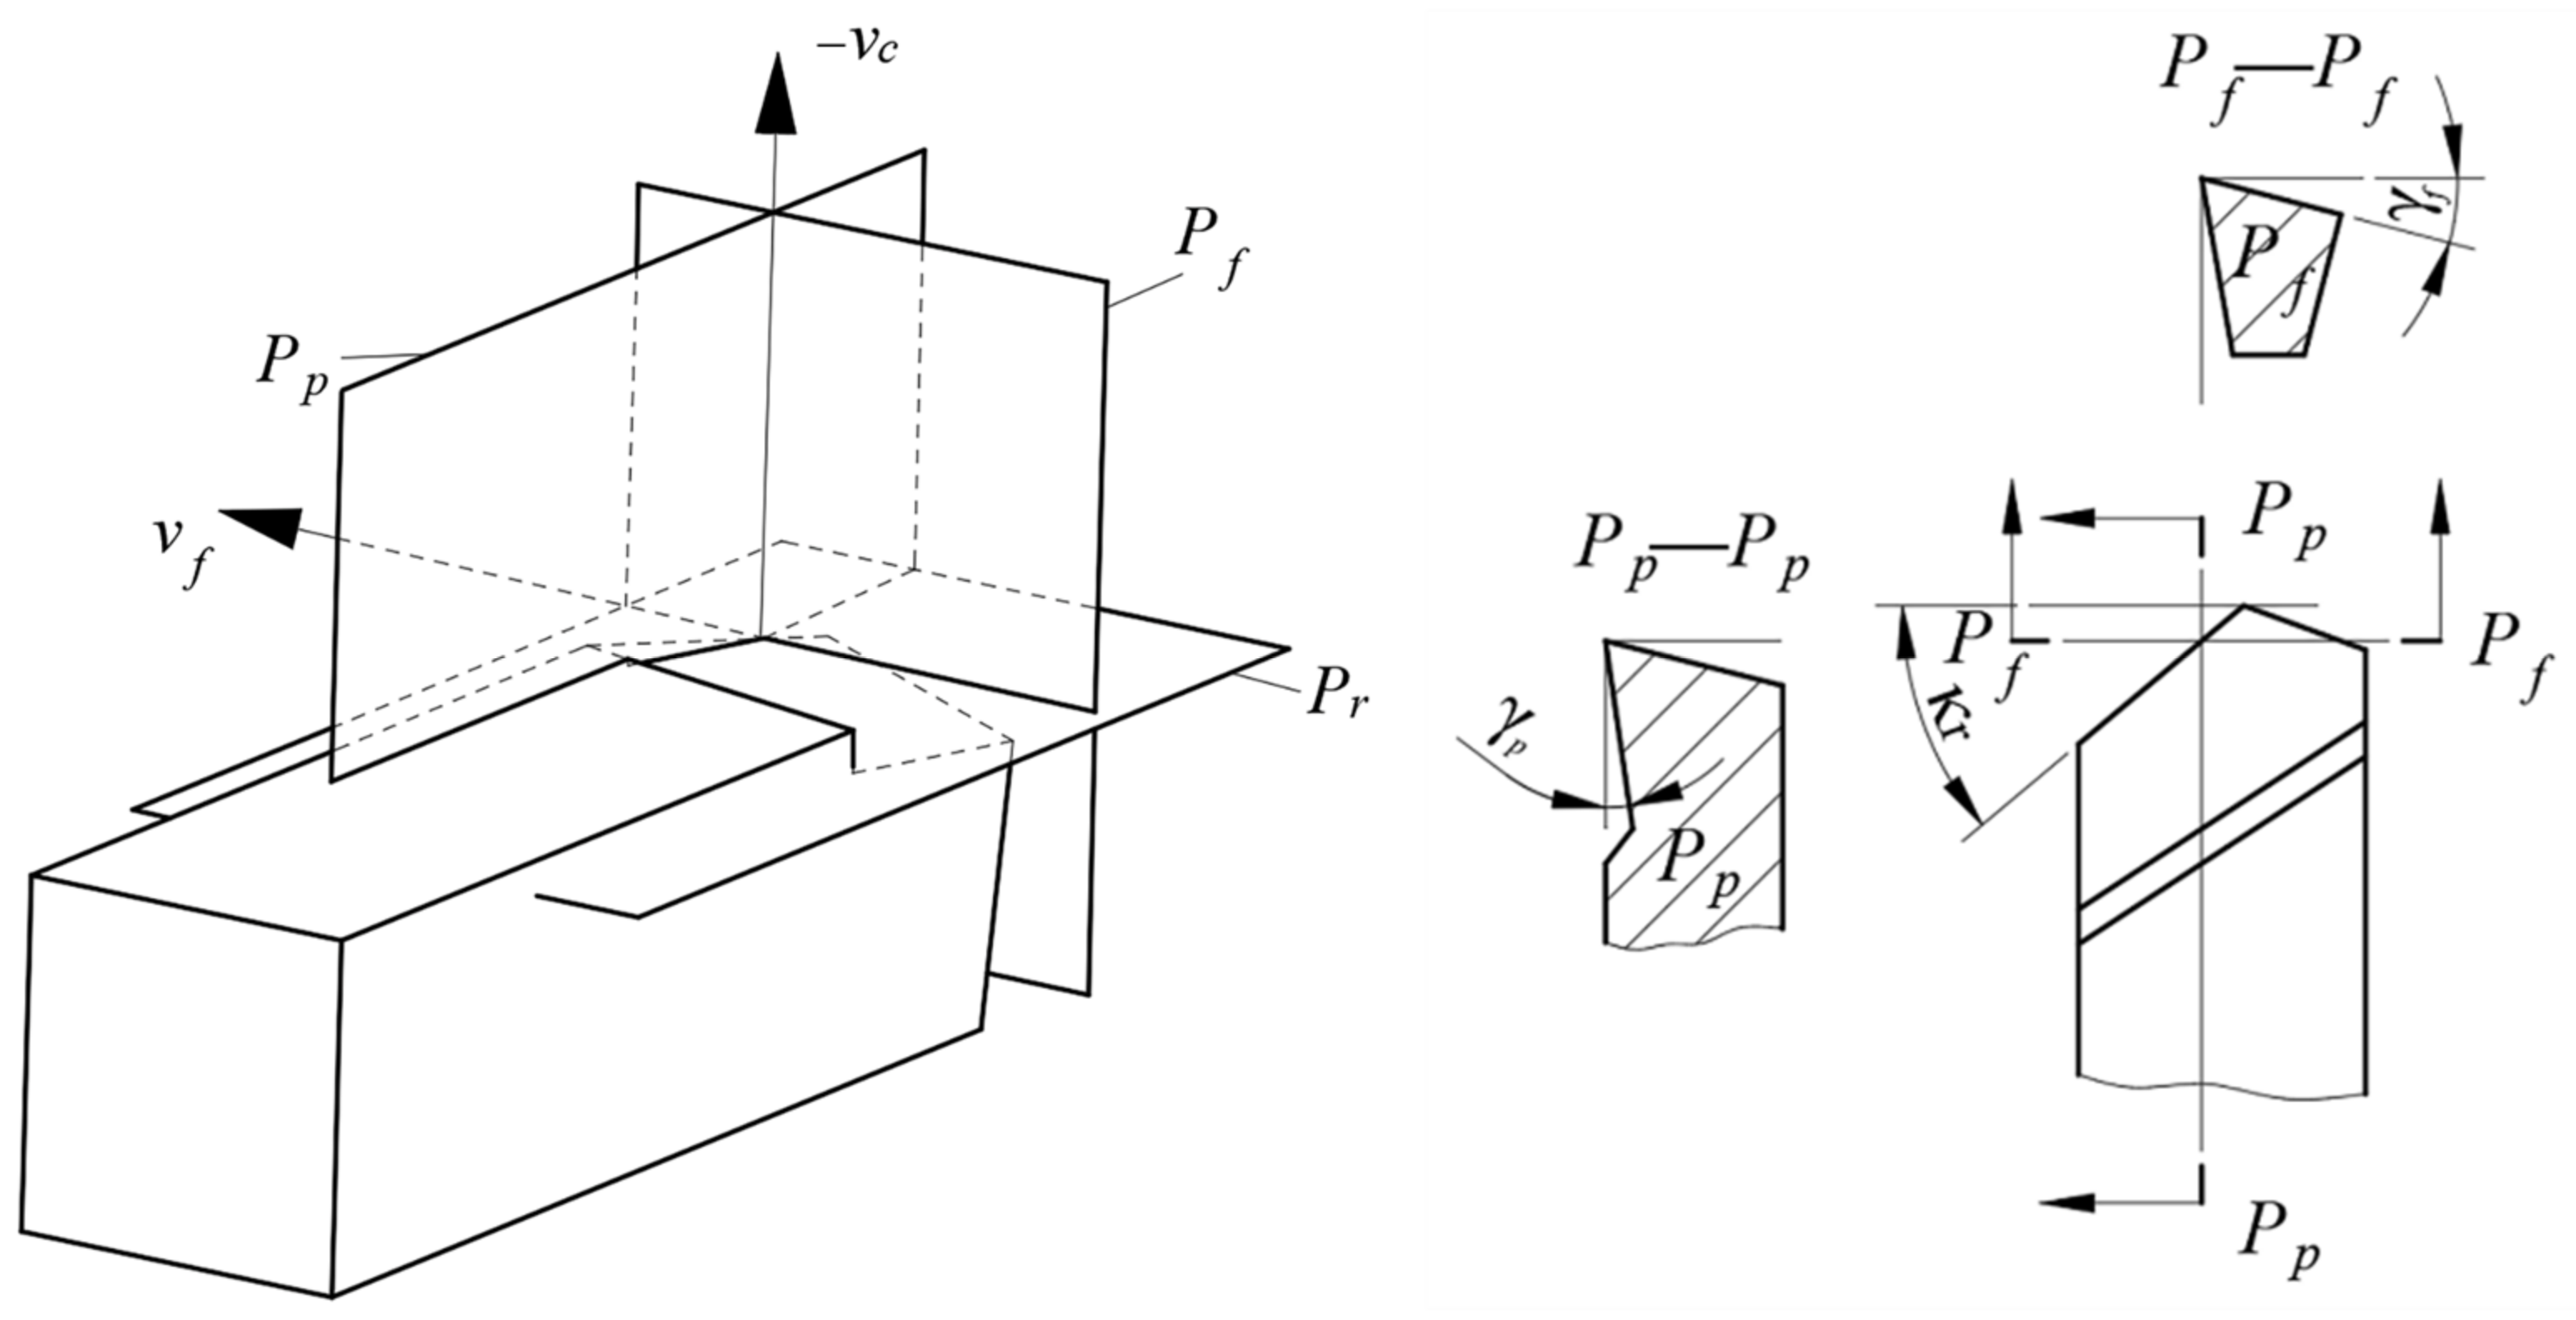
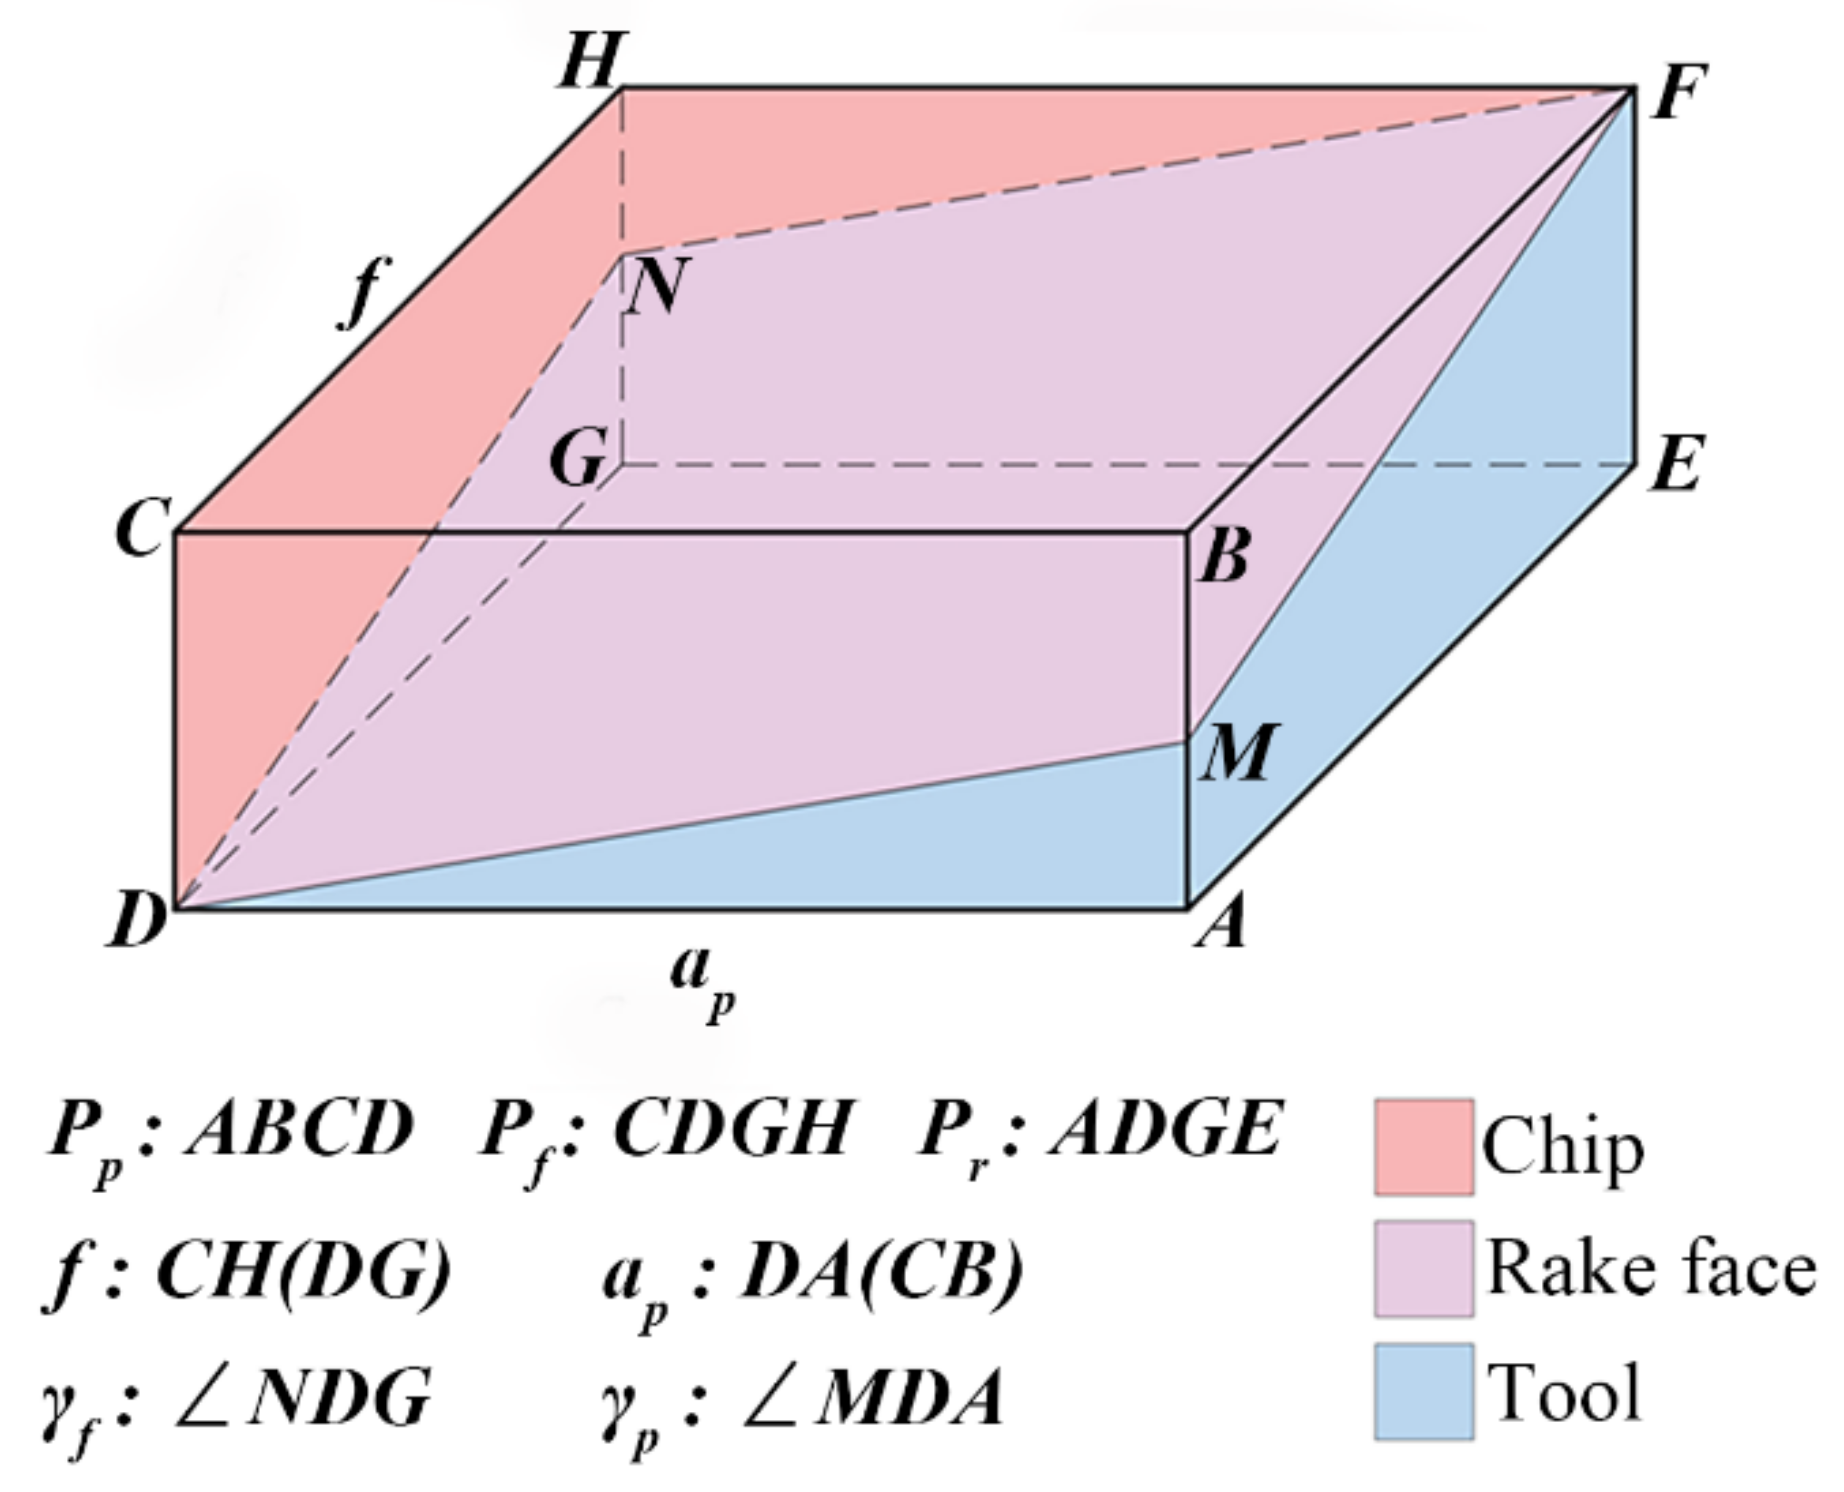
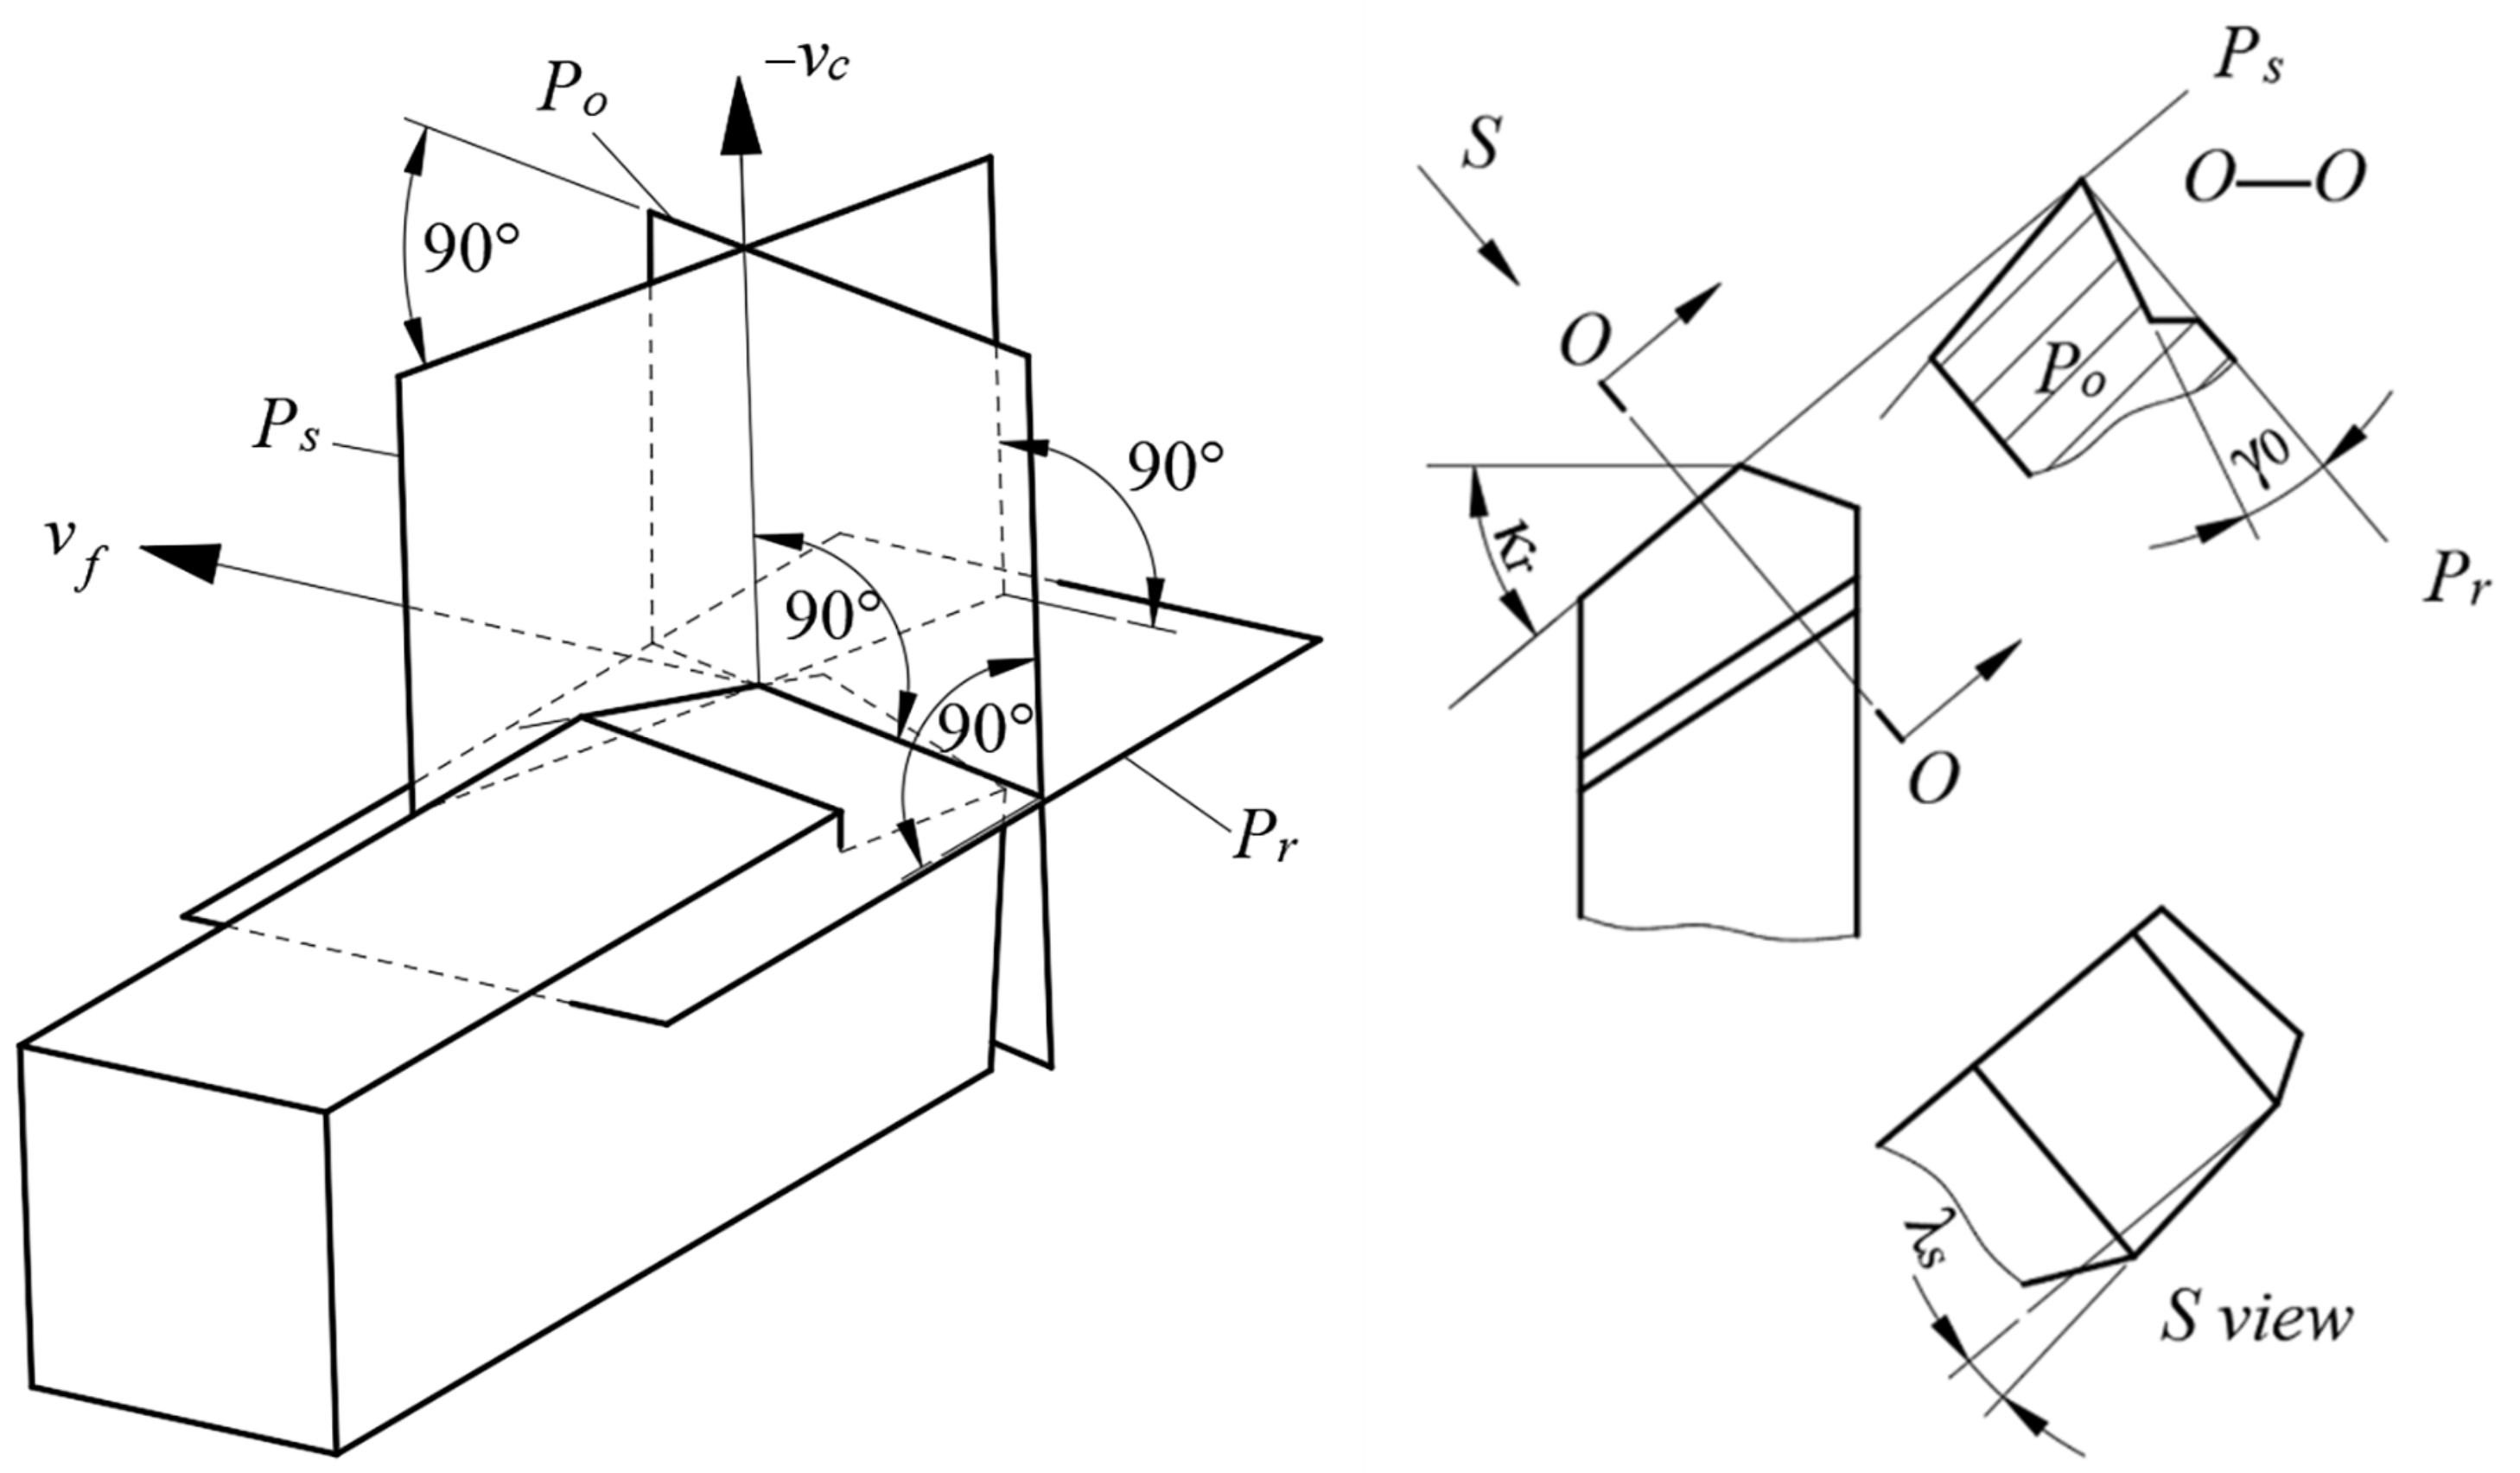
4.1. Introduction of Cutting Tool Angles

The tool parameters are determined by the reference plane used in the manufacturing process of the tool, as shown in Figure 10. Pr is the base plane and perpendicular to −vc axis, Ps is the cutting plane, and Po is the orthogonal plane. Three planes, Pr, Ps, and Po, are perpendicular to each other and intersect at a point on the cutting edge. Moreover, the plane Ps is tangent to the cutting edge. Figure 10 shows the position relationships between Pr, Ps, and Po. vf is the axis of feed motion and vc is the axis of cutting motion. In this way, the rake angle γ0 (the O–O view), the tool cutting-edge angle κr (the top view), and the inclination angle λs (S-direction view) are determined.
The reference plane is determined according to the turning movement direction, as shown in Figure 11. Pr is the base plane, which is determined by the feed direction of the tool and the direction of depth of cut, Pf is the working plane in the turning process and is composed of the feed direction and the cutting speed direction, and Pp is the back plane, which is perpendicular to the base plane and the working plane in the cutting process. Further, three planes, Pr, Pf, and Pp, are perpendicular to each other at a point on the cutting edge. After the two planes (Pp and Pf) are determined, the back-rake angle of the tool γp in the Pp plane and the side-rake angle γf in the Pf plane can be determined, as shown in PpPp view and PfPf view.
Therefore, the conversion relationships of γp (back-rake angle), γf (side-rake angle), and tool parameters (the tool cutting-edge angle κr, the rake angle γ0, and the inclination angle λs) during the tool design and manufacturing process are shown in Equations (2) and (3), respectively [31]:
tan γ p = tan γ 0 cos κ r + tan λ s sin κ r
tan γ f = tan γ 0 sin κ r tan λ s cos κ r

4.2. Prediction Model and Determination of Parameters

The relationship between the insert and the chip was simplified as shown in Figure 12. The point D is the selected point on the cutting edge, and the planes ABCD, CDGH, and ADGE are the back plane (Pp), the working plane (Pf), and the base plane (Pr), respectively. Thus, the angle γp is the ∠MDA and the angle γf is the ∠NDG. Moreover, the area of the plane ADGE, which is the projection plane of the contact surface among tool rake face and chips onto the base plane, is equal to f × ap; besides, the projection areas of the contact surface among tool rake face and chips onto the working plane and the back plane are obtained as |f × ap × tanγp| and |ap × f × tanγf|, separately. The three areas are represented by S1, S2, and S3, as follows in Equation (4):
S 1 = f × a p , S 2 = f × a p × tan γ p = f × a p × tan γ p , S 3 = a p × f × tan γ f = a p × f × tan γ f .
The surface residual stress on the workpiece after turning results from the thermal-mechanical load during machining. Therefore, the surface residual stress ( σ s u r f a c e ) was recorded as a function (Equation (5)) of the cutting temperature (T) and the cutting force (F) in the present study:
σ s u r f a c e = f T , F
The relationships of cutting force with feed and cutting depth were analyzed in Section 3.1. The cutting force rose with the increasing feed and cutting depth. Therefore, the circumferential, radial, and axial stresses of the cutting forces acting on the contact region of the material and insert were expressed as in Equation (6):
σ c = F c S 1 ,   σ r = F r S 2 ,   σ a = F a S 3 .
where σ c denotes the stress component caused by F c applying to S 1 , σ r denotes the stress component caused by F r applying to S 2 , and σ a denotes the stress component caused by F a applying to S 3 .
The cutting speed had a crucial influence on the cutting temperature based on the analysis in Section 3.2. The rise of cutting speed causes growing cutting temperature. Therefore, when expressing the influence of cutting temperature on surface residual stress, the cutting speed was introduced into the temperature term, as in Equation (7):
σ T = g T , v c
In which σ T represents the stress component relevant to the thermal effect.
Equation (5) can be further rewritten as:
σ s u r f a c e = f σ T , σ c , σ r , σ a
The surface residual stress caused by thermal-mechanical load in turning can be expressed in two parts: (1) including cutting temperature and cutting speed ( σ p a r t   1 ), and (2) including cutting force, feed, cutting depth, and tool angle ( σ p a r t   2 ). Moreover, a concrete function expression was provided as in Equation (9):
σ p a r t   1 = B 0 T m 1 v c m 2 , σ p a r t   2 = B 1 F c a p n 1 f n 2 B 2 F r f a p n 3 tan γ p n 4 B 3 F a a p n 5 f tan γ f n 6 .
where B 0 is the coefficient of temperature and cutting speed term, B 1 B 3 are the coefficients of cutting forces, cutting, and tool parameters terms, m 1 and m 2 are the exponents of temperature and cutting speed term, and n 1 n 6 are the exponents of cutting forces, cutting, and tool parameters terms.
The functional relationship, shown in Equation (10), about surface residual stress after turning, cutting temperature, cutting force, cutting parameters, and tool parameters was established based on the above discussion.
σ s u r f a c e = σ p a r t   1 + σ p a r t   2 = B 0 T m 1 v c m 2 B 1 F c a p n 1 f n 2 B 2 F r f a p n 3 tan γ p n 4 B 3 F a a p n 5 f tan γ f n 6
The thermal effect results in the tensile residual stress and the mechanical load leads to the compressive residual stress. The positive value is utilized to express the tensile residual stress and the negative value represents the compressive residual stress. Therefore, in Equation (10), the thermal effect term was represented by a positive sign (omitted in Equation (10)) and the mechanical load terms used a negative sign. Then, the genetic algorithm toolbox in MATLAB was applied to obtain the undetermined parameters in Equation (10). The optimization function is shown as Equation (11), which minimizes the sum of the absolute values of the differences between the predicted and the original values:
f G A = min i = 1 N B 0 T i m 1 v c i m 2 B 1 F c i a p i n 1 f i n 2 B 2 F r i f i a p i n 3 tan γ p n 4 B 3 F a i a p i n 5 f i tan γ f n 6 σ s i m i
where f G A is the optimization objective, N is the total of simulations ( N = 24 ), i denotes the ith simulation ( i = 1 , 2 , , N . ), and σ s i m i denotes the ith simulated residual stress on the turned surface.
In the genetic algorithm toolbox, the population size was set as 20,000, and the stopping criteria contained the generations and the function tolerance, which were set as 12,000 and 10−200, separately. Considering that the tensile residual stress is positive, and the compressive residual stress is negative, the lower limit of the undetermined parameters in Equation (11) was kept as 0. After 1424 iterations, the function tolerance was achieved and the value of f G A stopped at 319.032. The undetermined parameters are shown in Table 6.
As shown in Figure 13, the stress points are distributed near the reference line (y = x) when the simulated residual stresses are taken as the abscissa and the predicted residual stresses are taken as the ordinate. Meanwhile, stress points are composed of the experimental and the simulated values, and the predicted and the experimental values are also distributed near the reference line (y = x). Equation (12) was applied to calculate the correlation coefficient (R) of the predicted and simulated residual stresses, and Equation (13) was applied to calculate the absolute average error (AARE) of the predicted and simulated residual stresses [32]. Therefore, R is 0.9624 and AARE is 13.40%, which further shows that Equation (10) is accurate to predict the turned surface residual stress for Inconel 718 within the feed ranges of 0.075~0.15 mm/rev.
R = i = 1 N σ s i m i σ ¯ s i m σ p r e i σ ¯ p r e i = 1 N σ s i m i σ ¯ s i m 2 i = 1 N σ p r e i σ ¯ p r e 2
A A R E = 1 N i = 1 N σ s i m i σ p r e i σ s i m i × 100 %
where N equals 24, σ ¯ s i m is the mean of all 24 simulated residual stresses on the turned surface, σ p r e i is the predicted residual stress for the ith simulation, and σ ¯ p r e is the mean of all 24 predicted residual stresses.

4.3. How to Use the Model

In the present work, the cutting temperature and the cutting forces were extracted in the simulations. However, in the production, the cutting temperature and the cutting forces can be separately obtained by the infrared camera and the force sensor, and the residual stresses on the turned surface can be measured by the X-ray diffractometer. Then, combined with cutting parameters, the coefficients of Equation (10) can be acquired by utilizing the genetic algorithm so as to accomplish the prediction of the surface residual stress in the turning process, which can guide the process planning. When using the prediction model, tanγp and tanγf cannot be equal to zero because they are the denominators in Equation (10). Thus, there are the following restrictions for κr, γ0, and λs:
  • γ0 and λs cannot be zero at the same time.
  • When κr equals 45° or 135°, |γ0| ≠ |λs|.

5. Conclusions

The turned surface residual stress for Inconel 718 material was studied in the present work. The novel surface residual stress prediction equation was proposed on the basis of cutting force, cutting temperature, feed, depth of cut, and cutting speed in the turning process. The novelty of this model is that the tool angles containing the rake angle, the tool cutting-edge angle, and the inclination angle were introduced in a turned surface residual stress prediction equation for Inconel 718 for the first time. The main research conclusions are summed up as follows:
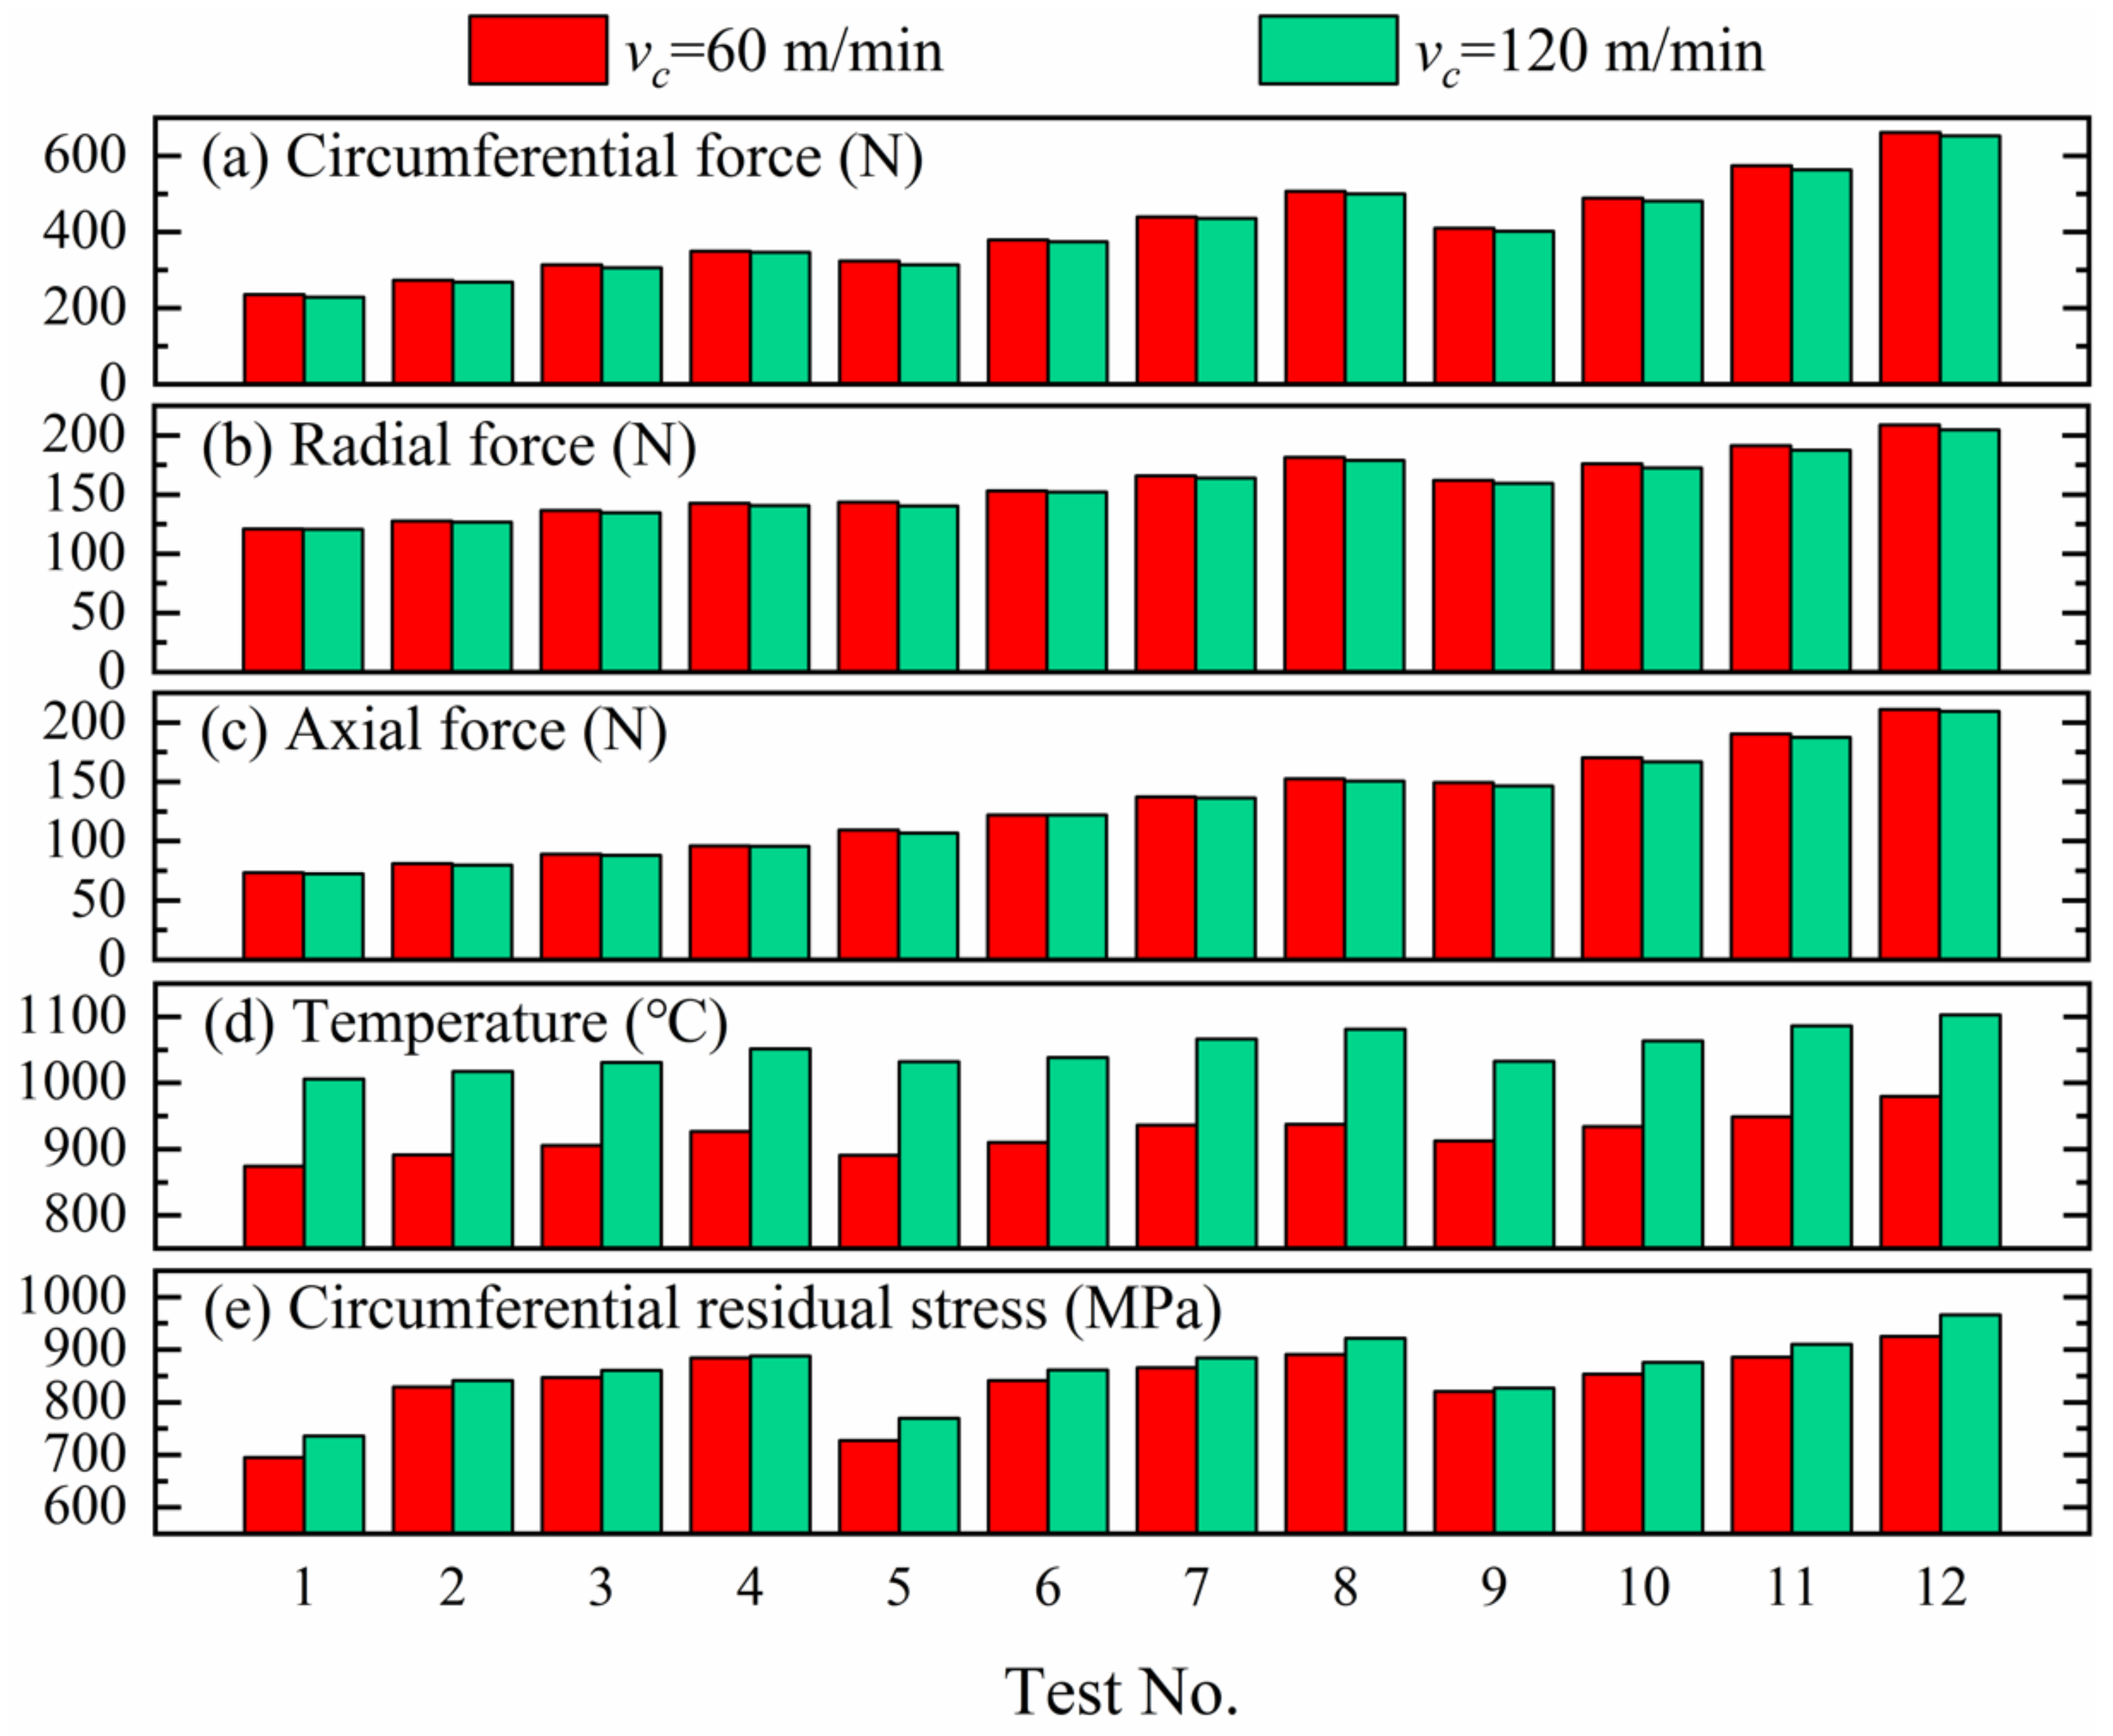
  • The distributions of residual stress in two experiments of turning Inconel 718 were consistent with that in the simulations. Furthermore, under the 24 parameters studied in the simulations, the circumferential cutting force, the radial cutting force, and the axial cutting force rose with the growing feed, no matter at high speed or low speed. With the increasing cutting depth, cutting forces rose more obviously. The cutting forces were lower at high cutting speed than at low cutting speed. The cutting temperature had an upward trend with the growth of the feed rate. The cutting temperature at high speed was slightly higher than that at low speed. The circumferential residual stress climbed with the rising feed rate within 0.075~0.15 mm/rev.
  • A novel empirical residual stress prediction equation was proposed. In this equation, κr, γ0, and λs were introduced for the first time. Further, the optimization objective function was established according to the residual stress prediction equation, and the undetermined coefficients in the equation were obtained by using the genetic algorithm in MATLAB.
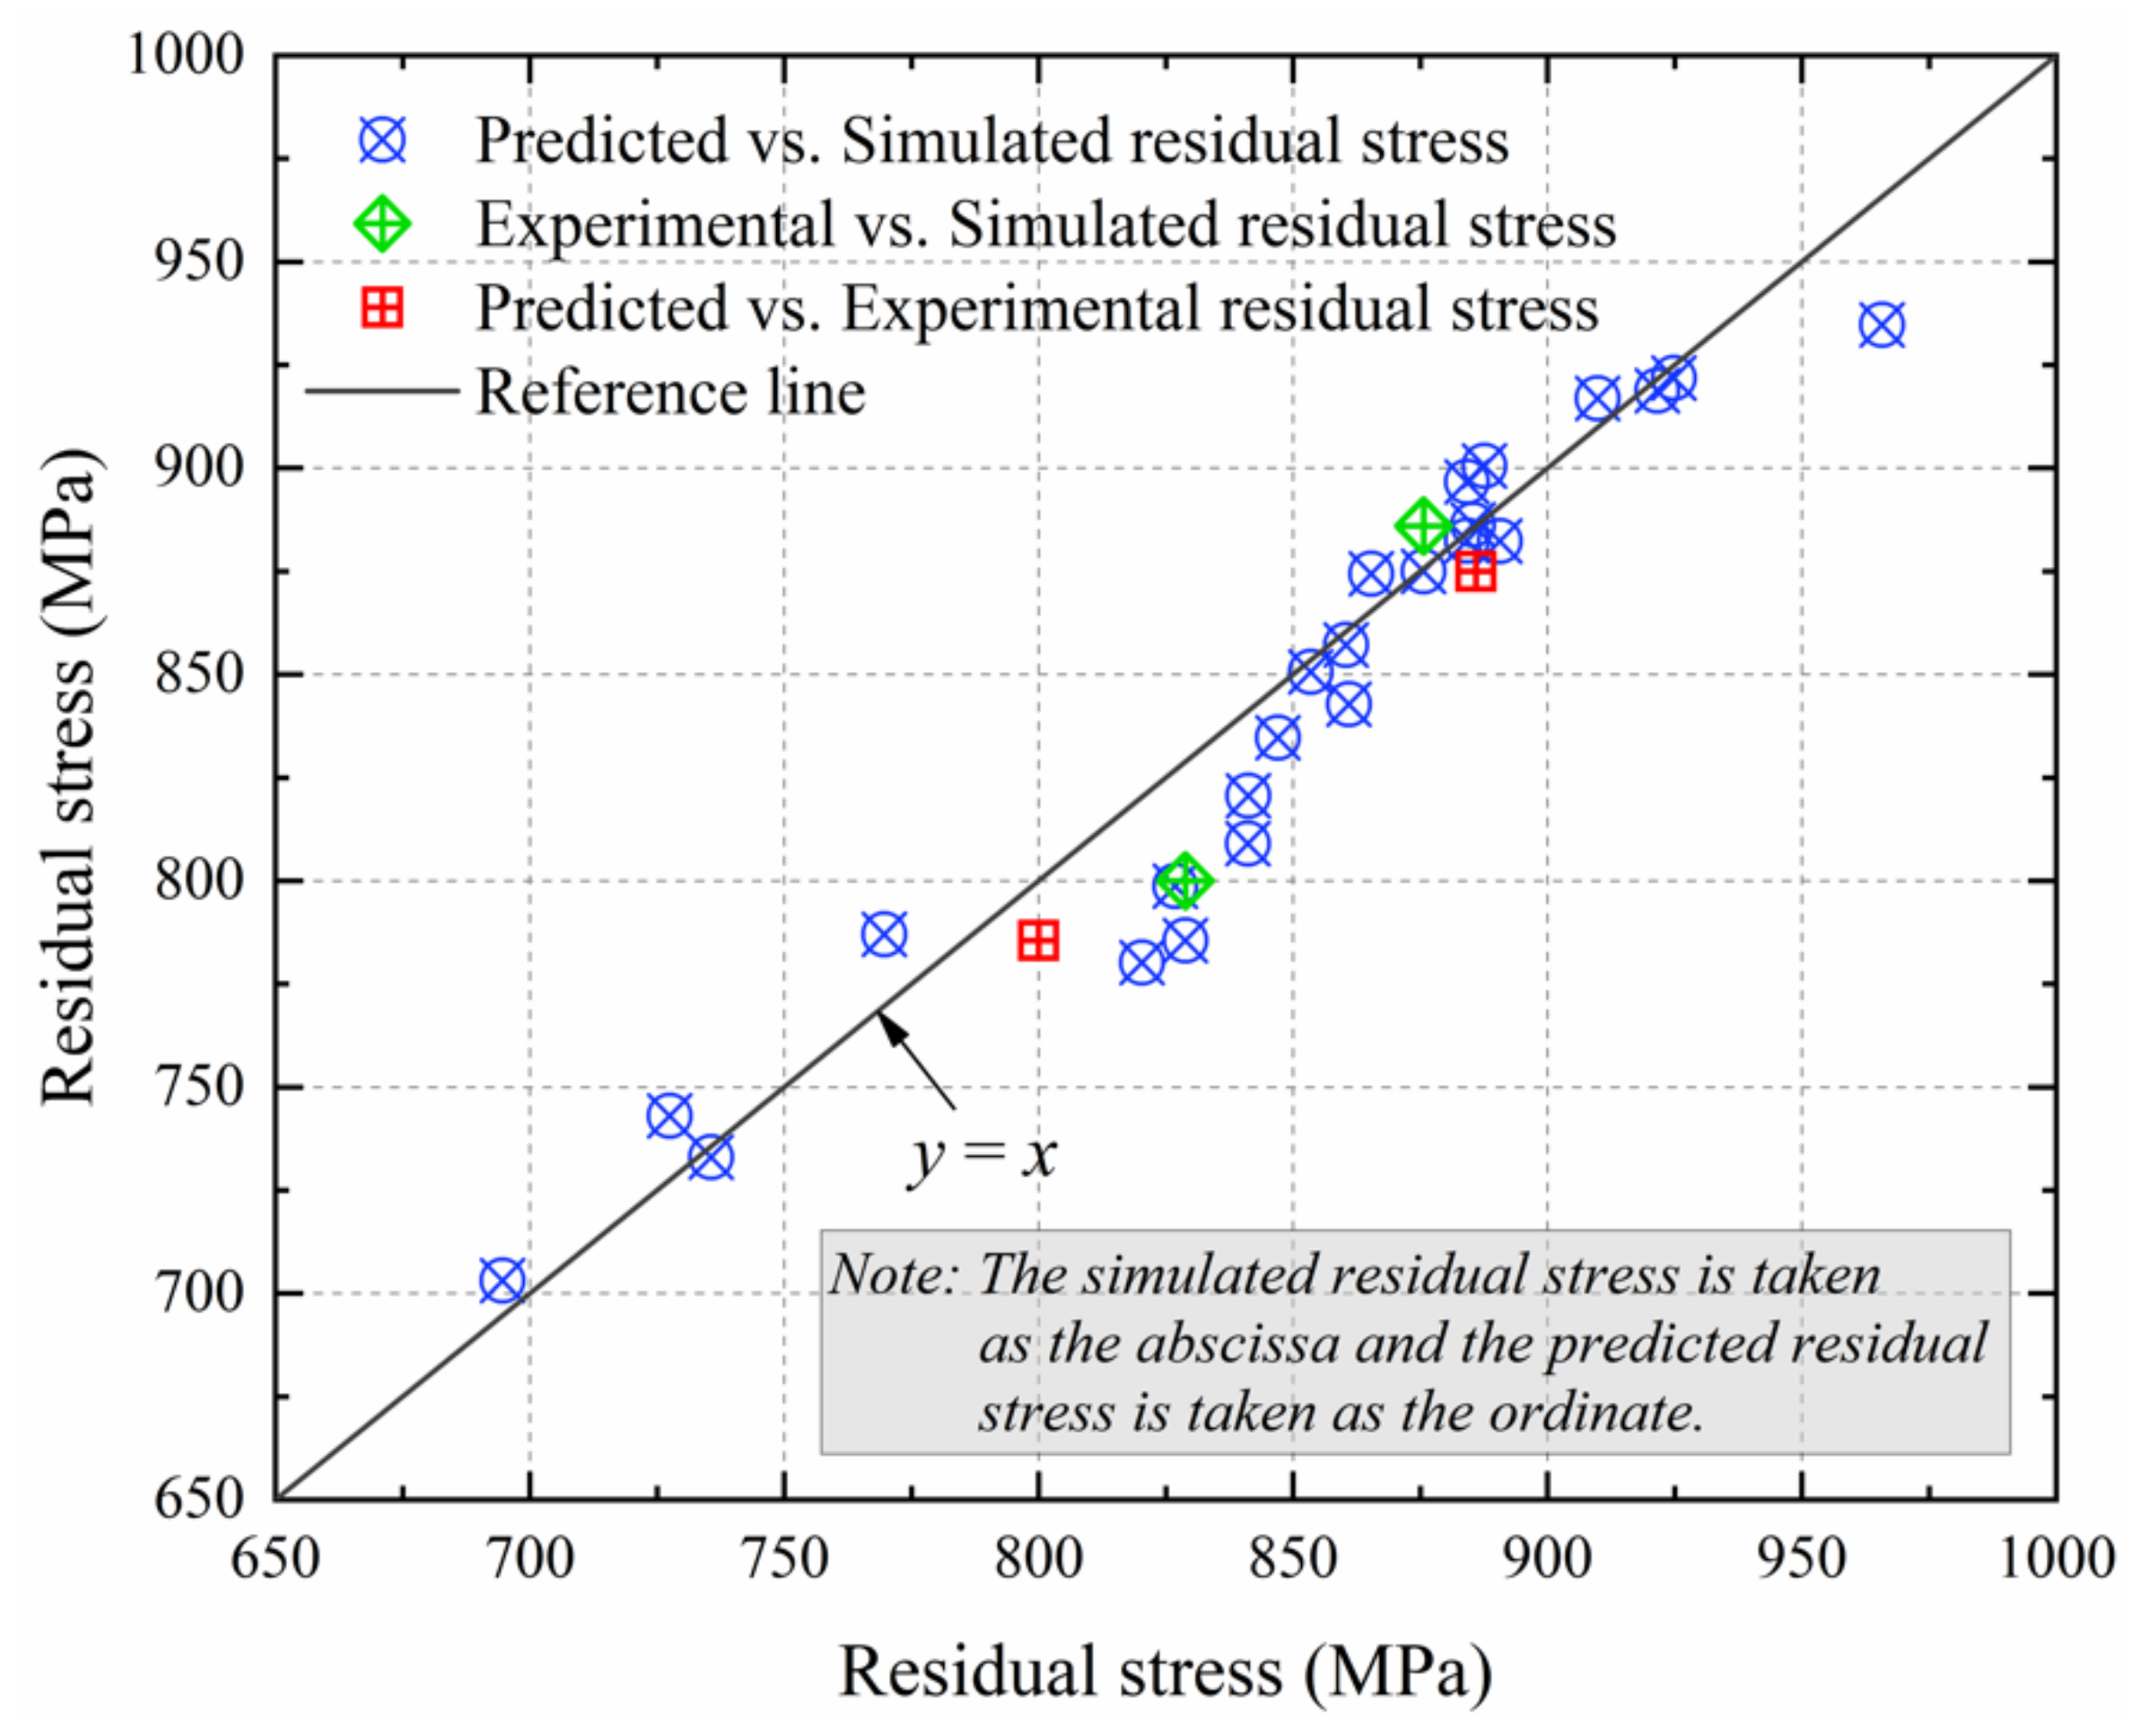
  • Comparing the predicted, the simulated, and the measured stress, the results show that this prediction equation is accurate in predicting turned surface residual stress for Inconel 718 material within the feed rate of 0.075~0.15 mm/rev. The R value between the predicted and simulated stress was 0.9624 using the Pearson correlation analysis, and the average absolute error (AARE) was 13.40%, which further shows the accuracy of the prediction equation.
  • When Equation (10) was applied, there were two restrictions: the rake angle and the inclination angle cannot be zero at the same time, and |γ0| cannot equal |λs| when κr is 45° or 135°. Therefore, future studies can be carried out based on the present work.
In practical application, it is necessary to measure the residual stress on turned surfaces during turning of parts for the purpose of judging the surface quality of parts. The prediction model proposed in this paper can replace this process and improve the production efficiency. In addition, this model can be used in the real-time monitoring of turning Inconel 718, and can also predict the residual stress level so as to provide guidance for the process planning.

Author Contributions

Conceptualization, H.P.; methodology, H.P.; validation, H.P., W.T. and X.Z.; investigation, H.P. and X.Z.; writing—original draft preparation, H.P.; writing—review and editing, H.P., W.T., Y.X. and X.Z.; supervision, H.P., W.T. and Y.X.; funding acquisition, W.T. and X.Z. All authors have read and agreed to the published version of the manuscript.

Funding

This research was supported by the Shenyang Liming Aero-Engine (Group) Ltd. Project: Machining Process Integrated Simulation Optimization System (No. 8902005102).

Institutional Review Board Statement

Not applicable.

Informed Consent Statement

Not applicable.

Data Availability Statement

The data is contained within this article.

Acknowledgments

Thanks to the Shenyang Liming Aero-Engine (Group) Ltd. for the support of professional finite element simulation software.

Conflicts of Interest

The authors declare no conflict of interest.

Nomenclature

vcCutting speed (m/min)vfDirection of feed motion
ap, DA(CB)Depth of cut (mm)AYield strength (MPa)
f, CH(DG)Feed rate (mm/rev)BStrain hardening coefficient (MPa)
FEMFinite element modelCStrain rate hardening coefficient
FCutting force (N)mThermal softening exponent
FcCircumferential force (N)nStrain hardening exponent
FrRadial force (N)S1Projection area of chip and rake face contact surfaces on the base plane
FaAxial force (N)S2Projection area of chip and rake face contact surfaces on the working plane
Pr, ADGEBase planeS3Projection area of chip and rake face contact surfaces on the back plane
Ps,Cutting planeTTemperature (°C)
Po,Orthogonal planeTroomRoom temperature (°C)
Pp, ABCDBack planeTmeltMelting temperature (°C)
Pf, CDGHWorking planeB0Coefficient of temperature and cutting speed term
3DThree-dimensional
κrTool cutting-edge angle (°)B1~B3Coefficients of cutting forces, cutting, and tool parameters’ terms
γ0Rake angle (°)m1, m2Exponents of temperature and cutting speed terms
λsInclination angle (°)n1~n6Exponents of cutting forces, cutting, and tool parameters’ terms
γp, ∠MDABack-rake angle (°)NTotal of simulations (N = 24)
γf, ∠NDGSide-rake angle (°)iThe ith simulation (I = 1, 2, ⋯, N.)
RCorrelation coefficientAAREAbsolute average error
ε ¯ Equivalent plastic strain σ ¯ Equivalent plastic stress (MPa)
ε ¯ ˙ Equivalent plastic strain rate ( s 1 ) ε ¯ ˙ 0 Reference equivalent plastic strain rate ( s 1 )
σ s u r f a c e Surface residual stress σ c Stress component caused by Fc applying to S1
σ r Stress component caused by Fr applying to S2 σ a Stress component caused by Fa applying to S3
σ T Stress component relevant to thermal effect σ p a r t   1 Part of surface residual stress relevant to cutting temperature and cutting speed
σ ¯ s i m Mean of all 24 simulated residual stresses on the surface σ p a r t   2 Part of surface residual stress relevant to cutting force, feed, cutting depth, and tool angle
σ s i m i The ith simulated residual stress on the surface σ p r e i The predicted residual stress on the surface for the ith simulation
f G A Optimization objective σ ¯ p r e Mean of all 24 predicted residual stresses on the surface

Appendix A

Figure A1. Ten-order polynomial fitting diagram of cutting forces in 24 simulations.
Materials 14 03937 g0a1aMaterials 14 03937 g0a1b
Figure A2. The temperatures of tool nose contact zone in the cutting process in the simulations.
Materials 14 03937 g0a2aMaterials 14 03937 g0a2bMaterials 14 03937 g0a2cMaterials 14 03937 g0a2d
Figure A3. The residual stresses’ distributions extracted in 24 simulations.
Materials 14 03937 g0a3aMaterials 14 03937 g0a3b

References

  1. Ulutan, D.; Ozel, T. Machining induced surface integrity in titanium and nickel alloys: A review. Int. J. Mach. Tools Manuf. 2011, 51, 250–280. [Google Scholar] [CrossRef]
  2. Sharman, A.R.C.; Hughes, J.I.; Ridgway, K. The effect of tool nose radius on surface integrity and residual stresses when turning Inconel 718™. J. Mater. Process. Technol. 2015, 216, 123–132. [Google Scholar] [CrossRef]
  3. Berruti, T.; Lavella, M.; Gola, M.M. Residual stresses on Inconel 718 turbine shaft samples after turning. Mach. Sci. Technol. 2009, 13, 543–560. [Google Scholar] [CrossRef]
  4. Kim, H.; Cong, W.; Zhang, H.; Liu, Z. Laser engineered net shaping of nickel-based superalloy Inconel 718 powders onto AISI 4140 alloy steel substrates: Interface bond and fracture failure mechanism. Materials 2017, 10, 341. [Google Scholar] [CrossRef]
  5. Altintas, Y. Manufacturing Automation: Metal Cutting Mechanics, Machine Tool Vibrations, and CNC Design; Cambridge University Press: Cambridge, UK, 2012; pp. 4–35. [Google Scholar]
  6. Guo, Y.B.; Li, W.; Jawahir, I.S. Surface integrity characterization and prediction in machining of hardened and difficult-to-machine alloys: A state-of-art research review and analysis. Mach. Sci. Technol. 2009, 13, 437–470. [Google Scholar] [CrossRef]
  7. Webster, G.A.; Ezeilo, A.N. Residual stress distributions and their influence on fatigue lifetimes. Int. J. Fatigue 2001, 23, 375–383. [Google Scholar] [CrossRef]
  8. Madariaga, A.; Arrazola, P.J.; Esnaola, J.A.; Ruiz-Hervias, J.; Muñoz, P. Evolution of residual stresses induced by machining in a nickel based alloy under static loading at room temperature. Procedia CIRP 2014, 13, 175–180. [Google Scholar] [CrossRef] [Green Version]
  9. Madariaga, A.; Esnaola, J.A.; Arrazola, P.J.; Ruiz-Hervias, J.; Muñoz, P.; Ostolaza, K. Stability of machining induced residual stresses in Inconel 718 under quasi-static loading at room temperature. Mater. Sci. Eng. A 2015, 620, 129–139. [Google Scholar] [CrossRef]
  10. Madariaga, A.; Esnaola, J.A.; Fernandez, E.; Arrazola, P.J.; Garay, A.; Morel, F. Analysis of residual stress and work-hardened profiles on Inconel 718 when face turning with large-nose radius tools. Int. J. Adv. Manuf. Technol. 2014, 71, 1587–1598. [Google Scholar] [CrossRef]
  11. Hua, Y.; Liu, Z. Experimental investigation of principal residual stress and fatigue performance for turned nickel-based superalloy Inconel 718. Materials 2018, 11, 879. [Google Scholar] [CrossRef] [Green Version]
  12. Da Silva, F.A.V.; Denguir, L.A.; Outeiro, J.C. Residual stresses prediction in machining of Inconel 718 superalloy using a constitutive model considering the state of stress. Procedia CIRP 2020, 87, 527–532. [Google Scholar] [CrossRef]
  13. Wu, D.W.; Matsumoto, Y. The effect of hardness on residual-stresses in orthogonal machining of AISI 4340 steel. J. Eng. Ind. Trans. ASME 1990, 112, 245–252. [Google Scholar] [CrossRef]
  14. Denguir, L.A.; Outeiro, J.C.; Fromentin, G.; Vignal, V.; Besnard, R. A physical-based constitutive model for surface integrity prediction in machining of OFHC copper. J. Mater. Process. Technol. 2017, 248, 143–160. [Google Scholar] [CrossRef] [Green Version]
  15. Liu, Y.; Xu, D.; Agmell, M.; Saoubi, R.M.; Ahadi, A.; Stahl, J.; Zhou, J. Numerical and experimental investigation of tool geometry effect on residual stresses in orthogonal machining of Inconel 718. Simul. Model. Pract. Theory 2021, 106, 102187. [Google Scholar] [CrossRef]
  16. Holmberg, J.; Wretland, A.; Berglund, J.; Beno, T. A detailed investigation of residual stresses after milling Inconel 718 using typical production parameters for assessment of affected depth. Mater. Today Commun. 2020, 24. [Google Scholar] [CrossRef]
  17. Madariaga, A.; Kortabarria, A.; Hormaetxe, E.; Garay, A.; Arrazola, P.J. Influence of tool wear on residual stresses when turning Inconel 718. Procedia CIRP 2016, 45, 267–270. [Google Scholar] [CrossRef] [Green Version]
  18. Gupta, M.K.; Mia, M.; Pruncu, C.I.; Kapłonek, W.; Nadolny, K.; Patra, K.; Mikolajczyk, T.; Pimenov, D.Y.; Sarikaya, M.; Sharma, V.S. Parametric optimization and process capability analysis for machining of nickel-based superalloy. Int. J. Adv. Manuf. Technol. 2019, 102, 3995–4009. [Google Scholar] [CrossRef] [Green Version]
  19. Peng, H.; Dong, P.; Cheng, X.; Zhang, C.; Tang, W.; Xing, Y.; Zhou, X. Semi-empirical prediction of residual stress distributions introduced by turning Inconel 718 alloy based on Lorentz function. Materials 2020, 13, 4341. [Google Scholar] [CrossRef]
  20. Ma, Y.; Feng, P.; Zhang, J.; Wu, Z.; Yu, D. Prediction of surface residual stress after end milling based on cutting force and temperature. J. Mater. Process. Technol. 2016, 235, 41–48. [Google Scholar] [CrossRef]
  21. Pimenov, D.Y.; Guzeev, V.I. Mathematical model of plowing forces to account for flank wear using FME modeling for orthogonal cutting scheme. Int. J. Adv. Manuf. Technol. 2017, 89, 3149–3159. [Google Scholar] [CrossRef]
  22. Johnson, R.; Cook, W.K. A constitutive model and data for metals subjected to large strains high strain rates and high temperatures. In Proceedings of the 7th International Symposium on Ballistics, Hague, The Netherlands, 19–21 April 1983; pp. 541–547. [Google Scholar]
  23. Ayed, Y.; Robert, C.; Germain, G.; Ammar, A. Development of a numerical model for the understanding of the chip formation in high-pressure water-jet assisted machining. Finite Elem. Anal. Des. 2016, 108, 1–8. [Google Scholar] [CrossRef] [Green Version]
  24. DeMange, J.J.; Prakash, V.; Pereira, J.M. Effects of material microstructure on blunt projectile penetration of a nickel-based super alloy. Int. J. Impact Eng. 2009, 36, 1027–1043. [Google Scholar] [CrossRef]
  25. Wang, B.; Liu, Z.; Hou, X.; Zhao, J. Influences of cutting speed and material mechanical properties on chip deformation and fracture during high-speed cutting of Inconel 718. Materials 2018, 11, 461. [Google Scholar] [CrossRef] [Green Version]
  26. Shen, Q.; Liu, Z.; Hua, Y.; Zhao, J.; Lv, W.; Mohsan, A. Effects of Cutting Edge Microgeometry on Residual Stress in Orthogonal Cutting of Inconel 718 by FEM. Materials 2018, 11, 1015. [Google Scholar] [CrossRef] [PubMed] [Green Version]
  27. Arrazola, P.J.; Kortabarria, A.; Madariaga, A.; Esnaola, J.A.; Fernandez, E.; Cappellini, C.; Ulutan, D.; Özel, T. On the machining induced residual stresses in IN718 nickel-based alloy: Experiments and predictions with finite element simulation. Simul. Model. Pract. Theory 2014, 41, 87–103. [Google Scholar] [CrossRef]
  28. Qiu, X.; Cheng, X.; Dong, P.; Peng, H.; Xing, Y.; Zhou, X. Sensitivity analysis of Johnson-Cook material constants and friction coefficient influence on finite element simulation of turning Inconel 718. Materials 2019, 12, 3121. [Google Scholar] [CrossRef] [Green Version]
  29. Sharman, A.R.C.; Hughes, J.I.; Ridgway, K. An analysis of the residual stresses generated in Inconel 718™ when turning. J. Mater. Process. Technol. 2006, 173, 359–367. [Google Scholar] [CrossRef]
  30. Schlauer, C.; Peng, R.L.; Odén, M. Residual stresses in a nickel-based superalloy introduced by turning. Mater. Sci. Forum 2002, 404–407, 173–178. [Google Scholar] [CrossRef]
  31. Wu, W. Principles of Metal Cutting and Cutters; Publishing House of Electronics Industry: Beijing, China, 2017; pp. 3–14. (In Chinese) [Google Scholar]
  32. Zhao, Y.; Sun, J.; Li, J.; Yan, Y.; Wang, P. A comparative study on Johnson-Cook and modified Johnson-Cook constitutive material model to predict the dynamic behavior laser additive manufacturing FeCr alloy. J. Alloys Compd. 2017, 723, 179–187. [Google Scholar] [CrossRef]
Figure 1. The 3D cylindrical turning model and boundary conditions [21].
Materials 14 03937 g001
Figure 2. (a) The turned experimental details, (b) the approach of residual stress measurement by X-ray diffractometer, and (c) the electrolytic corrosion device.
Materials 14 03937 g002
Figure 3. (a) The hook-shaped tendency of residual stress in the shallow surface [26]. (b) The cutting forces in the turning simulations.
Materials 14 03937 g003
Figure 4. The comparison of the residual stresses in the experiments and simulations, where f equals 0.1 mm/rev. (a) vc and ap equal 60 m/min and 0.4 mm, respectively. (b) vc and ap equal 120 m/min and 0.8 mm, respectively [28].
Materials 14 03937 g004
Figure 5. The comparison of the chip thickness in the experiments and simulations [28].
Materials 14 03937 g005
Figure 6. The trends of the cutting force components with feed at each cutting speed. (a) The circumferential force (60 m/min), (b) the radial force (60 m/min), and (c) the axial force (60 m/min). (d) The circumferential force (120 m/min), (e) the radial force (120 m/min), and (f) the axial force (120 m/min).
Materials 14 03937 g006
Figure 7. (a) The comparison of the circumferential forces at 60 and 120 m/min. (b) The comparison of the radial forces at 60 and 120 m/min. (c) The comparison of the axial forces at 60 and 120 m/min. (d) The comparison of the cutting temperatures at 60 and 120 m/min. (e) The comparison of the circumferential residual stress at 60 and 120 m/min.
Materials 14 03937 g007
Figure 8. The schematic diagram of the cutting process and three shear zones [5].
Materials 14 03937 g008
Figure 9. (a) The variations of the cutting temperatures as feeds and cutting depths at 60 m/min. (b) The variations of the cutting temperature as feeds and cutting depths at 120 m/min.
Materials 14 03937 g009
Figure 10. The orthogonal plane coordinate system and the tool parameters [31].
Materials 14 03937 g010
Figure 11. The assumed working plane coordinate system and the tool parameters [31].
Materials 14 03937 g011
Figure 12. The diagram of the simplified tool-chip model.
Materials 14 03937 g012
Figure 13. The predicted, simulated, and experimental residual stresses.
Materials 14 03937 g013
Table 1. The material properties of the Inconel 718 used in the simulations [25].
Thermal Conductivity
(W/(m·K))
Specific Heat
(J/(kg·K))
Thermal Expansion Coefficient
(10−6/K)
Melting Temperature
(K)
10.53 (293 K)435 (293 K)11.8 (293–373 K)1573
14.7 (373 K)481.4 (573 K)13 (293–573 K)
17.8 (573 K)514.8 (773 K)14.1 (293–673 K)
19.6 (773 K)573.4 (973 K)14.8 (573–873 K)
Table 2. The tool geometry used in turning simulations and experiments.
Tool ParametersValues
Rake angle (degree)−6
Relief angle (degree)6
Lead angle (degree)−17.5
Inclination angle (degree)−7
Coating (thickness)TiAlN (0.002 mm)
Table 3. The cutting regime in the experiments.
Turning ExperimentsCutting Speed (m/min)Depth of Cut (mm)Feed Rate (mm/rev)
1600.40.1
21200.8
Table 4. The main elements and weight of Inconel 718 pipes used in experiments.
ElementsNiFeCrNbMoTi
Weight52.86%19.15%19.085%5.085%3.105%0.71%
Table 5. The planning of the cutting parameters in the simulations.
Test No.Feed Rate (mm/rev)Depth of Cut (mm)Cutting Speed (m/min)
10.0750.460, 120
20.10
30.125
40.15
50.0750.6
60.10
70.125
80.15
90.0750.8
100.10
110.125
120.15
Table 6. The parameters in the predicted model of the surface residual stress.
ParametersB0m1m2B1n1n2B2n3n4B3n5n6
Value15.3320.7320.1180.4440.1331.0961.7360.5430.5553.9982.130.289
Publisher’s Note: MDPI stays neutral with regard to jurisdictional claims in published maps and institutional affiliations.

