
Multivariable Regression Strength Model for Steel Fiber-Reinforced Concrete Beams under Torsion


Abstract
:1. Introduction
1.1. Post-Cracking Behavior of Steel Fiber Reinforced Concrete (SFRC)
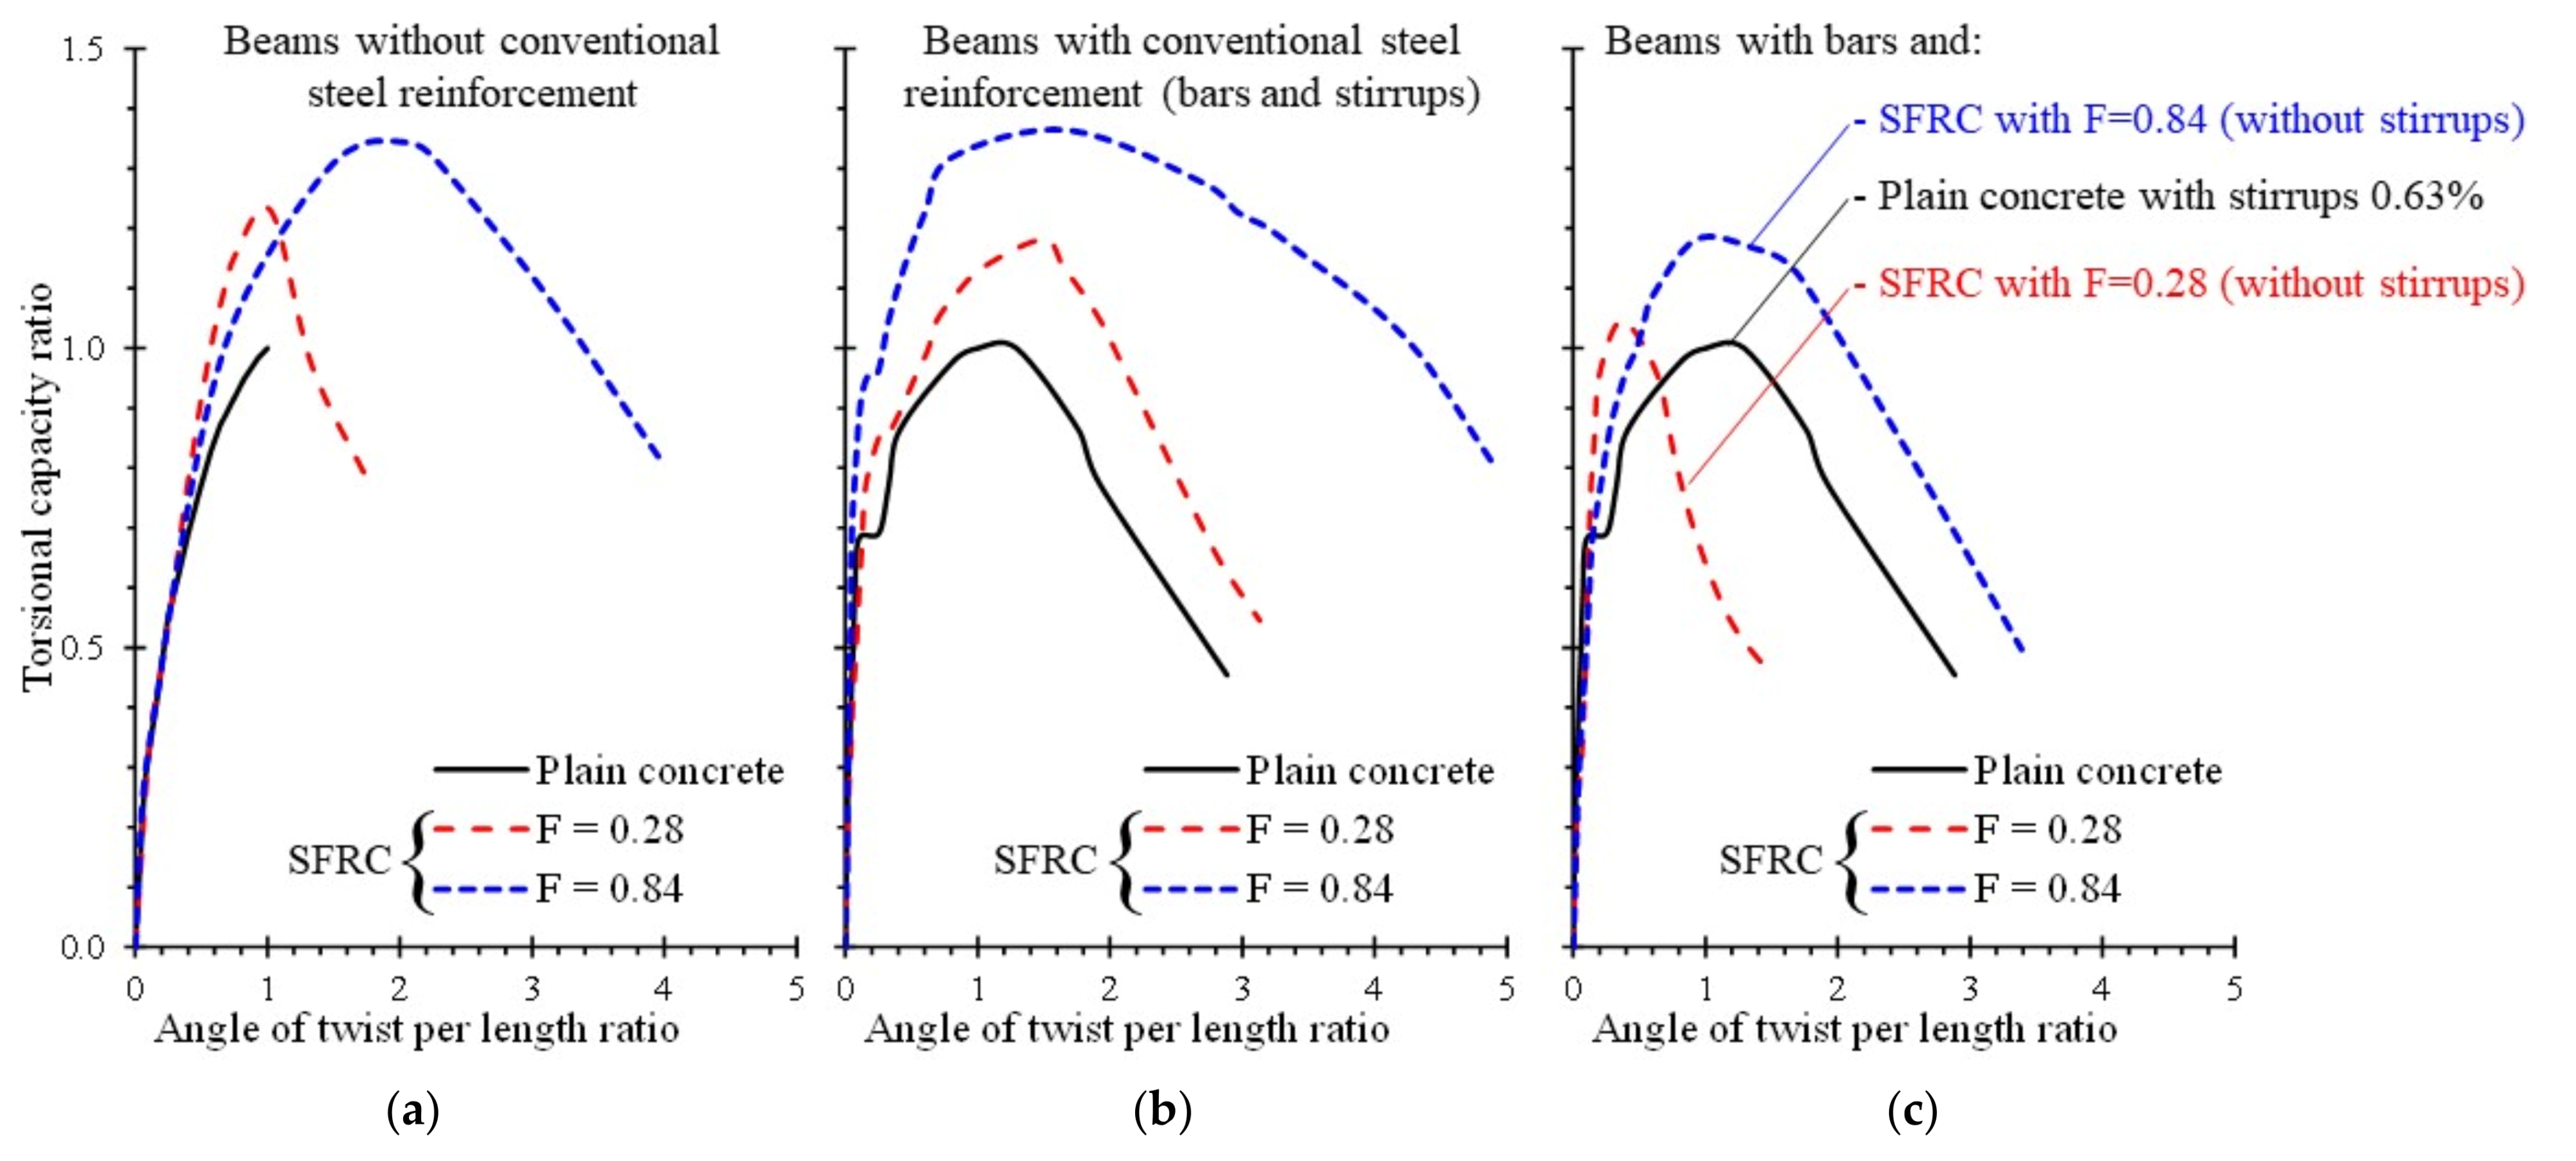
1.2. Behavior of SFRC Members under Torsion
1.3. Theoretical Models Predicting the Overall Response of SFRC Members under Torsion
1.4. Simplified Models Predicting the Ultimate Torsional Strength of SFRC Members
1.5. Research Significance
2. Nonlinear Regression
2.1. Torsion Testing of SFRC Beams
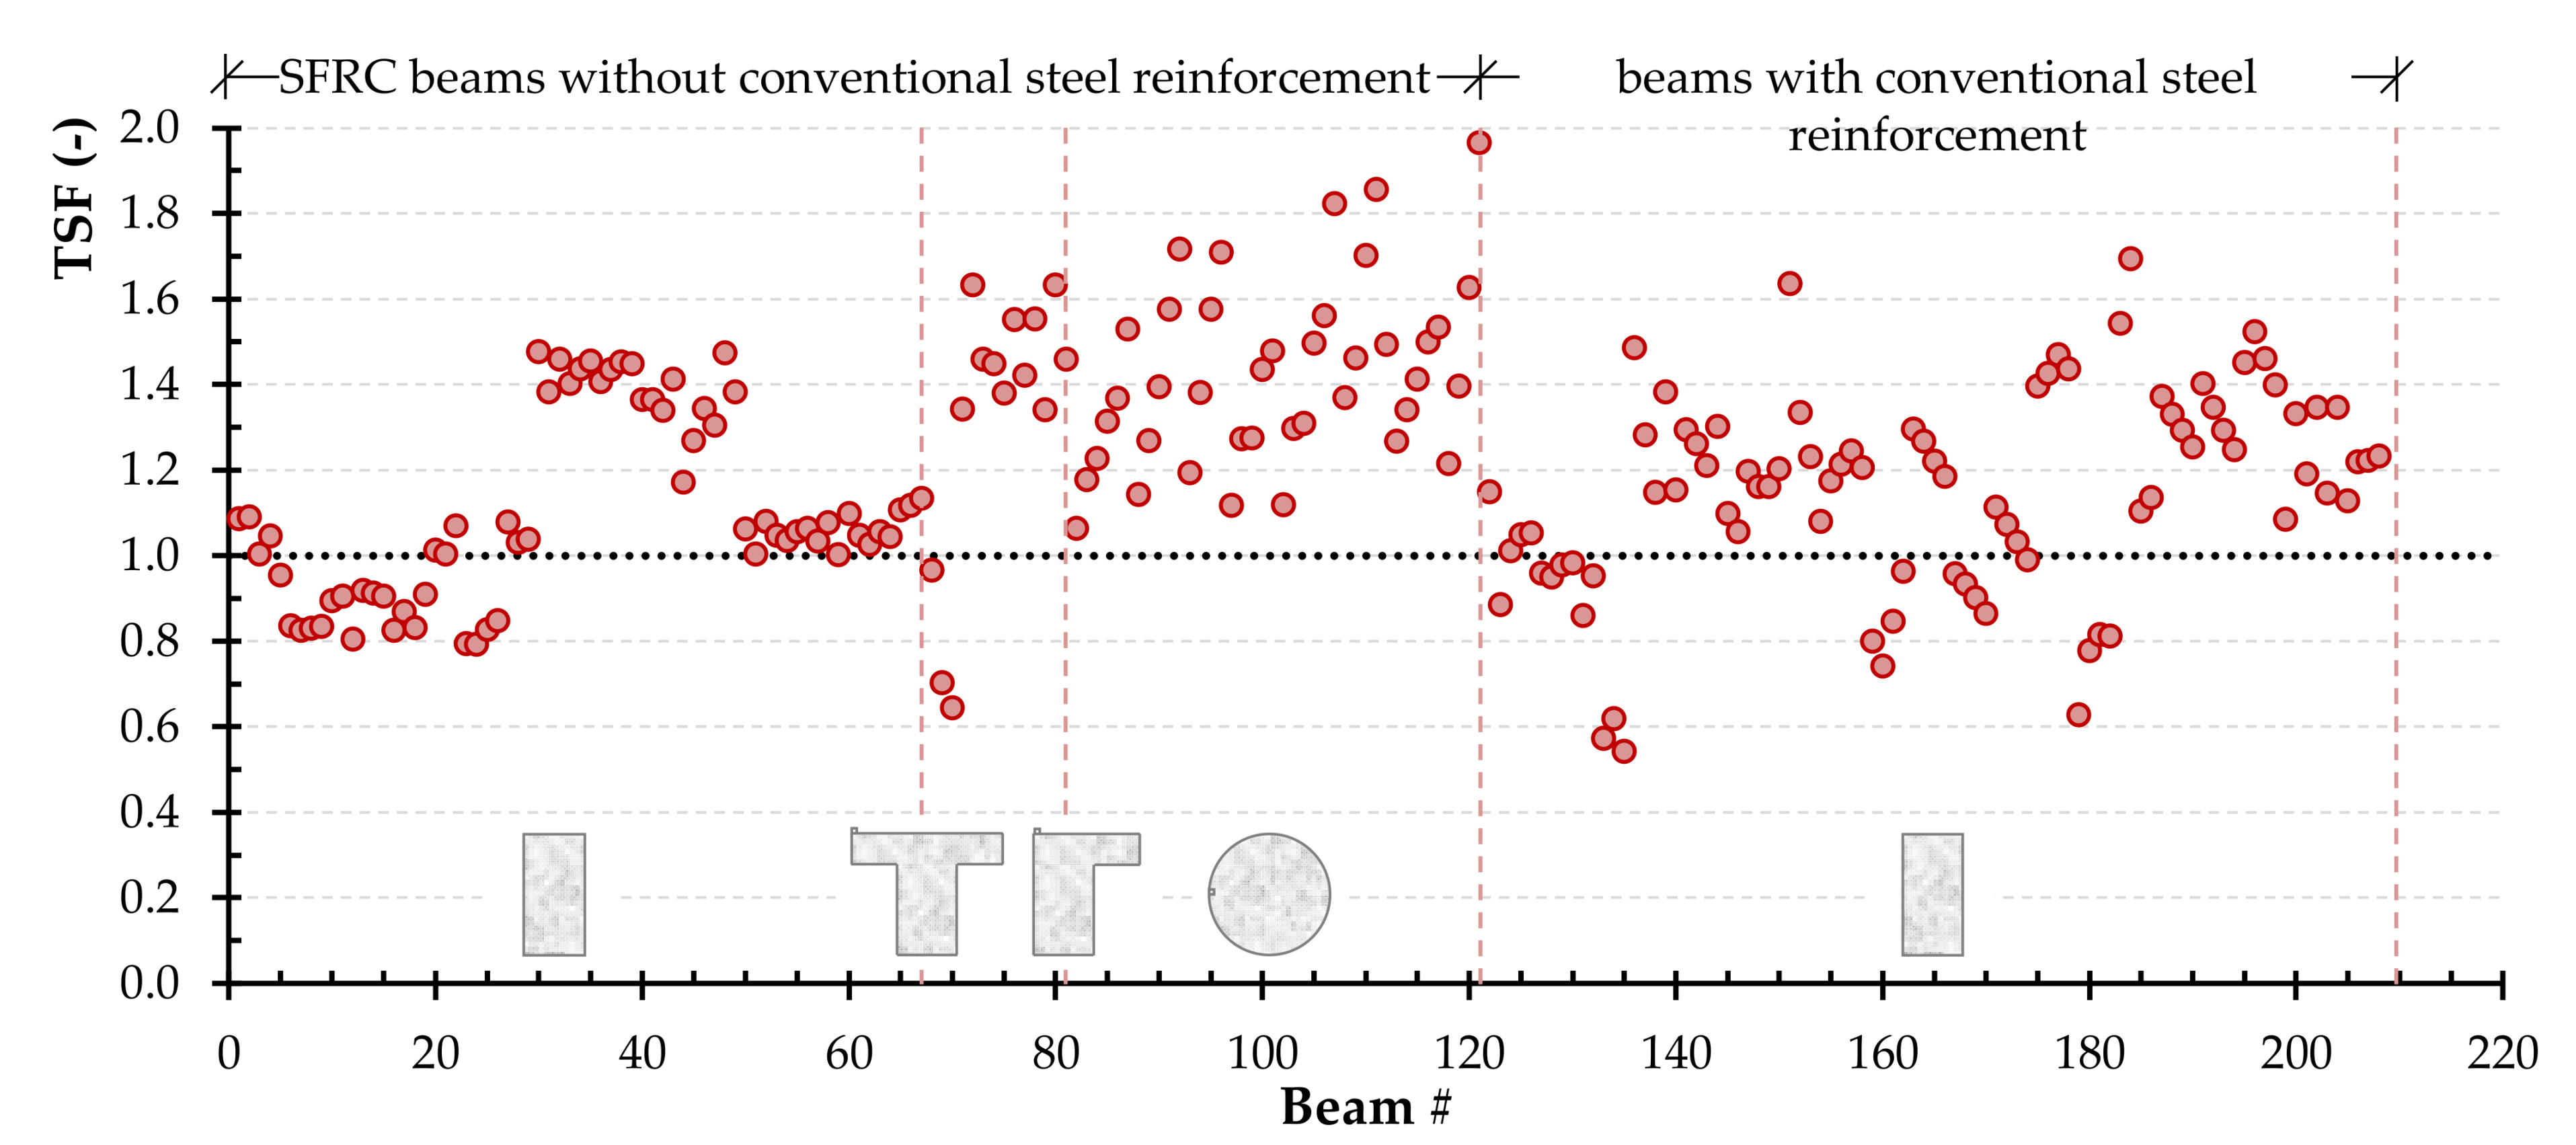
2.2. Effectiveness Evaluation of Existing Models
2.3. The Modified NKPT Model
2.4. The Improved ACI Formulation
3. Comparing Various Models
4. Conclusions
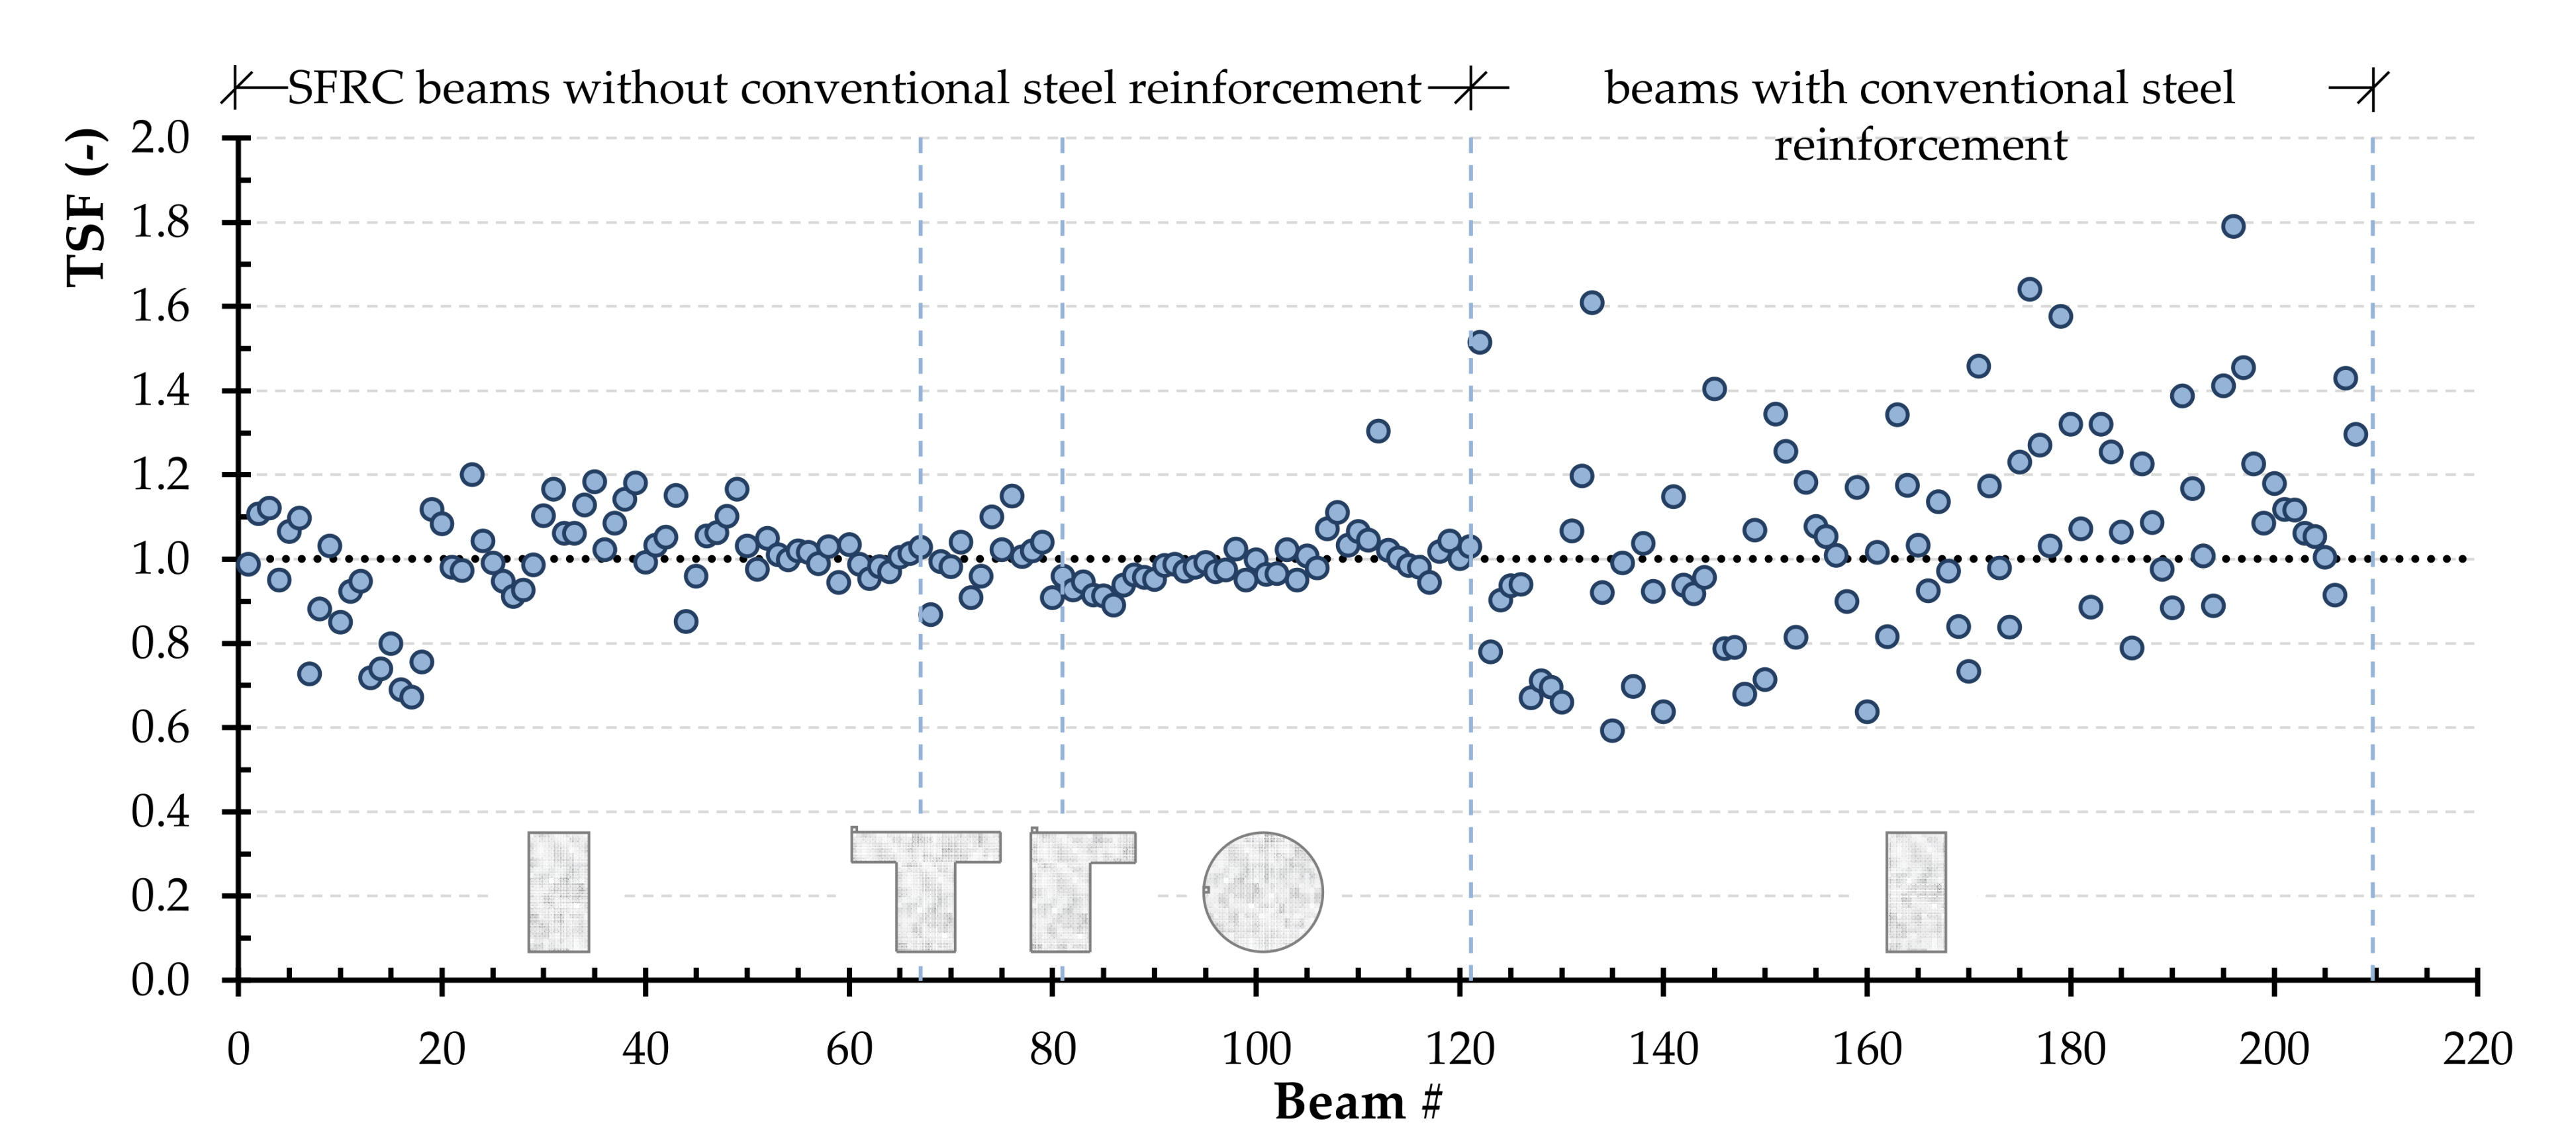
- A database of 210 SFRC beams tested under torsion from 16 different experimental studies conducted around the world is properly compiled and examined for the purposes of this research. It comprises beams with rectangular, flanged and circular cross-sections with various dimensions and shapes. Further, beams without conventional steel reinforcement, with longitudinal bars only and full torsional reinforcement (steel bars and stirrups) are included in order to establish the validity of the proposed approach based on a broad range of parametric studies. The majority of the experimental campaigns follow similar typical torsional testing setup and morphology and, therefore, test results could be considered, up to a point, comparable.
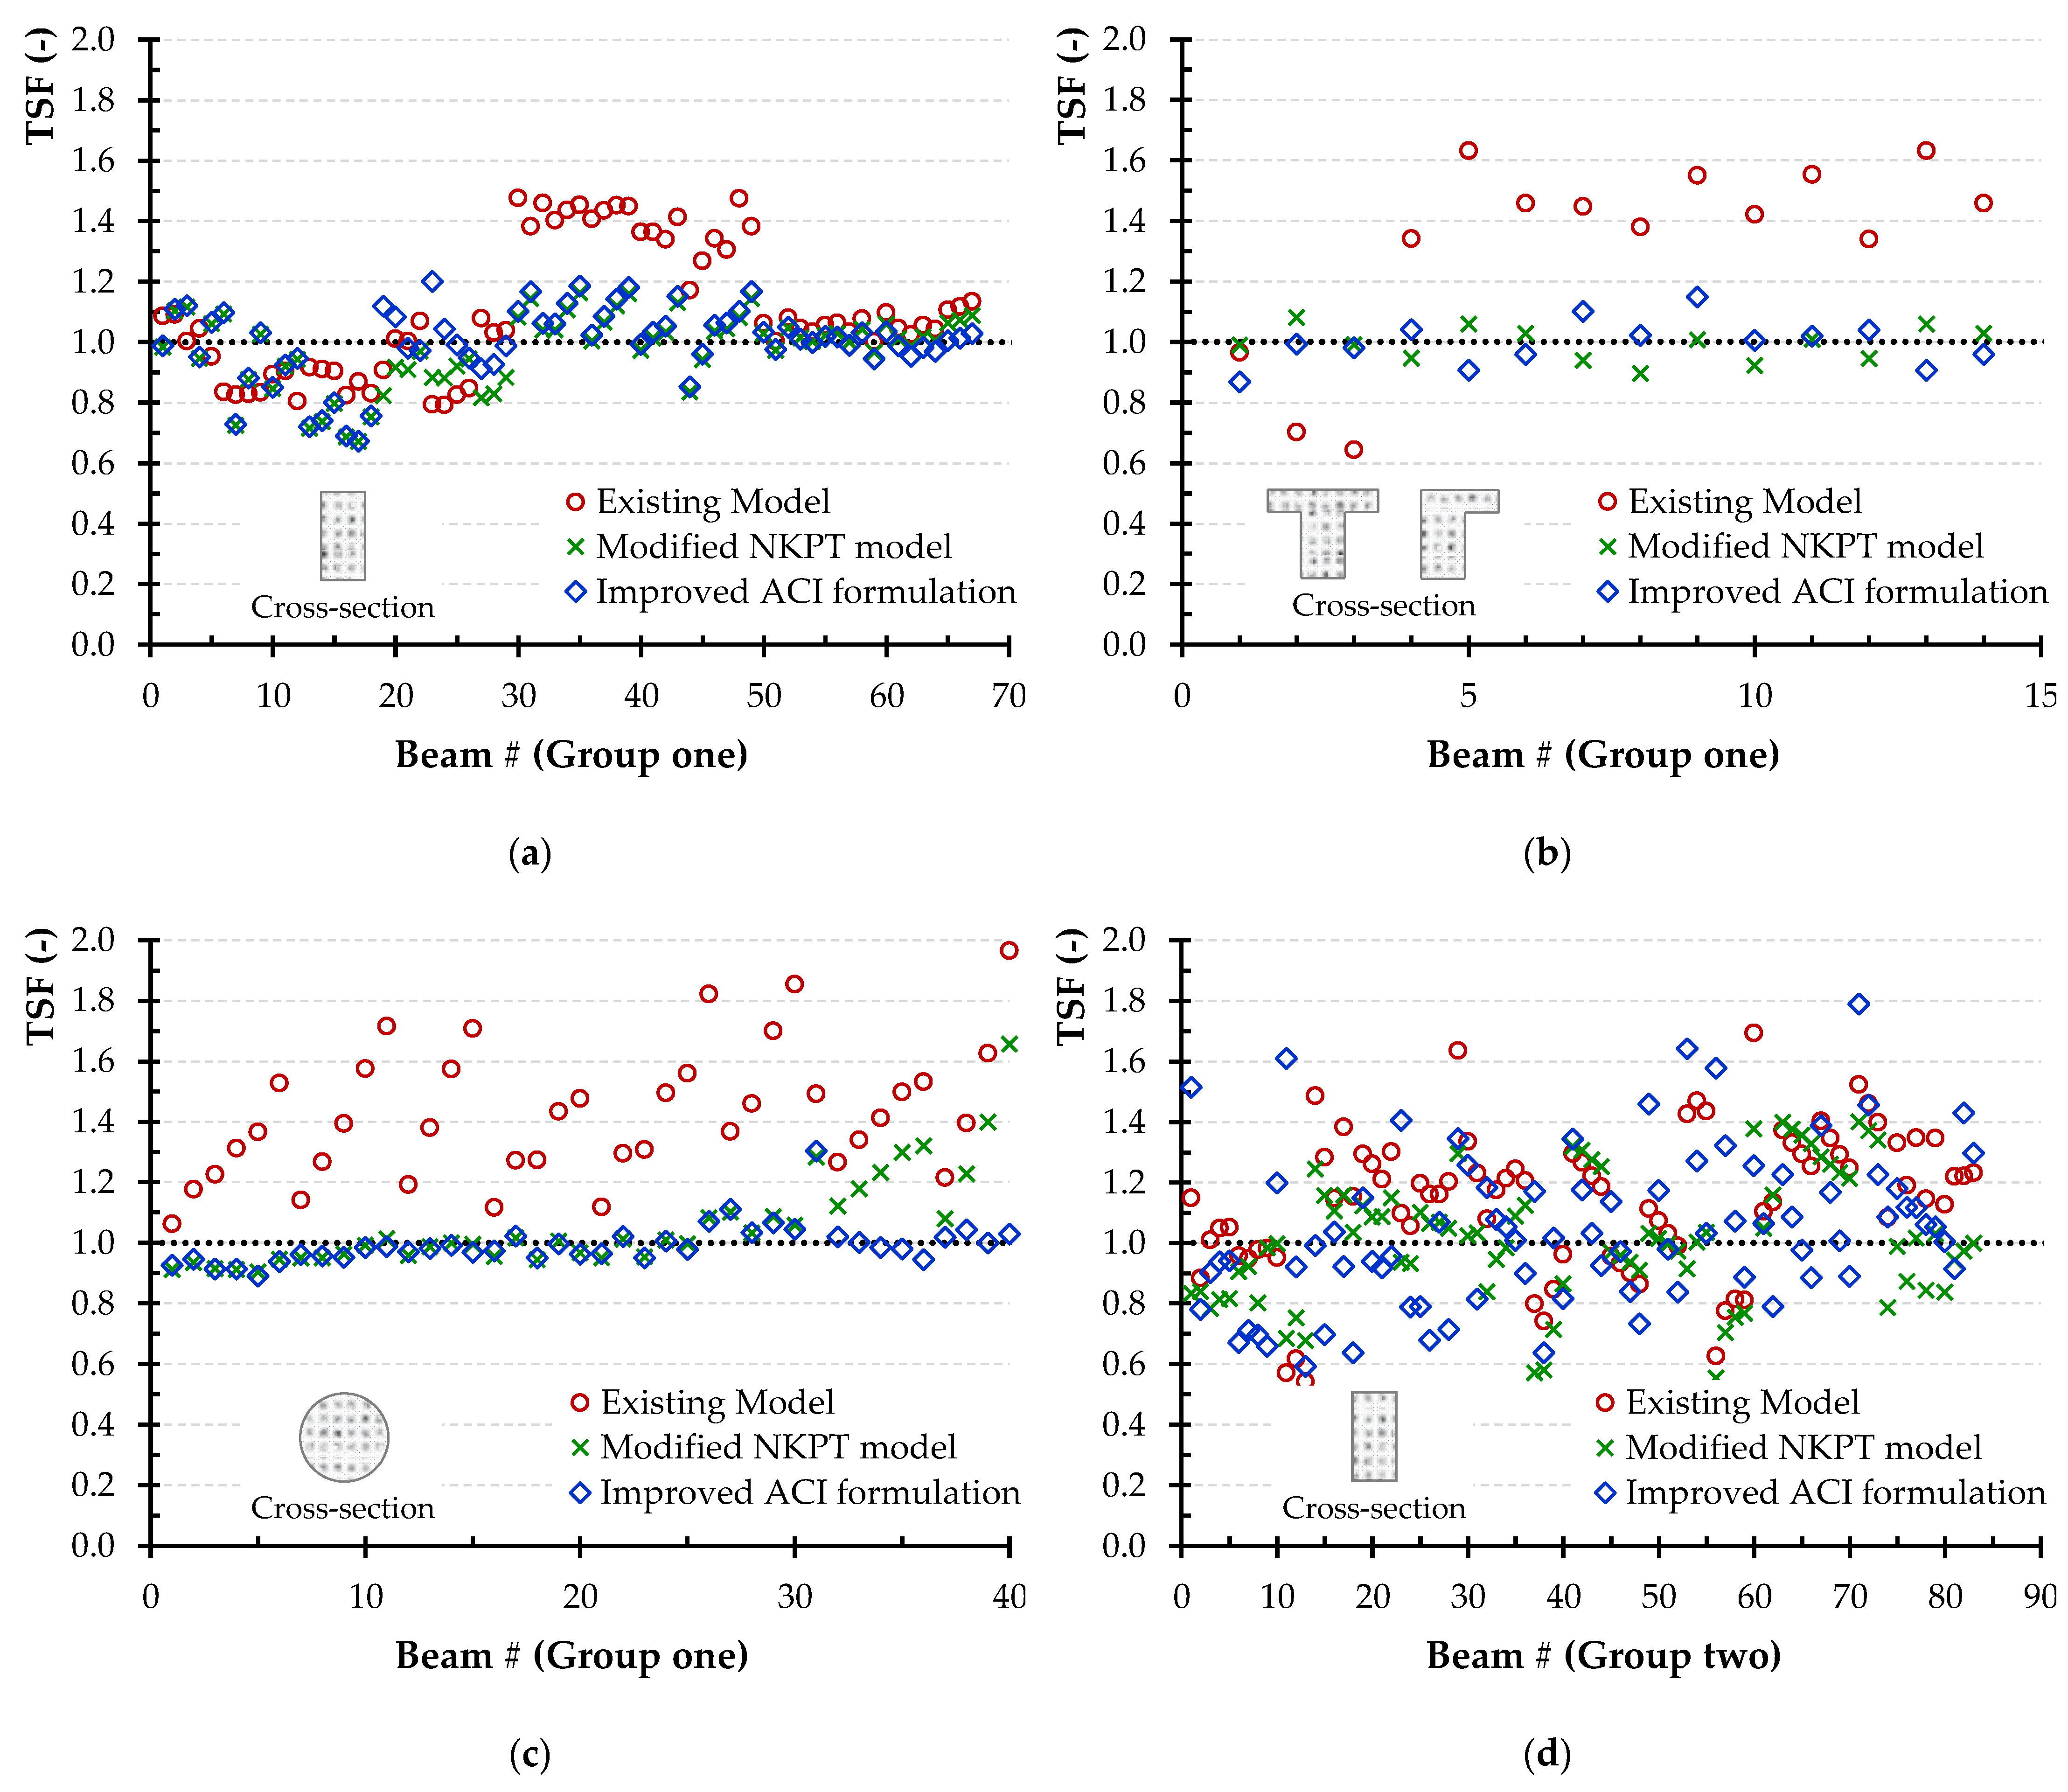
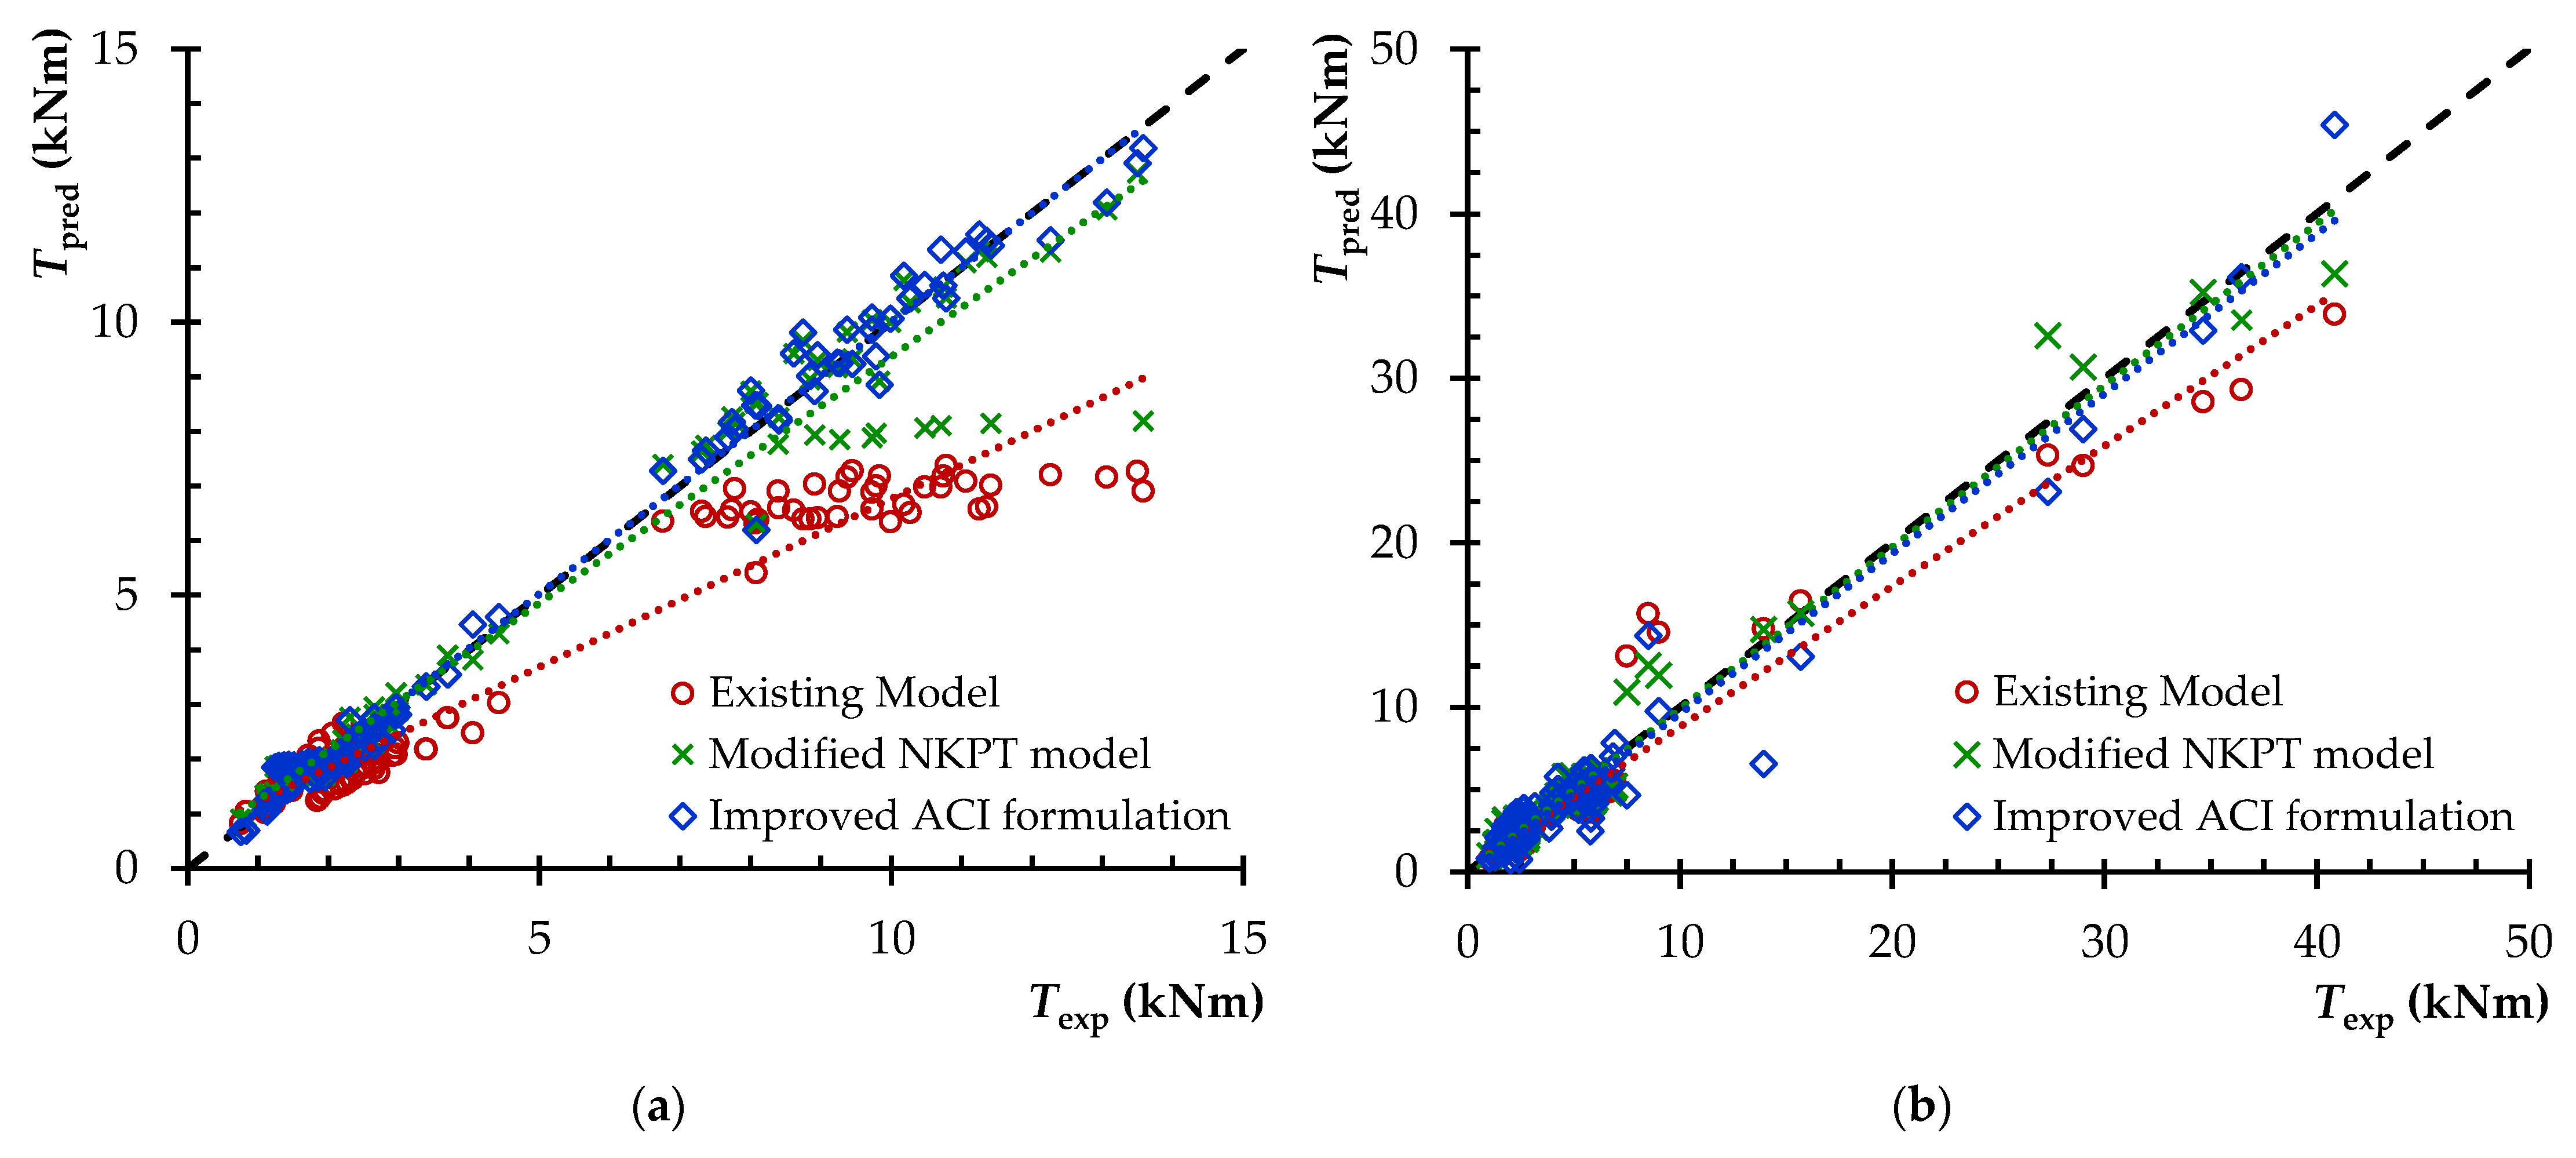
- Two models for predicting the torsional strength of SFRC beams that had been reported in the literature were adapted and their efficacy was evaluated. The predicted torsional strength is compared to the experimental values obtained from the tests. The values of the average and the coefficient of variation of the ratios between the experimentally obtained torsional strength and the calculated one revealed that further improvement and refinement of the models is still required.
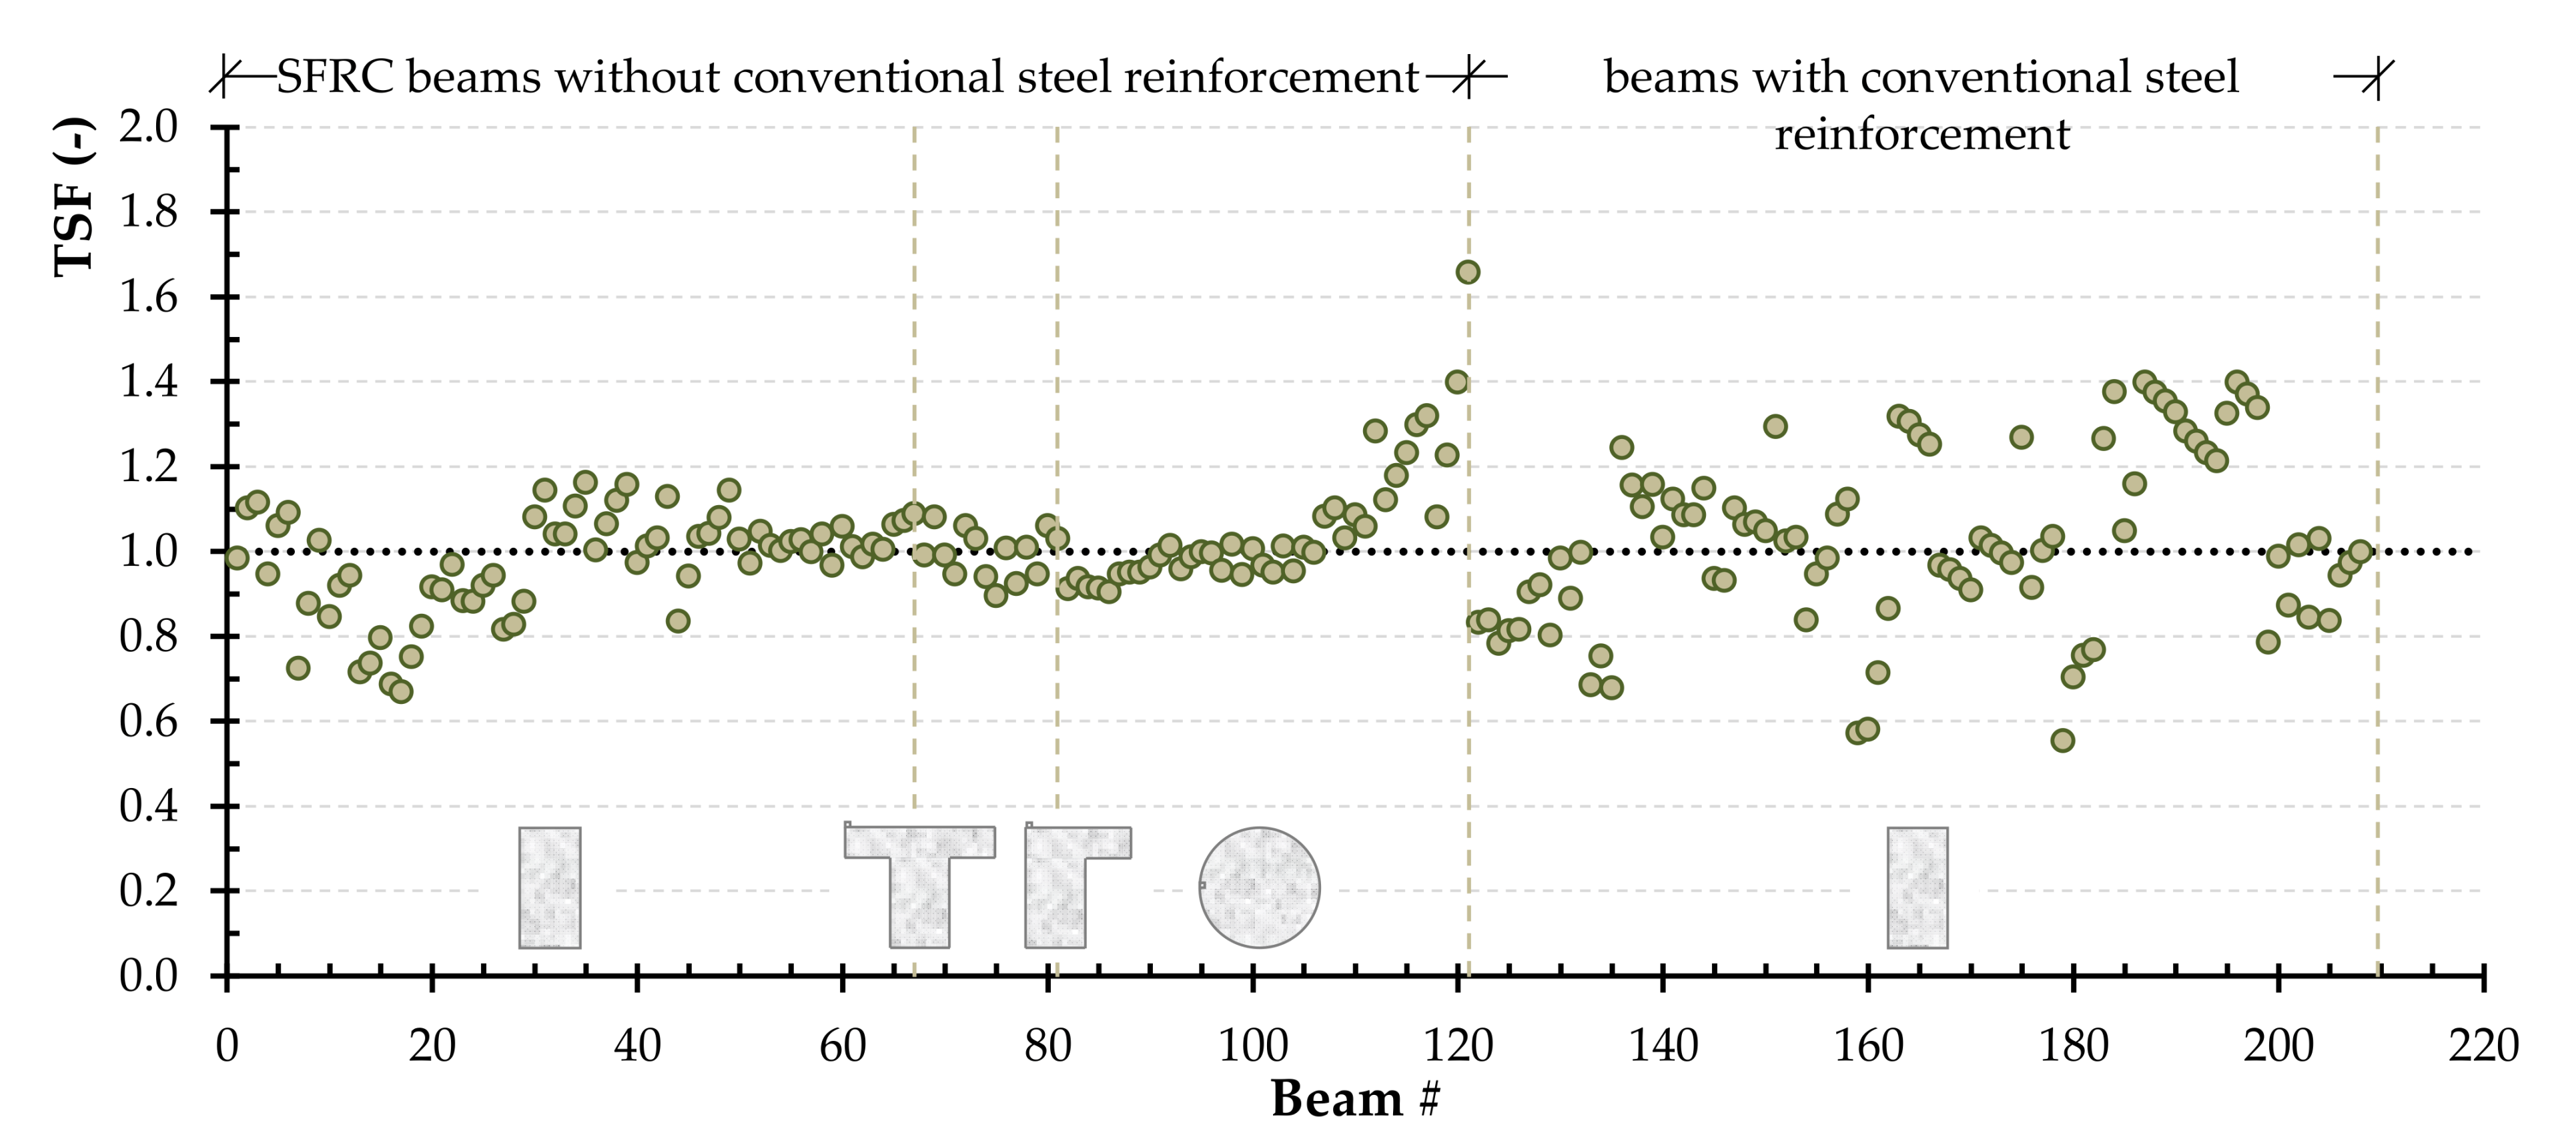
- Multi-linear regression was used to optimize the constants that influence the torsional strength in order to improve the predictions of the available models. Using the optimization of the constants, the proposed model (the modified NKPT model) demonstrated particularly high accuracy in estimating torsional strength and lower coefficient of variation as compared to the original one.
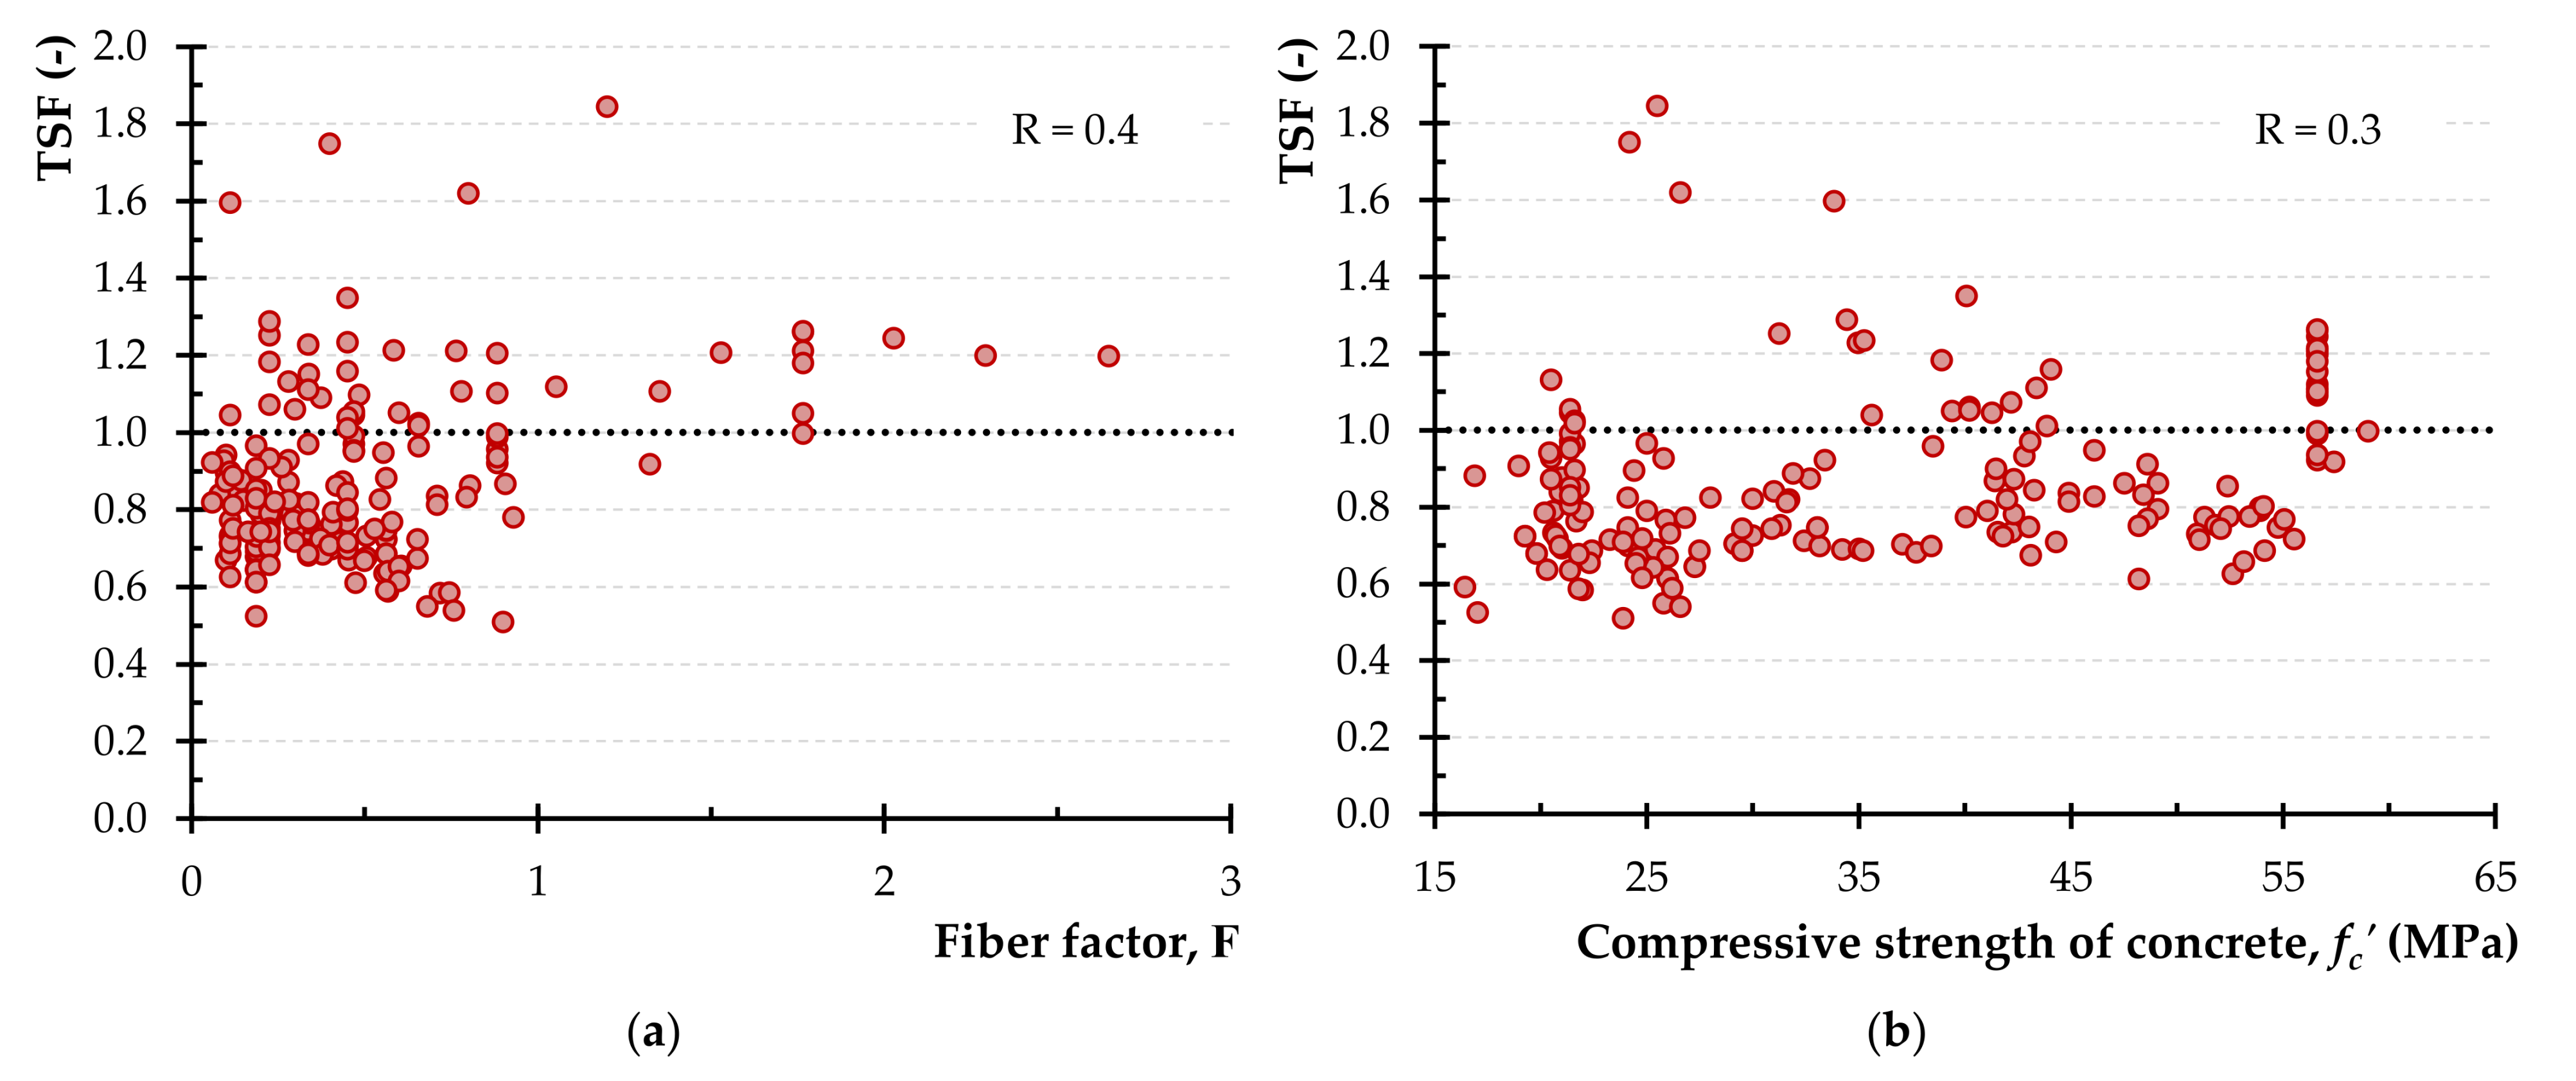
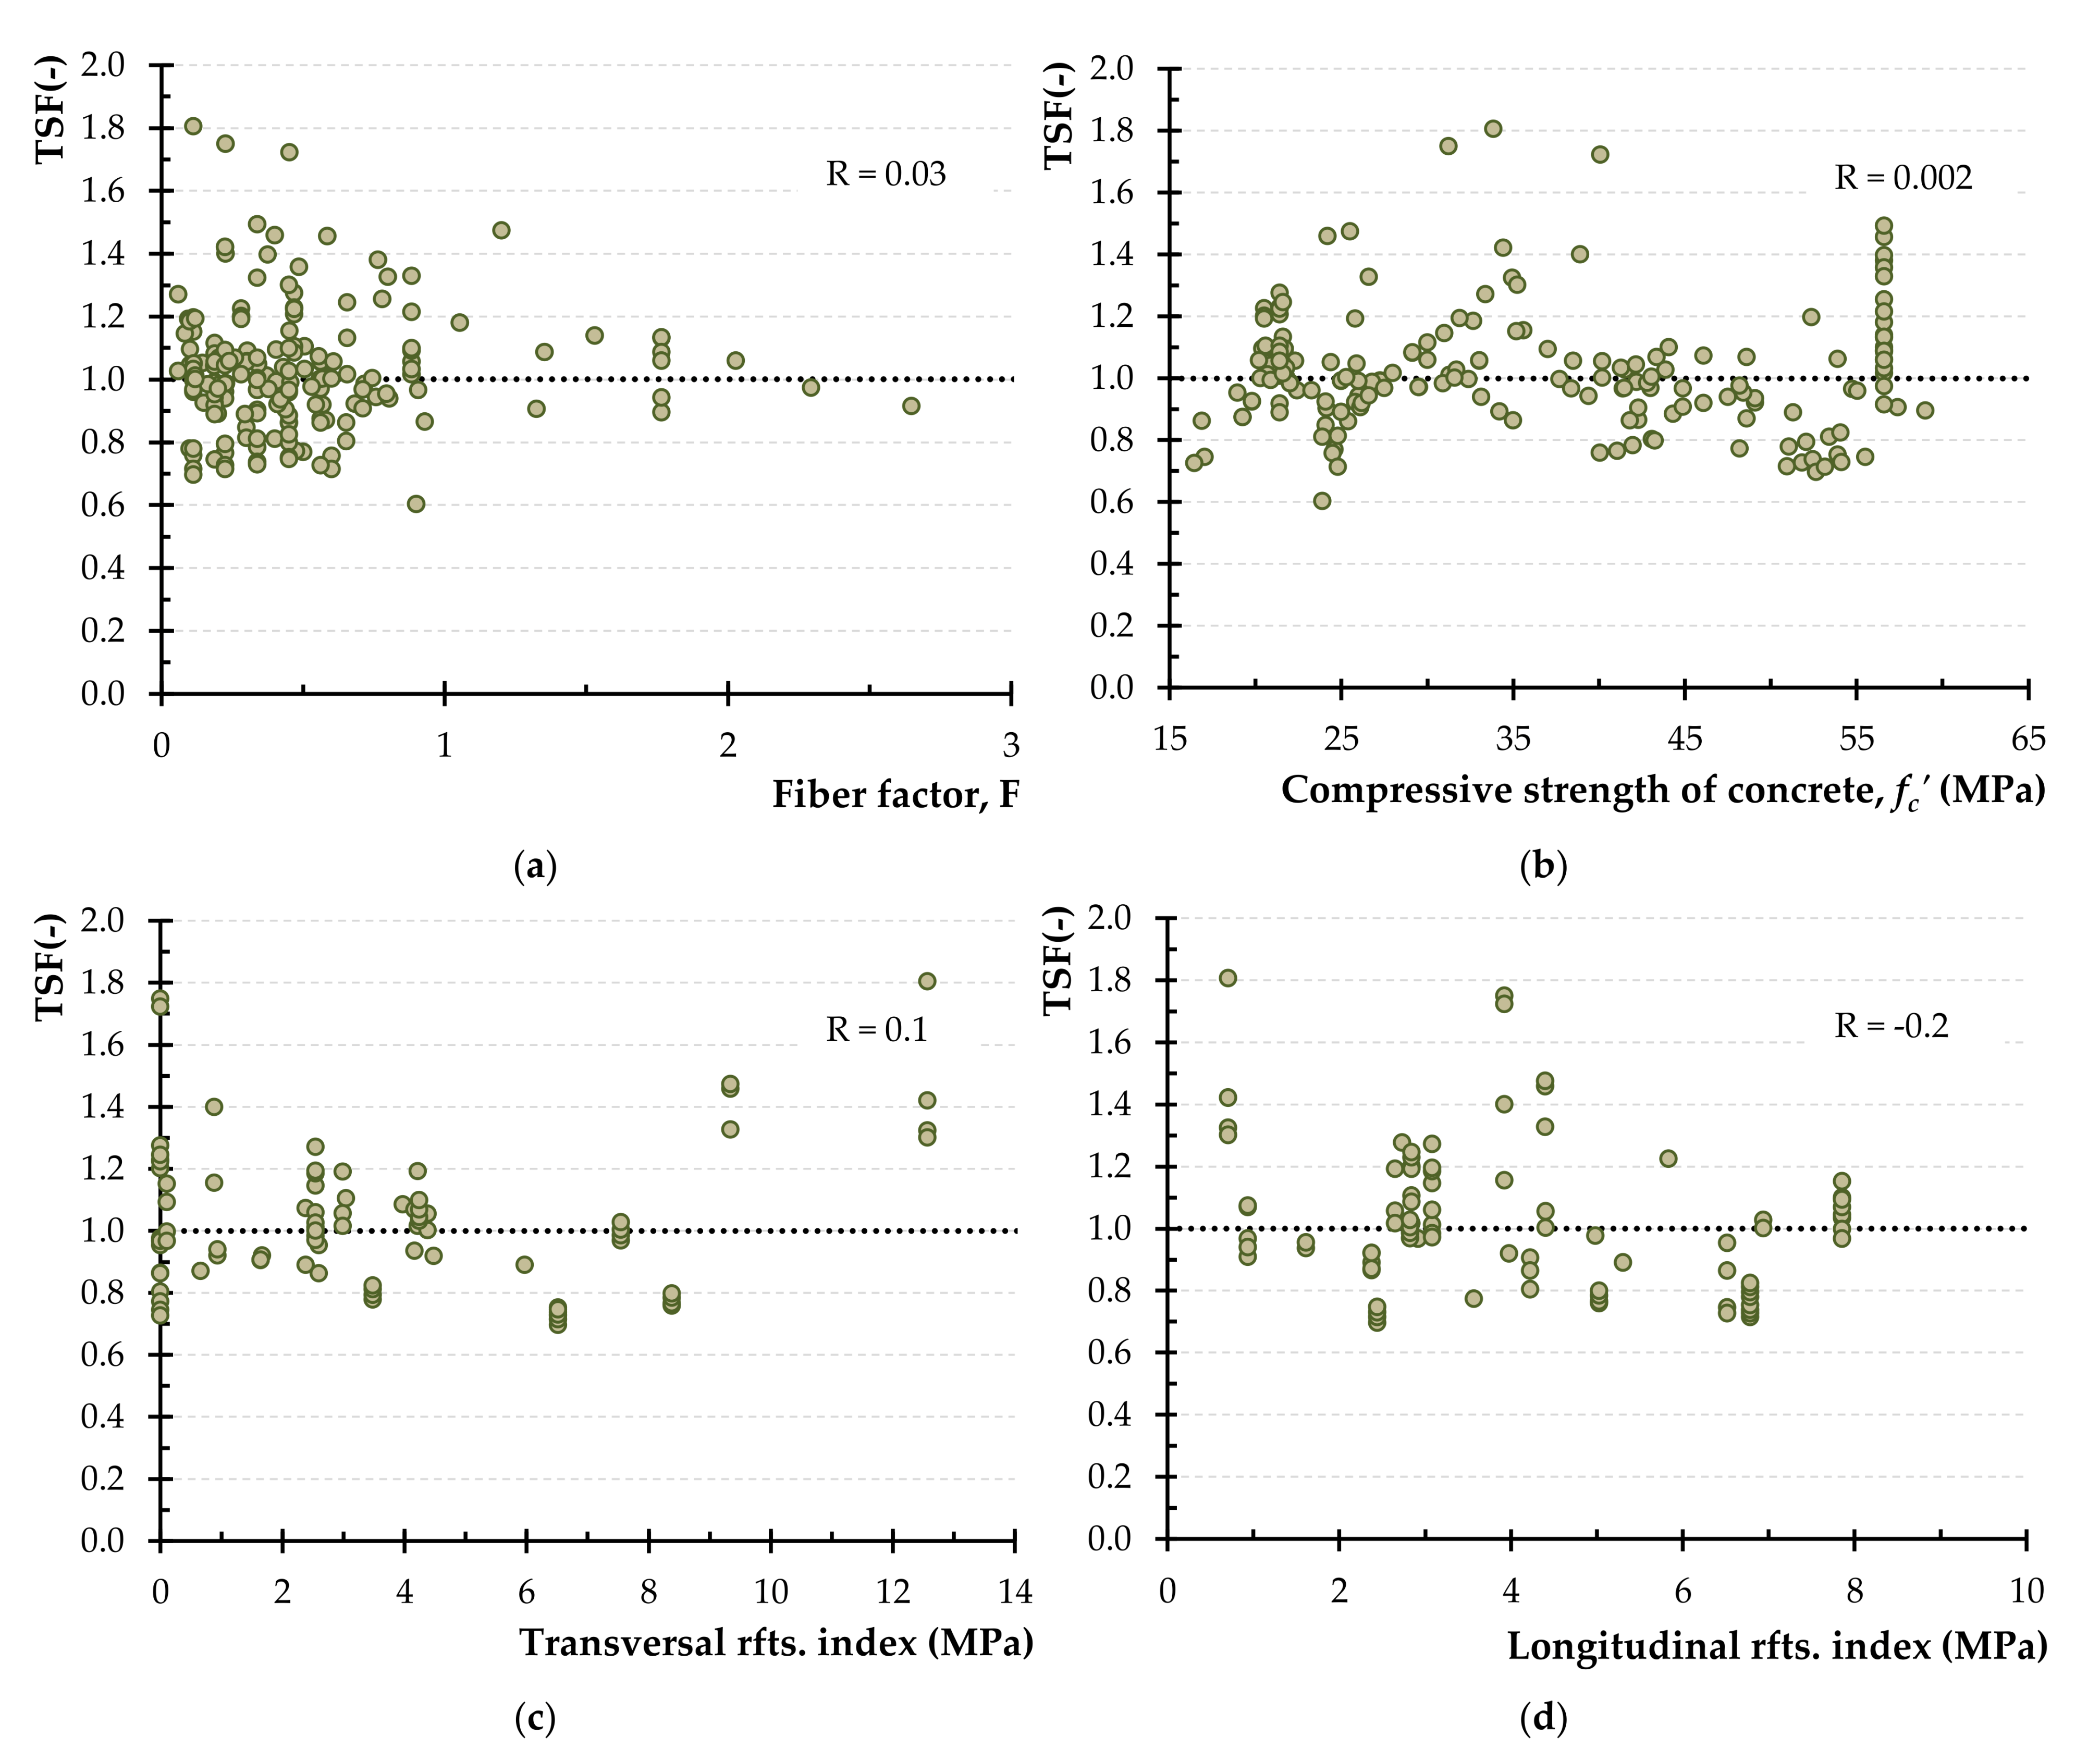
- The ratio of the experimentally obtained strength and the calculated one using the examined model were correlated with four parameters affecting the torsional capacity of the SFRC beams. The values of the correlation coefficient indicated that the proposed models are less dependent on these parameters and, therefore, are capable to capture their effect on the torsional strength providing correct predictions.
- A second model is also proposed, which is based on modifying the ACI design code for RC members to account for the effect of steel fibers on the torsional capacity of SFRC beams. When compared to other design models which provide safe and validated predictions, the proposed model demonstrated higher compliance and consistency with the experimental results. Further, this model employs a simple and easy-to-apply formulation to implement the ACI code for RC. The developed optimizing methodology could be enriched later with further experimental tests that will assist in the refinement of the proposed models.
Author Contributions
Funding
Institutional Review Board Statement
Informed Consent Statement
Data Availability Statement
Acknowledgments
Conflicts of Interest
Glossary
| β | The bond coefficient of steel fiber. |
| θ | The angle of inclination of the concrete strut, taken as 45°. |
| ρf | The volume ratio of fibers. |
| ρl | Longitudinal steel reinforcement ratio. |
| ρt | Transversal steel reinforcement ratio. |
| Acp | Total concrete cross-sectional area. |
| Al | Total cross-sectional area of longitudinal steel reinforcement. |
| A0 | The area enclosed inside centerline of shear flow path. |
| As | Cross-sectional area of steel stirrup. |
| At | The cross-section area of one branch of the steel stirrups. |
| c1 | Constant with value equal to 0.5, 0.55 and 0.86 for beams with rectangular, flanged and circular cross-section, respectively. |
| c2 | Constant with value equal to 0.04, 0.08 and 0.92 for beams with rectangular, flanged and circular cross-section, respectively. |
| D | The diameter of cross-section. |
| df | Diameter of fiber. |
| F | The fiber factor, which is taken as β (lf/df) ρf. |
| The cylinder compressive strength of the concrete. | |
| The cubic compressive strength of the concrete. | |
| The yield stress of longitudinal steel reinforcing bars. | |
| The concrete tensile strength, taken as . | |
| The yield stress of transversal steel reinforcement (stirrups). | |
| k2 | The longitudinal reinforcement factor. |
| lf | Length of fiber. |
| m | The ratio between the longitudinal and transversal reinforcement, which is taken as ρl fly/ρt fty. |
| Pcp | The perimeter of concrete section. |
| Ph | The perimeter of outermost closed stirrup. |
| s | The spacing between steel stirrups along the longitudinal direction of the beam. |
| T | Torsion capacity of the cross-section. |
| x | the smaller dimension of the cross-section. |
| x0 | The smaller center to center dimension of the thin wall tube analogy, which is taken approximately as (5/6) x. |
| x1 | The smaller dimension of the steel stirrup, which is taken approximately as 0.9 x. |
| y | The larger dimension of the cross-section. |
| y0 | The larger center to center dimension of the thin wall tube analogy, which is taken approximately as (5/6) y. |
| y1 | The larger dimension of the steel stirrup, which is taken approximately as 0.9 y. |
Appendix A

| Reference | Name | Shape 1 | x | y | Type of Fibers 2 | β | ρf | lf/df | fcu | T |
|---|---|---|---|---|---|---|---|---|---|---|
| (mm) | (mm) | (%) | (MPa) | (kNm) | ||||||
| [68] | A-1-1 | R | 85 | 178 | DF | 0.91 | 1.00 | 97 | 56.6 | 1.87 |
| A-1-1-5 | R | 85 | 178 | DF | 0.91 | 1.50 | 97 | 57.4 | 2.15 | |
| A-1-2 | R | 85 | 178 | DF | 0.91 | 2.00 | 97 | 59.0 | 2.24 | |
| B-1-1 | R | 85 | 178 | DF | 0.91 | 1.00 | 97 | 38.5 | 1.49 | |
| B-1-2 | R | 85 | 178 | DF | 0.91 | 2.00 | 97 | 39.4 | 1.74 | |
| B-1-3 | R | 85 | 178 | DF | 0.91 | 3.00 | 97 | 56.6 | 2.22 | |
| B-2-2 | R | 85 | 178 | DF | 0.78 | 2.00 | 49 | 56.6 | 1.37 | |
| B-2-4 | R | 85 | 178 | DF | 0.78 | 4.00 | 49 | 56.6 | 1.71 | |
| B-2-6 | R | 85 | 178 | DF | 0.78 | 6.00 | 49 | 56.6 | 2.06 | |
| B-3-1 | R | 85 | 178 | DF | 1.30 | 1.00 | 81 | 56.6 | 1.62 | |
| B-4-1 | R | 85 | 178 | DF | 1.30 | 1.00 | 104 | 56.6 | 1.78 | |
| B-5-1 | R | 85 | 178 | DF | 1.30 | 1.00 | 156 | 56.6 | 1.87 | |
| B-6-1 | R | 85 | 178 | RF | 0.50 | 1.00 | 75 | 56.6 | 1.34 | |
| B-7-1 | R | 85 | 178 | RF | 0.50 | 1.00 | 97 | 56.6 | 1.38 | |
| B-8-1 | R | 85 | 178 | RF | 0.75 | 1.00 | 104 | 56.6 | 1.51 | |
| B-9-1 | R | 85 | 178 | CF | 0.75 | 1.00 | 78 | 56.6 | 1.29 | |
| B-10-1 | R | 85 | 178 | CF | 0.72 | 1.00 | 47 | 56.6 | 1.25 | |
| B-11-1 | R | 85 | 178 | DF | 0.91 | 1.00 | 97 | 56.6 | 1.43 | |
| A-1-1A | R | 85 | 85 | DF | 0.91 | 1.00 | 97 | 56.6 | 0.75 | |
| A-1-1B | R | 85 | 115 | DF | 0.91 | 1.00 | 97 | 56.6 | 1.13 | |
| A-1-1C | R | 85 | 145 | DF | 0.91 | 1.00 | 97 | 56.6 | 1.41 | |
| A-1-1D | R | 85 | 178 | DF | 0.91 | 1.00 | 97 | 56.6 | 1.84 | |
| B-1-2A | R | 85 | 85 | DF | 0.91 | 2.00 | 97 | 56.6 | 0.83 | |
| B-1-2B | R | 85 | 115 | DF | 0.91 | 2.00 | 97 | 56.6 | 1.12 | |
| B-1-2C | R | 85 | 145 | DF | 0.91 | 2.00 | 97 | 56.6 | 1.47 | |
| B-1-2D | R | 85 | 178 | DF | 0.91 | 2.00 | 97 | 56.6 | 1.86 | |
| [79] | B1 | R | 100 | 155 | HF | 0.50 | 0.75 | 75.0 | 20.5 | 1.10 |
| C1 | R | 100 | 155 | HF | 0.50 | 1.25 | 75.0 | 21.4 | 1.15 | |
| D1 | R | 100 | 155 | HF | 0.50 | 1.75 | 75.0 | 21.6 | 1.24 | |
| [71] | F-1 | C | D = 250 | PIW | 0.50 | 0.50 | 40.4 | 20.4 | 6.75 | |
| F-2 | C | D = 250 | PIW | 0.50 | 1.00 | 40.4 | 21.8 | 7.73 | ||
| F-3 | C | D = 250 | PIW | 0.50 | 1.50 | 40.4 | 21.5 | 8.00 | ||
| F-4 | C | D = 250 | PIW | 0.50 | 2.00 | 40.4 | 21.7 | 8.61 | ||
| F-5 | C | D = 250 | PIW | 0.50 | 2.50 | 40.4 | 20.6 | 8.74 | ||
| F-6 | C | D = 250 | PIW | 0.50 | 3.00 | 40.4 | 22.3 | 10.18 | ||
| F-7 | C | D = 250 | PIW | 0.50 | 0.50 | 57.4 | 21.0 | 7.36 | ||
| F-8 | C | D = 250 | PIW | 0.50 | 1.00 | 57.4 | 20.6 | 8.10 | ||
| F-9 | C | D = 250 | PIW | 0.50 | 1.50 | 57.4 | 20.8 | 8.95 | ||
| F-10 | C | D = 250 | PIW | 0.50 | 2.00 | 57.4 | 21.4 | 10.27 | ||
| F-11 | C | D = 250 | PIW | 0.50 | 2.50 | 57.4 | 22.0 | 11.35 | ||
| F-12 | C | D = 250 | PIW | 0.50 | 0.50 | 74.5 | 20.9 | 7.67 | ||
| F-13 | C | D = 250 | PIW | 0.50 | 1.00 | 74.5 | 20.7 | 8.84 | ||
| F-14 | C | D = 250 | PIW | 0.50 | 1.50 | 74.5 | 20.3 | 9.99 | ||
| F-15 | C | D = 250 | PIW | 0.50 | 2.00 | 74.5 | 21.8 | 11.25 | ||
| F-16 | C | D = 250 | PIW | 0.50 | 0.50 | 40.4 | 21.6 | 7.30 | ||
| F-17 | C | D = 250 | PIW | 0.50 | 1.00 | 40.4 | 22.0 | 8.40 | ||
| F-18 | C | D = 250 | PIW | 0.50 | 1.50 | 40.4 | 20.2 | 8.06 | ||
| F-19 | C | D = 250 | PIW | 0.50 | 2.00 | 40.4 | 20.9 | 9.23 | ||
| F-20 | C | D = 250 | PIW | 0.50 | 2.50 | 40.4 | 21.8 | 9.72 | ||
| F-21 | C | D = 250 | PIW | 0.50 | 0.50 | 45.5 | 24.4 | 7.77 | ||
| F-22 | C | D = 250 | PIW | 0.50 | 1.00 | 45.5 | 26.8 | 9.44 | ||
| F-23 | C | D = 250 | PIW | 0.50 | 1.50 | 45.5 | 25.9 | 9.37 | ||
| F-24 | C | D = 250 | PIW | 0.50 | 2.00 | 45.5 | 26.0 | 10.74 | ||
| F-25 | C | D = 250 | PIW | 0.50 | 2.50 | 45.5 | 25.3 | 11.06 | ||
| F-26 | C | D = 250 | PIW | 0.50 | 3.00 | 45.5 | 25.8 | 13.06 | ||
| F-27 | C | D = 250 | PIW | 0.50 | 0.50 | 75.8 | 26.1 | 9.83 | ||
| F-28 | C | D = 250 | PIW | 0.50 | 1.00 | 75.8 | 27.5 | 10.78 | ||
| F-29 | C | D = 250 | PIW | 0.50 | 1.50 | 75.8 | 26.2 | 12.26 | ||
| F-30 | C | D = 250 | PIW | 0.50 | 2.00 | 75.8 | 26.6 | 13.49 | ||
| F-31 | C | D = 250 | PIW | 0.50 | 0.50 | 40.0 | 14.8 | 8.08 | ||
| F-32 | C | D = 250 | PIW | 0.50 | 1.00 | 40.0 | 25.0 | 8.91 | ||
| F-33 | C | D = 250 | PIW | 0.50 | 1.50 | 40.0 | 24.1 | 9.26 | ||
| F-34 | C | D = 250 | PIW | 0.50 | 2.00 | 40.0 | 23.9 | 9.72 | ||
| F-35 | C | D = 250 | PIW | 0.50 | 2.50 | 40.0 | 24.6 | 10.47 | ||
| F-36 | C | D = 250 | PIW | 0.50 | 3.00 | 40.0 | 24.5 | 10.70 | ||
| F-37 | C | D = 250 | PIW | 0.50 | 0.50 | 60.0 | 24.1 | 8.39 | ||
| F-38 | C | D = 250 | PIW | 0.50 | 1.00 | 60.0 | 24.8 | 9.78 | ||
| F-39 | C | D = 250 | PIW | 0.50 | 2.00 | 60.0 | 24.8 | 11.41 | ||
| F-40 | C | D = 250 | PIW | 0.50 | 3.00 | 60.0 | 23.9 | 13.58 | ||
| [80] | RP1 | R | 100 | 200 | HF | 0.50 | 1.00 | 37.5 | 19.8 | 1.84 |
| RP3 | R | 100 | 200 | HF | 0.50 | 3.00 | 37.5 | 19.3 | 1.95 | |
| LsP1 | L | 100 | 200 | HF | 0.50 | 1.00 | 37.5 | 21.0 | 2.21 | |
| LP1 | L | 100 | 200 | HF | 0.50 | 1.00 | 37.5 | 30.0 | 2.65 | |
| TsP1 | T | 100 | 200 | HF | 0.50 | 1.00 | 37.5 | 25.0 | 2.72 | |
| TP1 | T | 100 | 200 | HF | 0.50 | 1.00 | 37.5 | 29.1 | 2.96 | |
| THsP1 | T | 100 | 200 | HF | 0.50 | 1.00 | 37.5 | 27.3 | 3.39 | |
| THsP3 | T | 100 | 200 | HF | 0.50 | 3.00 | 37.5 | 33.0 | 3.69 | |
| THP1 | T | 100 | 200 | HF | 0.50 | 1.00 | 37.5 | 26.0 | 4.05 | |
| THP3 | T | 100 | 200 | HF | 0.50 | 3.00 | 37.5 | 29.5 | 4.42 | |
| [75] | P20-F1 | R | 100 | 200 | PIW | 0.50 | 0.30 | 75.1 | 22.4 | 1.88 |
| P20-F2 | R | 100 | 200 | PIW | 0.50 | 0.60 | 75.1 | 23.3 | 1.92 | |
| P20-F3 | R | 100 | 200 | PIW | 0.50 | 0.90 | 75.1 | 24.2 | 2.10 | |
| P20-F4 | R | 100 | 200 | PIW | 0.50 | 1.20 | 75.1 | 25.4 | 2.27 | |
| P30-F1 | R | 100 | 200 | PIW | 0.50 | 0.30 | 75.1 | 32.4 | 2.18 | |
| P30-F2 | R | 100 | 200 | PIW | 0.50 | 0.60 | 75.1 | 33.2 | 2.35 | |
| P30-F3 | R | 100 | 200 | PIW | 0.50 | 0.90 | 75.1 | 34.2 | 2.52 | |
| P30-F4 | R | 100 | 200 | PIW | 0.50 | 1.20 | 75.1 | 35.0 | 2.65 | |
| P40-F1 | R | 100 | 200 | PIW | 0.50 | 0.30 | 75.1 | 41.5 | 2.39 | |
| P40-F2 | R | 100 | 200 | PIW | 0.50 | 0.60 | 75.1 | 42.2 | 2.52 | |
| P40-F3 | R | 100 | 200 | PIW | 0.50 | 0.90 | 75.1 | 43.0 | 2.61 | |
| P40-F4 | R | 100 | 200 | PIW | 0.50 | 1.20 | 75.1 | 44.3 | 2.91 | |
| P50-F1 | R | 100 | 200 | PIW | 0.50 | 0.30 | 75.1 | 52.4 | 2.31 | |
| P50-F2 | R | 100 | 200 | PIW | 0.50 | 0.60 | 75.1 | 53.9 | 2.65 | |
| P50-F3 | R | 100 | 200 | PIW | 0.50 | 0.90 | 75.1 | 54.8 | 2.95 | |
| P50-F4 | R | 100 | 200 | PIW | 0.50 | 1.20 | 75.1 | 55.1 | 2.99 | |
| [46] | 1a | R | 102 | 102 | PIW | 0.50 | 1.00 | 26.3 | 36.3 | 0.905 |
| 1b | R | 102 | 102 | PIW | 0.50 | 1.00 | 26.3 | 32.3 | 0.903 | |
| 1c | R | 102 | 102 | PIW | 0.50 | 1.00 | 26.3 | 36.6 | 0.893 | |
| 2a | R | 102 | 102 | PIW | 0.50 | 1.00 | 38.6 | 35.0 | 0.923 | |
| 2b | R | 102 | 102 | PIW | 0.50 | 1.00 | 38.6 | 34.1 | 0.922 | |
| 2c | R | 102 | 102 | PIW | 0.50 | 1.00 | 38.6 | 35.0 | 0.915 | |
| 3a | R | 102 | 102 | PIW | 0.50 | 1.00 | 52.6 | 34.1 | 0.922 | |
| 3b | R | 102 | 102 | PIW | 0.50 | 1.00 | 52.6 | 35.2 | 0.963 | |
| 3c | R | 102 | 102 | PIW | 0.50 | 1.00 | 52.6 | 33.6 | 0.903 | |
| 4a | R | 102 | 102 | PIW | 0.50 | 1.00 | 77.2 | 32.3 | 0.996 | |
| 4b | R | 102 | 102 | PIW | 0.50 | 1.00 | 77.2 | 33.9 | 0.932 | |
| 4c | R | 102 | 102 | PIW | 0.50 | 1.00 | 77.2 | 32.7 | 0.959 | |
| 5a | R | 102 | 102 | PIW | 0.50 | 2.00 | 52.6 | 29.7 | 0.981 | |
| 5b | R | 102 | 102 | PIW | 0.50 | 2.00 | 52.6 | 31.5 | 0.981 | |
| 5c | R | 102 | 102 | PIW | 0.50 | 2.00 | 52.6 | 31.1 | 0.986 | |
| 6a | R | 102 | 102 | PIW | 0.50 | 3.00 | 52.6 | 33.7 | 1.055 | |
| 6b | R | 102 | 102 | PIW | 0.50 | 3.00 | 52.6 | 33.9 | 1.049 | |
| 6c | R | 102 | 102 | PIW | 0.50 | 3.00 | 52.6 | 35.0 | 1.050 | |
| [50] | RP1 | R | 100 | 200 | HF | 0.50 | 1.00 | 37.5 | 19.8 | 1.84 |
| RP3 | R | 100 | 200 | HF | 0.50 | 3.00 | 37.5 | 19.3 | 1.95 | |
| LsP1 | L | 100 | 200 | HF | 0.50 | 1.00 | 37.5 | 21.0 | 2.21 | |
| LP1 | L | 100 | 200 | HF | 0.50 | 1.00 | 37.5 | 30.0 | 2.65 | |
| TsP1 | T | 100 | 200 | HF | 0.50 | 1.00 | 37.5 | 25.0 | 2.72 | |
| TP1 | T | 100 | 200 | HF | 0.50 | 1.00 | 37.5 | 29.1 | 2.96 | |
| THsP1 | T | 100 | 200 | HF | 0.50 | 1.00 | 37.5 | 27.3 | 3.39 | |
| THsP3 | T | 100 | 200 | HF | 0.50 | 3.00 | 37.5 | 33.0 | 3.69 | |
| THP1 | T | 100 | 200 | HF | 0.50 | 1.00 | 37.5 | 26.0 | 4.05 | |
| THP3 | T | 100 | 200 | HF | 0.50 | 3.00 | 37.5 | 29.5 | 4.42 | |
| Minimum value | 85 | 85 | - | 0.5 | 0.30 | 37.5 | 14.8 | 0.75 | ||
| Maximum value | 250 | 200 | - | 1.3 | 6.00 | 156 | 59.0 | 13.58 | ||
| Reference | Name | Shape 1 | x | y | Type of Fibers 2 | β | ρf | lf/df | fcu | fly | ρl | fty | ρt | T |
|---|---|---|---|---|---|---|---|---|---|---|---|---|---|---|
| (mm) | (mm) | (%) | (MPa) | (MPa) | (%) | (MPa) | (%) | (kNm) | ||||||
| [79] | B2 | R | 100 | 155 | HF | 0.50 | 0.75 | 75.0 | 20.5 | 390 | 0.73 | – | – | 1.30 |
| B3 | R | 100 | 155 | HF | 0.50 | 0.75 | 75.0 | 20.5 | 390 | 0.73 | 371 | 1.14 | 1.75 | |
| C2-1 | R | 100 | 155 | HF | 0.50 | 1.25 | 75.0 | 21.4 | 375 | 0.73 | – | – | 1.32 | |
| C2-2 | R | 100 | 155 | HF | 0.50 | 1.25 | 75.0 | 21.4 | 390 | 0.73 | – | – | 1.37 | |
| C2-3 | R | 100 | 155 | HF | 0.50 | 1.25 | 75.0 | 21.4 | 450 | 1.30 | – | – | 1.38 | |
| C3-1 | R | 100 | 155 | HF | 0.50 | 1.25 | 75.0 | 21.4 | 390 | 0.73 | 371 | 0.82 | 1.91 | |
| C3-2 | R | 100 | 155 | HF | 0.50 | 1.25 | 75.0 | 21.4 | 390 | 0.73 | 371 | 1.07 | 2.03 | |
| D2 | R | 100 | 155 | HF | 0.50 | 1.75 | 75.0 | 21.6 | 390 | 0.73 | – | – | 1.43 | |
| D3 | R | 100 | 155 | HF | 0.50 | 1.75 | 75.0 | 21.6 | 390 | 0.73 | 371 | 1.14 | 2.27 | |
| [81] | T1 | R | 152 | 310 | HF | 1.00 | 0.50 | 60.0 | 40.2 | 350 | 1.26 | 400 | 1.10 | 13.95 |
| T2 | R | 152 | 310 | HF | 1.00 | 1.00 | 60.0 | 40.2 | 350 | 1.26 | 400 | 1.10 | 15.67 | |
| [82] | T05 | R | 125 | 300 | HF | 1.00 | 0.50 | 80.0 | 24.2 | 400 | 1.10 | 400 | 2.34 | 7.50 |
| T10 | R | 125 | 300 | HF | 1.00 | 1.00 | 80.0 | 26.6 | 400 | 1.10 | 400 | 2.34 | 9.00 | |
| T15 | R | 125 | 300 | HF | 1.00 | 1.50 | 80.0 | 25.5 | 400 | 1.10 | 400 | 2.34 | 8.50 | |
| [44] | LF1 | R | 85 | 178 | DF | 0.50 | 1.34 | 97.4 | 43.1 | 314 | 1.35 | – | – | 2.65 |
| LF2 | R | 85 | 178 | DF | 0.50 | 1.91 | 97.4 | 42.3 | 310 | 0.77 | – | – | 2.63 | |
| RF1 | R | 85 | 178 | DF | 0.50 | 0.90 | 97.4 | 42.3 | 314 | 1.35 | 368 | 0.45 | 2.80 | |
| LF3 | R | 85 | 178 | DF | 0.50 | 1.34 | 97.4 | 41.8 | 314 | 1.35 | – | – | 2.43 | |
| LF4 | R | 85 | 178 | DF | 0.50 | 1.86 | 97.4 | 41.4 | 368 | 0.25 | – | – | 2.31 | |
| RF2 | R | 85 | 178 | CF | 0.50 | 0.59 | 100.0 | 51.3 | 310 | 0.77 | 310 | 0.77 | 2.74 | |
| RF3 | R | 85 | 178 | CF | 0.50 | 0.82 | 100.0 | 49.1 | 310 | 0.77 | 310 | 0.54 | 2.56 | |
| RF4 | R | 85 | 178 | CF | 0.50 | 1.09 | 100.0 | 46.1 | 310 | 0.77 | 368 | 0.25 | 2.60 | |
| RF5 | R | 85 | 178 | CF | 0.50 | 1.16 | 100.0 | 48.6 | 310 | 0.77 | 368 | 0.18 | 2.76 | |
| RF6 | R | 85 | 178 | CF | 0.50 | 0.52 | 100.0 | 48.6 | 368 | 0.25 | 310 | 1.34 | 2.18 | |
| RF7 | R | 85 | 178 | CF | 0.50 | 1.11 | 100.0 | 46.1 | 368 | 0.25 | 310 | 0.77 | 2.18 | |
| RF8 | R | 85 | 178 | CF | 0.50 | 1.42 | 100.0 | 44.9 | 368 | 0.25 | 368 | 0.45 | 2.67 | |
| RF9 | R | 85 | 178 | CF | 0.50 | 1.61 | 100.0 | 47.5 | 368 | 0.25 | 368 | 0.25 | 2.63 | |
| RF10 | R | 85 | 178 | CF | 0.50 | 0.84 | 100.0 | 49.1 | 339 | 0.48 | 310 | 1.34 | 2.74 | |
| LF6 | R | 85 | 178 | CF | 0.50 | 1.59 | 100.0 | 48.4 | 339 | 0.48 | – | – | 2.46 | |
| LF7 | R | 85 | 178 | CF | 0.50 | 0.95 | 100.0 | 48.2 | 310 | 1.15 | – | – | 2.76 | |
| LF8 | R | 85 | 85 | CF | 0.50 | 1.06 | 100.0 | 48.2 | 310 | 1.61 | – | – | 1.02 | |
| LF9 | R | 85 | 145 | CF | 0.50 | 1.42 | 100.0 | 44.9 | 310 | 0.94 | – | – | 1.83 | |
| [57] | A-0.5 | R | 300 | 300 | PIW | 0.50 | 0.50 | 37.6 | 25.8 | 380 | 0.70 | 380 | 0.79 | 27.34 |
| A-1.0 | R | 300 | 300 | PIW | 0.50 | 1.00 | 37.6 | 21.4 | 380 | 0.70 | 380 | 0.79 | 29.01 | |
| A-1.5 | R | 300 | 300 | PIW | 0.50 | 1.50 | 37.6 | 28.0 | 380 | 0.70 | 380 | 0.79 | 34.67 | |
| B-1.0 | R | 300 | 300 | PIW | 0.50 | 1.00 | 37.6 | 21.4 | 380 | 1.05 | 380 | 1.18 | 36.46 | |
| C-1.0 | R | 300 | 300 | PIW | 0.50 | 1.00 | 37.6 | 21.4 | 380 | 1.40 | 380 | 1.57 | 40.86 | |
| [74] | B2 | R | 100 | 200 | HF | 0.50 | 0.60 | 75.2 | 31.2 | 250 | 1.57 | 250 | 0.00 | 1.41 |
| B3 | R | 100 | 200 | HF | 0.50 | 1.20 | 75.2 | 40.1 | 250 | 1.57 | 250 | 0.00 | 1.74 | |
| B5 | R | 100 | 200 | HF | 0.50 | 0.60 | 75.2 | 38.9 | 250 | 1.57 | 250 | 0.35 | 2.29 | |
| B6 | R | 100 | 200 | HF | 0.50 | 1.20 | 75.2 | 35.6 | 250 | 1.57 | 250 | 0.35 | 2.84 | |
| [58] | R40C-F1 | R | 100 | 200 | PIW | 0.50 | 0.30 | 75.1 | 40.1 | 500 | 1.01 | 500 | 1.68 | 5.56 |
| R40C-F2 | R | 100 | 200 | PIW | 0.50 | 0.60 | 75.1 | 41.1 | 500 | 1.01 | 500 | 1.68 | 5.69 | |
| R40C-F3 | R | 100 | 200 | PIW | 0.50 | 0.90 | 75.1 | 42.0 | 500 | 1.01 | 500 | 1.68 | 5.73 | |
| R40C-F4 | R | 100 | 200 | PIW | 0.50 | 1.20 | 75.1 | 43.3 | 500 | 1.01 | 500 | 1.68 | 5.82 | |
| R40L-F1 | R | 100 | 200 | PIW | 0.50 | 0.30 | 75.1 | 41.3 | 500 | 1.57 | 500 | 0.85 | 4.11 | |
| R40L-F2 | R | 100 | 200 | PIW | 0.50 | 0.60 | 75.1 | 42.2 | 500 | 1.57 | 500 | 0.85 | 4.19 | |
| R40L-F3 | R | 100 | 200 | PIW | 0.50 | 0.90 | 75.1 | 43.4 | 500 | 1.57 | 500 | 0.85 | 4.23 | |
| R40L-F4 | R | 100 | 200 | PIW | 0.50 | 1.20 | 75.1 | 44.1 | 500 | 1.57 | 500 | 0.85 | 4.23 | |
| R40T-F1 | R | 100 | 200 | PIW | 0.50 | 0.30 | 75.1 | 41.5 | 500 | 0.57 | 500 | 1.51 | 3.85 | |
| R40T-F2 | R | 100 | 200 | PIW | 0.50 | 0.60 | 75.1 | 42.8 | 500 | 0.57 | 500 | 1.51 | 3.93 | |
| R40T-F3 | R | 100 | 200 | PIW | 0.50 | 0.90 | 75.1 | 43.1 | 500 | 0.57 | 500 | 1.51 | 3.98 | |
| R40T-F4 | R | 100 | 200 | PIW | 0.50 | 1.20 | 75.1 | 43.9 | 500 | 0.57 | 500 | 1.51 | 4.02 | |
| [83] | RL-F1 | R | 100 | 200 | PIW | 0.50 | 0.30 | 75.1 | 35.2 | 500 | 1.57 | 500 | 0.02 | 2.01 |
| RL-F2 | R | 100 | 200 | PIW | 0.50 | 0.60 | 75.1 | 37.0 | 500 | 1.57 | 500 | 0.02 | 2.27 | |
| RL-F3 | R | 100 | 200 | PIW | 0.50 | 0.90 | 75.1 | 37.7 | 500 | 1.57 | 500 | 0.02 | 2.61 | |
| RL-F4 | R | 100 | 200 | PIW | 0.50 | 1.20 | 75.1 | 38.4 | 500 | 1.57 | 500 | 0.02 | 2.82 | |
| RT-F1 | R | 100 | 200 | PIW | 0.50 | 0.30 | 75.1 | 33.9 | 500 | 0.14 | 500 | 2.51 | 1.75 | |
| RT-F2 | R | 100 | 200 | PIW | 0.50 | 0.60 | 75.1 | 34.4 | 500 | 0.14 | 500 | 2.51 | 2.31 | |
| RT-F3 | R | 100 | 200 | PIW | 0.50 | 0.90 | 75.1 | 35.0 | 500 | 0.14 | 500 | 2.51 | 2.57 | |
| RT-F4 | R | 100 | 200 | PIW | 0.50 | 1.20 | 75.1 | 35.3 | 500 | 0.14 | 500 | 2.51 | 2.69 | |
| [50] | RL1 | R | 100 | 200 | HF | 0.50 | 1.00 | 37.5 | 17.0 | 415 | 1.57 | – | – | 2.41 |
| RL3 | R | 100 | 200 | HF | 0.50 | 3.00 | 37.5 | 16.4 | 415 | 1.57 | – | – | 2.73 | |
| RR1 | R | 100 | 200 | HF | 0.50 | 1.00 | 37.5 | 19.0 | 415 | 1.57 | 344 | 0.75 | 2.73 | |
| RR3 | R | 100 | 200 | HF | 0.50 | 3.00 | 37.5 | 16.9 | 415 | 1.57 | 344 | 0.75 | 3.15 | |
| [84] | R50C-FI | R | 100 | 200 | PIW | 0.50 | 0.30 | 75.1 | 51.0 | 432 | 1.57 | 432 | 1.51 | 6.67 |
| R50C-F2 | R | 100 | 200 | PIW | 0.50 | 0.60 | 75.1 | 51.8 | 432 | 1.57 | 432 | 1.51 | 6.76 | |
| R50C-F3 | R | 100 | 200 | PIW | 0.50 | 0.90 | 75.1 | 52.5 | 432 | 1.57 | 432 | 1.51 | 6.84 | |
| R50C-F4 | R | 100 | 200 | PIW | 0.50 | 1.20 | 75.1 | 53.9 | 432 | 1.57 | 432 | 1.51 | 6.93 | |
| R50L-F1 | R | 100 | 200 | PIW | 0.50 | 0.30 | 75.1 | 51.1 | 432 | 1.57 | 432 | 0.80 | 5.22 | |
| R50L-F2 | R | 100 | 200 | PIW | 0.50 | 0.60 | 75.1 | 52.1 | 432 | 1.57 | 432 | 0.80 | 5.30 | |
| R50L-F3 | R | 100 | 200 | PIW | 0.50 | 0.90 | 75.1 | 53.4 | 432 | 1.57 | 432 | 0.80 | 5.39 | |
| R50L-F4 | R | 100 | 200 | PIW | 0.50 | 1.20 | 75.1 | 54.1 | 432 | 1.57 | 432 | 0.80 | 5.47 | |
| R50T-FI | R | 100 | 200 | PIW | 0.50 | 0.30 | 75.1 | 52.6 | 432 | 0.57 | 432 | 1.51 | 5.77 | |
| R50T-F2 | R | 100 | 200 | PIW | 0.50 | 0.60 | 75.1 | 53.2 | 432 | 0.57 | 432 | 1.51 | 5.82 | |
| R50T-F3 | R | 100 | 200 | PIW | 0.50 | 0.90 | 75.1 | 54.1 | 432 | 0.57 | 432 | 1.51 | 5.90 | |
| R50T-F4 | R | 100 | 200 | PIW | 0.50 | 1.20 | 75.1 | 55.5 | 432 | 0.57 | 432 | 1.51 | 5.99 | |
| [76] | L08F40V3 | R | 150 | 200 | HF | 0.50 | 0.30 | 40.0 | 33.4 | 460 | 0.67 | 460 | 0.55 | 4.58 |
| L08F40V6 | R | 150 | 200 | HF | 0.50 | 0.60 | 40.0 | 31.3 | 460 | 0.67 | 460 | 0.55 | 5.68 | |
| L08F55V3 | R | 150 | 200 | HF | 0.50 | 0.30 | 54.5 | 31.0 | 460 | 0.67 | 460 | 0.55 | 4.94 | |
| L08F55V6 | R | 150 | 200 | HF | 0.50 | 0.60 | 54.5 | 30.9 | 460 | 0.67 | 460 | 0.55 | 5.87 | |
| L08F67V3 | R | 150 | 200 | HF | 0.50 | 0.30 | 66.7 | 32.7 | 460 | 0.67 | 460 | 0.55 | 4.92 | |
| L08F67V6 | R | 150 | 200 | HF | 0.50 | 0.60 | 66.7 | 29.5 | 460 | 0.67 | 460 | 0.55 | 5.88 | |
| L08F80V3 | R | 150 | 200 | HF | 0.50 | 0.30 | 80.0 | 31.9 | 460 | 0.67 | 460 | 0.55 | 4.85 | |
| L08F80V6 | R | 150 | 200 | HF | 0.50 | 0.60 | 80.0 | 30.0 | 460 | 0.67 | 460 | 0.55 | 5.49 | |
| L12F40V3 | R | 150 | 200 | HF | 0.50 | 0.30 | 40.0 | 31.7 | 460 | 1.51 | 460 | 0.55 | 6.01 | |
| L12F80V3 | R | 150 | 200 | HF | 0.50 | 0.30 | 80.0 | 31.6 | 460 | 1.51 | 460 | 0.55 | 6.25 | |
| Minimum value | 85 | 85 | - | 0.50 | 0.30 | 37.5 | 16.4 | 250 | 0.14 | 250 | 0.00 | 1.02 | ||
| Maximum value | 300 | 310 | - | 1.00 | 3.00 | 100 | 55.5 | 500 | 1.61 | 500 | 2.51 | 40.86 | ||
References
- Mansur, M.A.; Chin, M.S.; Wee, T.H. Stress-strain relationship of high-strength fiber concrete in compression. J. Mater. Civ. Eng. 1999, 11, 21–29. [Google Scholar] [CrossRef]
- Nataraja, M.C.; Dhang, N.; Gupta, A.P. Stress–strain curves for steel-fiber reinforced concrete under compression. Cem. Concr. Compos. 1999, 21, 383–390. [Google Scholar] [CrossRef]
- Bencardino, F.; Rizzuti, L.; Spadea, G.; Swamy, R.N. Stress-strain behavior of steel fiber-reinforced concrete in compression. J. Mater. Civ. Eng. 2008, 20, 255–263. [Google Scholar] [CrossRef]
- Tran, N.P.; Gunasekara, C.; Law, D.W.; Houshyar, S.; Setunge, S.; Cwirzen, A. Comprehensive review on sustainable fiber reinforced concrete incorporating recycled textile waste. J. Sustain. Cem. Based Mater. 2021, 1–12. [Google Scholar] [CrossRef]
- Rizzuti, L.; Bencardino, F. Effects of fibre volume fraction on the compressive and flexural experimental behaviour of SFRC. Contemp. Eng. Sci. 2014, 7, 379–390. [Google Scholar] [CrossRef]
- Lee, S.-C.; Oh, J.-H.; Cho, J.-Y. Compressive behavior of fiber-reinforced concrete with end-hooked steel fibers. Materials 2015, 8, 1442–1458. [Google Scholar] [CrossRef] [PubMed] [Green Version]
- Bencardino, F.; Rizzuti, L.; Spadea, G.; Swamy, R.N. Implications of test methodology on post-cracking and fracture behaviour of steel fibre reinforced concrete. Compos. Part B Eng. 2013, 46, 31–38. [Google Scholar] [CrossRef]
- Kytinou, V.K.; Chalioris, C.E.; Karayannis, C.G. Analysis of residual flexural stiffness of steel fiber-reinforced concrete beams with steel reinforcement. Materials 2020, 13, 2698. [Google Scholar] [CrossRef]
- Kytinou, V.K.; Chalioris, C.E.; Karayannis, C.G.; Elenas, A. Effect of steel fibers on the hysteretic performance of concrete beams with steel reinforcement—Tests and analysis. Materials 2020, 13, 2923. [Google Scholar] [CrossRef]
- Meskenas, A.; Kaklauskas, G.; Daniunas, A.; Bacinskas, D.; Jakubovskis, R.; Gribniak, V.; Gelazius, V. Determination of the stress-crack opening relationship of SFRC by an inverse analysis. Mech. Compos. Mater. 2014, 49, 685–690. [Google Scholar] [CrossRef]
- Morelli, F.; Amico, C.; Salvatore, W.; Squeglia, N.; Stacul, S. Influence of tension stiffening on the flexural stiffness of reinforced concrete circular sections. Materials 2017, 10, 669. [Google Scholar] [CrossRef] [Green Version]
- Gribniak, V.; Arnautov, A.K.; Norkus, A.; Kliukas, R.; Tamulenas, V.; Gudonis, E.; Sokolov, A.V. Steel fibers: Effective way to prevent failure of the concrete bonded with FRP sheets. Adv. Mater. Sci. Eng. 2016, 2016, 4913536. [Google Scholar] [CrossRef] [Green Version]
- Gribniak, V.; Tamulenas, V.; Ng, P.-L.; Arnautov, A.K.; Gudonis, E.; Misiunaite, I. Mechanical behavior of steel fiber-reinforced concrete beams bonded with external carbon fiber sheets. Materials 2017, 10, 666. [Google Scholar] [CrossRef] [Green Version]
- Gribniak, V.; Ng, P.-L.; Tamulenas, V.; Misiunaite, I.; Norkus, A.; Šapalas, A. Strengthening of fibre reinforced concrete elements: Synergy of the fibres and external sheet. Sustainability 2019, 11, 4456. [Google Scholar] [CrossRef] [Green Version]
- Smarzewski, P. Analysis of failure mechanics in hybrid fibre-reinforced high-performance concrete deep beams with and without openings. Materials 2019, 12, 101. [Google Scholar] [CrossRef] [PubMed] [Green Version]
- Smarzewski, P. Effect of curing period on properties of steel and polypropylene fiber reinforced ultra-high performance concrete. Mater. Sci. Eng. 2017, 245, 032059. [Google Scholar]
- Smarzewski, P. Study of toughness and macro/micro-crack development of fibre-reinforced ultra-high performance concrete after exposure to elevated temperature. Materials 2019, 12, 1210. [Google Scholar] [CrossRef] [PubMed] [Green Version]
- Hsu TTC. Torsion of Reinforced Concrete; Van Nostrand Reinhold: New York, NY, USA, 1984. [Google Scholar]
- Karayannis, C.G. Torsional damage of concrete beams with softening behaviour. Theor. Appl. Fract. Mech. 1995, 22, 63–70. [Google Scholar] [CrossRef]
- Gribniak, V.; Kaklauskas, G.; Hung Kwan, A.K.; Bacinskas, D.; Ulbinas, D. Deriving stress–strain relationships for steel fibre concrete in tension from tests of beams with ordinary reinforcement. Eng. Struct. 2012, 42, 387–395. [Google Scholar] [CrossRef]
- Albitar, M.; Mohamed Ali, M.S.; Visintin, P. Evaluation of tension-stiffening, crack spacing and crack width of geopolymer concretes. Constr. Build. Mater. 2018, 160, 408–414. [Google Scholar] [CrossRef]
- Ceroni, F.; Pecce, M.; Matthys, S. Tension stiffening of reinforced concrete ties strengthened with externally bonded fiber-reinforced polymer sheets. J. Compos. Constr. 2004, 8, 22–32. [Google Scholar] [CrossRef]
- Adebar, P.; Mindess, S.; Pierre, D.S.; Olund, B. Shear tests of fiber concrete beams without stirrups. ACI Struct. J. 1997, 94. [Google Scholar] [CrossRef]
- Chalioris, C.E. Analytical approach for the evaluation of minimum fibre factor required for steel fibrous concrete beams under combined shear and flexure. Constr. Build. Mater. 2013, 43, 317–336. [Google Scholar] [CrossRef]
- Kwak, Y.-K.; Eberhard, M.O.; Kim, W.-S.; Kim, J. Shear strength of steel fiber-reinforced concrete beams without stirrups. ACI Struct. J. 2002, 99, 530–538. [Google Scholar]
- Abambres, M.; Lantsoght, E.O.L. ANN-based shear capacity of steel fiber-reinforced concrete beams without stirrups. Fibers 2019, 7, 88. [Google Scholar] [CrossRef] [Green Version]
- Torres, J.A.; Lantsoght, E.O.L. Influence of fiber content on shear capacity of steel fiber-reinforced concrete beams. Fibers 2019, 7, 102. [Google Scholar] [CrossRef] [Green Version]
- Lantsoght, E.O.L. Database of shear experiments on steel fiber reinforced concrete beams without stirrups. Materials 2019, 12, 917. [Google Scholar] [CrossRef] [PubMed] [Green Version]
- Li, C.; Zhao, M.; Zhang, X.; Li, J.; Li, X.; Zhao, M. Effect of steel fiber content on shear behavior of reinforced expanded-shale lightweight concrete beams with stirrups. Materials 2021, 14, 1107. [Google Scholar] [CrossRef] [PubMed]
- Smarzewski, P. Hybrid fibres as shear reinforcement in high-performance concrete beams with and without openings. Appl. Sci. 2018, 8, 2070. [Google Scholar] [CrossRef] [Green Version]
- Chalioris, C.E.; Sfiri, E.F. Shear performance of steel fibrous concrete beams. Procedia Eng. 2011, 14, 2064–2068. [Google Scholar] [CrossRef] [Green Version]
- Lim, T.Y.; Paramasivam, P.; Lee, S.L. Shear and moment capacity of reinforced steel-fibre-concrete beams. Mag. Concr. Res. 1987, 39, 148–160. [Google Scholar] [CrossRef]
- Smarzewski, P. Flexural toughness of high-performance concrete with basalt and polypropylene short fibres. Adv. Civ. Eng. 2018, 2018, 5024353. [Google Scholar] [CrossRef] [Green Version]
- Chalioris, C.E.; Kosmidou, P.-M.K.; Karayannis, C.G. Cyclic response of steel fiber reinforced concrete slender beams: An experimental study. Materials 2019, 12, 1398. [Google Scholar] [CrossRef] [Green Version]
- Ju, H.; Kim, K.S.; Lee, D.H.; Hwang, J.-H.; Choi, S.-H.; Oh, Y.-H. Torsional responses of steel fiber-reinforced concrete members. Compos. Struct. 2015, 129, 143–156. [Google Scholar] [CrossRef]
- Deifalla, A.; Ghobarah, A. Behavior and analysis of inverted T-shaped RC beams under shear and torsion. Eng. Struct. 2014, 68, 57–70. [Google Scholar] [CrossRef]
- Deifalla, A.; Hamed, M.; Saleh, A.; Ali, T. Exploring GFRP bars as reinforcement for rectangular and L-shaped beams subjected to significant torsion: An experimental study. Eng. Struct. 2014, 59, 776–786. [Google Scholar] [CrossRef]
- Deifalla, A.; Awad, A.; Elgarhy, M. Effectiveness of externally bonded CFRP strips for strengthening flanged beams under torsion: An experimental study. Eng. Struct. 2013, 56, 2065–2075. [Google Scholar] [CrossRef]
- Deifalla, A.; Ghobarah, A. Strengthening RC T-beams subjected to combined torsion and shear using FRP fabrics: Experimental study. J. Compos. Constr. 2010, 14, 301–311. [Google Scholar] [CrossRef]
- Deifalla, A.; Awad, A.; Seleem, H.; Abdelrahman, A. Investigating the behavior of lightweight foamed concrete T-beams under torsion, shear, and flexure. Eng. Struct. 2020, 219, 110741. [Google Scholar] [CrossRef]
- Lau, C.K.; Htut, T.N.S.; Melling, J.J.; Chegenizadeh, A.; Ng, T.S. Torsional behaviour of steel fibre reinforced alkali activated concrete. Materials 2020, 13, 3423. [Google Scholar] [CrossRef]
- Deifalla, A. Torsion design of lightweight concrete beams without or with fibers: A comparative study and a refined cracking torque formula. Structures 2020, 28, 786–802. [Google Scholar] [CrossRef]
- Deifalla, A. Refining the torsion design of fibered concrete beams reinforced with FRP using multi-variable non-linear regression analysis for experimental results. Eng. Struct. 2021, 226, 111394. [Google Scholar] [CrossRef]
- Narayanan, R.; Kareem-Palanjian, A.S. Torsion in beams reinforced with bars and fibers. J. Struct. Eng. 1986, 112, 53–66. [Google Scholar] [CrossRef]
- Facconi, L.; Minelli, F.; Plizzari, G.; Ceresa, P. Experimental study on steel fiber reinforced concrete beams in pure torsion. In Proceedings of the Fib Symposium in Krakow, Krakow, Poland, 27–29 May 2019; pp. 27–29. [Google Scholar]
- Mansur, M.A.; Paramasivam, P. Steel fibre reinforced concrete beams in pure torsion. Int. J. Cem. Compos. Lightweight Concr. 1982, 4, 39–45. [Google Scholar] [CrossRef]
- Patil, S.P.; Sangle, K.K. Tests of steel fibre reinforced concrete beams under predominant torsion. J. Build. Eng. 2016, 6, 157–162. [Google Scholar] [CrossRef]
- Campione, G.; Letizia Mangiavillano, M. Fibrous reinforced concrete beams in flexure: Experimental investigation, analytical modelling and design considerations. Eng. Struct. 2008, 30, 2970–2980. [Google Scholar] [CrossRef]
- Campione, G. Analytical prediction of load deflection curves of external steel fibers R/C beam–column joints under monotonic loading. Eng. Struct. 2015, 83, 86–98. [Google Scholar] [CrossRef]
- Chalioris, C.E.; Karayannis, C.G. Effectiveness of the use of steel fibres on the torsional behaviour of flanged concrete beams. Cem. Concr. Compos. 2009, 31, 331–341. [Google Scholar] [CrossRef]
- Ju, H.; Lee, D.H.; Kim, K.S. Minimum torsional reinforcement ratio for reinforced concrete members with steel fibers. Compos. Struct. 2019, 207, 460–470. [Google Scholar] [CrossRef]
- Facconi, L.; Minelli, F.; Ceresa, P.; Plizzari, G. Steel fibers for replacing minimum reinforcement in beams under torsion. Mater. Struct. 2021, 54, 34. [Google Scholar] [CrossRef]
- De Domenico, D. Torsional Strength of RC Members Using a Plasticity-Based Variable-Angle Space Truss Model Accounting for Non-Uniform Longitudinal Reinforcement. Eng. Struct. 2021, 228, 111540. [Google Scholar] [CrossRef]
- Bernardo, L.F.A.; Andrade, J.M.A. A Unified Softened Truss Model for RC and PC Beams under Torsion. J. Build. Eng. 2020, 32, 101467. [Google Scholar] [CrossRef]
- Hsu, T.T. Torsion of structural concrete-plain concrete rectangular sections. ACI Symp. Publ. 1968, 18. [Google Scholar] [CrossRef]
- Bredt, Rud. Kritische Bemerkungen zur Drehungselastizitat. Z. Des Ver. Dtsch. Ing. 1896, 40, 785–790. [Google Scholar]
- Mansur, M.A.; Nagataki, S.; Lee, S.H.; Oosumimoto, Y. Torsional response of reinforced fibrous concrete beams. ACI Struct. J. 1989, 86. [Google Scholar] [CrossRef]
- Rao, T.D.G.; Rama Seshu, D. Analytical model for the torsional response of steel fiber reinforced concrete members under pure torsion. Cem. Concr. Compos. 2005, 27, 493–501. [Google Scholar] [CrossRef]
- Ju, H.; Lee, D.H.; Hwang, J.-H.; Kang, J.-W.; Kim, K.S.; Oh, Y.-H. Torsional behavior model of steel-fiber-reinforced concrete members modifying fixed-angle softened-truss model. Compos. Part B Eng. 2013, 45, 215–231. [Google Scholar] [CrossRef]
- Al-Ta’an, S.; AI-Feel, J. Torsional strength of steel fibrous concrete. In Application of Codes, Design and Regulations, Proceedings of the International Conference Held at the University of Dundee, Scotland, UK, 5–7 July 2005; Thomas Telford Publishing: London, UK, 2005; pp. 693–700. [Google Scholar]
- Ismail, M.; Fehling, E. Analytical model for steel fiber reinforced UHPC beams subjected to torsion. In 53. Forschungskolloquium am 9. und 10. Oktober; Kassel University Press: Kassel, Germany, 2012; pp. 31–37. [Google Scholar]
- Ju, H.; Lee, D.H.; Hwang, J.-H.; Kim, K.S.; Oh, Y.-H. Fixed-angle smeared-truss approach with direct tension force transfer model for torsional behavior of steel fiber-reinforced concrete members. ACT 2013, 11, 215–229. [Google Scholar] [CrossRef] [Green Version]
- Karayannis, C.G. Nonlinear analysis and tests of steel-fiber concrete beams in torsion. Struct. Eng. Mech. 2000, 9, 323–338. [Google Scholar] [CrossRef]
- Zhan, Y.; Meschke, G. Multilevel computational model for failure analysis of steel-fiber–reinforced concrete structures. J. Eng. Mech. 2016, 142, 04016090. [Google Scholar] [CrossRef]
- Hui, L.; López-Almansa, F. New modifying truss model and numerical simulation of steel fiber reinforced concrete under pure torsion. Structures 2018, 14, 32–42. [Google Scholar] [CrossRef]
- Mansur, M.A. Bending–torsion interaction for concrete beams reinforced with steel fibres. Mag. Concr. Res. 1982, 34, 182–190. [Google Scholar] [CrossRef]
- Mansur, M.A.; Paramasivam, P. Fiber reinforced concrete beams in torsion, bending, and shear. ACI J. Proc. 1985, 82. [Google Scholar] [CrossRef]
- Narayanan, R.; Kareem-Palanjian, A.S. Steel fibre reinforced concrete beams in torsion. Int. J. Cem. Compos. Lightweight Concr. 1983, 5, 235–246. [Google Scholar] [CrossRef]
- Craig, R.J.; Dunya, S.; Riaz, J.; Shirazi, H. Torsional behavior of reinforced fibrous concrete beams. ACI Symp. Publ. 1984, 81. [Google Scholar] [CrossRef]
- Sharma, A. Analysis of fiber reinforced concrete beams under combined loadings. Transp. Res. Rec. 1989, 1226, 94–104. [Google Scholar]
- Tegos, I.A. Fiber reinforced concrete beams with circular section in torsion. ACI Struct. J. 1989, 86, 473–482. [Google Scholar] [CrossRef]
- Nanni, A. Design for torsion using steel fiber reinforced concrete. ACI Mater. J. 1990, 87, 556–564. [Google Scholar]
- ACI Committee 318. Building Code Requirements for Reinforced Concrete (ACI 318-89) and Commentary-ACI 318R-89; American Concrete Institute: Detroit, MI, USA, 1989; Chapter 11; pp. 137–180. [Google Scholar]
- El-Niema, E.I. Fiber reinforced concrete beams under torsion. ACI Struct. J. 1993, 90. [Google Scholar] [CrossRef]
- Rao, T.D.G.; Seshu, D.R. Torsion of steel fiber reinforced concrete members. Cem. Concr. Res. 2003, 33, 1783–1788. [Google Scholar] [CrossRef]
- Okay, F.; Engin, S. Torsional behavior of steel fiber reinforced concrete beams. Constr. Build. Mater. 2012, 28, 269–275. [Google Scholar] [CrossRef]
- Amin, A.; Bentz, E.C. Strength of steel fiber reinforced concrete beams in pure torsion. Struct. Concr. 2018, 19, 684–694. [Google Scholar] [CrossRef]
- Narayanan, R.; Kareem-Palanjian, A. A space truss model for fibre-concrete beams in torsion. Struct Eng 1985, 63B, 14–19. [Google Scholar]
- Mansur, M.A.; Lim, T.Y. Torsional behaviour of reinforced fibre concrete beams. Int. J. Cem. Compos. Lightweight Concr. 1985, 7, 261–267. [Google Scholar] [CrossRef]
- Karayannis, C.G.; Chalioris, C.E. Experimental validation of smeared analysis for plain concrete in torsion. J. Struct. Eng. 2000, 126, 646–653. [Google Scholar] [CrossRef]
- Kaushik, S.; Sasturkar, P. Simply supported steel fibre reinforced concrete beams under combined torsion, bending and shear. In Proceedings of the International Conference Held at the University of Wales, College of Cardiff, School of Engineering, Cardiff, UK, 18–20 September 1989; Elsevier Applied Science Publishers Limited; Elsevier Science Publishers: Essex, UK, 1989; pp. 687–698. [Google Scholar]
- Al-Ausi, M.A.; Abdul-Whab, H.M.S.; Khidair, R.M. Effect of fibres on the strength of reinforced concrete beams under combined loading. In Proceedings of the International Conference Held at the University of Wales, College of Cardiff, School of Engineering, Cardiff, UK, 18–20 September 1989; Elsevier Applied Science Publishers Limited; Elsevier Science Publishers: Essex, UK, 1989; pp. 664–675. [Google Scholar]
- Rao, T.D.G.; Seshu, D.R. Torsional response of fibrous reinforced concrete members: Effect of single type of reinforcement. Constr. Build. Mater. 2006, 20, 187–192. [Google Scholar] [CrossRef]
- Rao, G.; Seshu, D.; Warnitchai, P. Effect of steel fibers on the behavior of over-reinforced beams subjected to pure torsion. Civ. Eng. Dimens. 2010, 12, 44–51. [Google Scholar]
- Deifalla, A.; Awad, A.; Seleem, H.; Abdelrahman, A. Experimental and numerical investigation of the behavior of LWFC L-girders under combined torsion. Structures 2020, 26, 362–377. [Google Scholar] [CrossRef]
- Deifalla, A. Design of lightweight concrete slabs under two-way shear without shear reinforcements: A comparative study and a new formula. Eng. Struct. 2020, 222, 111076. [Google Scholar] [CrossRef]
- Deifalla, A. A comparative study and a simplified formula for punching shear design of concrete slabs with or without membrane tensile forces. Structures 2021, 33, 1936–1953. [Google Scholar] [CrossRef]
- Deifalla, A. A strength and deformation model for prestressed lightweight concrete slabs under two-way shear. Adv. Struct. Eng. 2021. [Google Scholar] [CrossRef]
- Nowak, A.S.; Collins, K.R. Reliability of Structures, 2nd ed.; CRC Press: Boka Raton, FL, USA; Taylor and Francis Group: London, UK, 2013; pp. 1–407. [Google Scholar] [CrossRef]


| Value | x | y | β | ρf | lf/df | fcu | T |
|---|---|---|---|---|---|---|---|
| (mm) | (mm) | (%) | (MPa) | (kNm) | |||
| Minimum | 85 | 85 | 0.5 | 0.3 | 37.5 | 14.8 | 0.75 |
| Maximum | 250 | 250 | 1.3 | 6.0 | 156 | 59.0 | 13.58 |
| Average | 153 | 209 | 0.6 | 1.5 | 62.9 | 33.9 | 5.03 |
| Value | x | y | β | ρf | lf/df | fcu | fyl | ρl | fyt | ρt | T |
|---|---|---|---|---|---|---|---|---|---|---|---|
| (mm) | (mm) | (%) | (MPa) | (MPa) | (%) | (MPa) | (%) | (kNm) | |||
| Minimum | 85 | 85 | 0.5 | 0.3 | 37.5 | 16.4 | 250 | 0.14 | 250 | 0.00 | 1.02 |
| Maximum | 300 | 310 | 1.0 | 3.0 | 100 | 55.5 | 500 | 1.61 | 500 | 2.51 | 40.86 |
| Average | 116 | 201 | 0.5 | 0.9 | 74.3 | 37.4 | 411 | 0.99 | 420 | 1.03 | 5.77 |
| Statistical Measures | Existing Model | Modified NKPT Model | Improved ACI Formulation |
|---|---|---|---|
| Maximum | 1.97 | 1.66 | 1.79 |
| Minimum | 0.54 | 0.55 | 0.59 |
| Average | 1.21 | 1.01 | 1.02 |
| Coefficient of variation | 22% | 17% | 19% |
| Lower 95% | 1.17 | 0.98 | 0.99 |
Publisher’s Note: MDPI stays neutral with regard to jurisdictional claims in published maps and institutional affiliations. |
© 2021 by the authors. Licensee MDPI, Basel, Switzerland. This article is an open access article distributed under the terms and conditions of the Creative Commons Attribution (CC BY) license (https://creativecommons.org/licenses/by/4.0/).
Share and Cite
Deifalla, A.F.; Zapris, A.G.; Chalioris, C.E. Multivariable Regression Strength Model for Steel Fiber-Reinforced Concrete Beams under Torsion. Materials 2021, 14, 3889. https://doi.org/10.3390/ma14143889
Deifalla AF, Zapris AG, Chalioris CE. Multivariable Regression Strength Model for Steel Fiber-Reinforced Concrete Beams under Torsion. Materials. 2021; 14(14):3889. https://doi.org/10.3390/ma14143889
Chicago/Turabian StyleDeifalla, Ahmed F., Adamantis G. Zapris, and Constantin E. Chalioris. 2021. "Multivariable Regression Strength Model for Steel Fiber-Reinforced Concrete Beams under Torsion" Materials 14, no. 14: 3889. https://doi.org/10.3390/ma14143889
APA StyleDeifalla, A. F., Zapris, A. G., & Chalioris, C. E. (2021). Multivariable Regression Strength Model for Steel Fiber-Reinforced Concrete Beams under Torsion. Materials, 14(14), 3889. https://doi.org/10.3390/ma14143889