
CO2 Capture by Low-Cost Date Pits-Based Activated Carbon and Silica Gel


Abstract
:1. Introduction
2. Methodology
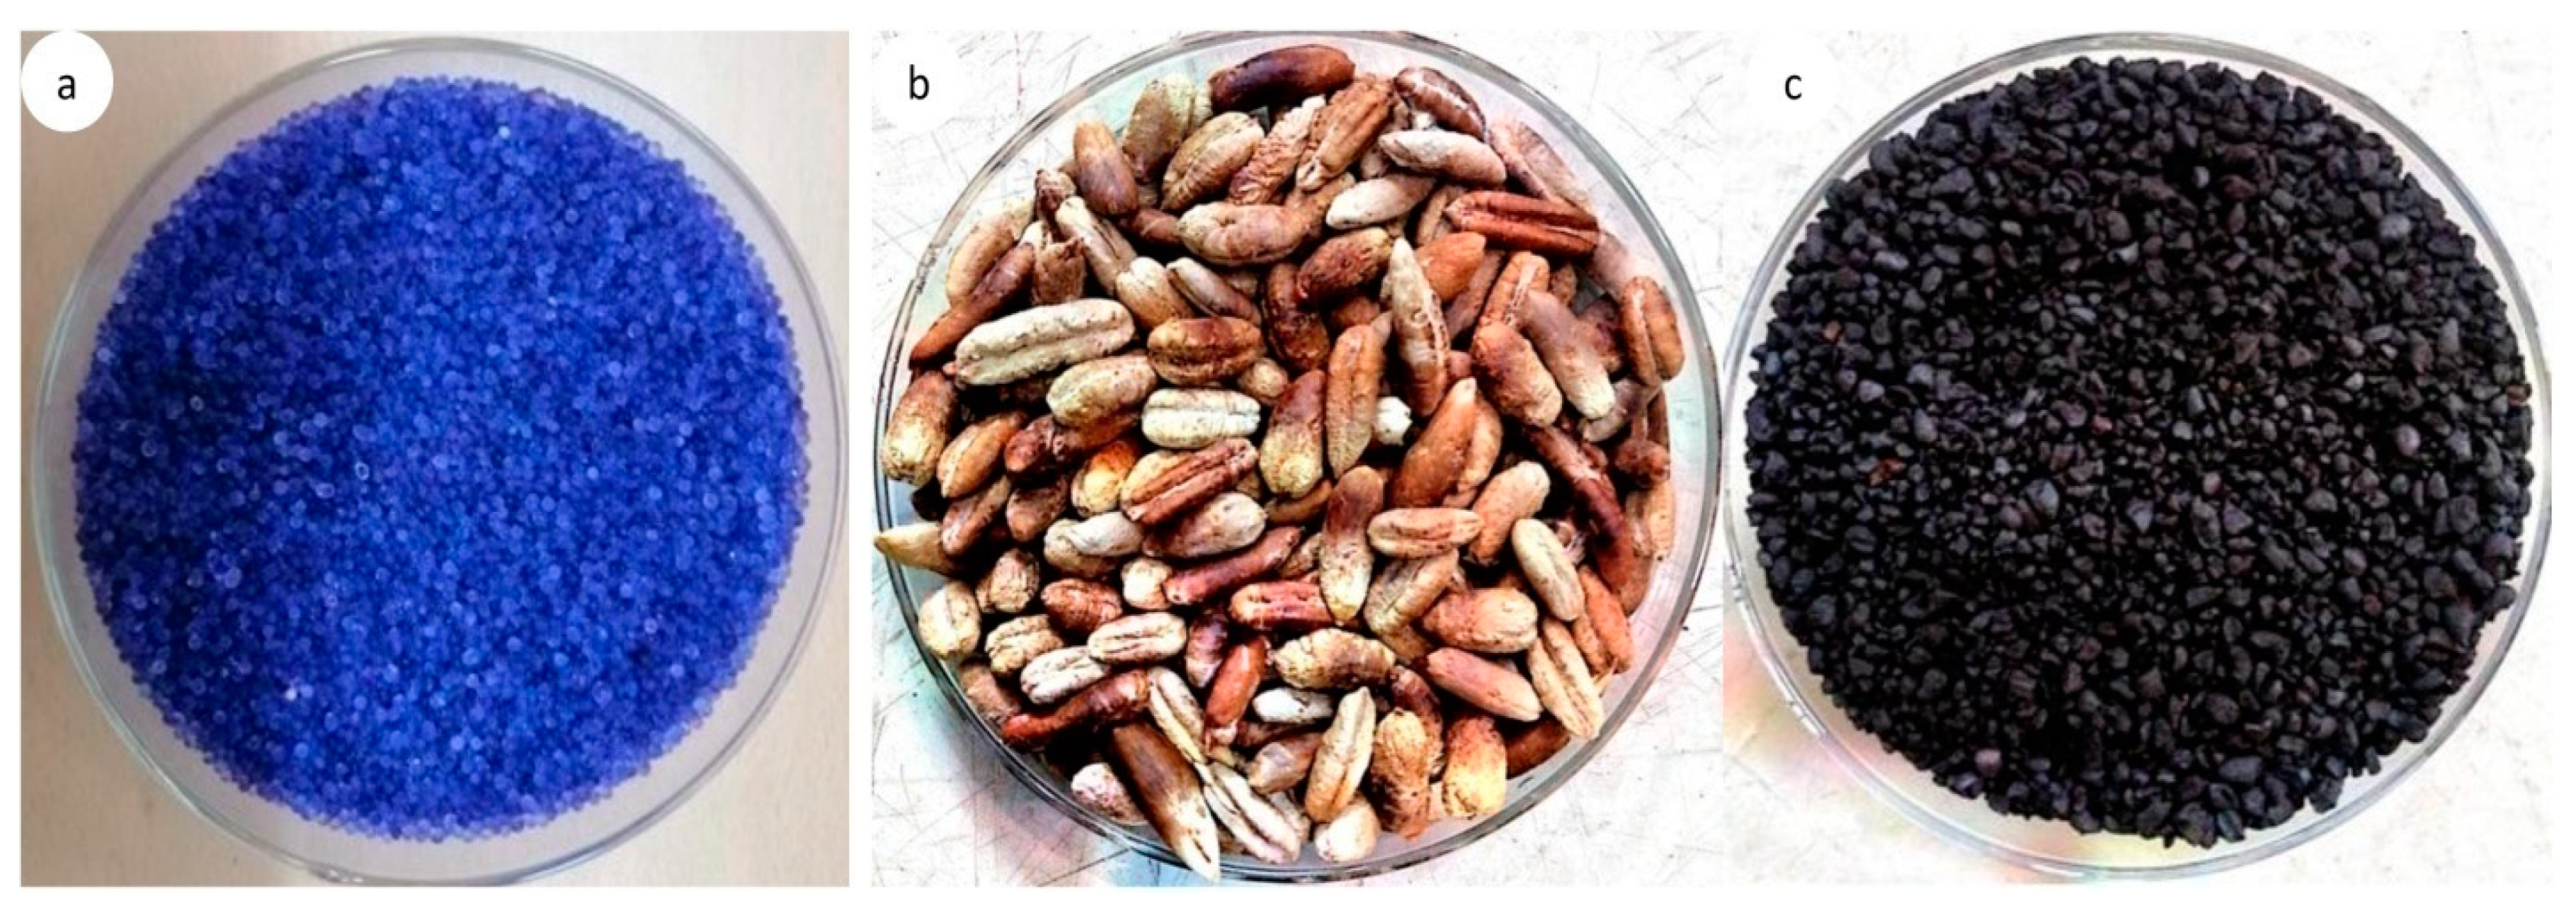
2.1. Materials
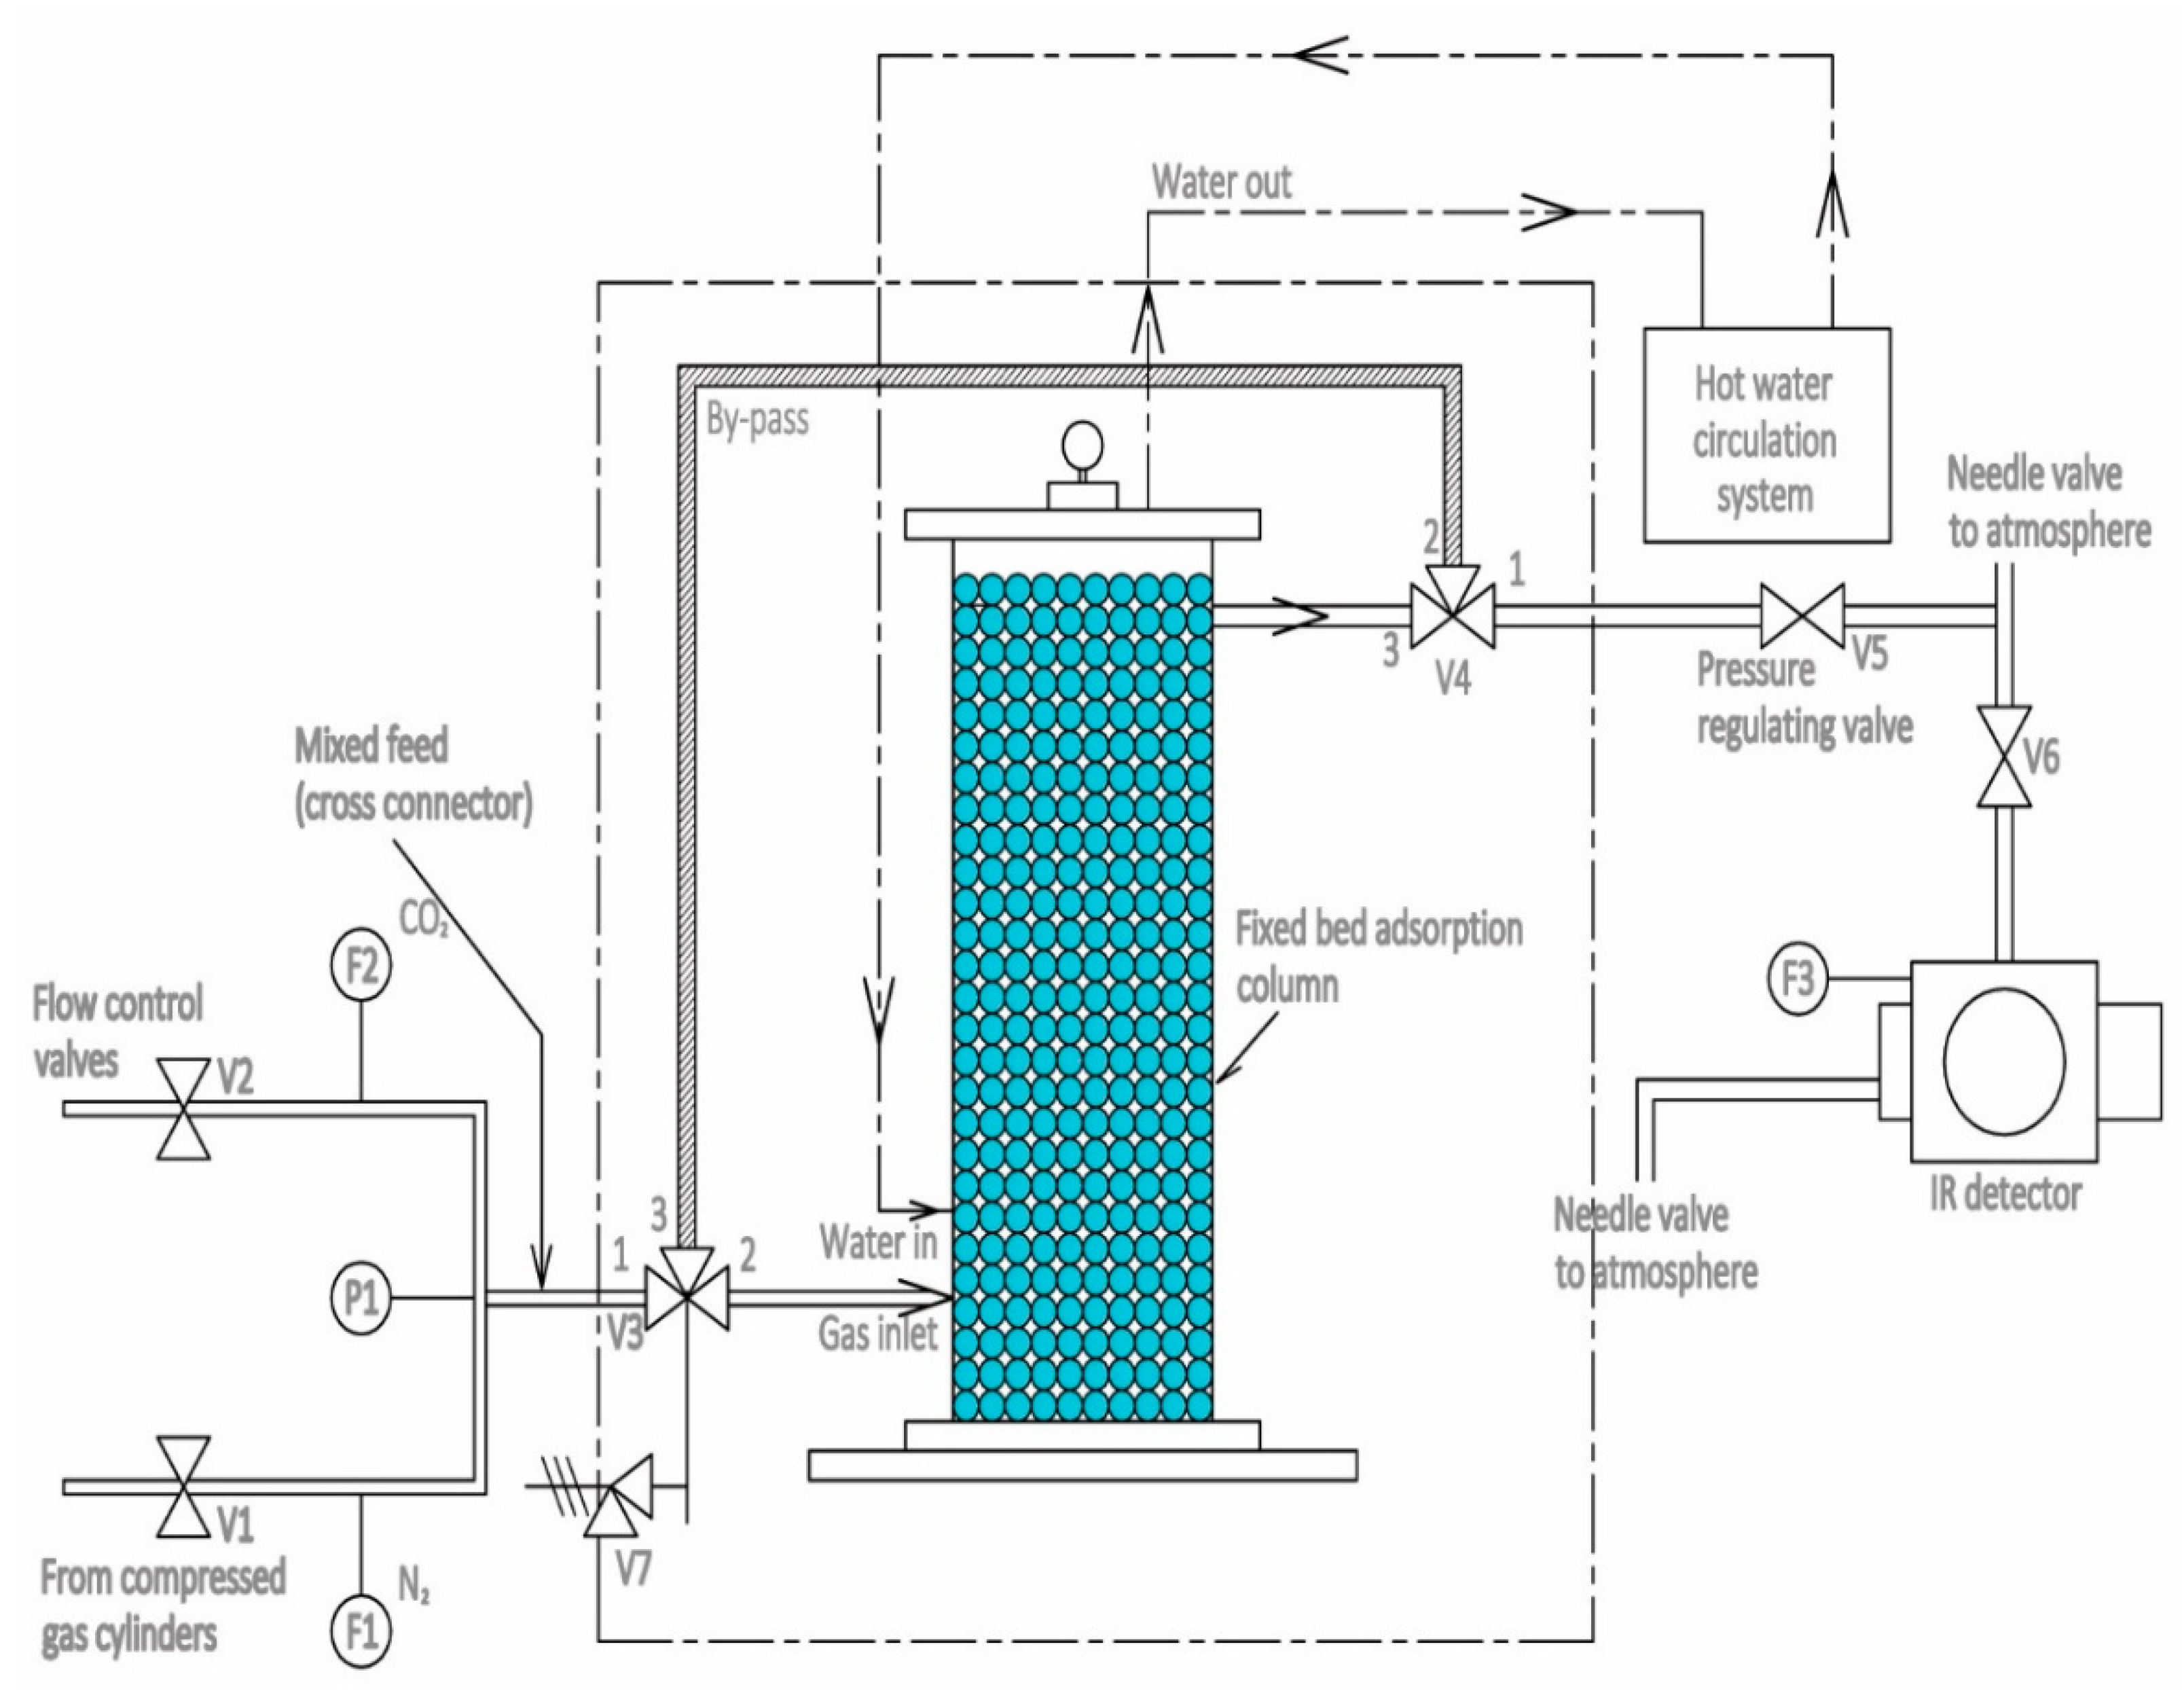
2.2. Experimental Unit
2.3. Procedure
2.4. Physical Activation
2.5. Adsorbent Characterization
3. Results and Discussion
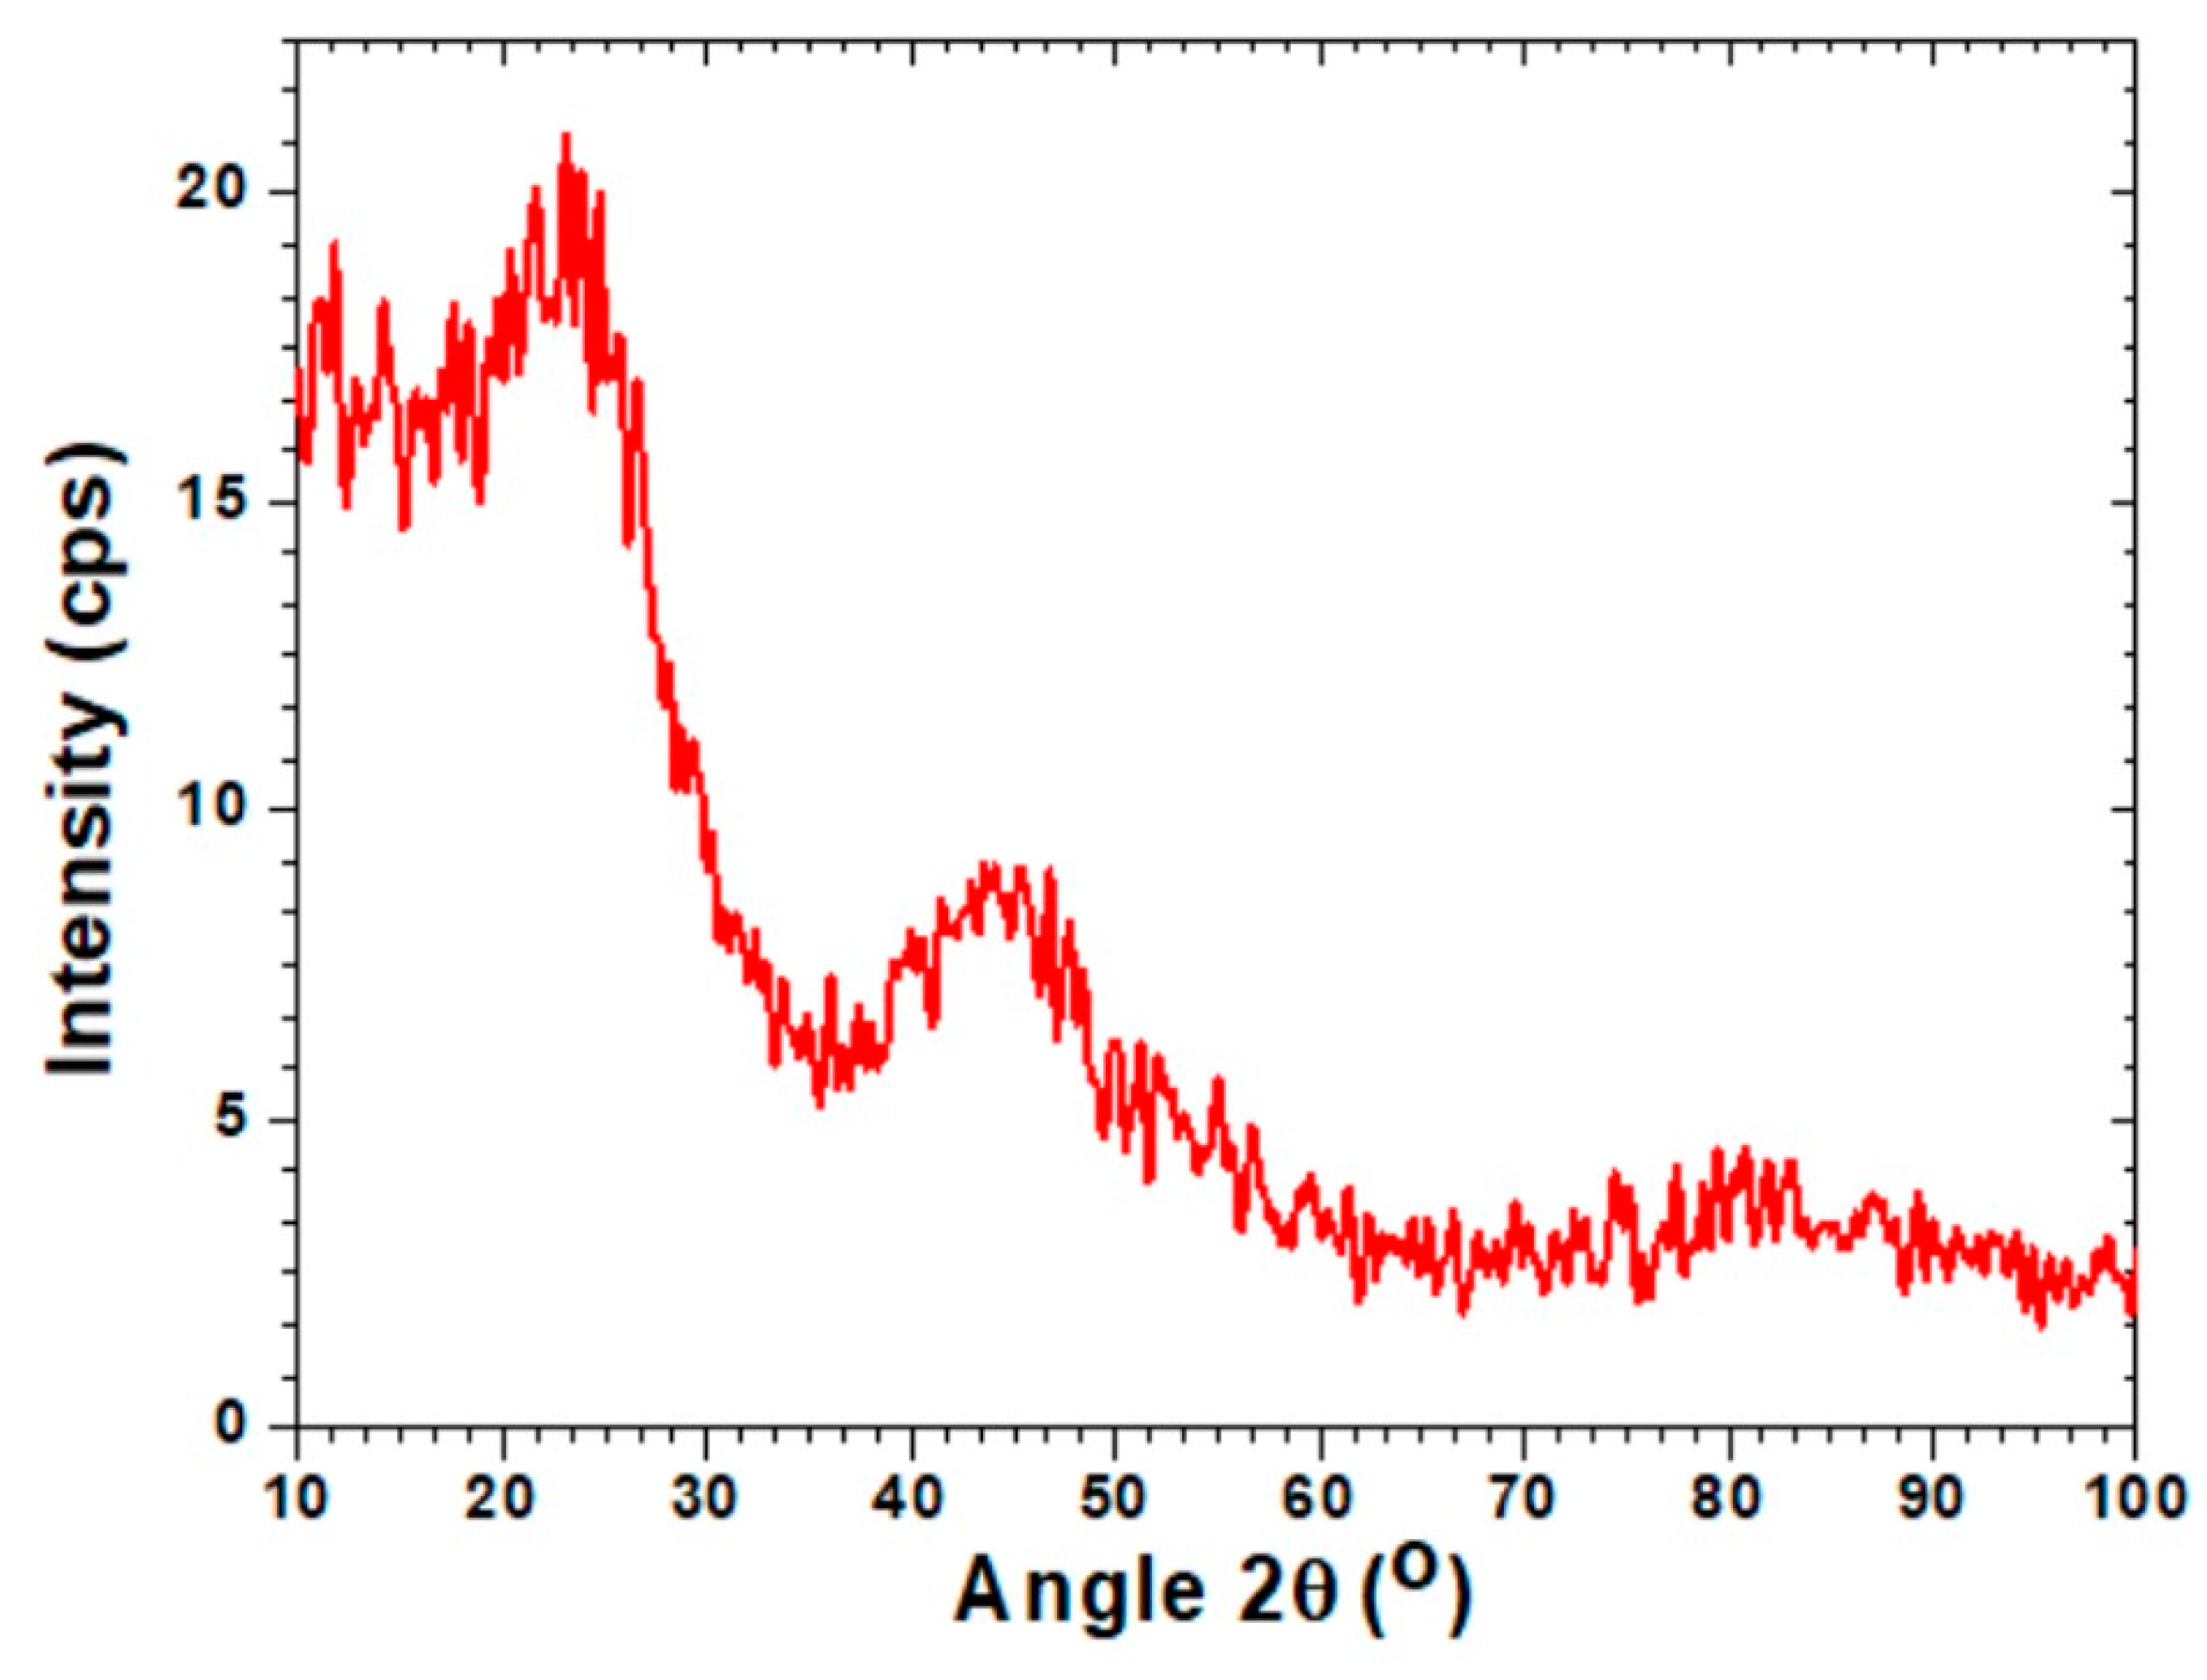
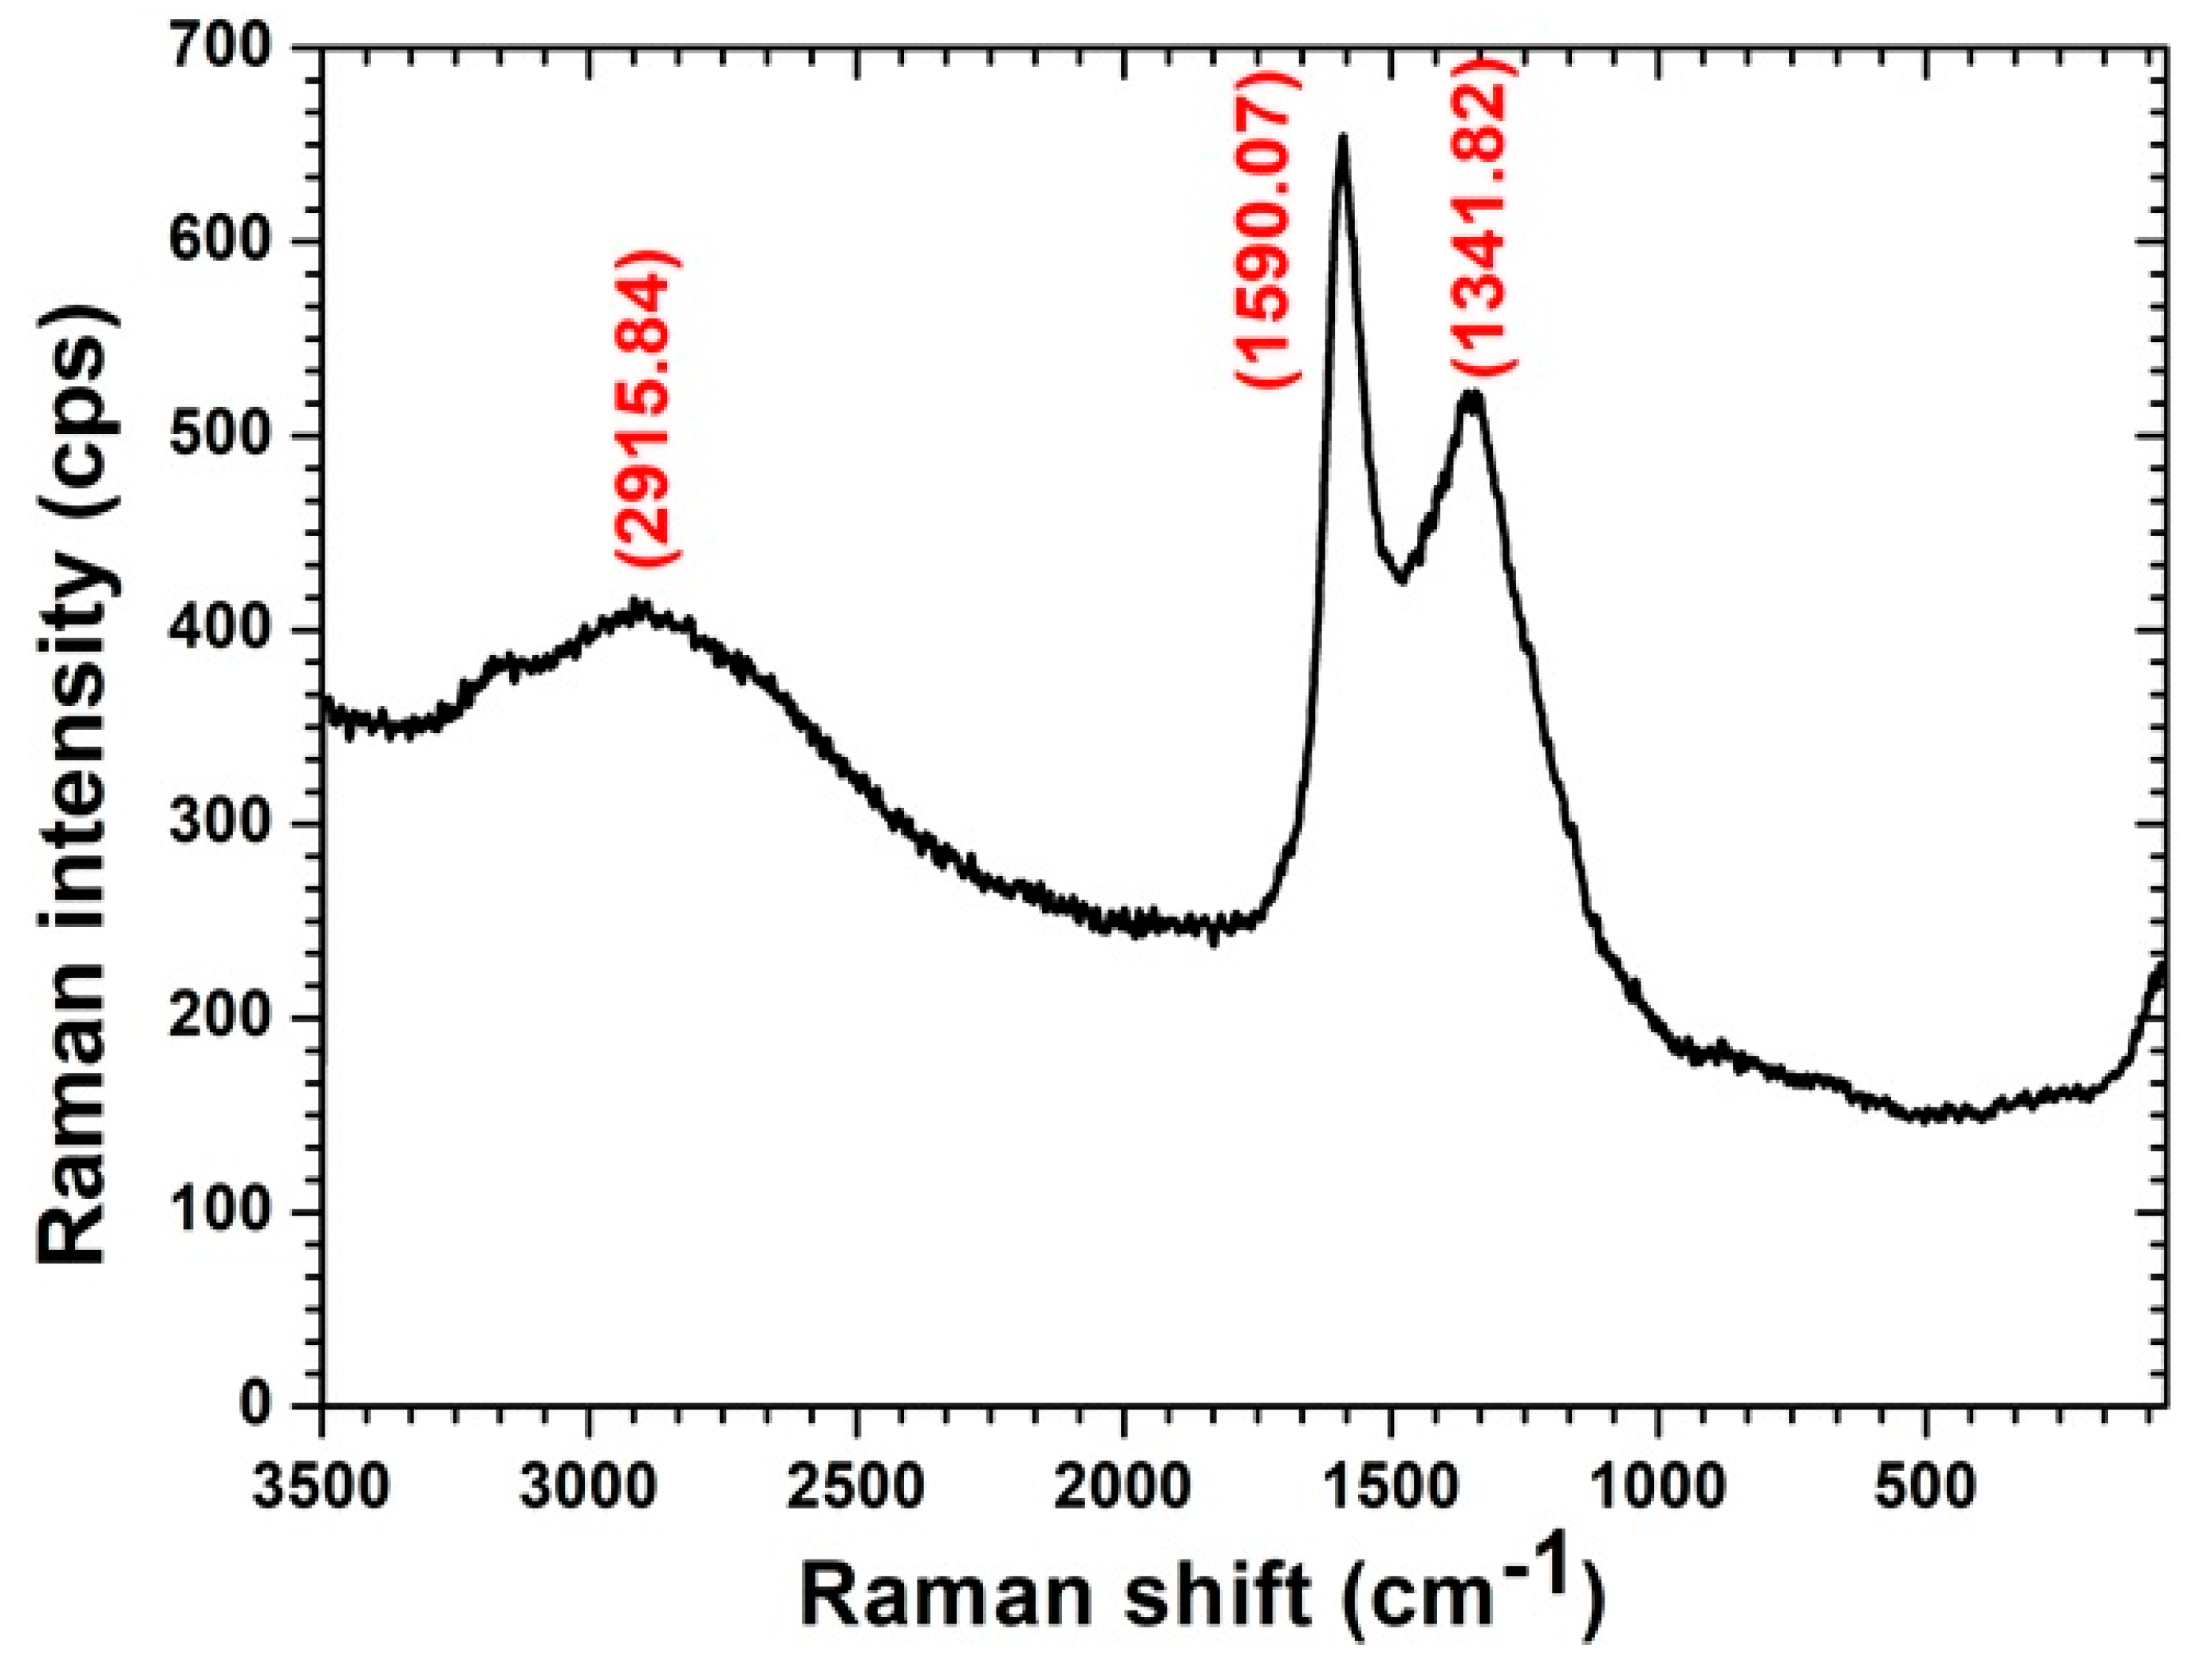
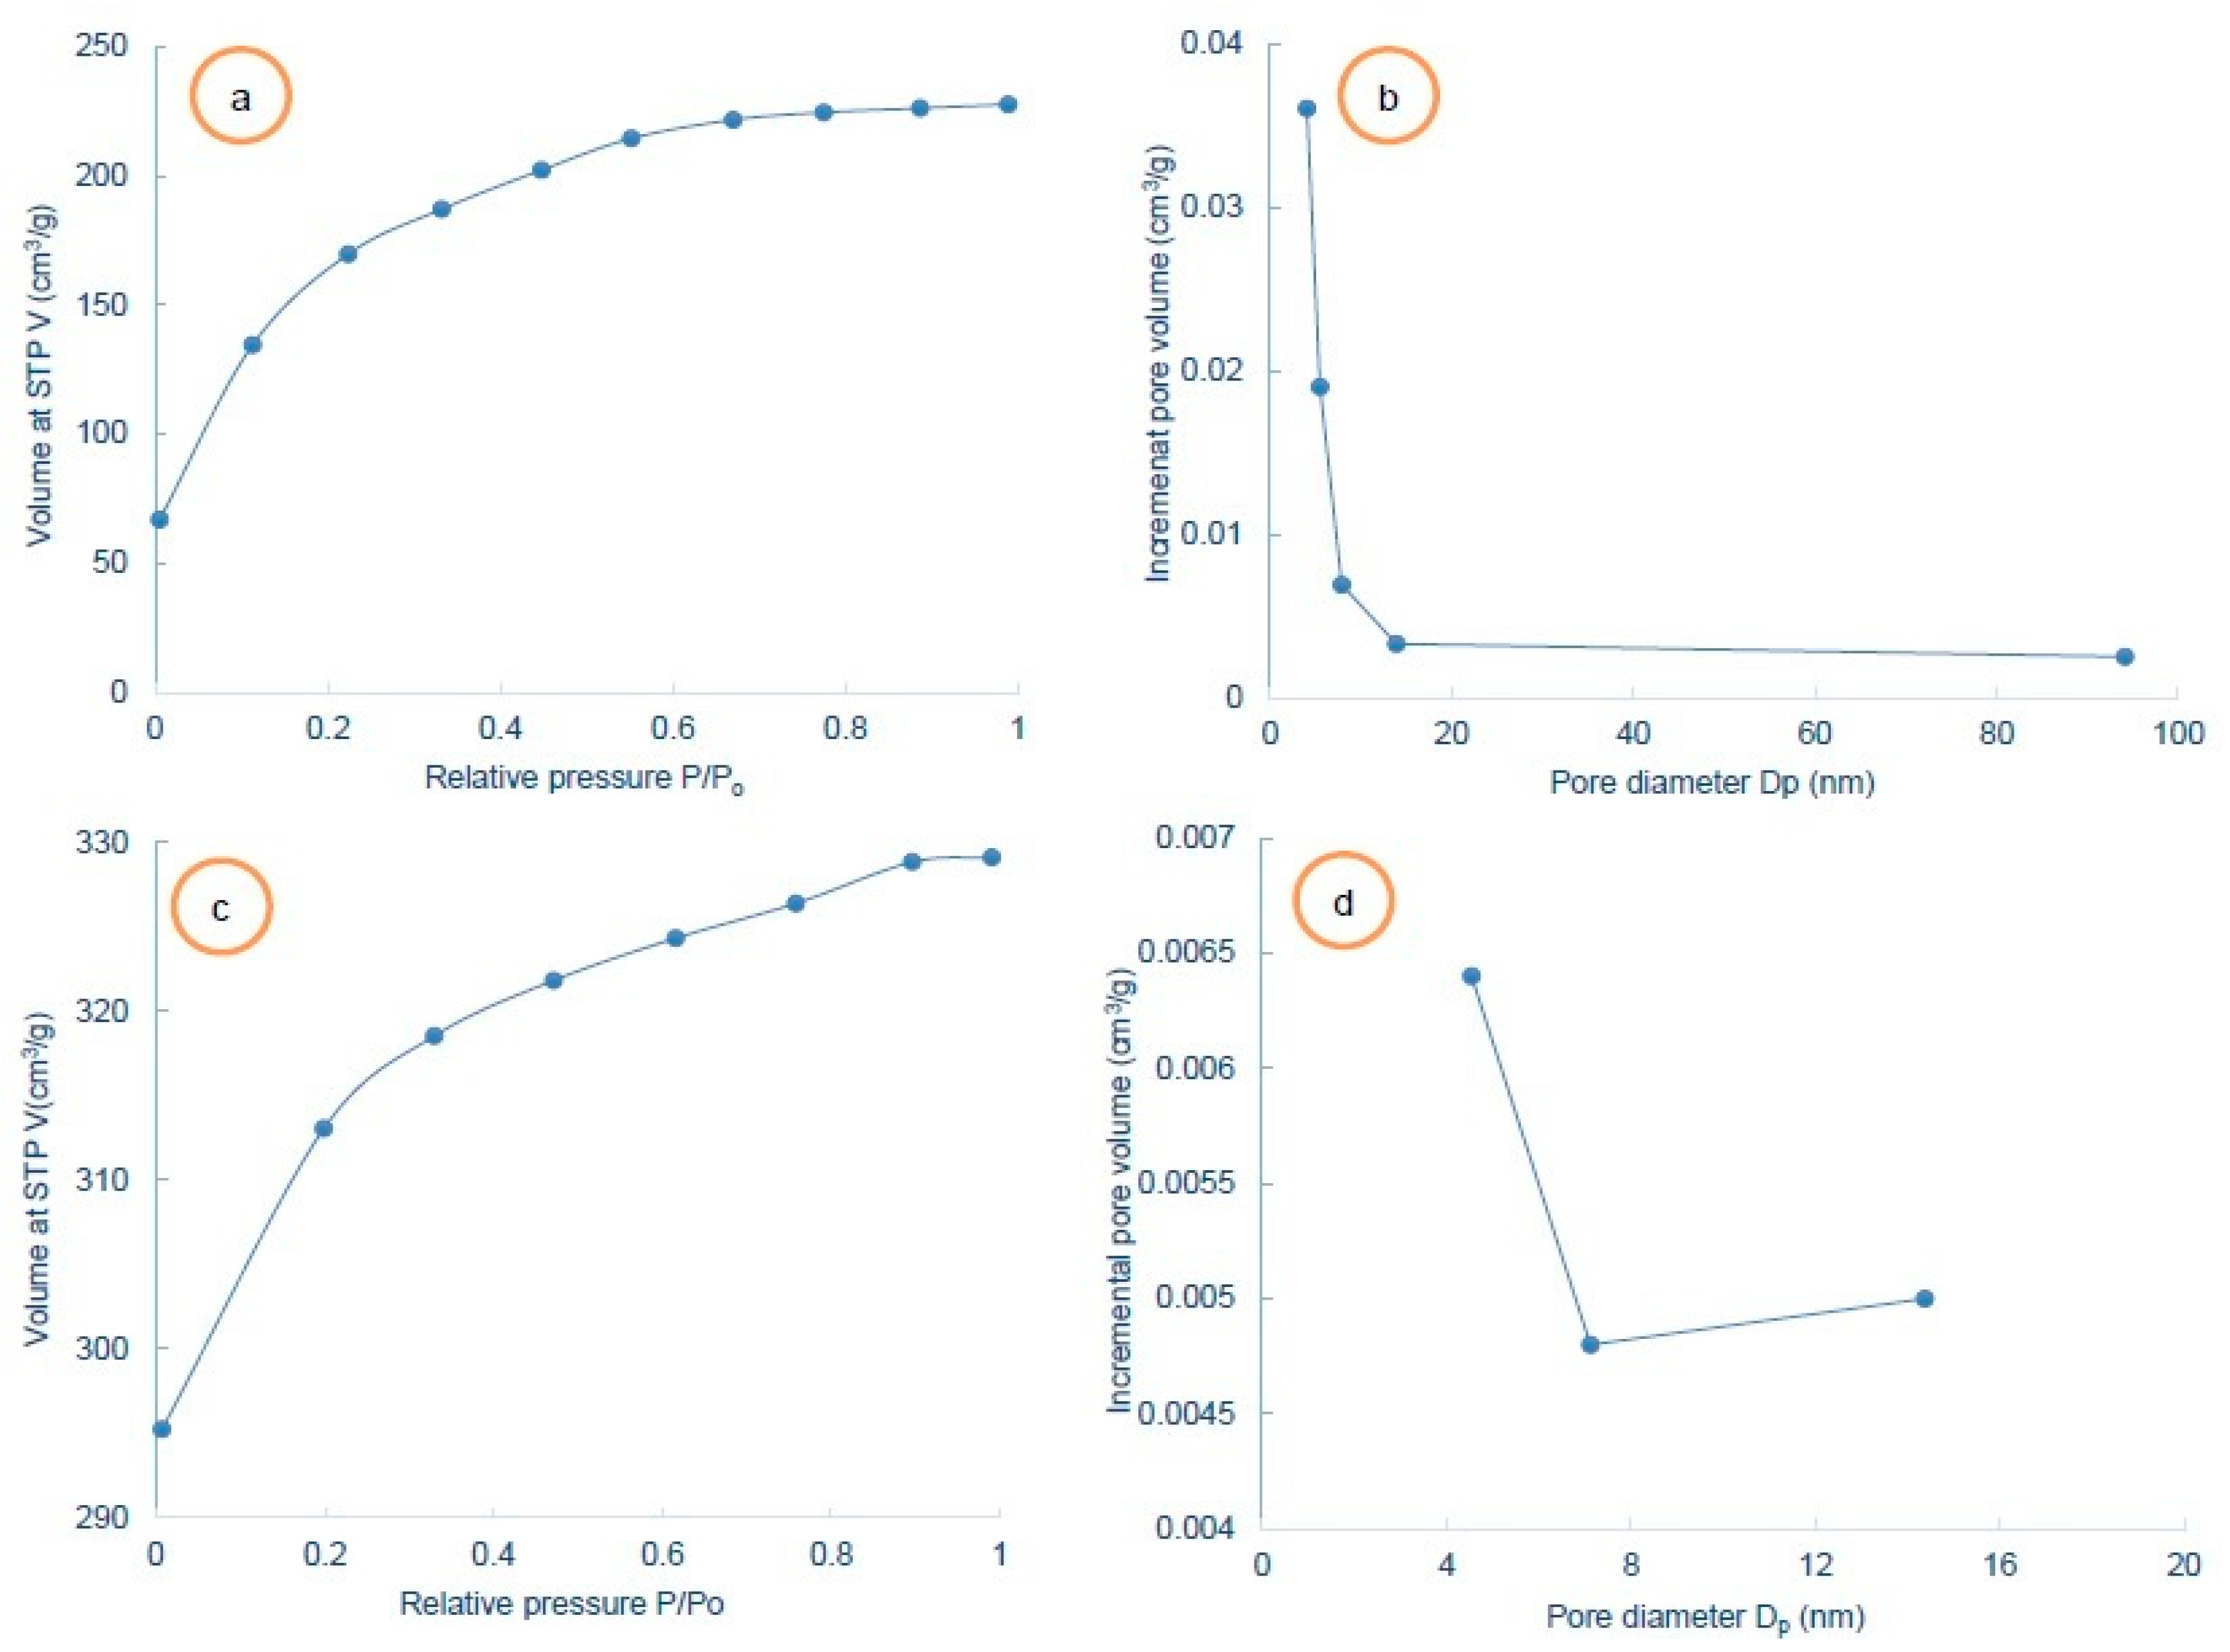
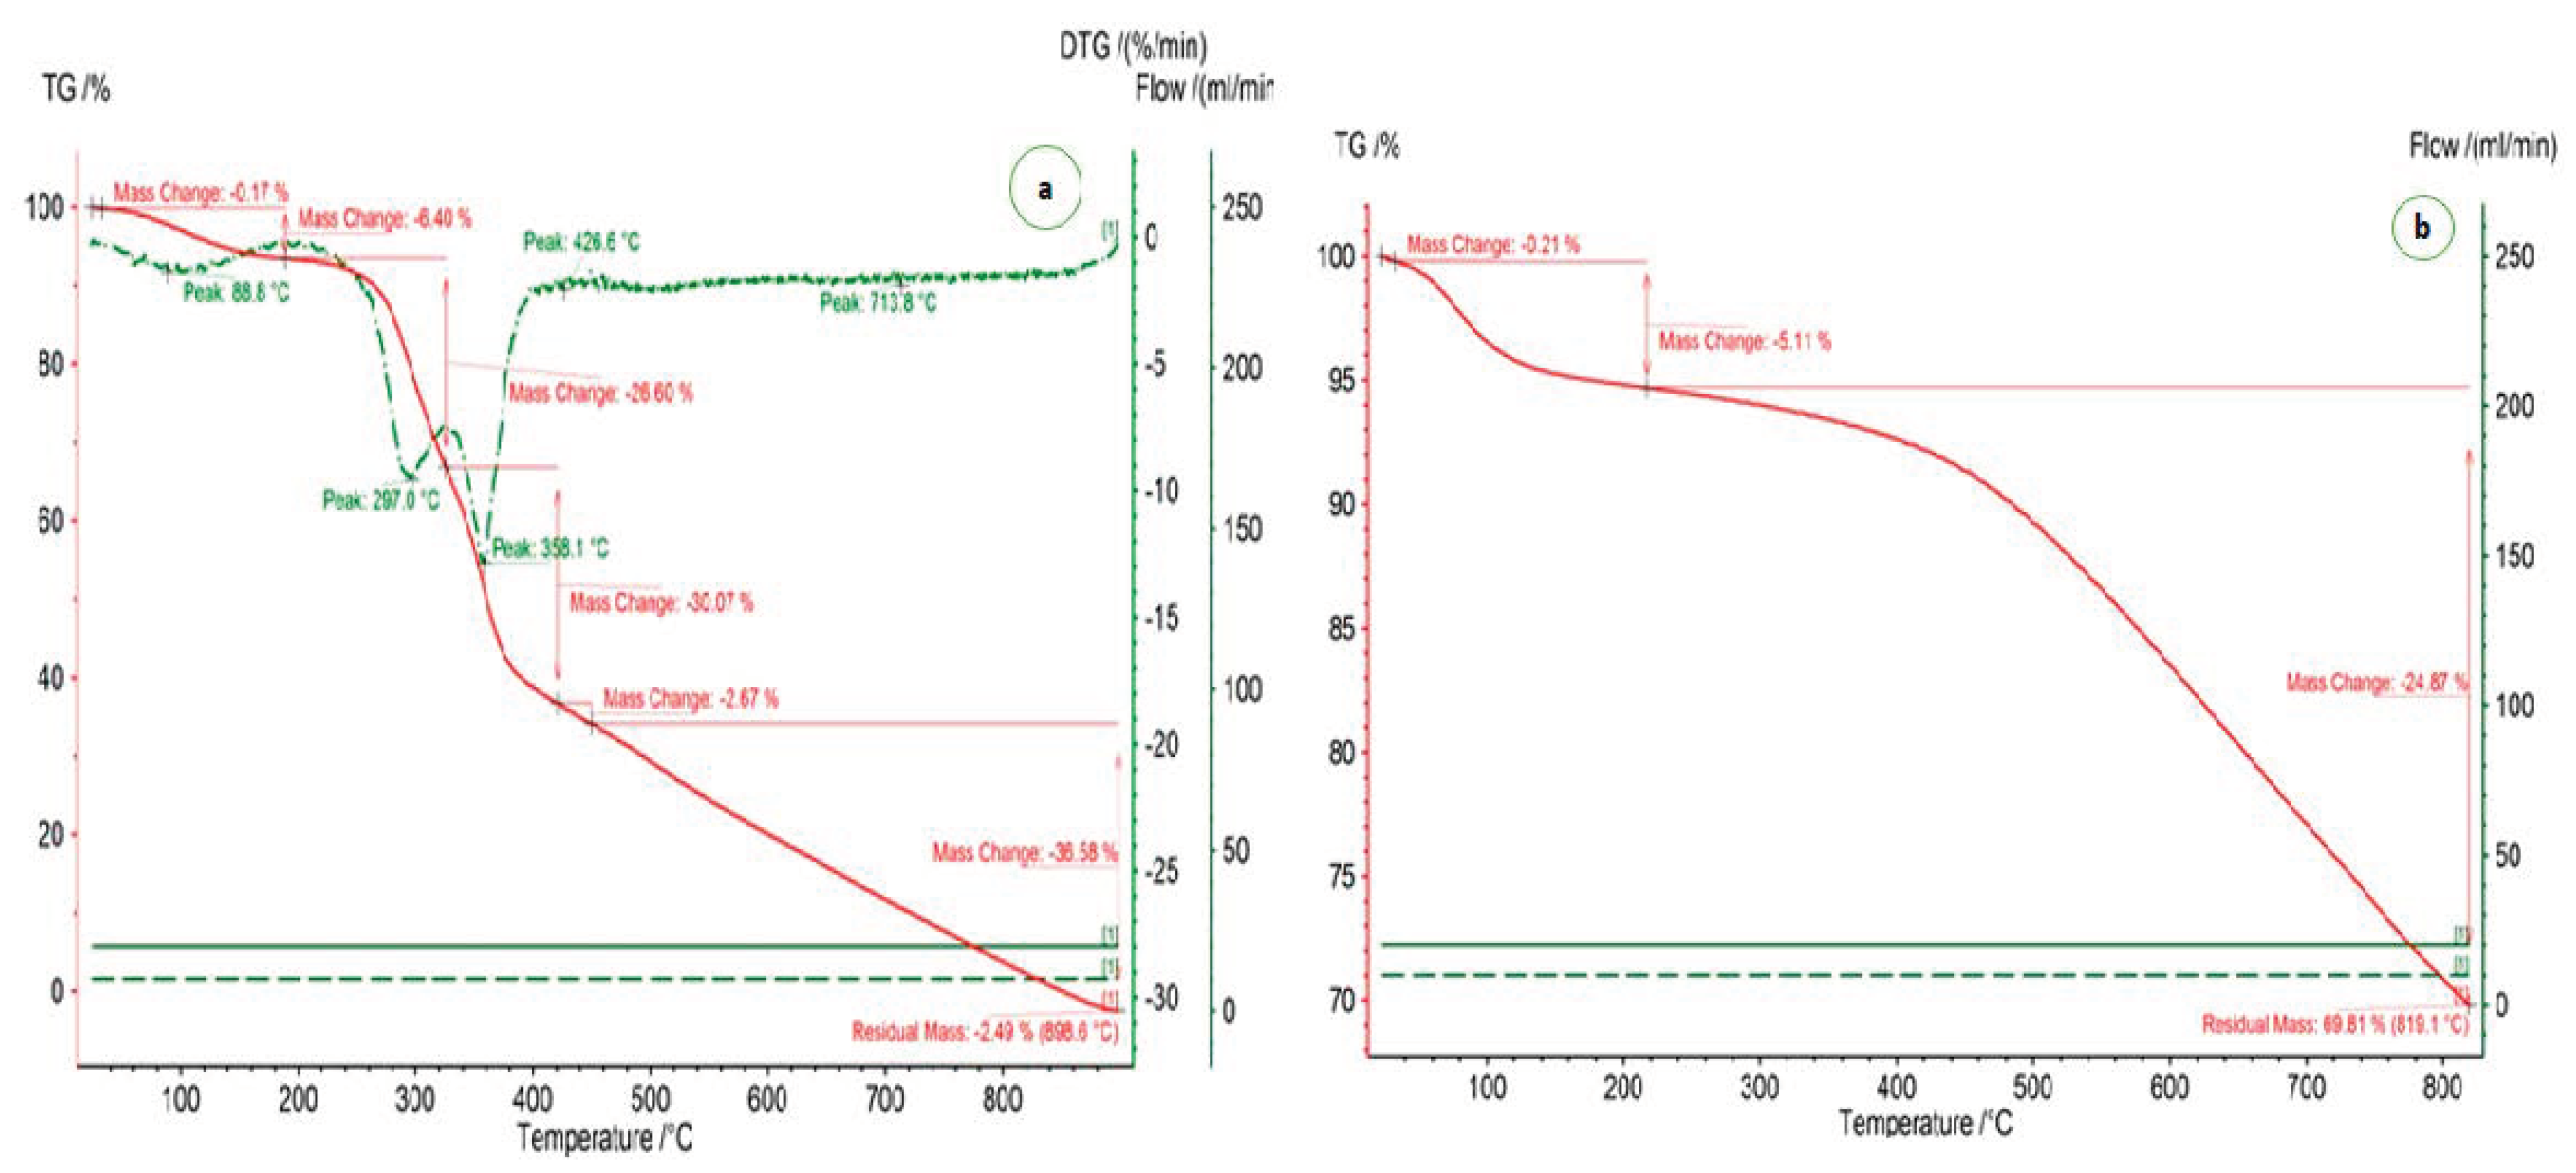
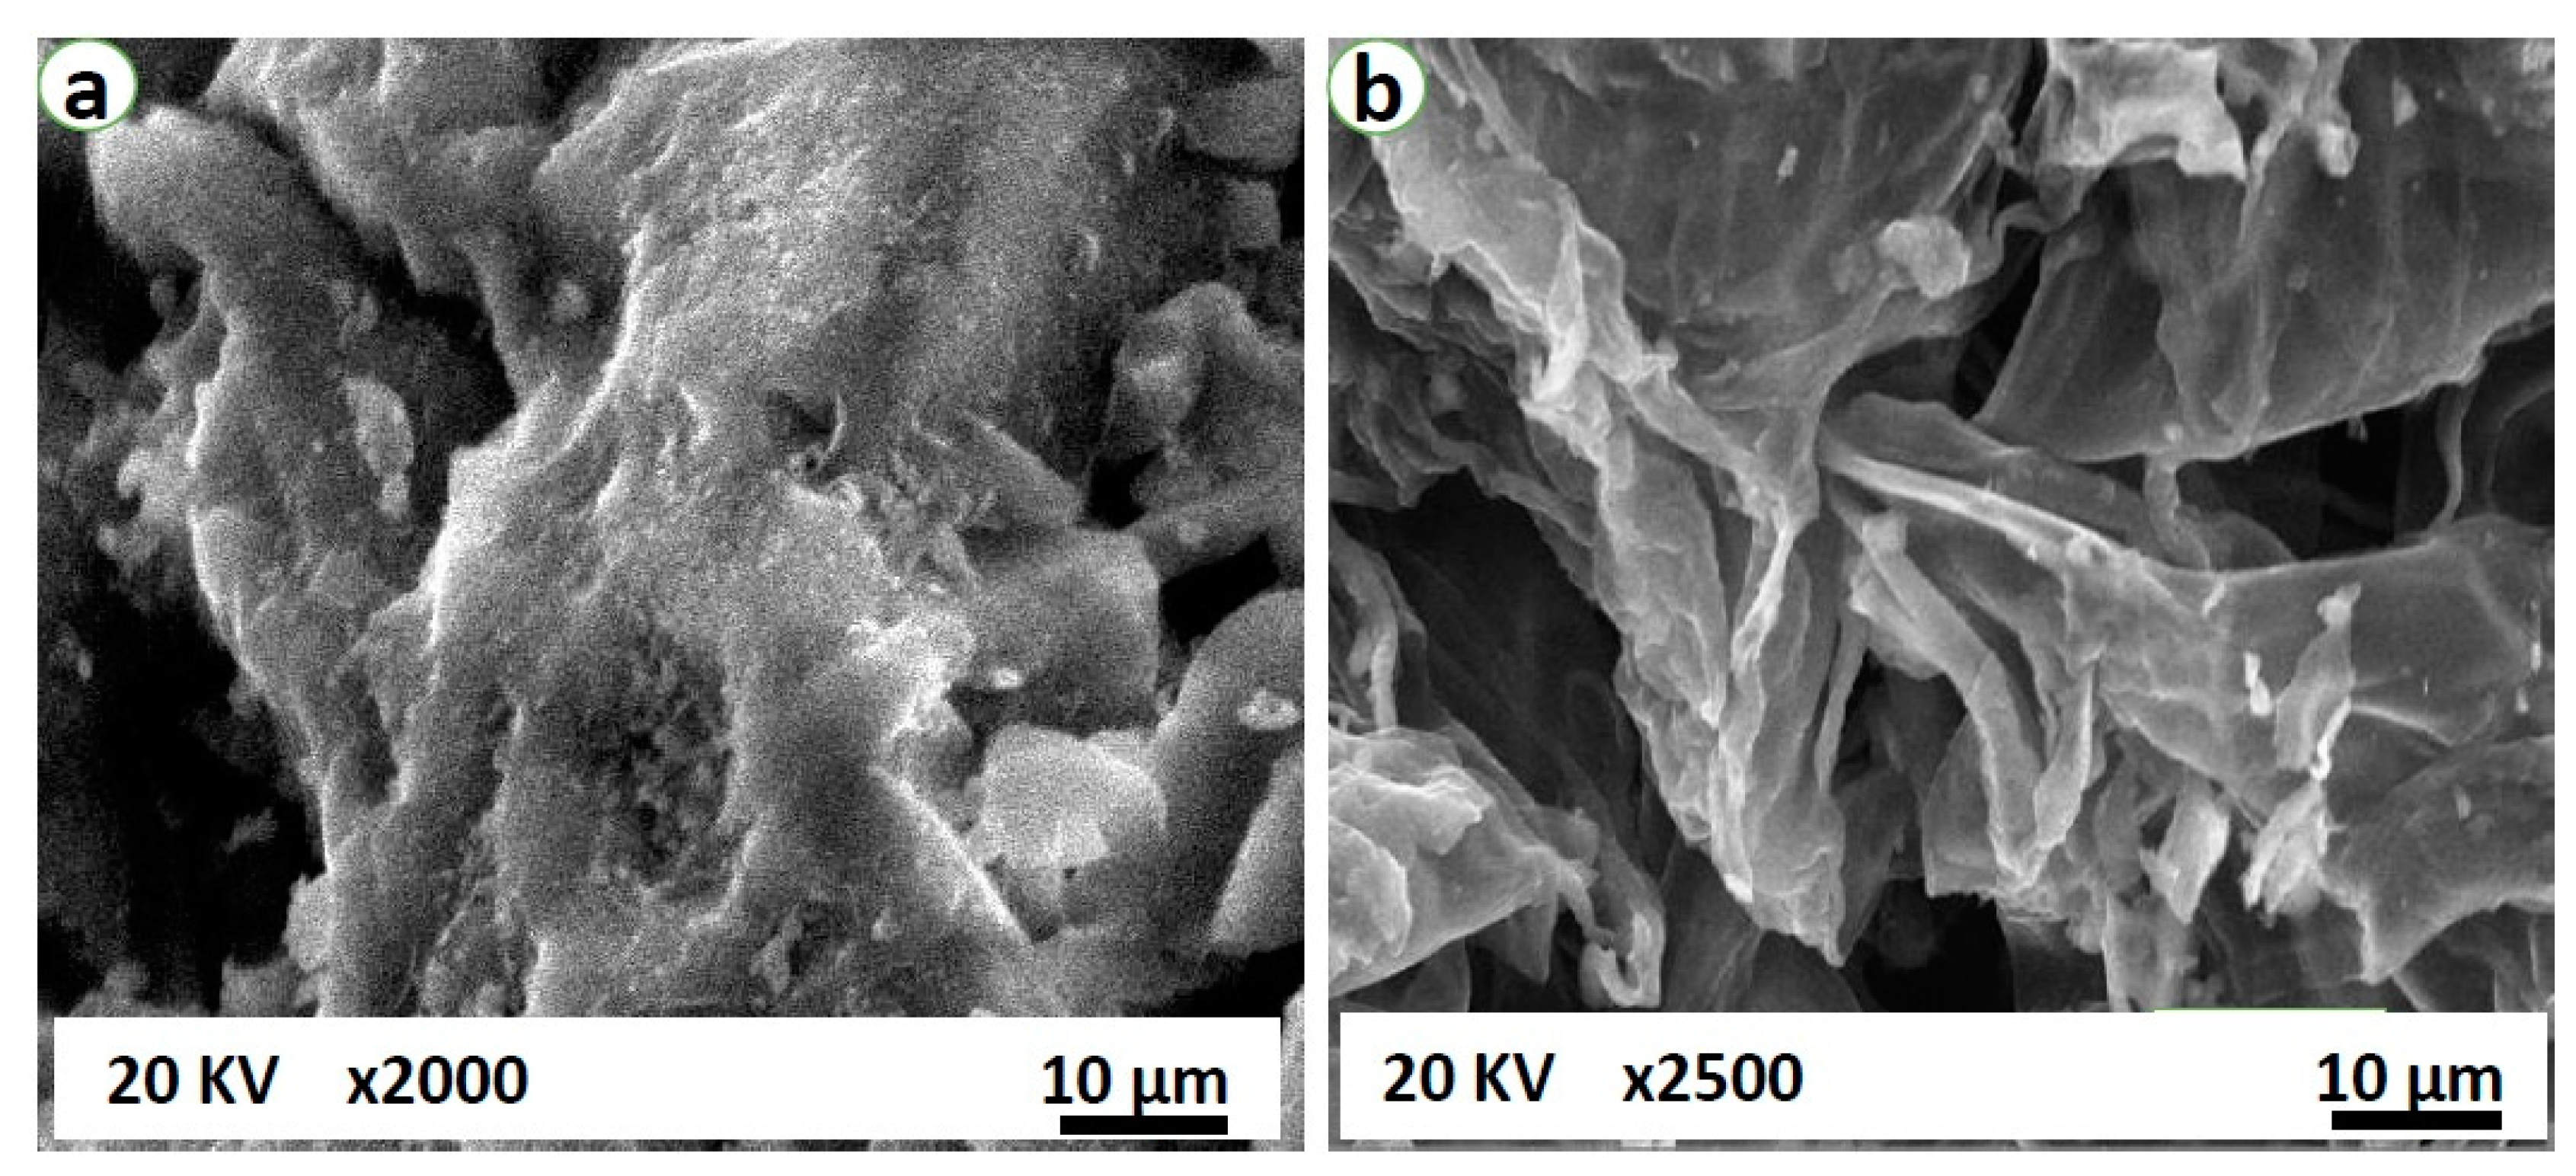
3.1. Morphological and Surface Area Characterisation
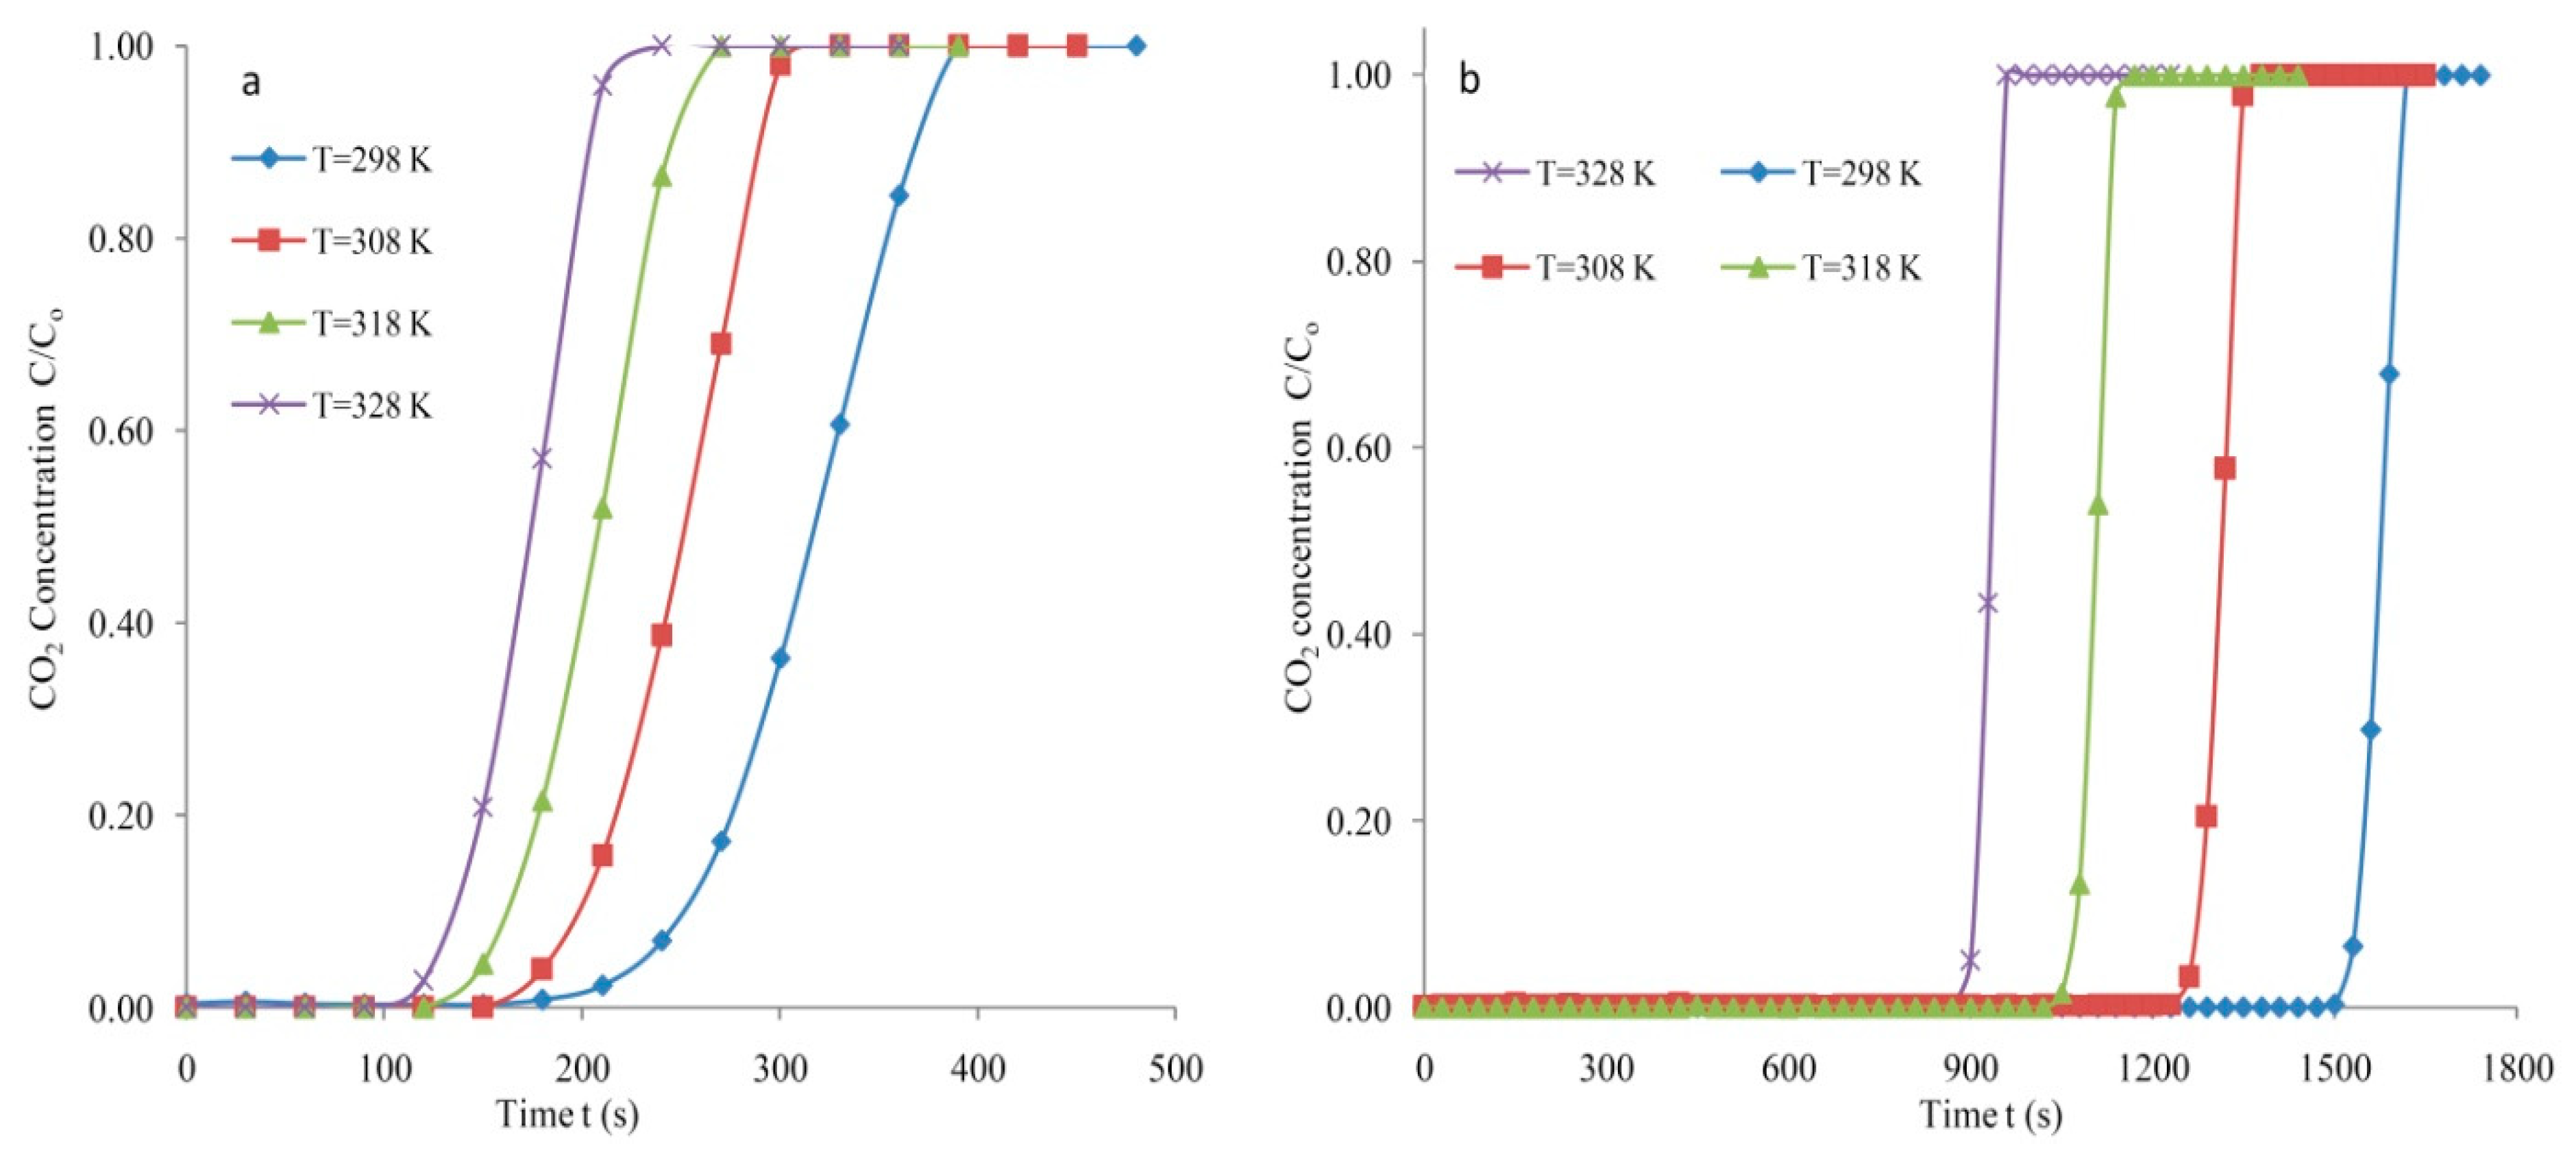
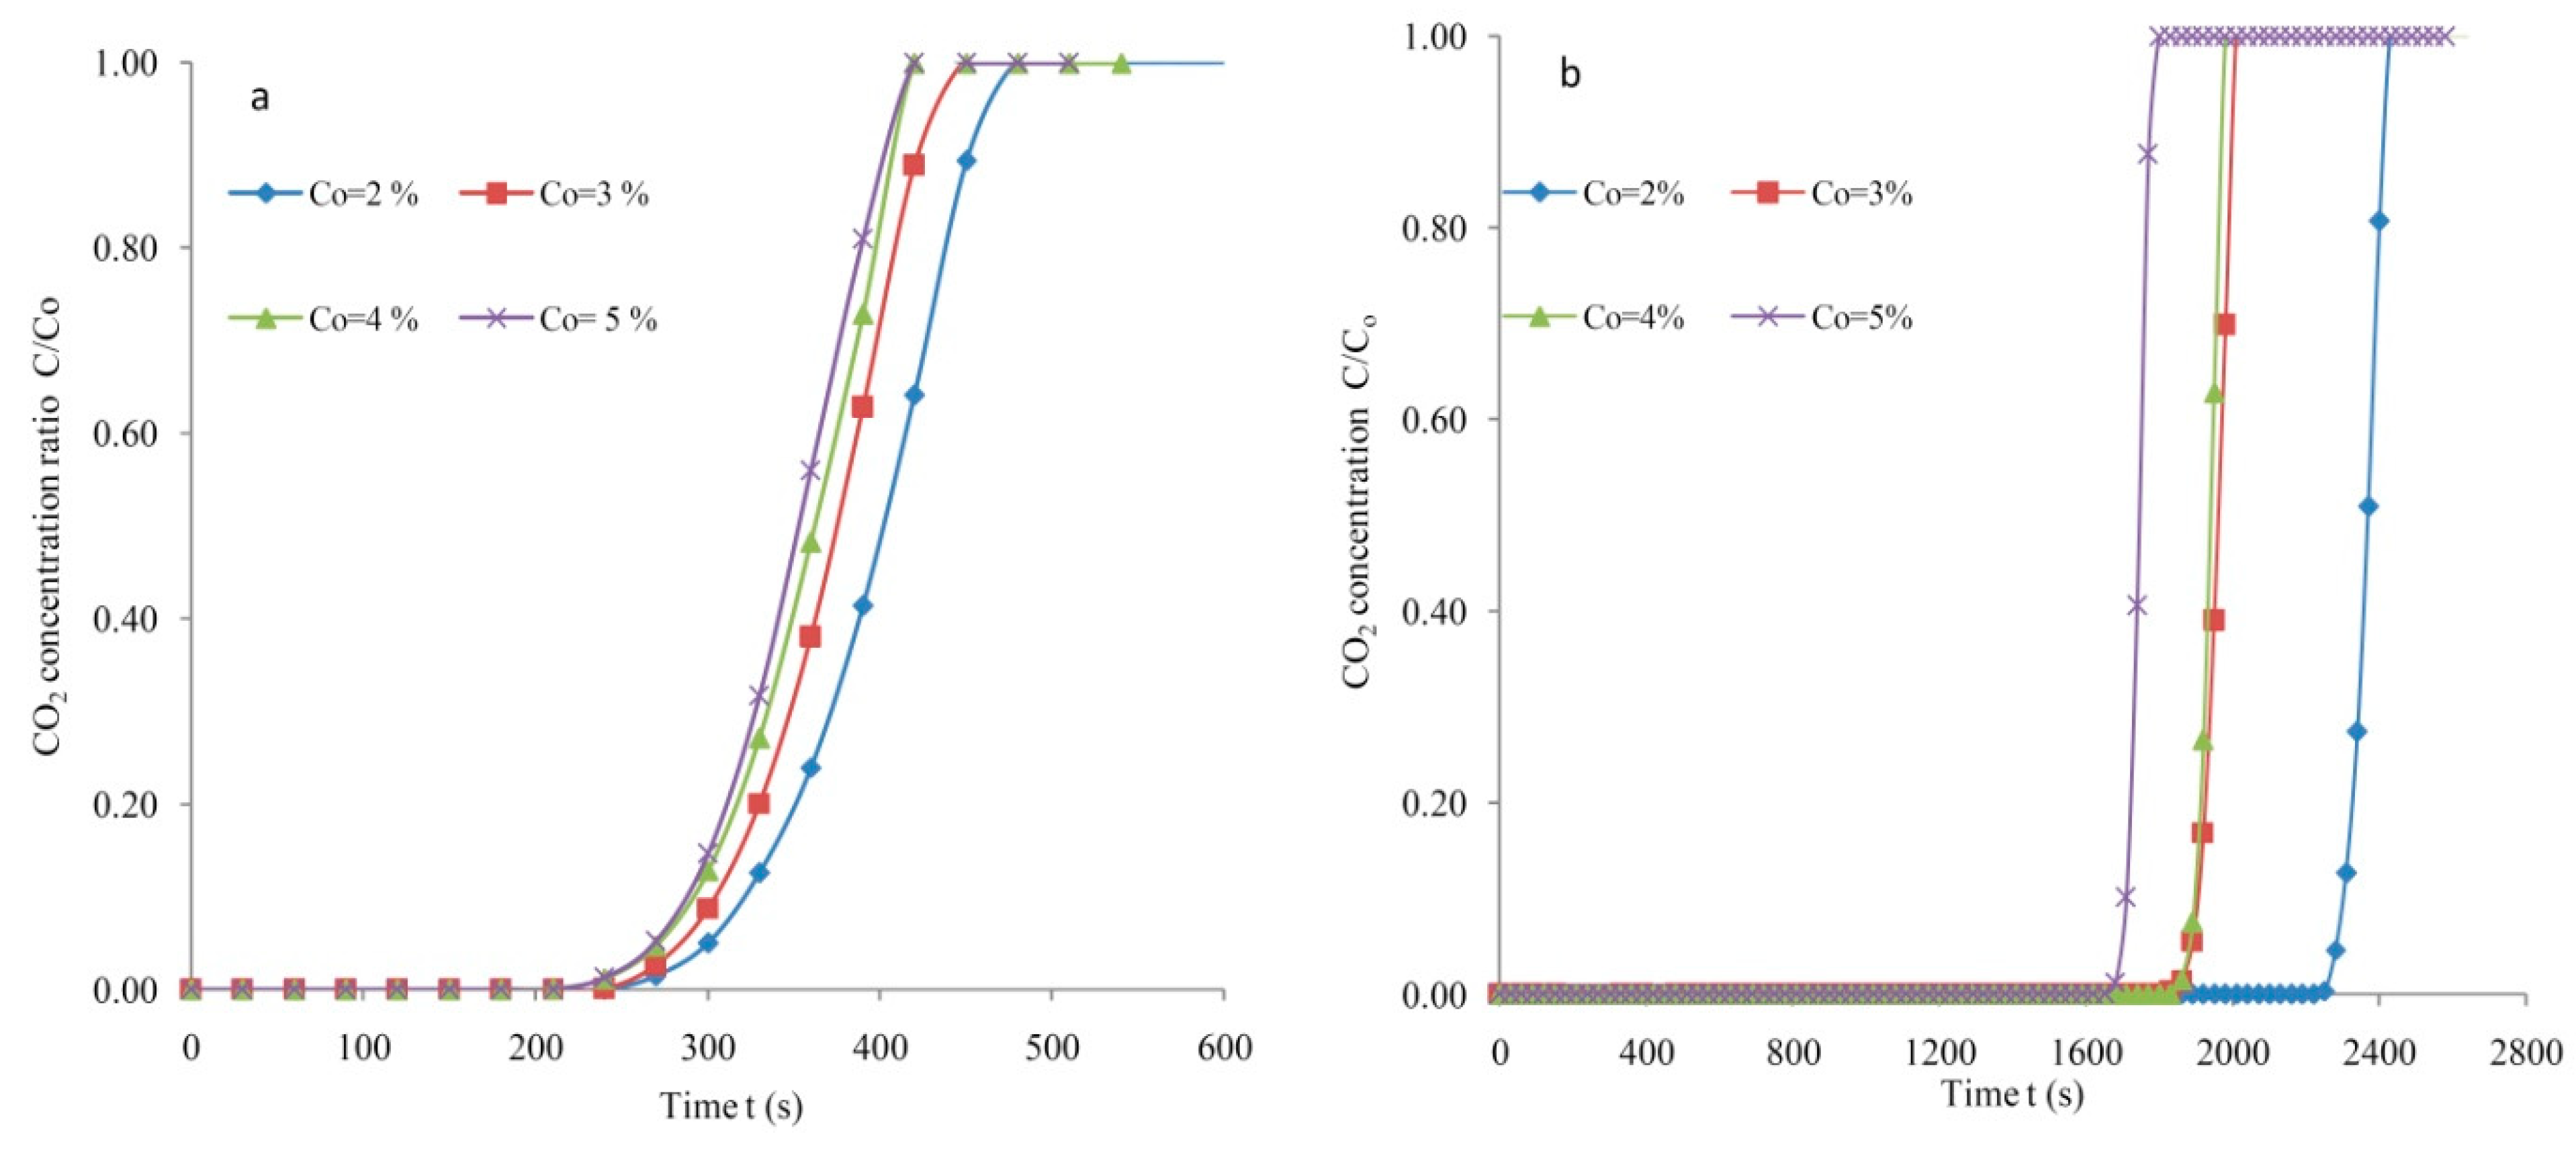
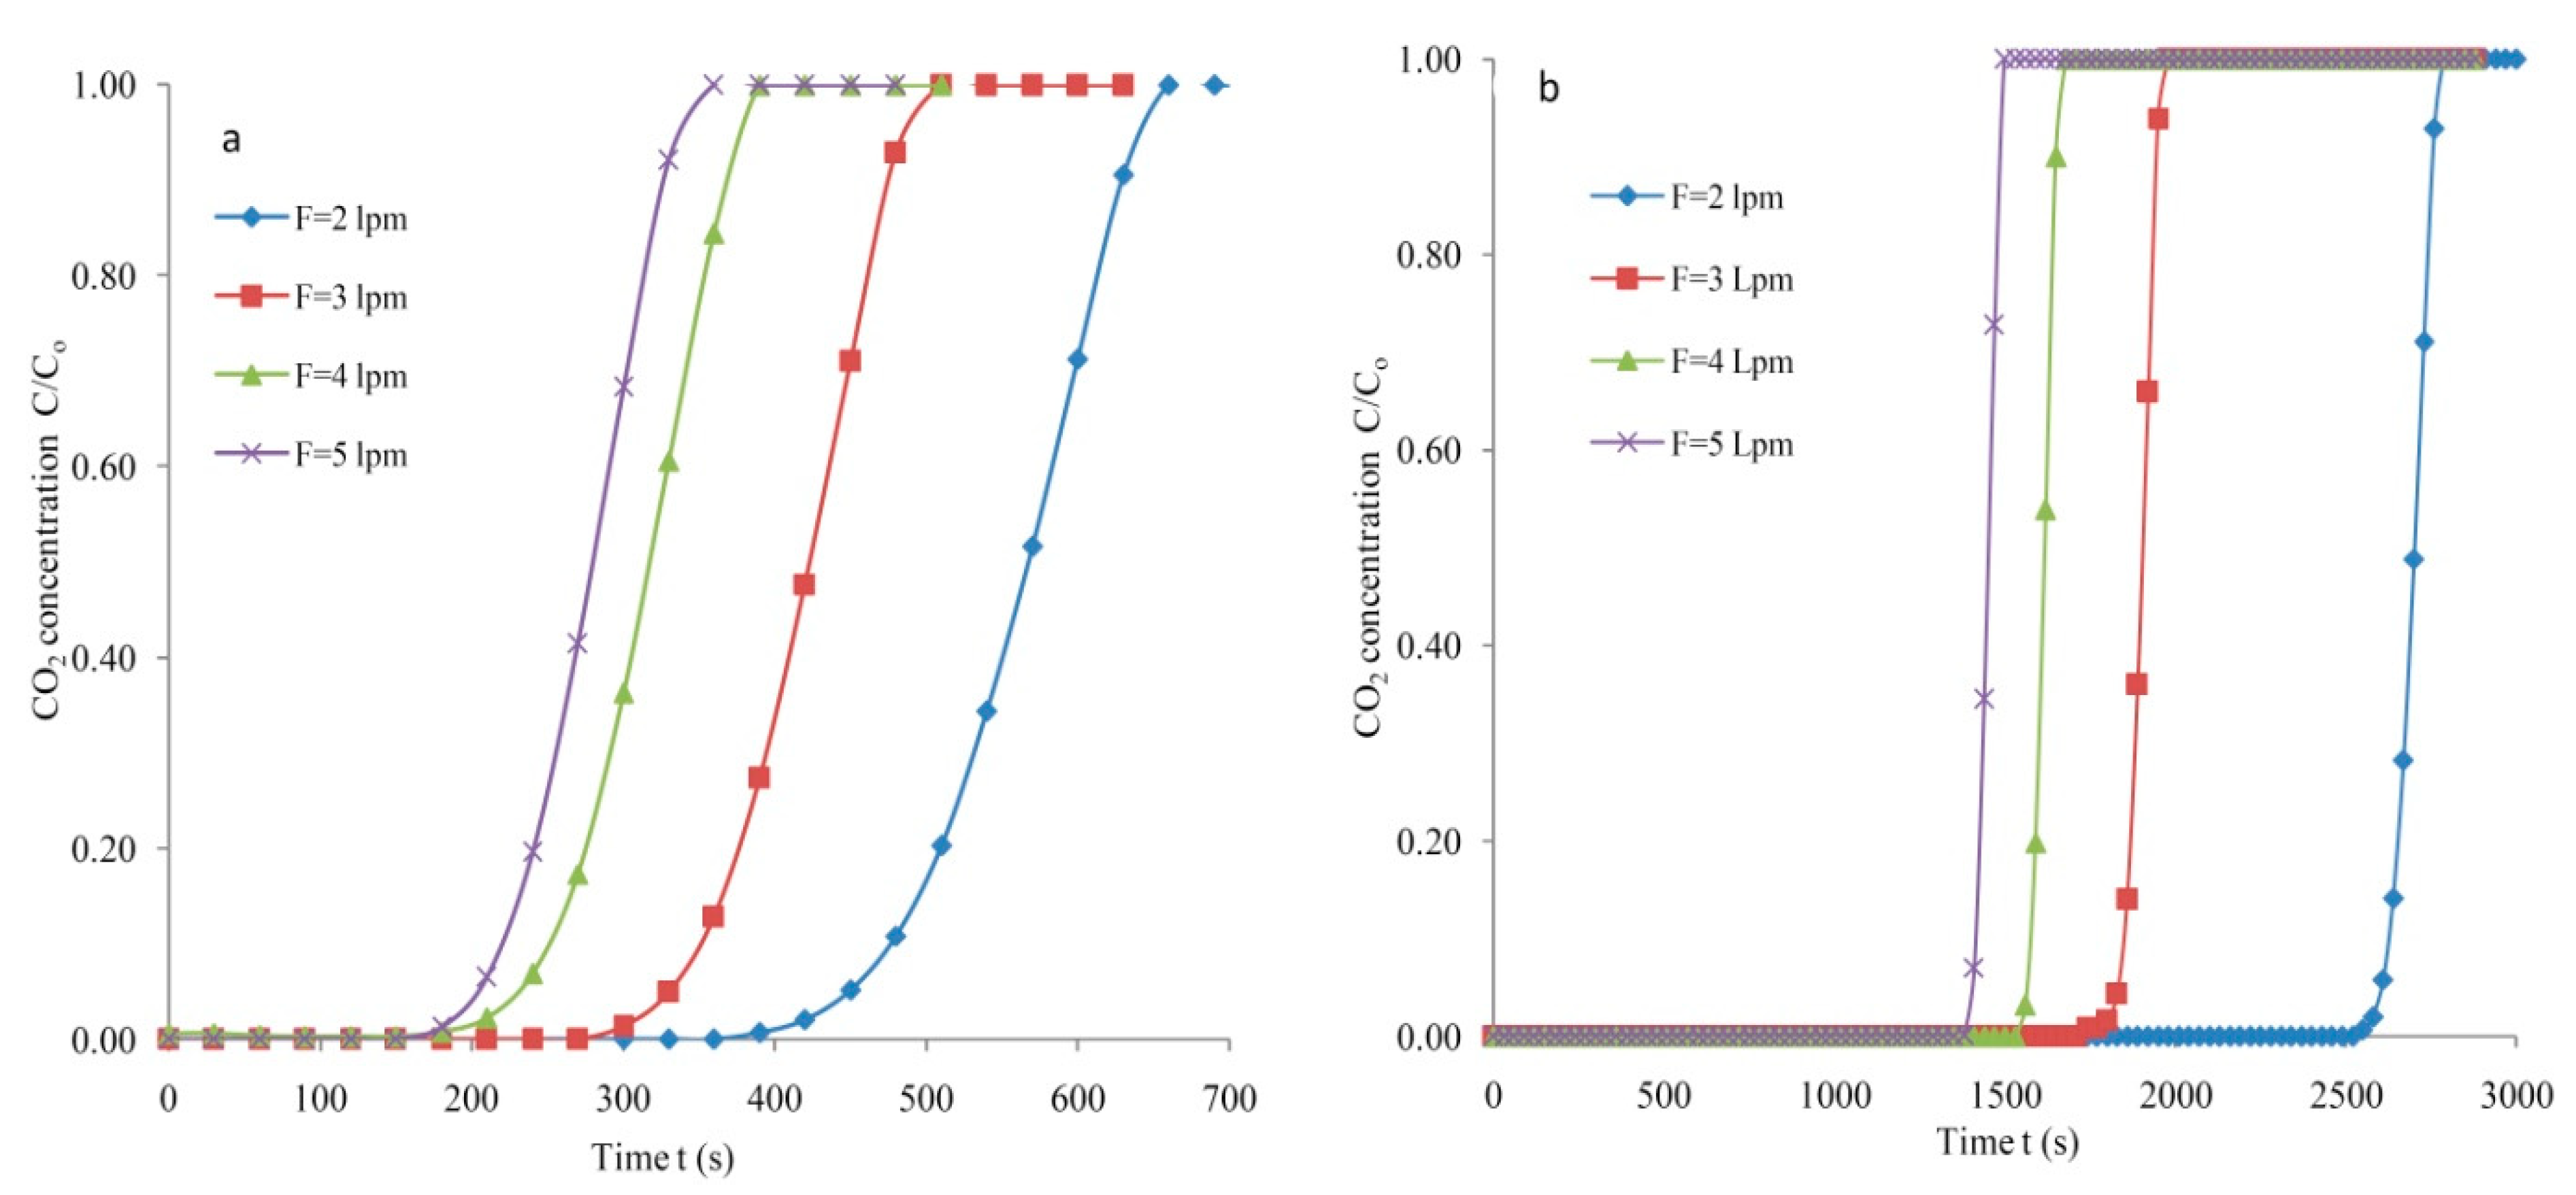
3.2. Breakthrough Analysis
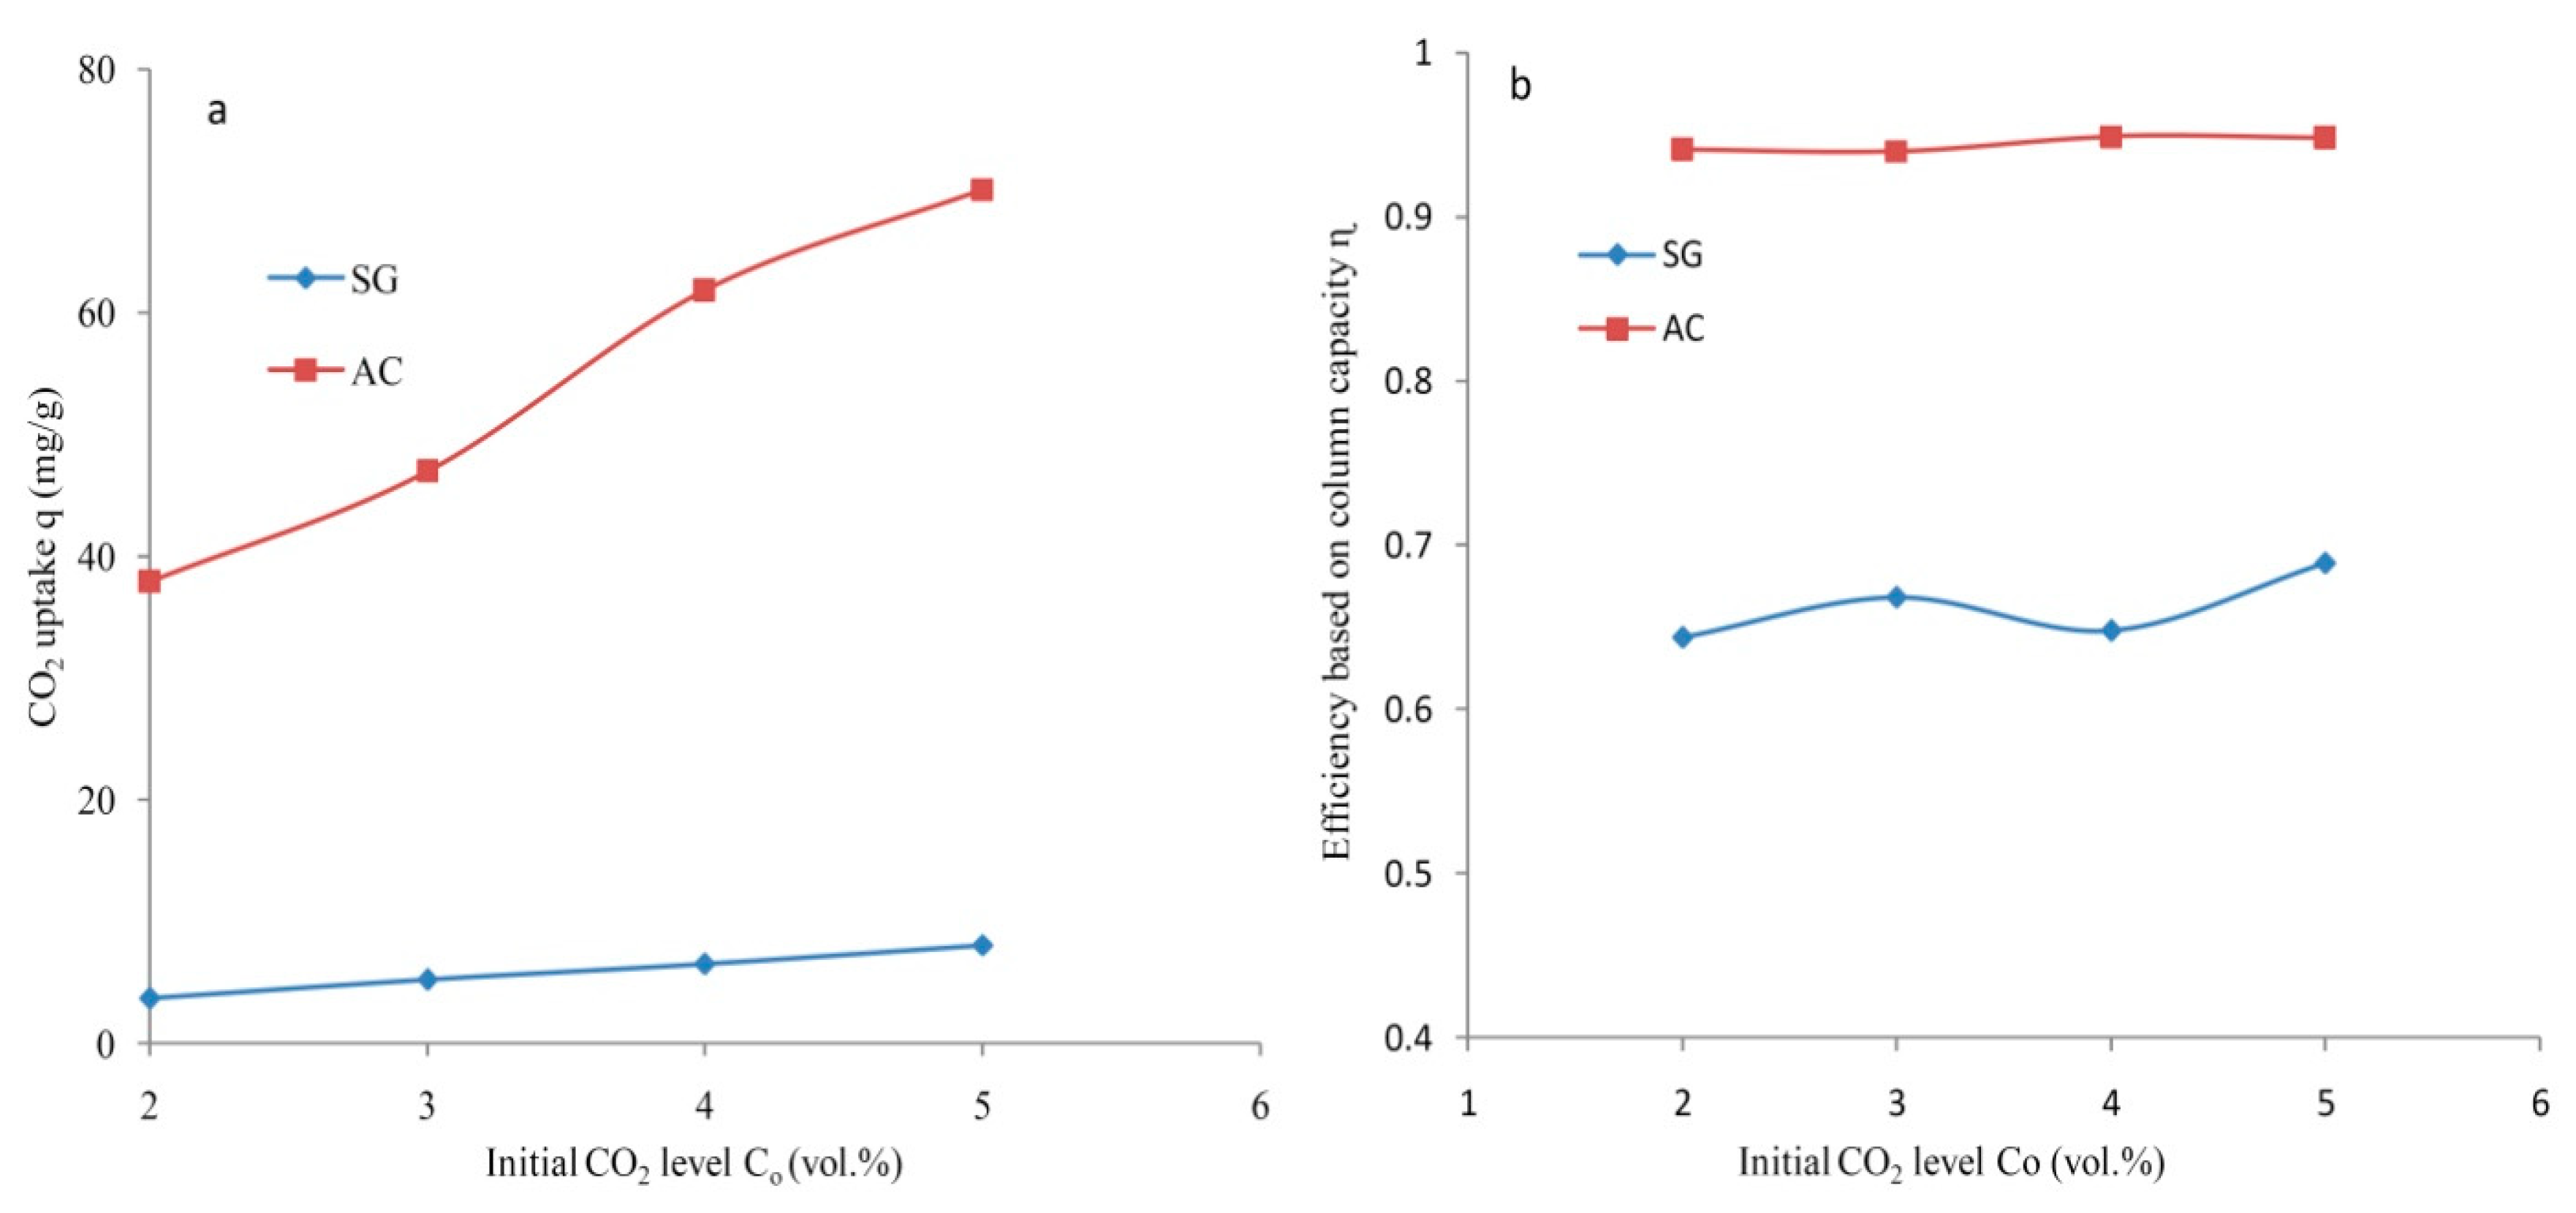
3.3. Adsorption Capacity and Column Efficiency
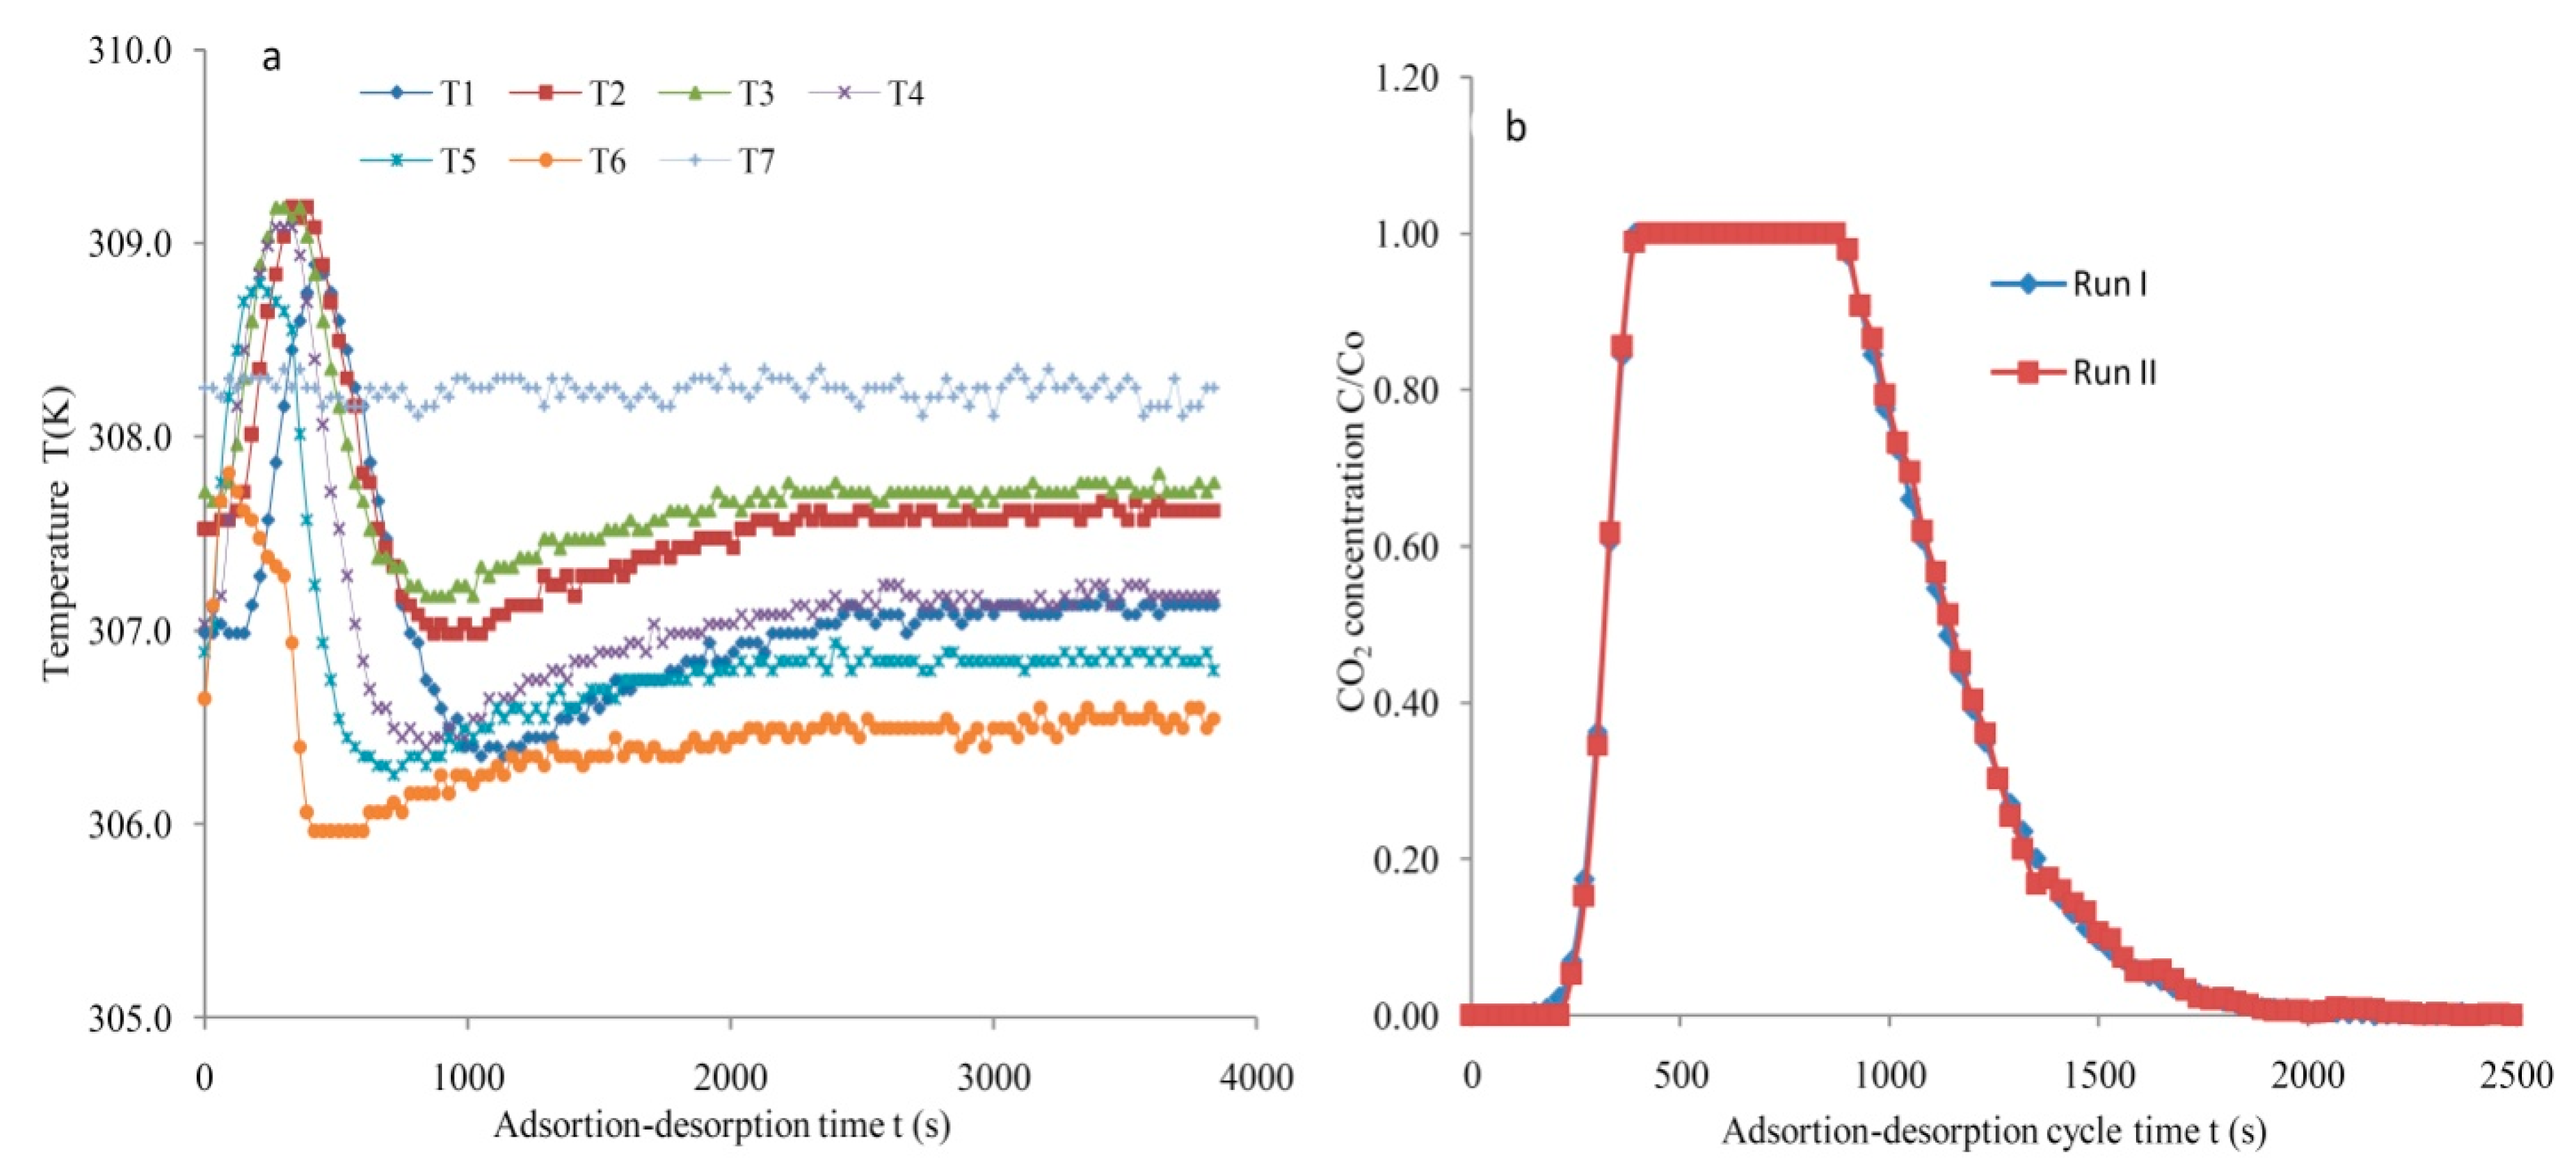
3.4. Mass Transfer Zone
4. Conclusions
Author Contributions
Funding
Institutional Review Board Statement
Informed Consent Statement
Data Availability Statement
Conflicts of Interest
References
- Rashidi, N.A.; Yusuf, S. An overview of activated carbons utilization for the post combustion carbon dioxide captures. J. CO2 Util. 2016, 13, 1–16. [Google Scholar] [CrossRef]
- MacDowell, N.; Florin, N.; Buchard, A.; Hallett, J.; Galindo, A.; Jackson, G.; Adjman, C.; Williams, C.K.; Shah, N. An overview of carbon dioxide captures technologies. Energy Environ. Sci. 2010, 3, 1645–1669. [Google Scholar] [CrossRef] [Green Version]
- Yang, H.; Xu, Z.; Fan, M.; Gupta, R.; Slimane, R.B.; Bland, A.E.; Wright, I. Progress in carbon dioxide separation and capture: A review. J. Environ. Sci. 2008, 20, 14–27. [Google Scholar] [CrossRef]
- Cohen, S.M.; Chalmers, H.L.; Webbe, M.E.; King, C.W. Comparing post-combustion carbon dioxide capture operation at retrofitted coal-fired power plants in the Texas and Great Britain electric grids. Environ. Res. Lett. 2011, 6, 1–14. [Google Scholar] [CrossRef]
- Valverde, J.M.; Pontiga, F.; Soria-Hoyo, C.; Quintanlla, M.A.S.; Moreno, H.; Duran, F.J.; Espin, M.J. Improving the gas solids contact efficiency in a fluidized bed of carbon dioxide adsorbent fine particles. Phys. Chem. Chem. Phys. 2011, 13, 14906–14909. [Google Scholar] [CrossRef] [PubMed]
- Garcia, S.; Gil, M.V.; Martin, C.F.; Pis, J.J.; Rubiera, F.; Pevida, C. Breakthrough adsorption study of a commercial activated carbon for pre-combustion carbon dioxide capture. Chem. Eng. J. 2011, 171, 549–556. [Google Scholar] [CrossRef] [Green Version]
- Alonso, M.; Rodriguez, N.; Gonzalez, B.; Grasa, G.; Murillo, R.; Abanades, J.C. Carbon dioxide capture from combustion flue gases with a calcium oxide chemical loop: Experimental results and process developments. Int. J. Greenh. Gas Control 2010, 4, 167–173. [Google Scholar] [CrossRef]
- Jiang, N.; Shen, Y.; Liu, B.; Zhang, D.; Tang, Z.; Li, G.; Fu, B. CO2 capture from dry flue gas by means of VPAS, TSA and TVSA. J. CO2 Util. 2020, 35, 153–168. [Google Scholar] [CrossRef]
- Raganati, F.; Ammendola, P. Sound-assisted fluidization for temperature swing adsorption and calcium looping: A review. Materials 2021, 14, 672. [Google Scholar] [CrossRef] [PubMed]
- Al Mesfer, M.K.; Danish, M. Breakthrough adsorption study of activated carbons for CO2 separation from flue gas. J. Environ. Chem. Eng. 2018, 6, 4514–4524. [Google Scholar] [CrossRef]
- Al Mesfer, M.K.; Danish, M.; Fahmy, M.Y.; Rashid, M.M. Post combustion CO2 capture with activated carbons using fixed bed adsorption. Heat Mass Transf. 2018, 54, 2715–2724. [Google Scholar] [CrossRef]
- Al Mesfer, M.K.; Danish, M.; Ali, I.H.; Khan, M.I. Adsorption behavior of molecular sieve 3Å and silica gel for CO2 separation: Equilibrium, breakthrough and mass transfer zone. Heat Mass Transf. 2020, 56, 3243–3259. [Google Scholar] [CrossRef]
- Al-Janabi, N.; Vakili, R.; Kalumpasut, P.; Gorgojo, P.; Siperstein, F.R.; Fan, X. Velocity variation effect in fixed bed columns: A case study of CO2 captures using porous solid adsorbents. AIChE J. 2018, 64, 2189–2197. [Google Scholar] [CrossRef] [Green Version]
- Shen, C.; Grande, C.A.; Li, P.; Yu, J.; Rodrigues, A.E. Adsorption equilibria and kinetics of CO2 and N2 on activated carbon beads. Ind. Eng. Chem. Res. 2010, 47, 4883–4890. [Google Scholar] [CrossRef]
- Lu, C.; Bai, B.; Wu, B.; Su, F.; Hwang, J.F. Comparative study of CO2 capture by carbon nanotubes, activated carbons, and zeolites. Energy Fuels 2008, 22, 3050–3056. [Google Scholar] [CrossRef]
- Shen, C.; Yu, J.; Li, P.; Grande, C.A.; Rodrigues, A.E. Capture of CO2 from flue gas by vacuum pressure swing adsorption using activated carbon beads. Adsorption 2011, 17, 179–188. [Google Scholar] [CrossRef]
- Dejang, N.; Somprasit, O.; Chindaruksa, S. Preparations of activated carbon from Macadamia shell by microwave irradiation activation. Energy Procedia 2015, 79, 727–732. [Google Scholar] [CrossRef] [Green Version]
- Calvo-Munoz, E.M.; Garcia-Mateos, F.J.; Rosas, J.M.; Rodrigues-Mirasol, J.; Cordero, T. Biomass waste carbon materials as adsorbents for CO2 capture under post-combustion conditions. Front Mater. 2016, 3, 1–14. [Google Scholar] [CrossRef] [Green Version]
- Toprak, A.; Kopac, T. Carbon dioxide adsorption using high surface area activated carbons from local coals modified by KOH, NaOH and ZnCl2 agents. Int. J. Chem. React. Eng. 2017, 15, 1–16. [Google Scholar] [CrossRef]
- Plaza, M.G.; Pevida, C.; Arias, B.; Fermoso, J.; Casal, M.D.; Martin, C.F.; Rubiera, F.; Pis, J.J. Development of low-cost biomass-based adsorbents for post-combustion CO2 capture. Fuel 2019, 88, 2442–2447. [Google Scholar] [CrossRef] [Green Version]
- Raganati, F.; Alfe, M.; Garguilu, V.; Chirone, R.; Ammendola, P. Kinetic study and breakthrough analysis of the hybrid physical/chemical CO2 adsorption/desorption behaviour of magnetite-based sorbent. Chem. Eng. J. 2019, 372, 526–535. [Google Scholar] [CrossRef]
- Raganati, F.; Chirone, R.; Ammendola, P. CO2 capture by temperature swing adsorption: Working capacity as affected by temperature and CO2 partial pressure. Ind. Eng. Chem. Res. 2020, 59, 3593–3605. [Google Scholar] [CrossRef]
- Hao, W.; Bjorkman, E.; Lilliestrale, M.; Hedin, N. Activated carbon prepared from hydrothermally carbonized waste biomass used as adsorbent for CO2. Appl. Energy 2013, 112, 526–632. [Google Scholar] [CrossRef]
- Shahkarami, S.; Azargohar, R.; Dalai, A.K.; Soltan, J.J. Breakthrough CO2 adsorption in bio-based activated carbons. Environ. Sci. 2015, 34, 69–76. [Google Scholar]
- Oginni, O.; Singh, K.; Oporto, G.; Dawson-Andoh, B.; McDonal, L.; Sabolsky, E. Influence of one-step and two-step KOH activation on activated crabon characteristics. Bioresour. Technol. Rep. 2019, 7, 100266. [Google Scholar] [CrossRef]
- Ilnika, A.; Kamedulski, P.; Aly, H.M.; Lukaszewick, J.P. Manufacture of activated carbon using Egyptian wood resources and its application in dye adsorption. Arab. J. Chem. 2020, 13, 5284–5291. [Google Scholar] [CrossRef]
- Chiang, Y.-C.; Chen, Y.-J.; Wu, C.-Y. Effect of relative humidity on adsorption breakthrough of CO2 on activated carbon fibers. Materials 2017, 10, 1206. [Google Scholar] [CrossRef] [Green Version]
- Coromina, H.M.; Walsh, D.A.; Mokaya, R. Biomass-derived activated carbon with simultaneously enhanced CO2 uptake for both pre and post combustion capture applications. J. Mater. Chem. A 2016, 4, 280–289. [Google Scholar] [CrossRef]
- Zhang, C.; Song, W.; Ma, Q.; Xie, L.; Zhang, X.; Guo, H. Enhancement of CO2 capture on biomass-based carbon from black locust by KOH activation and ammonia modification. Energy Fuels 2016, 305, 4181–4190. [Google Scholar] [CrossRef]
- Hong, S.; Jang, E.; Dysart, D.; Pol, V.G.; Lee, K.B. CO2 capture in the sustainable wheat-derive activated microporous carbon compartments. Sci. Rep. 2016, 6, 1–10. [Google Scholar] [CrossRef]
- Lira-Zuniga, S.; Saez-Navarrete, C.; Rodrigues-Cordova, L.; Herrera-Zeppelin, L.; Herrera-Urbina, R. CO2 adsorption on agricultural biomass combustion ashes. Maderas Ciencia y Tecnología 2016, 18, 607–616. [Google Scholar] [CrossRef] [Green Version]
- Serafin, J.; Narkiewicz, U.; Moraeski, A.W.; Wrobel, R.J. Highly microporous activated carbons from biomass for CO2 capture and effective micropores at different conditions. J. CO2 Util. 2017, 18, 73–79. [Google Scholar] [CrossRef]
- Lewicka, K. Activated carbons prepared from hazelnut shells, walnut shells and peanut shells for high CO2 adsorption. Pol. J. Chem. Technol. 2017, 19, 38–43. [Google Scholar] [CrossRef] [Green Version]
- Zhu, M.; Cai, W.; Verpoort, F.; Zhou, J. Preparation of pineapple waste-derived porous carbons with enhanced CO2 capture performance by hydrothermal carbonation-alkali metal oxalates assisted thermal activation process. Chem. Eng. Res. Des. 2019, 146, 130–140. [Google Scholar] [CrossRef]
- Cai, W.; Zhang, S.; Hu, X.; Jaroniec, M. In situ synthesis of N-enriched activated carbons from procambarus clarkii shells with enhanced CO2 adsorption performance. Energy Fuels 2018, 32, 9701–9710. [Google Scholar] [CrossRef]
- Peredo-Mancilla, D.; Hort, C.; Ghimbeu, C.M.; Jeguirim, M.; Bessieres, D. CO2 and CH4 adsorption behaviour of Biomass-based activated carbons. Energies 2018, 22, 3136. [Google Scholar] [CrossRef] [Green Version]
- Ammendola, P.; Ragnati, F.; Chrone, R.; Miccio, F. Fixed bed adsorption affected by thermodynamic and kinetics: Yellow tuff for CO2 capture. Powder Technol. 2020, 373, 446–458. [Google Scholar] [CrossRef]
- Zeng, G.; Lou, S.; Ying, H.; Wu, X.; Dou, X.; Ai, N.; Wang, J. Preparation of microporous carbon from sargassum horneri by hydrothermal carbonization and KOH activation for CO2 capture. J. Chem. 2018, 2018, 4319149. [Google Scholar] [CrossRef] [Green Version]
- Davis, E.; Kopac, J. Activated carbons derived from residual biomass pyrolysis and their CO2 adsorption capacity. J. Anal. Appl. Pyrolysis 2014, 110, 322–332. [Google Scholar]
- Jahangiri, M.; Shahtaheri, S.J.; Adl, J.; Rashidi, A.; Kakooei, H.; Forushani, A.R.; Nasiri, G.; Ghorbanali, A. Preparation of activated carbon from walnut shell and its utilization for manufacturing organic-vapor respirator cartridge. Fresenius Environ. Bull. 2012, 21, 1508–1514. [Google Scholar]
- Patil, P.; Singh, S.; Kumar, Y.M. Preparation and study of properties of activated carbons produced from agricultural and industrial waste shells. Res. J. Chem. Sci. 2013, 3, 12–15. [Google Scholar]
- Xia, H.; Cheng, S.; Zhang, L.; Peng, J. Utilization of walnut shell as a feedstock for preparing high surface area activated carbon by microwave induced activation: Effect of activation agents. Green Process. Synth. 2016, 5, 1–2. [Google Scholar] [CrossRef]
- Mataji, M.; Khoshandam, B. Benzene adsorption on activated carbon from walnut shell. Chem. Eng. Comm. 2014, 201, 1294–1313. [Google Scholar] [CrossRef]
- Al Mesfer, M.K. Synthesis and characterization of high-performance activated carbon from walnut shell biomass for CO2 capture. Environ. Sci. Pollut. Res. 2020, 27, 15020–15028. [Google Scholar] [CrossRef] [PubMed]
- Banat, F.; Al-Asheh, S.; Makhadmeh, L. Preparation and examination of activated carbons from date pits impregnated with potassium hydroxide for the removal of methylene blue from aqueous solutions. Adsorpt. Sci. Technol. 2003, 21, 597. [Google Scholar] [CrossRef]
- Mansour, E.G.; Simeda, M.G.; Zaatout, A.A. Removal of brilliant green dye from synthetic wastewater under batch mode using chemically activated date pit carbon. RSC Adv. 2021, 11, 7851–7861. [Google Scholar] [CrossRef]
- Berber, M.R. Surface-functionalization of activated carbon with polyglucosamine polymer for efficient removal of cadmium ions. Polym. Compos. 2020, 41, 3074–3086. [Google Scholar] [CrossRef]
- Vohra, M. Treatment of gaseous ammonia emissions using date palm pits based granular activated carbo. Int. J. Environ. Res. Public Health 2020, 17, 1519. [Google Scholar] [CrossRef] [Green Version]
- Belhamdi, B.; Merzougui, Z.; Laksaci, H.; Belabed, C.; Boudiaf, S.; Trari, M. Removal of dissolved organic nitrogen amino acid from aqueous solutions using activated carbon based on date pits. Water Pract. Technol. 2020, 15, 1158–1173. [Google Scholar] [CrossRef]
- Hijab, M.; Saleem, J.; Parthasarathy, P.; Mackey, H.R.; McKay, G. Two-stage optimisation for malachite green removal using activated date pits. Biomass Conv. Biorefin. 2020, 11, 727–740. [Google Scholar] [CrossRef]
- Krishnamoorthy, M.; Govindan, B.; Banat, F.; Sagadevan, V.; Purushothaman, M.; Show, P.L. Date pits activated carbon for divalent lead ions removal. J. Biosci. Bioeng. 2019, 128, 88–97. [Google Scholar] [CrossRef]
- Merzougui, Z.; Azoudj, Y.; Bouchemel, N.; Addoun, F. Effect of activation method on the pore structure of activated carbon from date pits application to the treatment of water. Desalin. Water Treat. 2011, 29, 236–240. [Google Scholar] [CrossRef]
- Belhachemi, M.; Rios, R.V.R.A.; Addoun, F.; Silvestre-Albero, J.; Sepulveda-Escribano, A.; Rodrigues-Reinoso, F. Preparation of activated carbon from date pits: Effects of agents and liquid phase oxidation. J. Anal. Appl. Pyrolysis 2009, 86, 168–172. [Google Scholar] [CrossRef]
- Daniel, V.V.; Gulyani, B.B.; Kumar, B.G.P. Usage of date stones as adsorbents: A review. J. Dispers. Sci. Technol. 2012, 33, 1321–1331. [Google Scholar] [CrossRef]
- Ogungbenro, A.E.; Quang, D.V.; Al-Ali, K.; Abu-Zahra, M.R.M. Activated carbon from date seeds for CO2 capture applications. Energy Procedia 2017, 114, 2313–2321. [Google Scholar] [CrossRef]
- Ogungbenro, A.E.; Quang, D.V.; Al-Ali, K.; Vega, L.F.; Abu-Zahra, M.R.P. Physical synthesis and characterization of activated carbon from date seeds for CO2 capture. J. Environ. Chem. Eng. 2018, 6, 4245–4252. [Google Scholar] [CrossRef]
- Li, J.; Michalkiewicz, B.; Min, J.; Ma, C.; Chen, X.; Gong, J.; Mijowska, E.; Tang, T. Selective preparation of biomas-derived porous carbon with controllable pore sizes toward highly efficient CO2 capture. Chem. Eng. J. 2019, 360, 250–259. [Google Scholar] [CrossRef]
- Bahamon, D.; Ogungbenro, A.E.; Khaleel, M.; Quang, D.V.; Abu-Zahra, M.R.P.; Vega, L.F. Performance of activated carbon from date seeds in CO2 swing adsorption determined by combining experimental and molecular simulation data. Ind. Eng. Chem. Res. 2020, 59, 7161–7173. [Google Scholar] [CrossRef]
- Park, D.; Hong, S.H.; Kim, K.M.; Lee, C.H. Adsorption equilibria and kinetics of silica gel for N2O, O2, N2, and CO2. Sep. Purif. Technol. 2020, 251, 117326. [Google Scholar] [CrossRef]
- Al Mesfer, M.K.; Danish, M.; Alwan, B.A.A.; Awwad, N.S. Performance study of activated carbon and silica gel for sorption of CO2 from a mixture of N2/CO2: Equilibrium, breakthrough and mass transfer zone. Desalin. Water Treat. 2020, 204, 413–428. [Google Scholar] [CrossRef]
- Wilson, S.M.; Kennedy, D.A.; Tezel, F.H. Adsorbent screening for CO2/CO separation for applications in syngas production. Sep. Purif. Technol. 2019, 227, 115178. [Google Scholar] [CrossRef]
- Shi, W.; Yang, H.; Shen, Y.; Fu, Q.; Zhang, D.; Fu, B. Two-stage PSA/VSA to produce H2 with CO2 capture via steam methane reforming. Int. J. Hydrog. Energy 2018, 43, 19057–19074. [Google Scholar] [CrossRef]
- Zhao, R.S.; Deng, S.; Wang, S.; Zhao, L.; Zhang, Y.; Liu, B.; Li, H.; Yu, Z. Thermodynamic research of adsorbent materials on energy efficiency of vacuum-pressure swing adsorption cycle for CO2 capture. Appl. Therm. Eng. 2018, 128, 818–829. [Google Scholar] [CrossRef]
- Younas, M.; Rezakazemi, M.; Daud, M.; Wazir, M.B.; Ahamd, S.; Ullah, N.; Inamuddin; Ramakrishna, S. Recent progress and remaining challenges in post-combustion CO2 capture using metal-organic frameworks (MOFs). Prog. Energy Combust. 2020, 80, 100849. [Google Scholar] [CrossRef]
- Ferella, F.; Puca, A.; Taglieri, G.; Rossi, L.; Gallucci, K. Separation of carbon dioxide for biogas upgrading to biomethane. J. Clean. Prod. 2017, 164, 1205–1218. [Google Scholar] [CrossRef]
- Jamil, F.; Al-Muhtaseb, A.H.; Naushed, M.; Baawain, M.; Al-Mamun, A.; Saxena, S.K.; Viswandham, N. Evaluation of green carbon catalyst from waste date pits for tertiary butylation of phenol. Arab. J. Chem. 2020, 13, 298–307. [Google Scholar] [CrossRef]
- Monazam, E.R.; Spenik, J.; Shadle, L.J. Fluid bed adsorption of carbon dioxide on immobilized polyethylenimine (PEI): Kinetic analysis and breakthrough behaviour. Chem. Eng. J. 2013, 223, 795–805. [Google Scholar] [CrossRef]
- Serna-Guerrero, R.; Sayari, A. Modeling adsorption of CO2 on amine functionalized mesoporous silica. 2: Kinetics and breakthrough curve. Chem. Eng. J. 2010, 161, 182–190. [Google Scholar] [CrossRef]
- Pota, A.A.; Mathews, A.P. Effect of particle stratification on fixed bed adsorber performance. J. Environ. Eng. 1999, 8, 705–711. [Google Scholar] [CrossRef]


| Measuring Instrument | Relative Error (δu/u) |
|---|---|
| Temperature sensor | ±0.0027 |
| Flow sensor–N2 | ±0.0100 |
| Flow sensor–CO2 | ±0.0200 |
| IR flow sensor–CO2 | ±0.0143 |
| Adsorbent Characteristics | SG | AC |
|---|---|---|
| Single point surface (m2/g) | 556.4 | 848.3 |
| Multipoint surface area (m2/g) | 572.2 | 821.7 |
| Langmuir surface area (m2/g) | 1038.0 | 956.9 |
| Pore volume (cm3/g) | 0.06 | 0.45 |
| Pore size (Å) | 20.45 | 22.68 |
| Adsorbent | Temperature (°C) | Pressure (bar) | Adsorption Capacity (mmol/g) | References |
|---|---|---|---|---|
| Date stone | 20 | 1 | 3.5 | [50] |
| Date sheet | 0 | 1 | 6.4 | [51] |
| Date sheet | 25 | 1 | 4.4 | [51] |
| Date sheet | 25 | 40 | 22 | [51] |
| Date stone | 40 | 0.14 | 2.7 | [52] |
| Silica gel | 20 | 10 | 9.8 | [54] |
| Silica gel | 30 | 10 | 2.9 | [56] |
| Silica gel | 25 | 2 | 0.4 | [59] |
| Silica gel | 25 | 6 | 1.1 | [59] |
| Date stone | 25 | 1.3 | 1.7 | [This study] |
| Silica gel | 25 | 1.3 | 0.2 | [This study] |
| T (K) | F (lpm) | Co (vol.%) | SG | AC | ||
|---|---|---|---|---|---|---|
| LMTZ (cm) | f | LMTZ (cm) | f | |||
| 298 | 4 | 5 | 11.05 | 0.770 | 1.39 | 0.971 |
| 308 | 4 | 5 | 11.14 | 0.789 | 1.53 | 0.968 |
| 318 | 4 | 5 | 11.78 | 0.755 | 1.73 | 0.964 |
| 328 | 4 | 5 | 11.42 | 0.762 | 1.49 | 0.969 |
| 298 | 2 | 5 | 7.61 | 0.842 | 1.48 | 0.969 |
| 298 | 3 | 5 | 9.32 | 0.806 | 1.50 | 0.969 |
| 298 | 5 | 5 | 12.07 | 0.875 | 1.54 | 0.968 |
| 298 | 4 | 2 | 10.40 | 0.783 | 1.81 | 0.962 |
| 298 | 4 | 3 | 9.57 | 0.801 | 1.49 | 0.969 |
| 298 | 4 | 4 | 8.94 | 0.814 | 1.25 | 0.955 |
Publisher’s Note: MDPI stays neutral with regard to jurisdictional claims in published maps and institutional affiliations. |
© 2021 by the authors. Licensee MDPI, Basel, Switzerland. This article is an open access article distributed under the terms and conditions of the Creative Commons Attribution (CC BY) license (https://creativecommons.org/licenses/by/4.0/).
Share and Cite
Danish, M.; Parthasarthy, V.; Al Mesfer, M.K. CO2 Capture by Low-Cost Date Pits-Based Activated Carbon and Silica Gel. Materials 2021, 14, 3885. https://doi.org/10.3390/ma14143885
Danish M, Parthasarthy V, Al Mesfer MK. CO2 Capture by Low-Cost Date Pits-Based Activated Carbon and Silica Gel. Materials. 2021; 14(14):3885. https://doi.org/10.3390/ma14143885
Chicago/Turabian StyleDanish, Mohd, Vijay Parthasarthy, and Mohammed K. Al Mesfer. 2021. "CO2 Capture by Low-Cost Date Pits-Based Activated Carbon and Silica Gel" Materials 14, no. 14: 3885. https://doi.org/10.3390/ma14143885
APA StyleDanish, M., Parthasarthy, V., & Al Mesfer, M. K. (2021). CO2 Capture by Low-Cost Date Pits-Based Activated Carbon and Silica Gel. Materials, 14(14), 3885. https://doi.org/10.3390/ma14143885