
Influence of Different Solvents and High-Electric-Field Cycling on Morphology and Ferroelectric Behavior of Poly(Vinylidene Fluoride-Hexafluoropropylene) Films


Abstract
:1. Introduction
2. Materials and Methods
2.1. Material Preparation
2.2. Structural Characterization
2.3. Electrical Characterization
3. Results
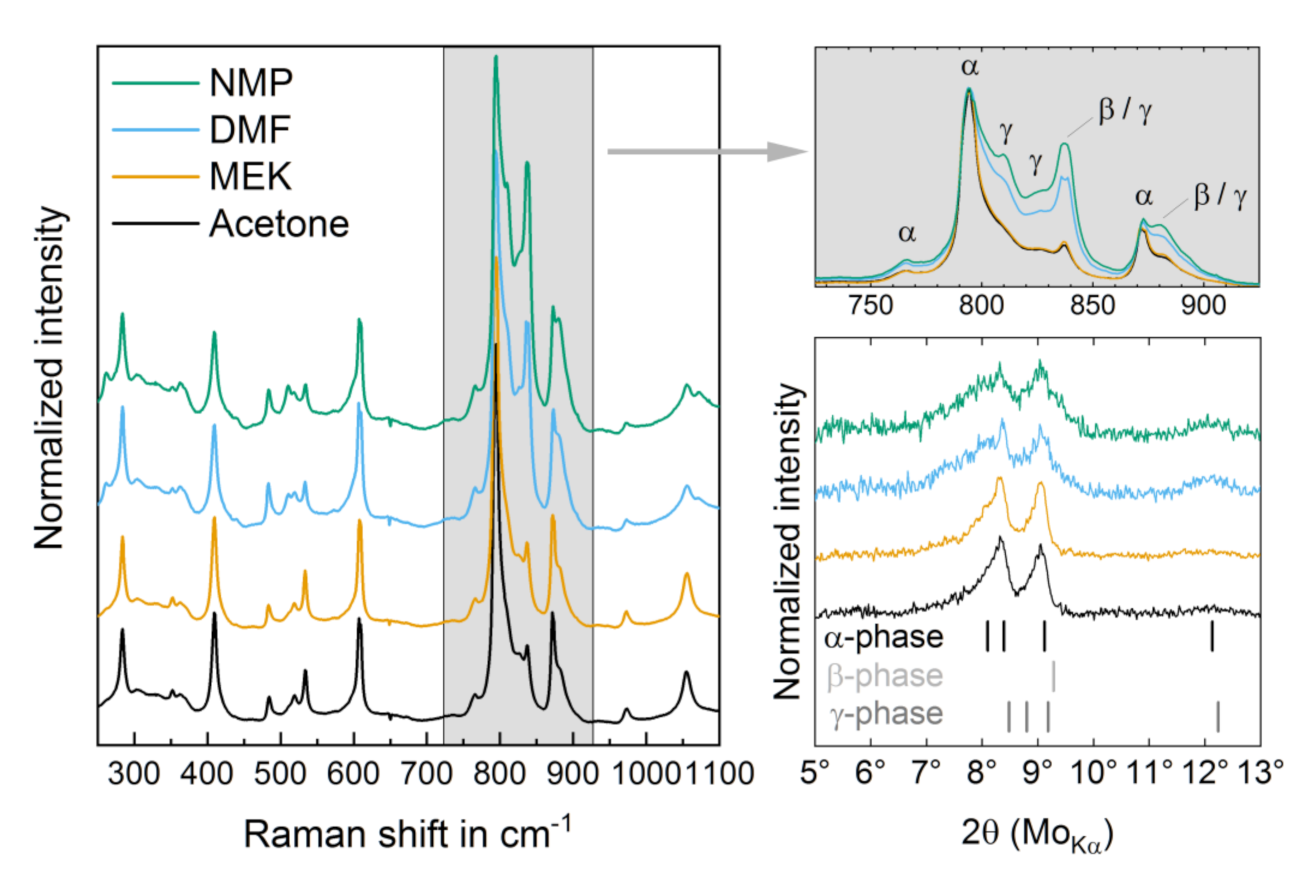
3.1. Structural Properties
3.2. High-Electric-Field D-E Characteristics
3.2.1. Breakdown Strength
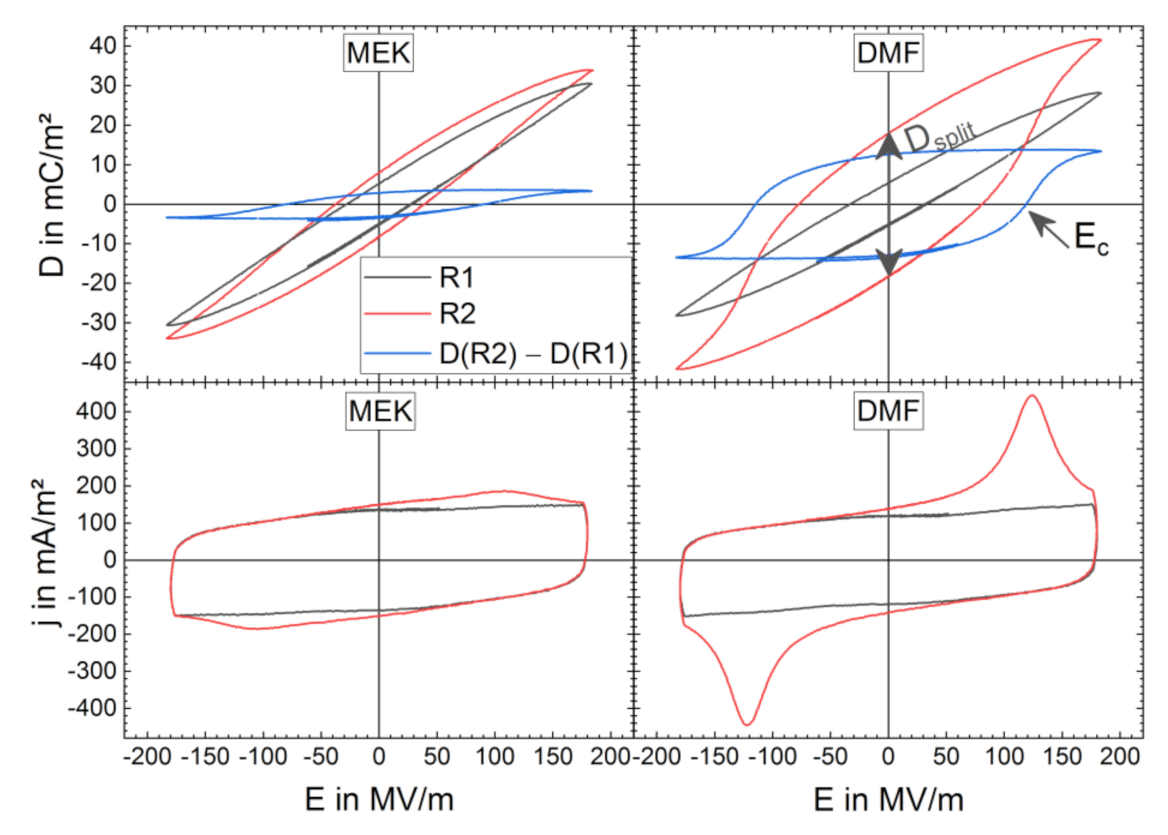
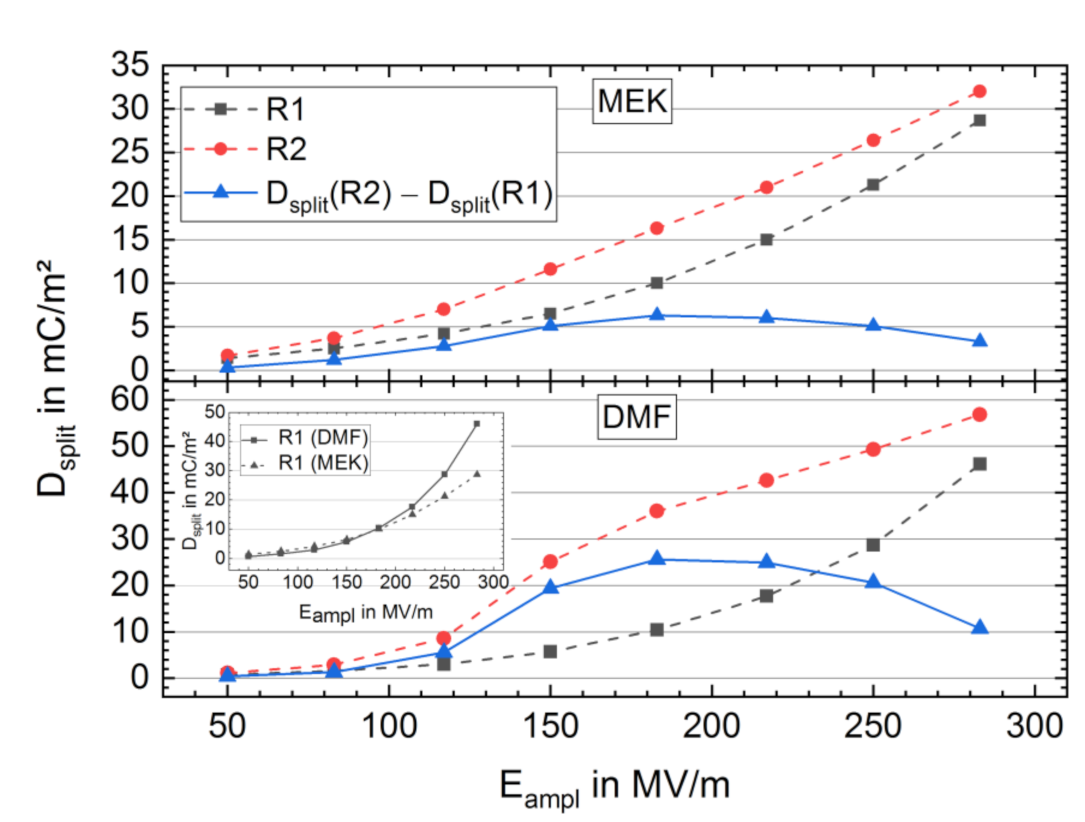
3.2.2. Bipolar D-E Characteristics
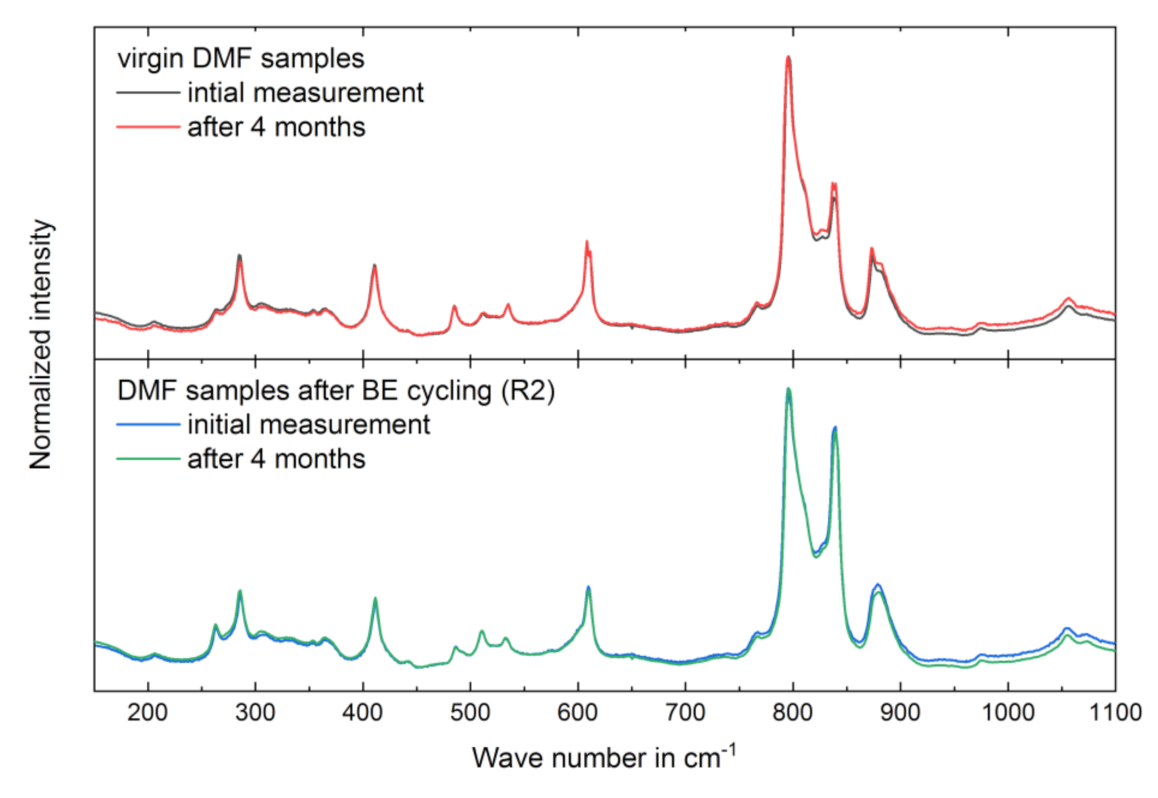
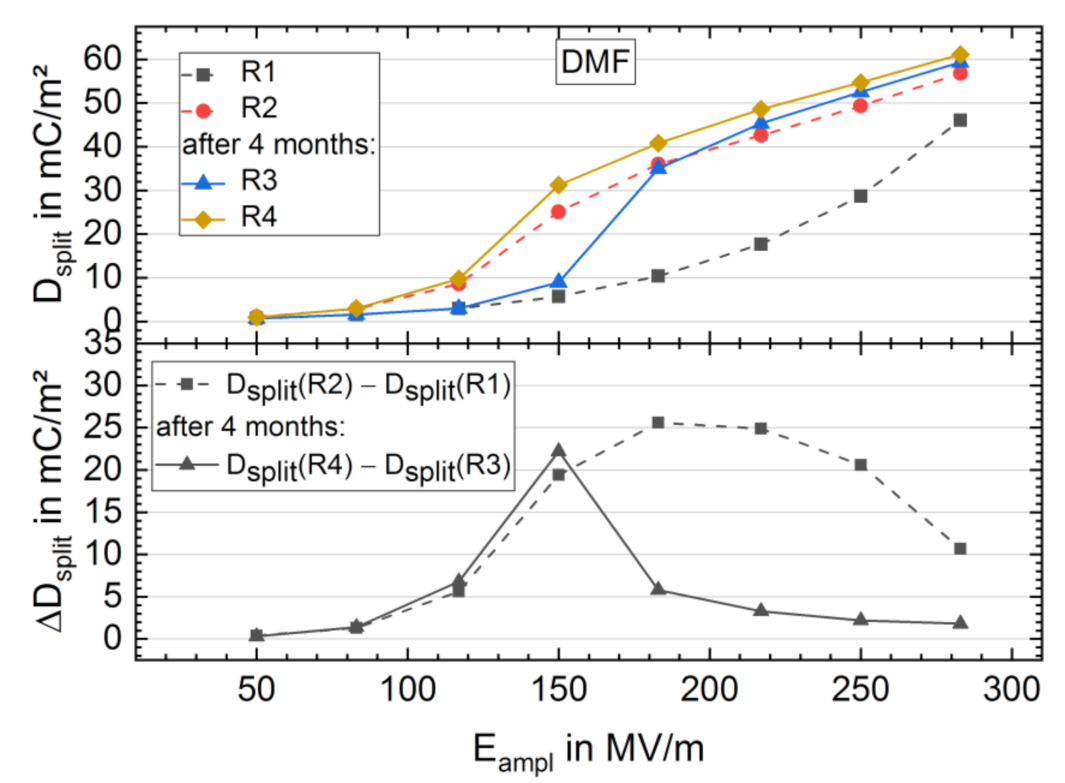
3.3. Long-Term Stability of the BE Treated Samples
4. Discussion
- A shielding effect that prevents dipoles of existing polar phase from polarization reversal during the BE cycling;
- The formation of further polar phase from amorphous phase or via a crystalline phase transition;
- The reorientation of dipole moments and cooperative rotation of the chain axes in the existing polar phase.
5. Conclusions
Supplementary Materials
Author Contributions
Funding
Institutional Review Board Statement
Informed Consent Statement
Data Availability Statement
Acknowledgments
Conflicts of Interest
References
- Gonçalves, R.; Miranda, D.; Almeida, A.M.; Silva, M.M.; Meseguer-Dueñas, J.M.; Ribelles, J.G.; Lanceros-Méndez, S.; Costa, C.M. Solid polymer electrolytes based on lithium bis(trifluoromethanesulfonyl)imide/poly(vinylidene fluoride -co-hexafluoropropylene) for safer rechargeable lithium-ion batteries. Sustain. Mater. Technol. 2019, 21, e00104. [Google Scholar] [CrossRef] [Green Version]
- Martins, P.; Lopes, A.C.; Lanceros-Mendez, S. Electroactive phases of poly (vinylidene fluoride): Determination, processing and applications. Prog. Polym. Sci. 2014, 39, 683–706. [Google Scholar] [CrossRef]
- Kang, G.-D.; Cao, Y. Application and modification of poly (vinylidene fluoride) (PVDF) membranes–A review. J. Membr. Sci. 2014, 463, 145–165. [Google Scholar] [CrossRef]
- Gozdz, A.S.; Schmutz, C.N.; Tarascon, J.M. Rechargeable lithium Intercalation Battery with Hybrid Polymeric Electrolyte. U.S. Patent 08,026,904 22 March 1994. [Google Scholar]
- Abbrent, S.; Plestil, J.; Hlavata, D.; Lindgren, J.; Tegenfeldt, J.; Wendsjö, Å. Crystallinity and morphology of PVdF–HFP-based gel electrolytes. Polymer 2001, 42, 1407–1416. [Google Scholar] [CrossRef]
- Yang, Y.; Ramalingam, S.; Wu, G.; Hsu, S.L.; Kleiner, L.W.; Tang, F.-W.; Ding, N.; Hossainy, S. Perturbing effects of bulky comonomers on the chain conformation of poly(vinylidene fluoride). Polymer 2008, 49, 1926–1933. [Google Scholar] [CrossRef]
- Bachmann, M.A.; Koenig, J.L. Vibrational analysis of phase III of poly (vinylidene fluoride). J. Chem. Phys. 1981, 74, 5896–5910. [Google Scholar] [CrossRef]
- Kobayashi, M.; Tashiro, K.; Tadokoro, H. Molecular Vibrations of Three Crystal Forms of Poly (vinylidene fluoride). Macromolecules 1975, 8, 158–171. [Google Scholar] [CrossRef]
- Lovinger, A.J. Annealing of poly (vinylidene fluoride) and formation of a fifth phase. Macromolecules 1982, 15, 40–44. [Google Scholar] [CrossRef]
- Tashiro, K.; Kobayashi, M.; Tadokoro, H. Vibrational spectra and disorder-order transition of poly (vinylidene fluoride) form III. Macromolecules 1981, 14, 1757–1764. [Google Scholar] [CrossRef]
- Zhu, Q.; Sharma, V.; Oganov, A.R.; Ramprasad, R. Predicting polymeric crystal structures by evolutionary algorithms. J. Chem. Phys. 2014, 141, 154102. [Google Scholar] [CrossRef] [Green Version]
- Neese, B.; Wang, Y.; Chu, B.; Ren, K.; Liu, S.; Zhang, Q.M.; Huang, C.; West, J. Piezoelectric responses in poly (vinylidene fluoride/hexafluoropropylene) copolymers. Appl. Phys. Lett. 2007, 90, 242917. [Google Scholar] [CrossRef]
- Benz, M.; Euler, W.B. Determination of the crystalline phases of poly (vinylidene fluoride) under different preparation conditions using differential scanning calorimetry and infrared spectroscopy. J. Appl. Polym. Sci. 2003, 89, 1093–1100. [Google Scholar] [CrossRef]
- Zhao, Y.; Yang, W.; Zhou, Y.; Chen, Y.; Cao, X.; Yang, Y.; Xu, J.; Jiang, Y. Effect of crystalline phase on the dielectric and energy storage properties of poly(vinylidene fluoride). J. Mater. Sci. Mater. Electron. 2016, 27, 7280–7286. [Google Scholar] [CrossRef]
- Buonomenna, M.G.; Macchi, P.; Davoli, M.; Drioli, E. Poly (vinylidene fluoride) membranes by phase inversion: The role the casting and coagulation conditions play in their morphology, crystalline structure and properties. Eur. Polym. J. 2007, 43, 1557–1572. [Google Scholar] [CrossRef]
- Boccaccio, T.; Bottino, A.; Capannelli, G.; Piaggio, P. Characterization of PVDF membranes by vibrational spectroscopy. J. Membr. Sci. 2002, 210, 315–329. [Google Scholar] [CrossRef]
- Threlfall, T. Crystallisation of Polymorphs: Thermodynamic Insight into the Role of Solvent. Org. Process Res. Dev. 2000, 4, 384–390. [Google Scholar] [CrossRef]
- Cortili, G.; Zerbi, G. Chain conformations of polyvinylidene fluoride as derived from its vibrational spectrum. Spectrochim. Acta Part A Mol. Spectrosc. 1967, 23, 285–299. [Google Scholar] [CrossRef]
- Broadhurst, M.G.; Davis, G.T.; McKinney, J.E.; Collins, R.E. Piezoelectricity and pyroelectricity in polyvinylidene fluoride—A model. J. Appl. Phys. 1978, 49, 4992–4997. [Google Scholar] [CrossRef]
- El Mohajir, B.-E.; Heymans, N. Changes in structural and mechanical behaviour of PVDF with processing and thermomechanical treatments. 1. Change in structure. Polymer 2001, 42, 5661–5667. [Google Scholar] [CrossRef]
- Prest, W.M.; Luca, D.J. The formation of the γ phase from the α and β polymorphs of polyvinylidene fluoride. J. Appl. Phys. 1978, 49, 5042–5047. [Google Scholar] [CrossRef]
- Benz, M.; Euler, W.B.; Gregory, O.J. The Role of Solution Phase Water on the Deposition of Thin Films of Poly (vinylidene fluoride). Macromolecules 2002, 35, 2682–2688. [Google Scholar] [CrossRef]
- Weinhold, S.; Litt, M.H.; Lando, J.B. The Crystal Structure of the γ Phase of Poly (vinylidene fluoride). Macromolecules 1980, 13, 1178–1183. [Google Scholar] [CrossRef]
- Li, M.; Katsouras, I.; Piliego, C.; Glasser, G.; Lieberwirth, I.; Blom, P.W.M.; de Leeuw, D.M. Controlling the microstructure of poly(vinylidene-fluoride) (PVDF) thin films for microelectronics. J. Mater. Chem. C 2013, 1, 7695. [Google Scholar] [CrossRef] [Green Version]
- Jacob, M. Effect of PEO addition on the electrolytic and thermal properties of PVDF-LiClO4 polymer electrolytes. Solid State Ion. 1997, 104, 267–276. [Google Scholar] [CrossRef]
- Baskaran, R.; Selvasekarapandian, S.; Kuwata, N.; Kawamura, J.; Hattori, T. ac impedance, DSC and FT-IR investigations on (x)PVAc–(1−x) PVdF blends with LiClO4. Mater. Chem. Phys. 2006, 98, 55–61. [Google Scholar] [CrossRef]
- Hansen, C.M. Hansen Solubility Parameters; CRC Press: Boca Raton, FL, USA, 2007; ISBN 9780429127526. [Google Scholar]
- Glazer, A.M.; Groves, P.; Smith, D.T. Automatic sampling circuit for ferroelectric hysteresis loops. J. Phys. E Sci. Instrum. 1984, 17, 95–97. [Google Scholar] [CrossRef]
- Tomer, V.; Manias, E.; Randall, C.A. High field properties and energy storage in nanocomposite dielectrics of poly (vinylidene fluoride-hexafluoropropylene). J. Appl. Phys. 2011, 110, 44107. [Google Scholar] [CrossRef] [Green Version]
- Chung, T.C.; Petchsuk, A. Synthesis and Properties of Ferroelectric Fluoroterpolymers with Curie Transition at Ambient Temperature. Macromolecules 2002, 35, 7678–7684. [Google Scholar] [CrossRef]
- Tarascon, J.-M.; Gozdz, A.S.; Schmutz, C.; Shokoohi, F.; Warren, P.C. Performance of Bellcore’s plastic rechargeable Li-ion batteries. Solid State Ionics 1996, 86-88, 49–54. [Google Scholar] [CrossRef]
- Wang, X.; Xiao, C.; Liu, H.; Huang, Q.; Fu, H. Fabrication and properties of PVDF and PVDF-HFP microfiltration membranes. J. Appl. Polym. Sci. 2018, 135, 46711. [Google Scholar] [CrossRef]
- Rinaldo, G., Jr.; Marcelo, C. Effect of Crystallization Temperature on the Crystalline Phase Content and Morphology of Poly (vinylidene Fluoride). J. Polym. Sci. Part B Polym. Phys. 1994, 32, 859–870. [Google Scholar]
- Nakagawa, K.; Ishida, Y. Annealing effects in poly (vinylidene fluoride) as revealed by specific volume measurements, differential scanning calorimetry, and electron microscopy. J. Polym. Sci. Polym. Phys. Ed. 1973, 11, 2153–2171. [Google Scholar] [CrossRef]
- Developments in Crystalline Polymers-1: Poly (Vinylidene Fluoride); Andrew, J.L.; Bassett, D.C. (Eds.) Springer: Dordrecht, The Netherlands, 1982; ISBN 9789400973459. [Google Scholar]
- Malmonge, L.F.; Malmonge, J.A.; Sakamoto, W.K. Study of pyroelectric activity of PZT/PVDF-HFP composite. Mat. Res. 2003, 6, 469–473. [Google Scholar] [CrossRef]
- Prabakaran, K.; Mohanty, S.; Nayak, S.K. Influence of surface modified nanoclay on electrochemical properties of PVDF-HFP composite electrolytes. Int. J. Plast. Technol. 2014, 18, 349–361. [Google Scholar] [CrossRef]
- Li, W.; Meng, Q.; Zheng, Y.; Zhang, Z.; Xia, W.; Xu, Z. Electric energy storage properties of poly (vinylidene fluoride). Appl. Phys. Lett. 2010, 96, 192905. [Google Scholar] [CrossRef]
- Simoes, R.D.; Job, A.E.; Chinaglia, D.L.; Zucolotto, V.; Camargo-Filho, J.C.; Alves, N.; Giacometti, J.A.; Oliveira, O.N.; Constantino, C.J.L. Structural characterization of blends containing both PVDF and natural rubber latex. J. Raman. Spectrosc. 2005, 36, 1118–1124. [Google Scholar] [CrossRef]
- Mattsson, B.; Ericson, H.; Torell, L.M.; Sundholm, F. Micro-Raman investigations of PVDF-based proton-conducting membranes. J. Polym. Sci. A Polym. Chem. 1999, 37, 3317–3327. [Google Scholar] [CrossRef]
- Barber, P.; Balasubramanian, S.; Anguchamy, Y.; Gong, S.; Wibowo, A.; Gao, H.; Ploehn, H.J.; Zur Loye, H.-C. Polymer Composite and Nanocomposite Dielectric Materials for Pulse Power Energy Storage. Materials 2009, 2, 1697–1733. [Google Scholar] [CrossRef]
- Scott, J.F. Ferroelectrics go bananas. J. Phys. Condens. Matter. 2008, 20, 21001. [Google Scholar] [CrossRef] [Green Version]
- Band, T.; Mälzer, T.; Wickert, S.; Leipner, H.S.; Ebbinghaus, S.G.; Dörr, K.; Diestelhorst, M. Three different mechanisms of self-discharge behavior in poly (vinylidene fluoride-hexafluoropropylene) for dielectric energy storage. J. Phys. Energy 2019, 1, 25001. [Google Scholar] [CrossRef]
- Schenk, T.; Yurchuk, E.; Mueller, S.; Schroeder, U.; Starschich, S.; Böttger, U.; Mikolajick, T. About the deformation of ferroelectric hystereses. Appl. Phys. Rev. 2014, 1, 41103. [Google Scholar] [CrossRef]
- Meyer, R.; Waser, R.; Prume, K.; Schmitz, T.; Tiedke, S. Dynamic leakage current compensation in ferroelectric thin-film capacitor structures. Appl. Phys. Lett. 2005, 86, 142907. [Google Scholar] [CrossRef]
- Furukawa, T. Ferroelectric properties of vinylidene fluoride copolymers. Phase Transit. 1989, 18, 143–211. [Google Scholar] [CrossRef]
- Peter, C.; Kliem, H. Ferroelectric imprint and polarization in the amorphous phase in P (VDF-TrFE). J. Appl. Phys. 2019, 125, 174107. [Google Scholar] [CrossRef]
- Lovinger, A.J. Conformational defects and associated molecular motions in crystalline poly (vinylidene fluoride). J. Appl. Phys. 1981, 52, 5934–5938. [Google Scholar] [CrossRef]
- Takahashi, T.; Date, M.; Fukada, E. Dielectric hysteresis and rotation of dipoles in polyvinylidene fluoride. Appl. Phys. Lett. 1980, 37, 791–793. [Google Scholar] [CrossRef]
- Lovinger, A.J. Crystalline transformations in spherulites of poly (vinylidene fluoride). Polymer 1980, 21, 1317–1322. [Google Scholar] [CrossRef]
- Hsu, S.L.; Lu, F.J.; Waldman, D.A.; Muthukumar, M. Analysis of the crystalline phase transformation of poly (vinylidene fluoride). Macromolecules 1985, 18, 2583–2587. [Google Scholar] [CrossRef]
- Southgate, P.D. Room-temperature poling and morphology changes in pyroelectric polyvinylidene fluoride. Appl. Phys. Lett. 1976, 28, 250–252. [Google Scholar] [CrossRef]
- Kepler, R.G. Ferroelectric, Pyroelectric, and Piezoelectric Properties of Poly (vinylidene Fluoride). In Ferroelectric Polymers: Chemistry: Physics, and Applications; Nalwa, H.S., Ed.; Chapman and Hall; CRC: Boca Raton, FL, USA, 1995; pp. 183–232. ISBN 9780429080647. [Google Scholar]
- Tashiro, K. Crystal Structure and Phase Transition of PVDF and Related Copolymers. In Ferroelectric Polymers: Chemistry: Physics, and Applications; Nalwa, H.S., Ed.; Chapman and Hall; CRC: Boca Raton, FL, USA, 1995; pp. 63–180. ISBN 9780429080647. [Google Scholar]
- Fang, F.; Yang, W.; Zhang, M.Z. Electric fatigue in poly (vinylidene fluoride-trifluoroethylene) 68/32 copolymer films under cyclic electric field. J. Appl. Phys. 2007, 101, 44902. [Google Scholar] [CrossRef]
- Guan, F.; Pan, J.; Wang, J.; Wang, Q.; Zhu, L. Crystal Orientation Effect on Electric Energy Storage in Poly (vinylidene fluoride- co -hexafluoropropylene) Copolymers. Supporting information. Macromolecules 2010, 43, 384–392. [Google Scholar] [CrossRef]
- Fang, F.; Yang, W.; Jia, C.; Luo, X. Polarization enhancement for poly (vinylidene fluoride-trifluoroethylene) 75/25 copolymer films by interlayer ordering under cyclic electric field. Appl. Phys. Lett. 2008, 92, 222906. [Google Scholar] [CrossRef]
- Li, Z.-M.; Li, S.-Q.; Cheng, Z.-Y. Crystalline structure and transition behavior of recrystallized-irradiated P(VDF-TrFE) 65/35 copolymer. J. Appl. Phys. 2005, 97, 14102. [Google Scholar] [CrossRef]
- Li, Z.; Wang, Y.; Cheng, Z.-Y. Electromechanical properties of poly(vinylidene-fluoride-chlorotrifluoroethylene) copolymer. Appl. Phys. Lett. 2006, 88, 62904. [Google Scholar] [CrossRef]
- Mabuchi, Y.; Nakajima, T.; Furukawa, T.; Okamura, S. Electric-Field-Induced Polarization Enhancement of Vinylidene Fluoride/Trifluoroethylene Copolymer Ultrathin Films. Appl. Phys. Express 2011, 4, 71501. [Google Scholar] [CrossRef]


| Solvent | Boiling Point in °C | Vapor Pressure at 20 °C in hPa | Density at 20 °C in g/cm3 |
|---|---|---|---|
| Acetone (HVS) | 56 | 244 | 0.79 |
| MEK (HVS) | 80 | 105 | 0.81 |
| DMF (LVS) | 153 | 3.77 | 0.95 |
| NMP (LVS) | 202 | 0.32 | 1.03 |
| Solvent | Temperature of Process Ta- ble in °C | Intensity of Infra-Red Lamp in % of 1 kW | Temperature of Convection Dryer in °C | Time When Samples Ap- pear Optically Dry in s | Total Dwell Time under IR-Lamp in min |
|---|---|---|---|---|---|
| Acetone (HVS) | 25 | 25 | 25 | 10 | 1 |
| MEK (HVS) | 40 | 25 | 40 | 20 | 1 |
| DMF (LVS) | 80 | 100 | 60 | 60 | 5 |
| NMP (LVS) | 80 | 100 | 60 | 360 | 10 |
| Solvent | Surface Rough- ness (RMS) in nm | Crystalline P(VdF) Phase | BDS in MV/m | Energy Density in MJ/m3 |
|---|---|---|---|---|
| Acetone (HVS) | 14 | α | 525 (±10%) | – |
| MEK (HVS) | 12 | α | 405 (±10%) | 1.95 (±10%) |
| DMF (LVS) | 22 | α + γ | 460 (±10%) | 1.78 (±10%) |
| NMP (LVS) | 34 | α + γ | 435 (±10%) | – |
| Solvent | I (840 cm−1)/I (795 cm−1) |
|---|---|
| Acetone (HVS) | 0.21 ± 0.01 |
| MEK (HVS) | 0.24 ± 0.02 |
| DMF (LVS) | 0.54 ± 0.06 |
| NMP (LVS) | 0.72 ± 0.12 |
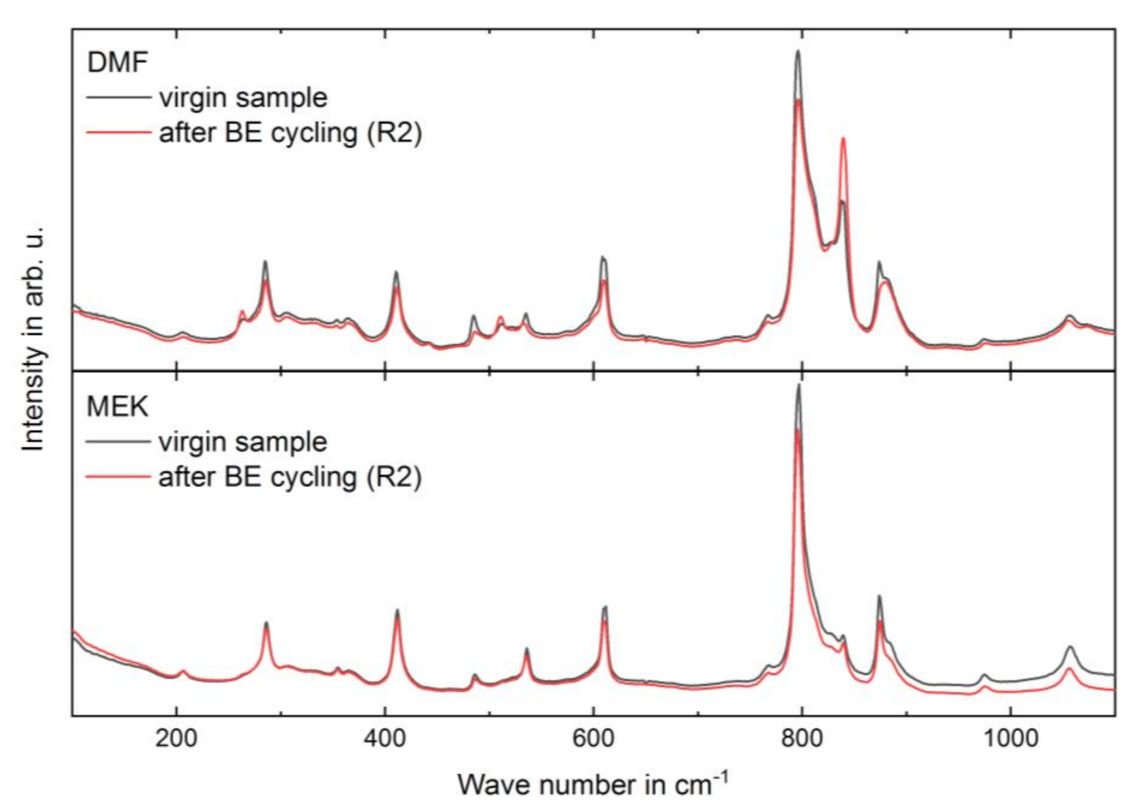
| Solvent | Electrical Treatment | I (840 cm−1)/I (795 cm−1) |
|---|---|---|
| MEK (HVS) | virgin sample | 0.18 ± 0.02 |
| after BE cycling (R2) | 0.21 ± 0.02 | |
| DMF (LVS) | virgin sample | 0.53 ± 0.05 |
| after BE cycling (R2) | 0.87 ± 0.13 |
Publisher’s Note: MDPI stays neutral with regard to jurisdictional claims in published maps and institutional affiliations. |
© 2021 by the authors. Licensee MDPI, Basel, Switzerland. This article is an open access article distributed under the terms and conditions of the Creative Commons Attribution (CC BY) license (https://creativecommons.org/licenses/by/4.0/).
Share and Cite
Mälzer, T.; Mathies, L.; Band, T.; Gorgas, R.; Leipner, H.S. Influence of Different Solvents and High-Electric-Field Cycling on Morphology and Ferroelectric Behavior of Poly(Vinylidene Fluoride-Hexafluoropropylene) Films. Materials 2021, 14, 3884. https://doi.org/10.3390/ma14143884
Mälzer T, Mathies L, Band T, Gorgas R, Leipner HS. Influence of Different Solvents and High-Electric-Field Cycling on Morphology and Ferroelectric Behavior of Poly(Vinylidene Fluoride-Hexafluoropropylene) Films. Materials. 2021; 14(14):3884. https://doi.org/10.3390/ma14143884
Chicago/Turabian StyleMälzer, Till, Lena Mathies, Tino Band, Robert Gorgas, and Hartmut S. Leipner. 2021. "Influence of Different Solvents and High-Electric-Field Cycling on Morphology and Ferroelectric Behavior of Poly(Vinylidene Fluoride-Hexafluoropropylene) Films" Materials 14, no. 14: 3884. https://doi.org/10.3390/ma14143884
APA StyleMälzer, T., Mathies, L., Band, T., Gorgas, R., & Leipner, H. S. (2021). Influence of Different Solvents and High-Electric-Field Cycling on Morphology and Ferroelectric Behavior of Poly(Vinylidene Fluoride-Hexafluoropropylene) Films. Materials, 14(14), 3884. https://doi.org/10.3390/ma14143884