
The Effect of Various Si/Al, Na/Al Molar Ratios and Free Water on Micromorphology and Macro-Strength of Metakaolin-Based Geopolymer


Abstract
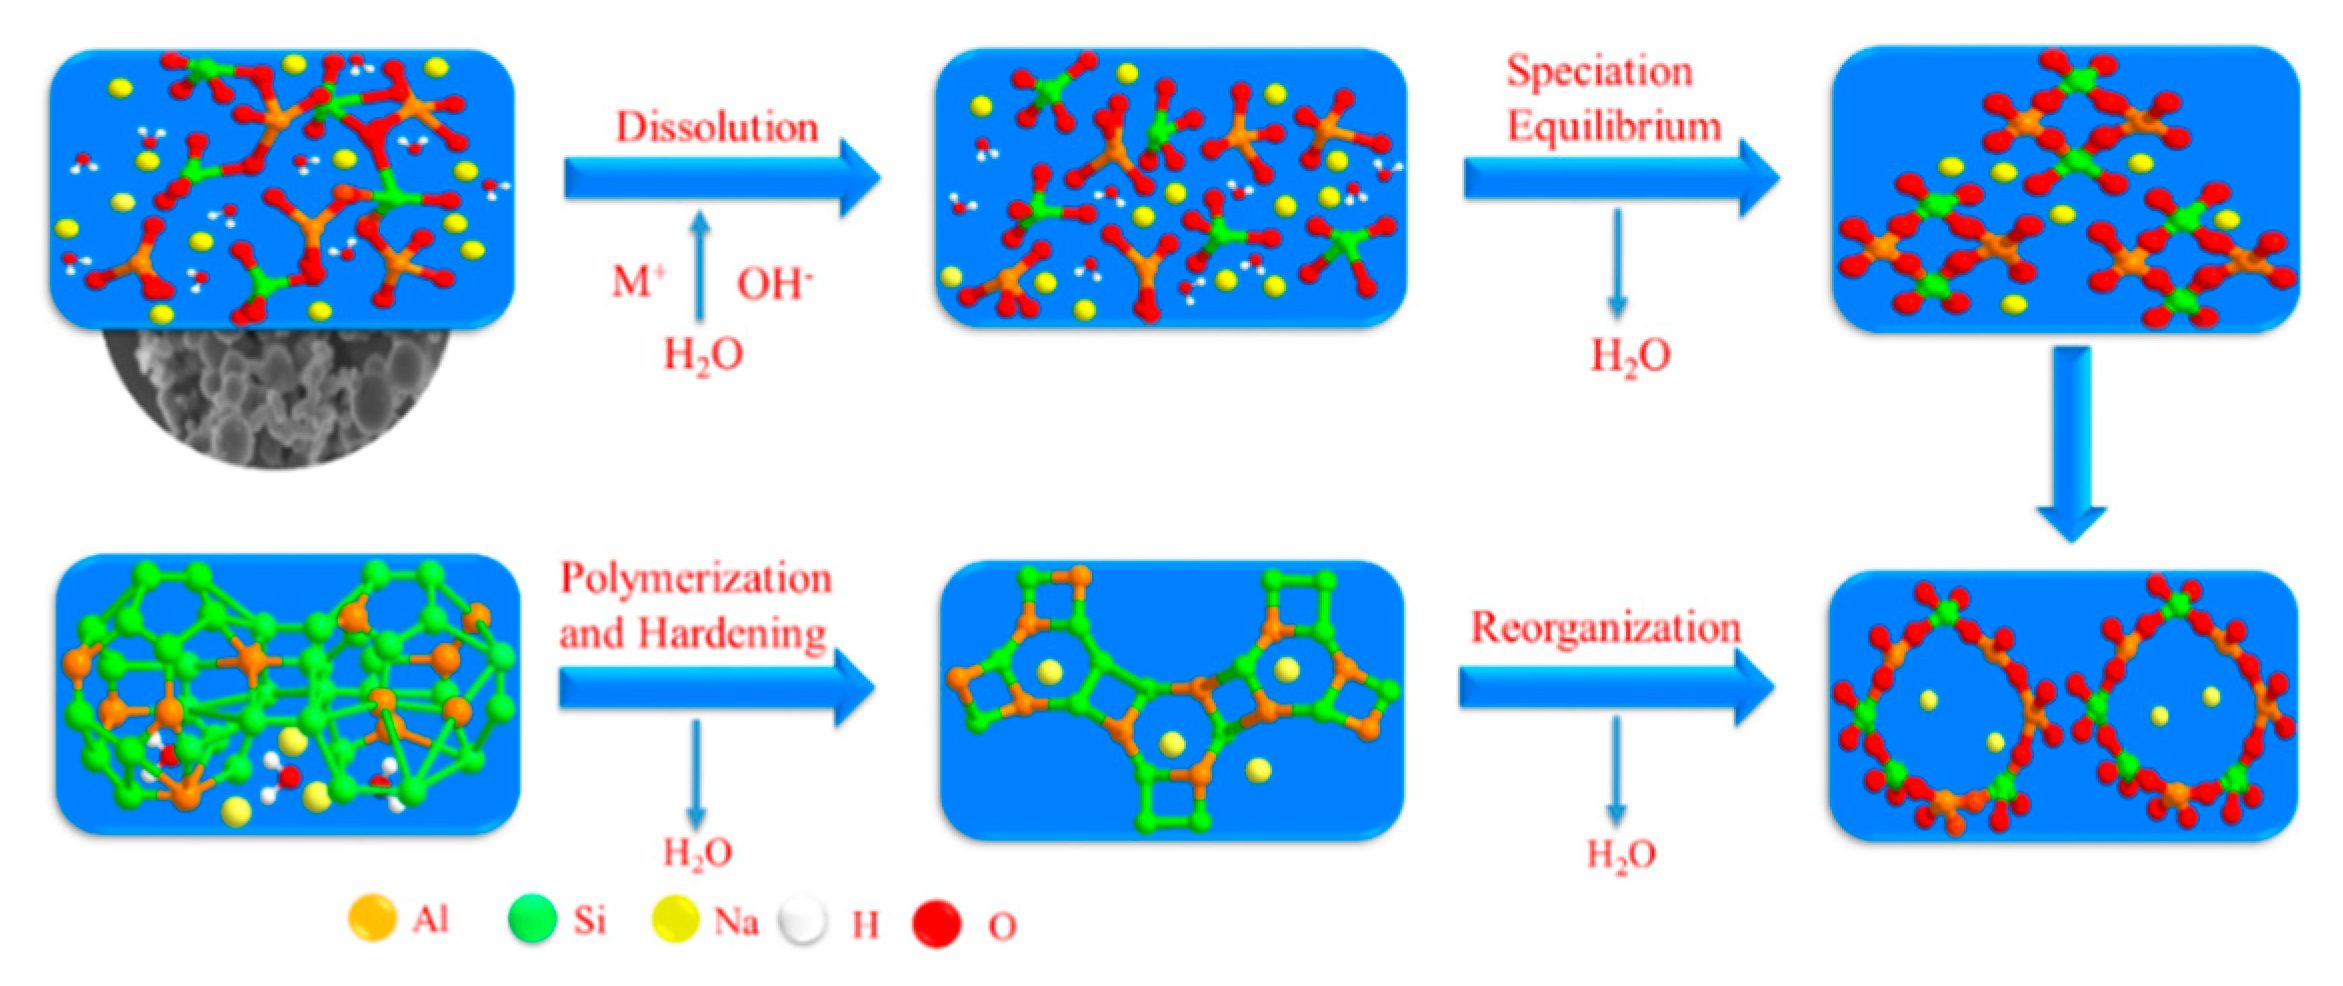
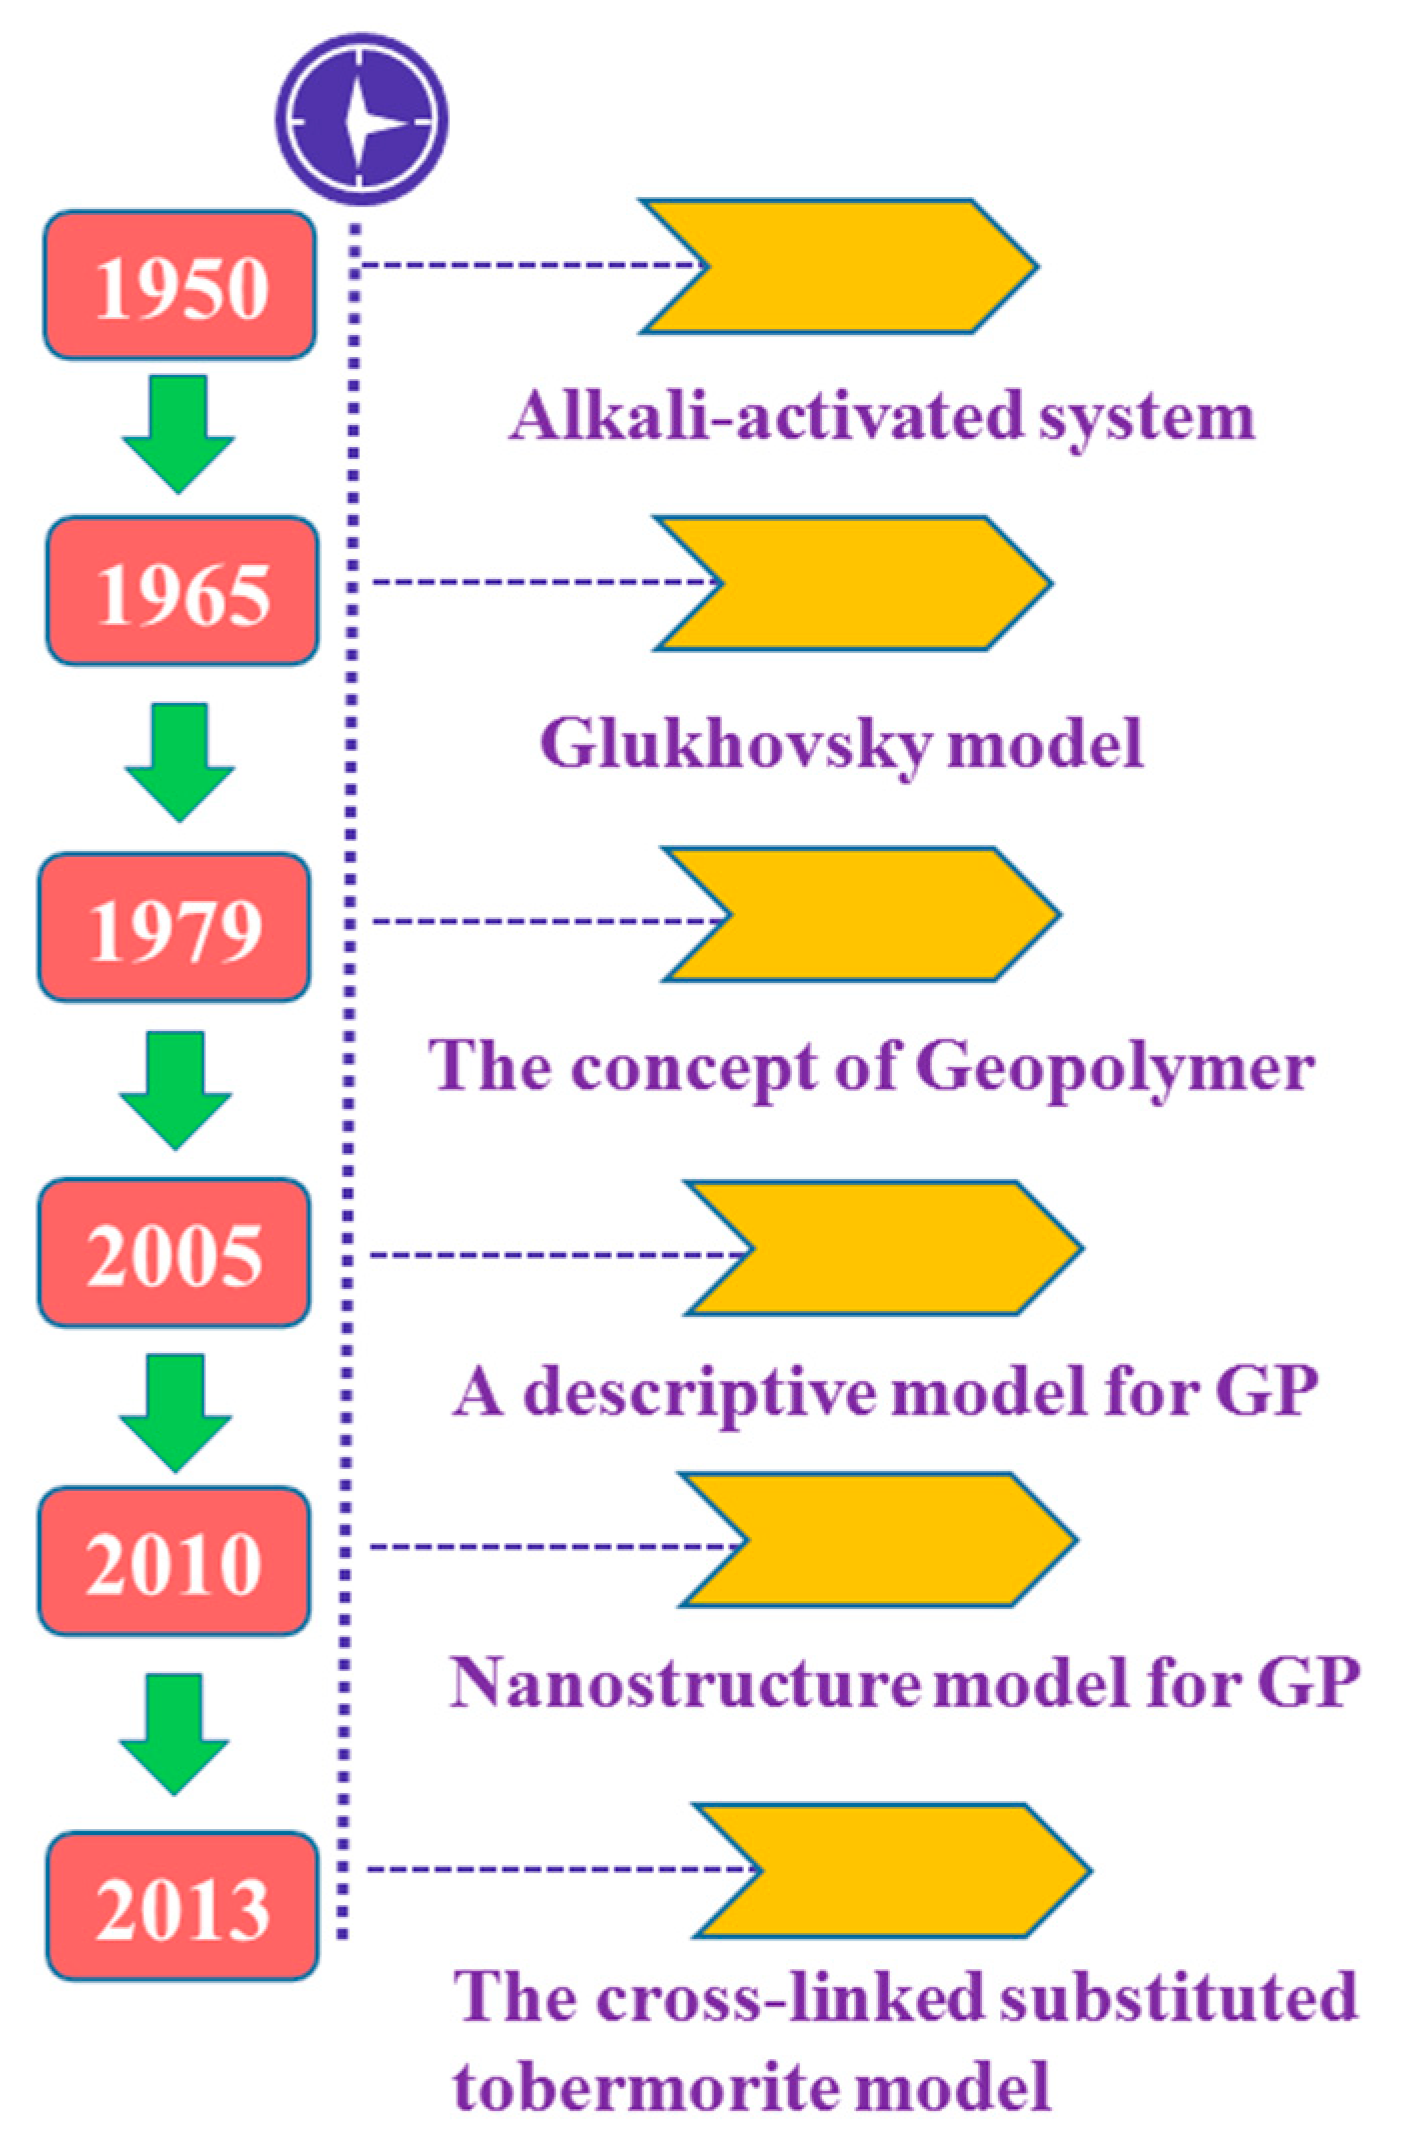
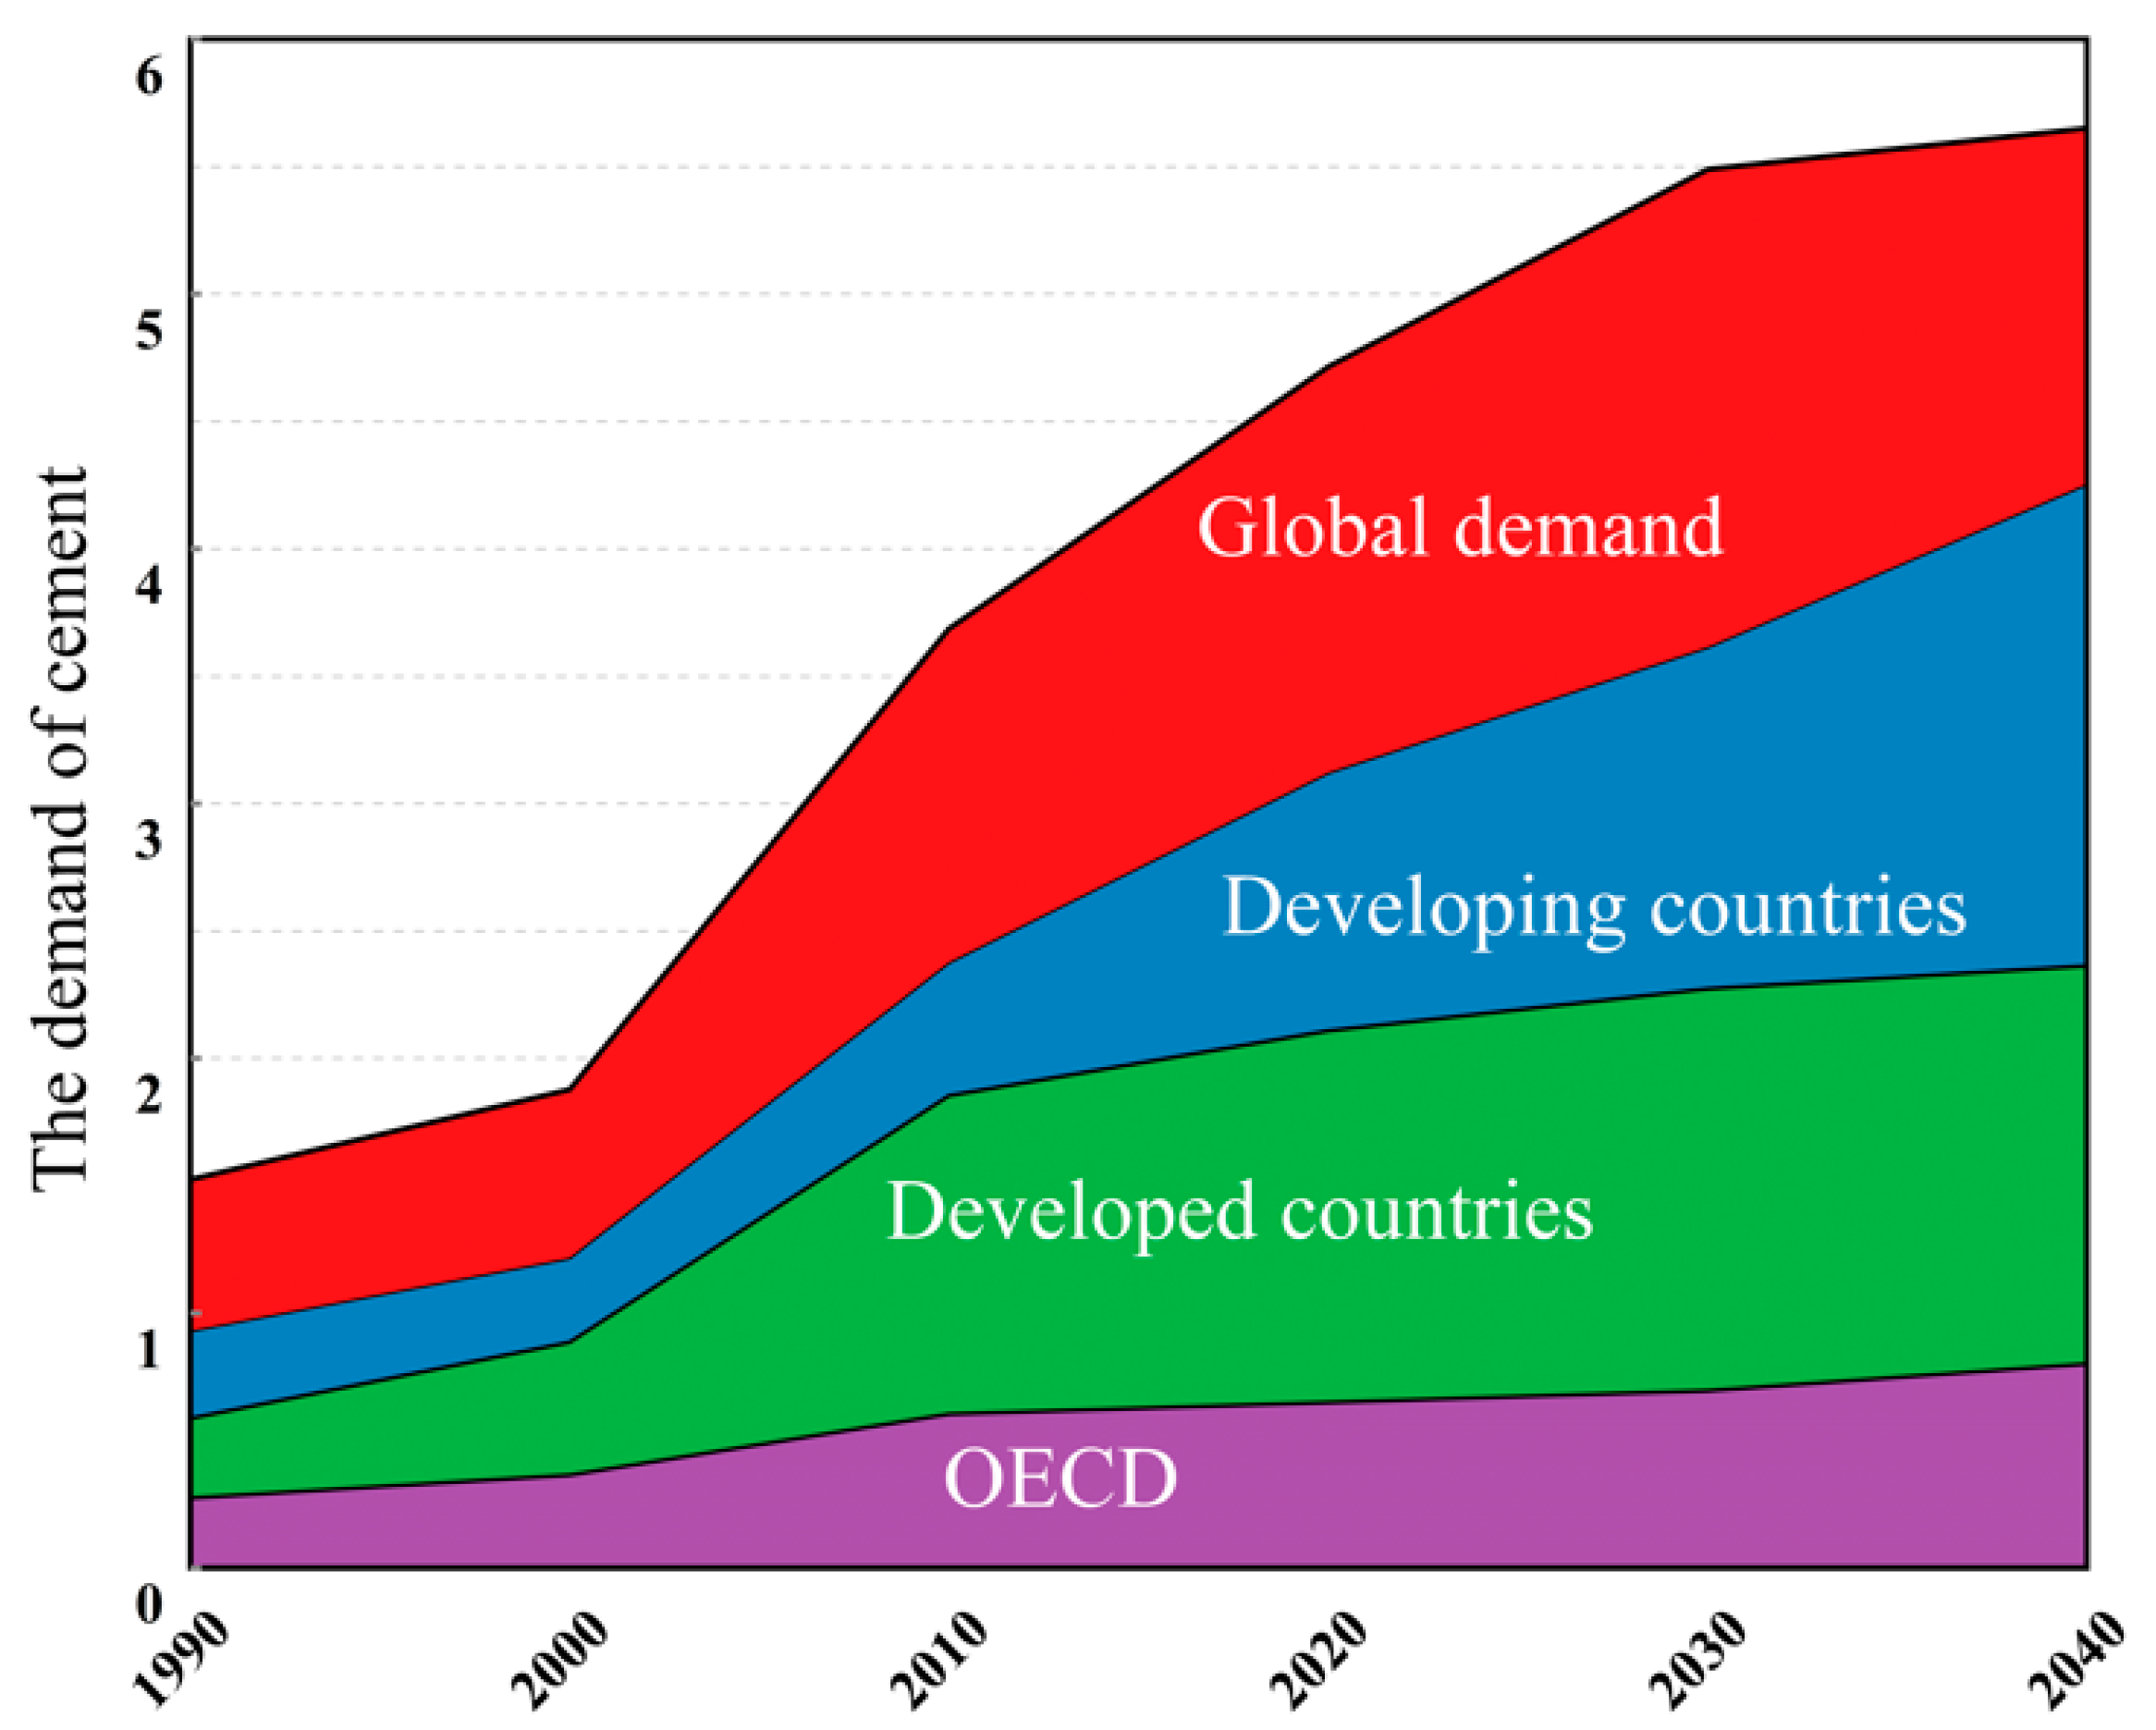
:1. Introduction
2. Materials and Methods
2.1. Materials
- (1)
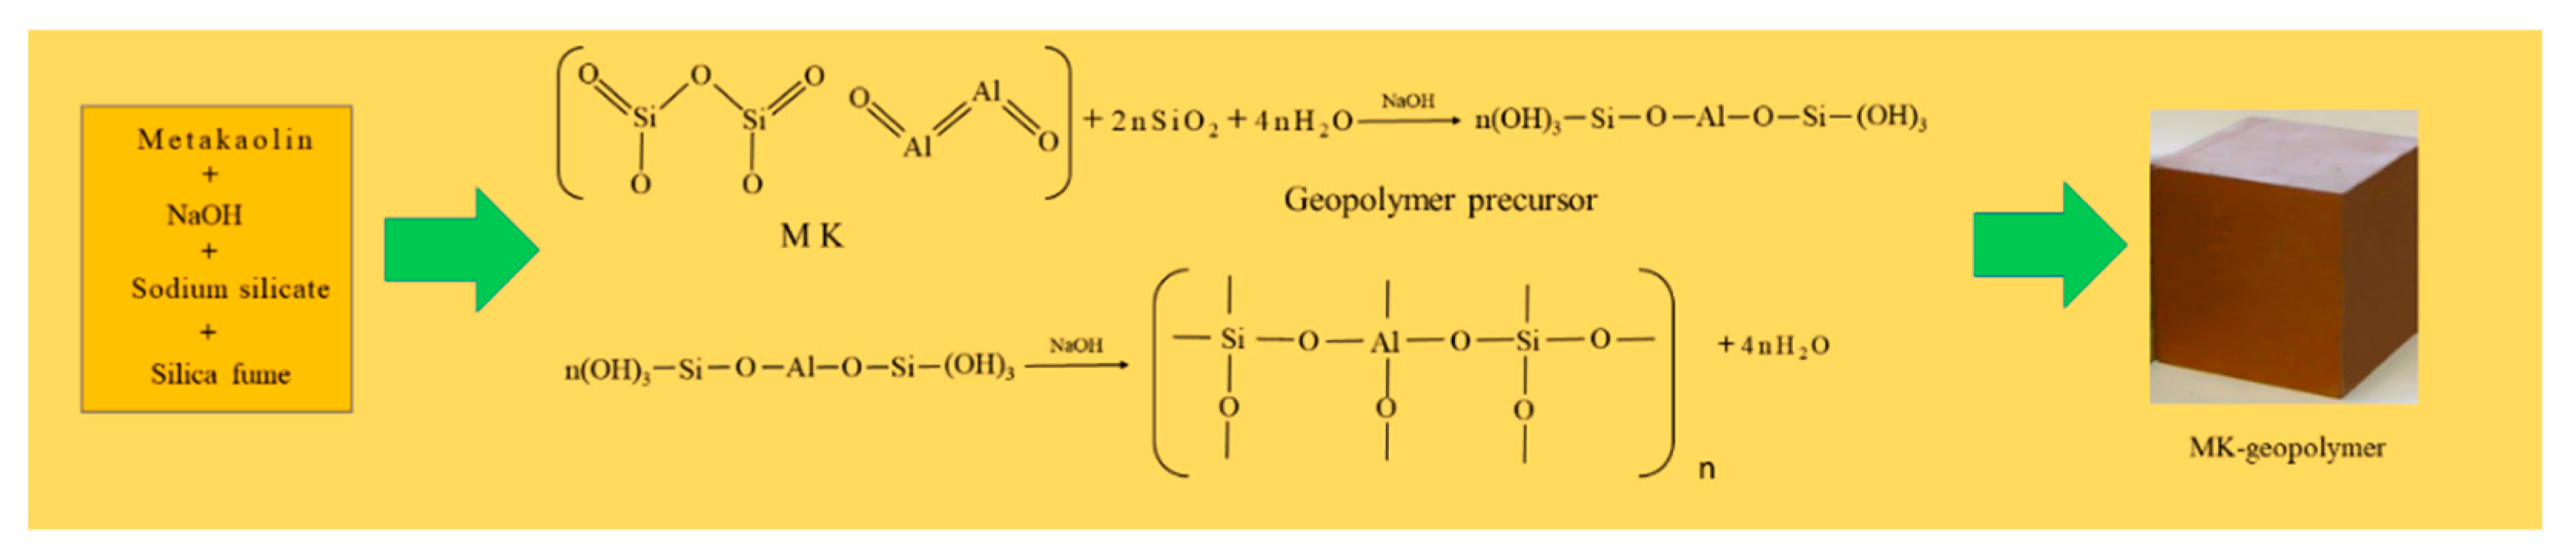
- Metakaolin: metakaolin was chosen as the aluminosilicate material in this research due to its high purity, reactivity of components, and being more active for geopolymerization, compared with other materials such as fly ash, slag, etc. The metakaolin, made by calcining kaolin, was supplied by Jinao Refractory Materials Co., Ltd., China (Zhengzhou, China), and was used throughout this study. The general chemical composition of metakaolin powder is characterized in Table 1, using X-ray fluorescence (XRF) analysis and X-ray diffraction (XRD) experiment. The metakaolin was mainly composed of silica and alumina oxides, at the weight ratio of 1.36 (SiO2/Al2O3). The metakaolin used in this experiment was calcined at 650 °C to 850 °C low temperature with activity and physical properties as given in Table 2.
- (2)
- Sodium silicate: water glass, otherwise known as sodium silicate, is a kind of water-soluble silicate. The molecular formula is Na2O·nSiO2, with the n representing the ratio of SiO2 to Na2O, called the water glass modulus, which is a very important parameter. The larger the n value, the higher the viscosity and strength. The different modulus of the exciter was adjusted by varying the amount of NaOH, and the sodium silicate solution needed to be set for 4 to 6 h to achieve equilibrium and to cool down to ambient temperature before the experiment was performed. The detailed mass compositions of sodium silicate are given in Table 3, as follows.
- (3)
- NaOH: The analytical pure sodium hydroxide was sourced from Tanli Chemical Reagent Co., Ltd. (Tianjin, China) with a purity of 99%.
- (4)
- Silica fume: Silica fume (SiO2 > 98%), purchased from Sichuan Langtian Resources Utilization Co., Ltd., China (Chengdu, China), was used as silica corrector to change Si/Al ratios. The particle size was measured at 50% of the cumulative under a size of 3 nm from SEM.
2.2. Experimental Preparation
2.2.1. Mix Design
2.2.2. Experimental Procedure and Precautions
2.3. Characterization
2.3.1. Unconfined Compressive Strength Test
2.3.2. Flexural Strength Test
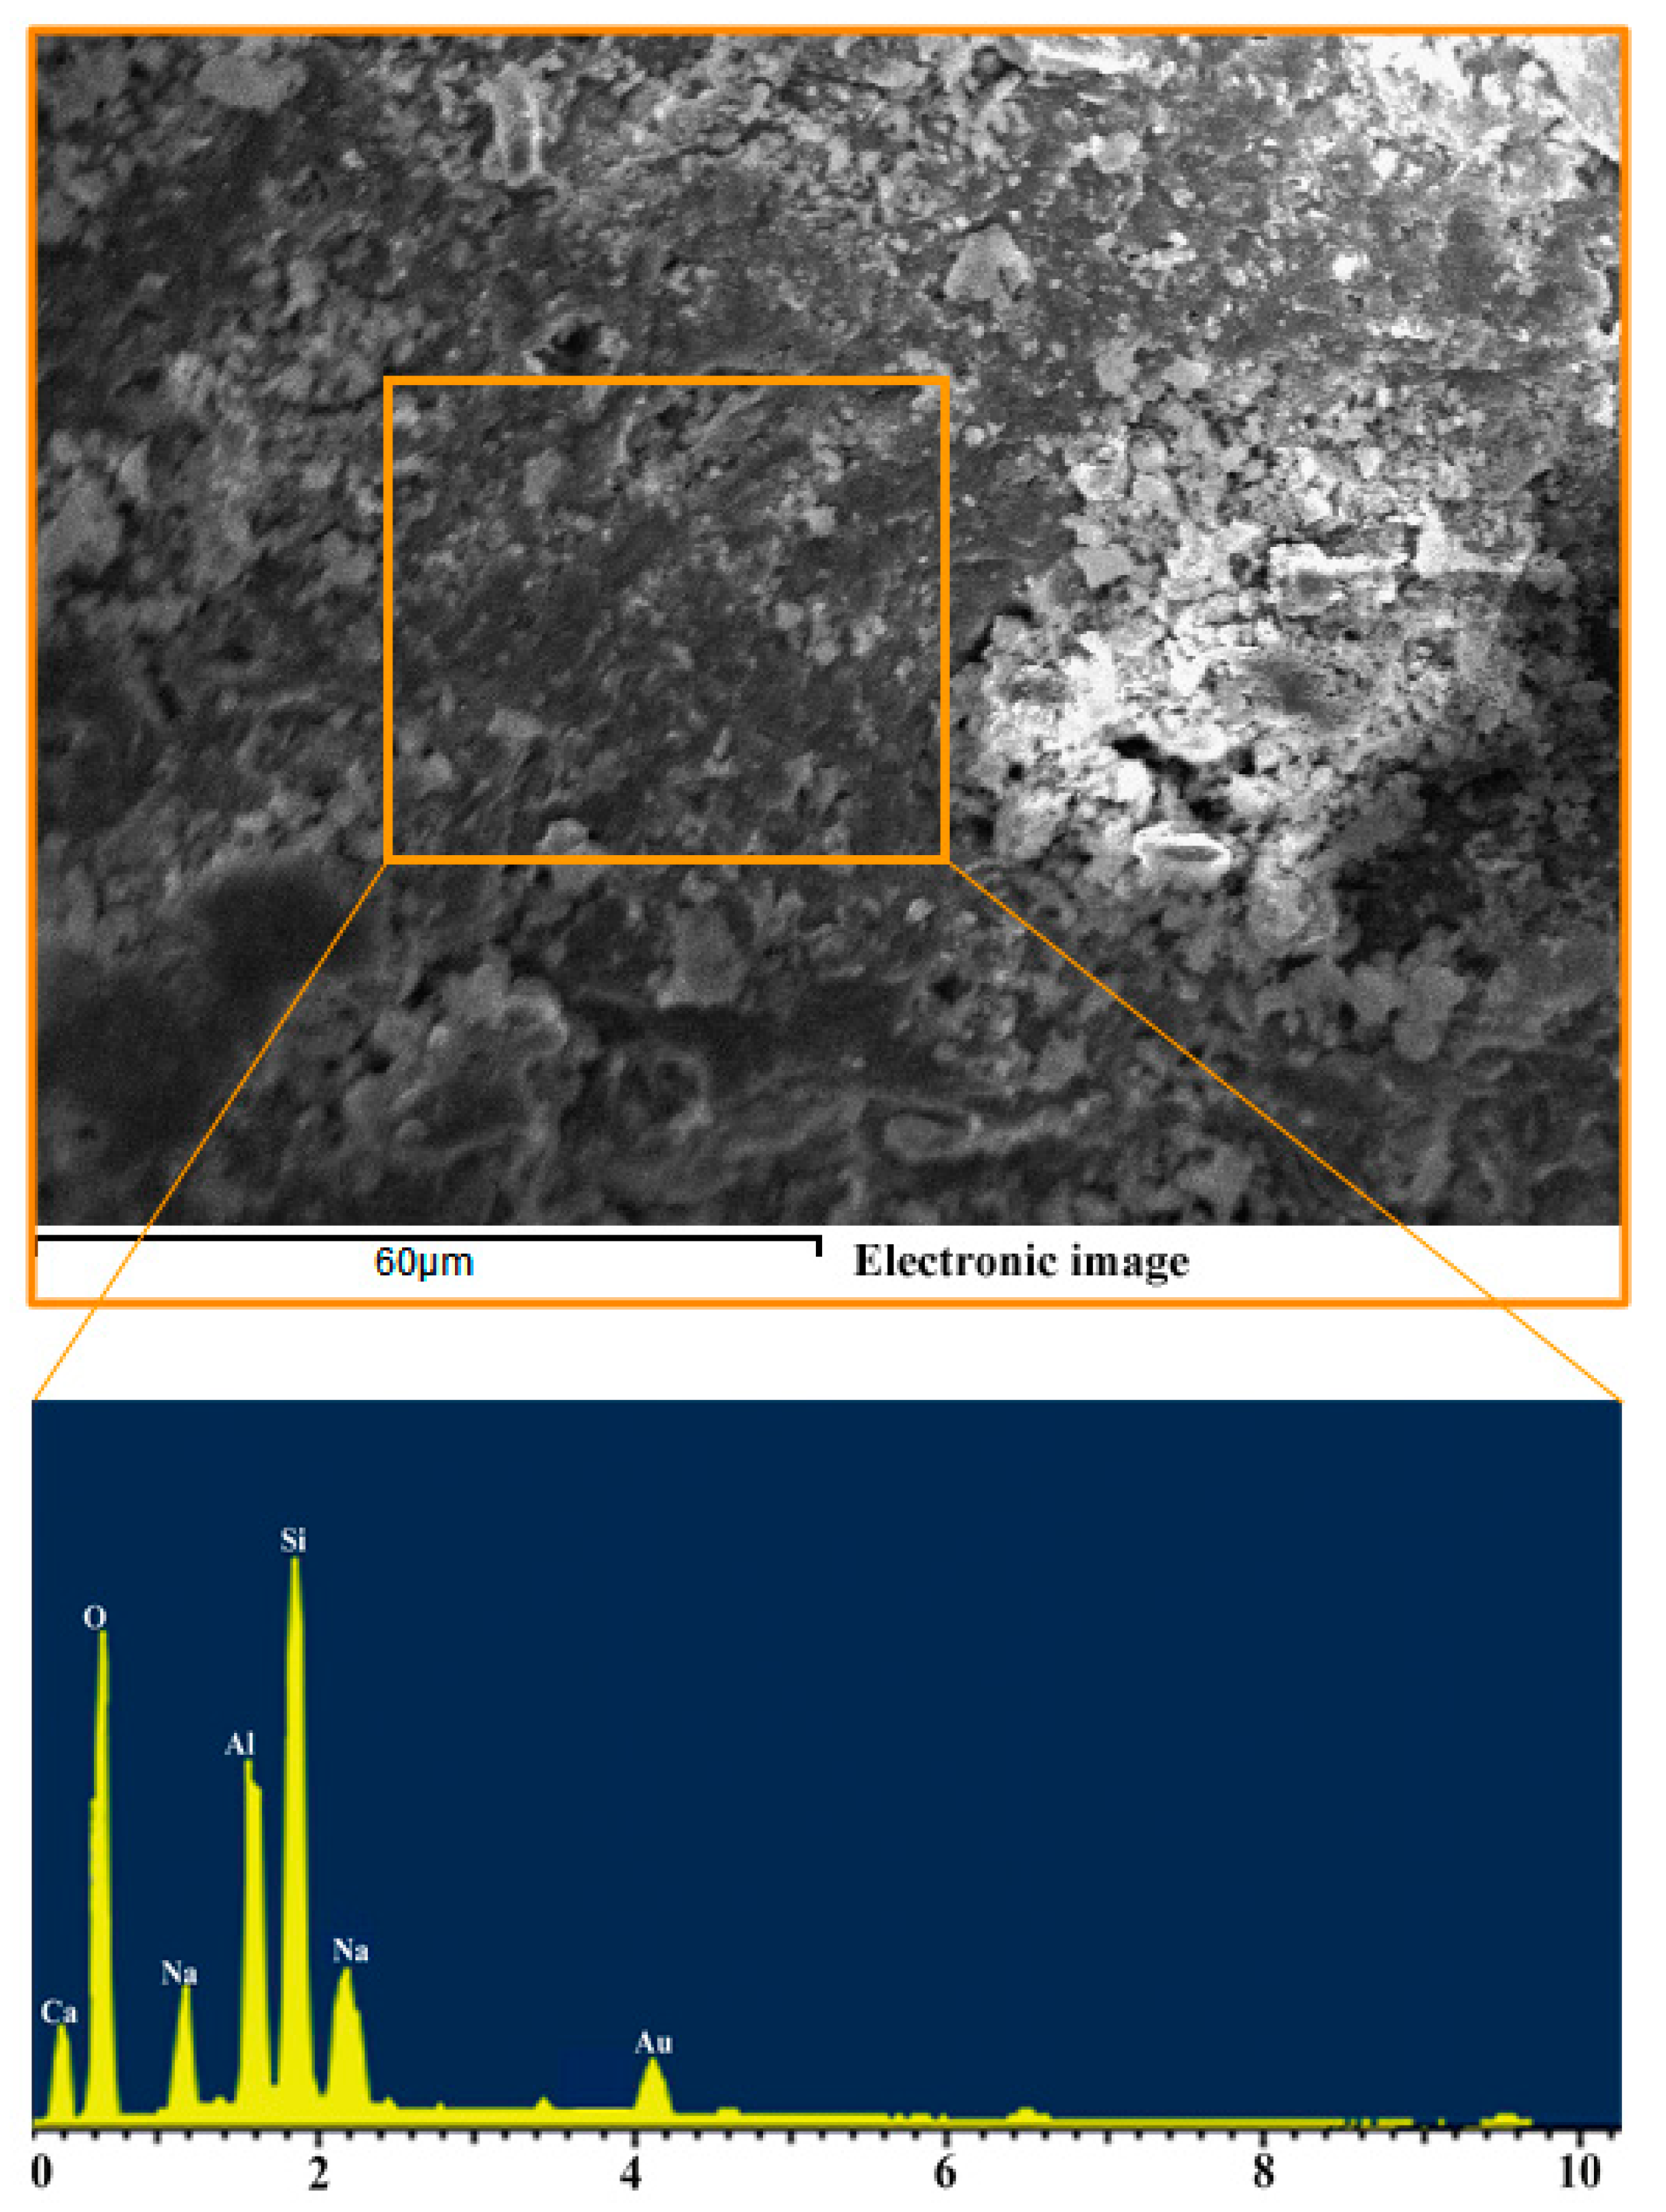
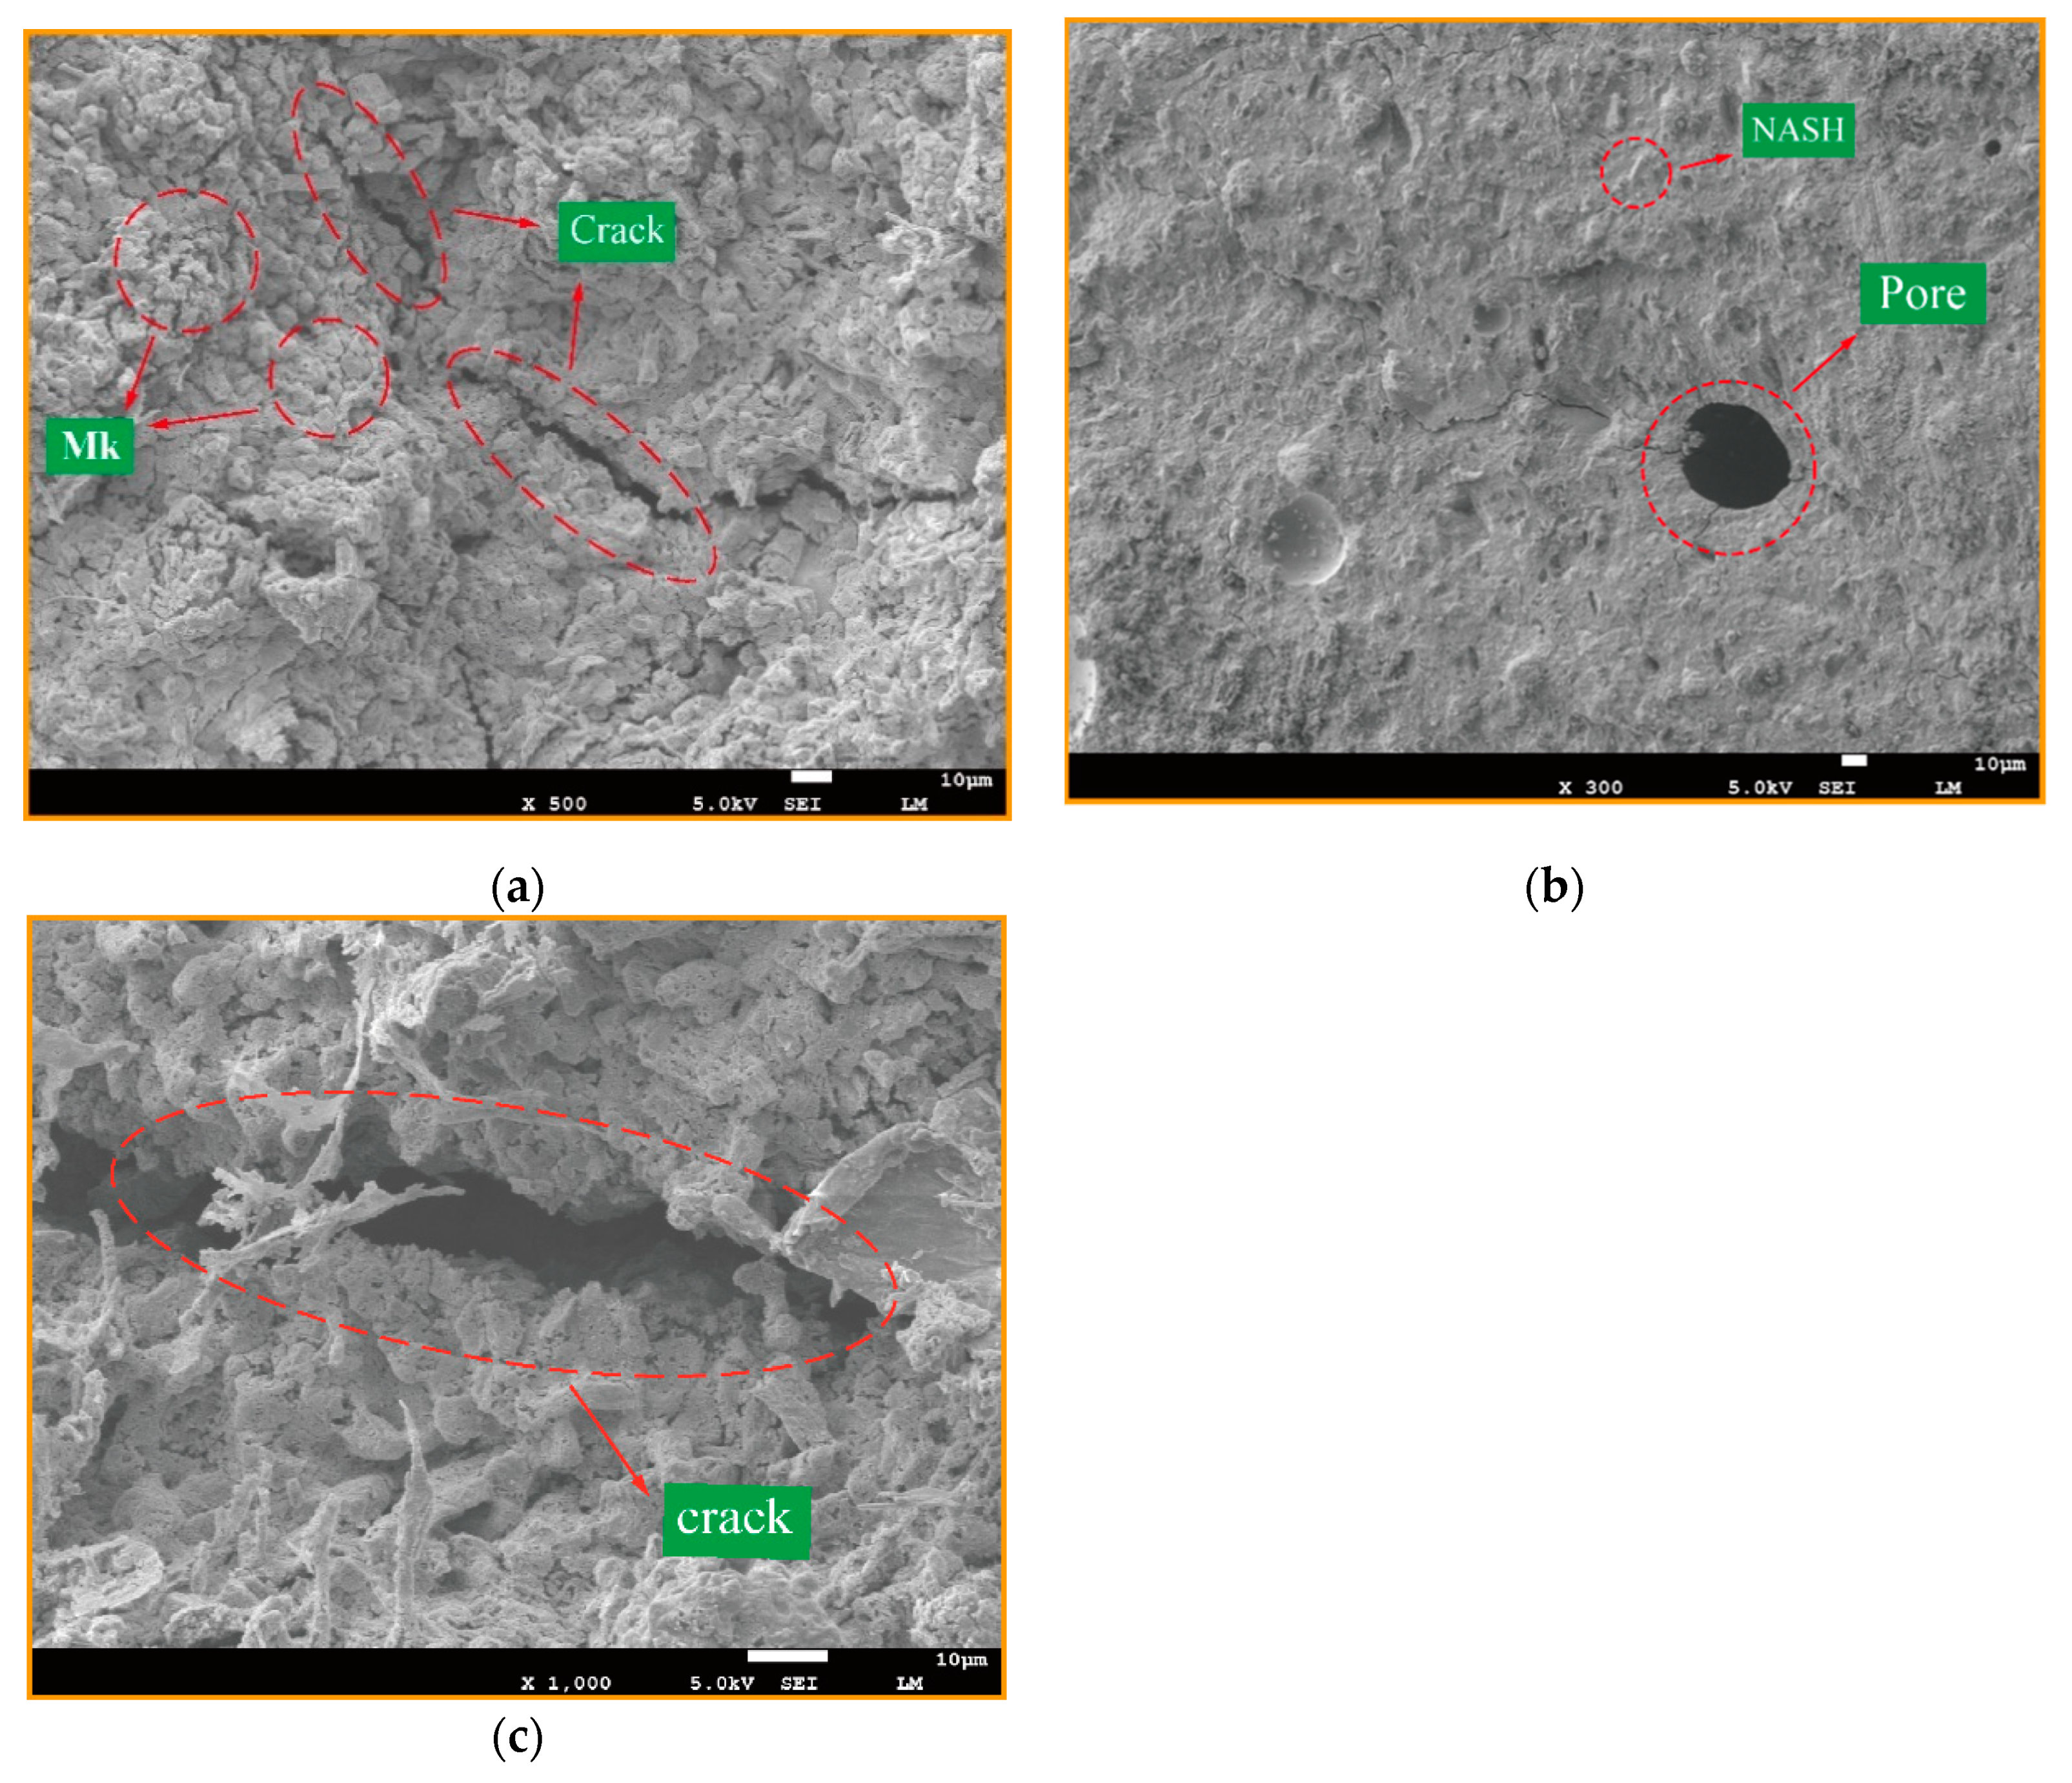
2.3.3. Scanning Electron Microscopy and Energy Dispersive Spectrometer Analysis
2.3.4. Calculation of Residual Water during Geopolymerization
3. Results
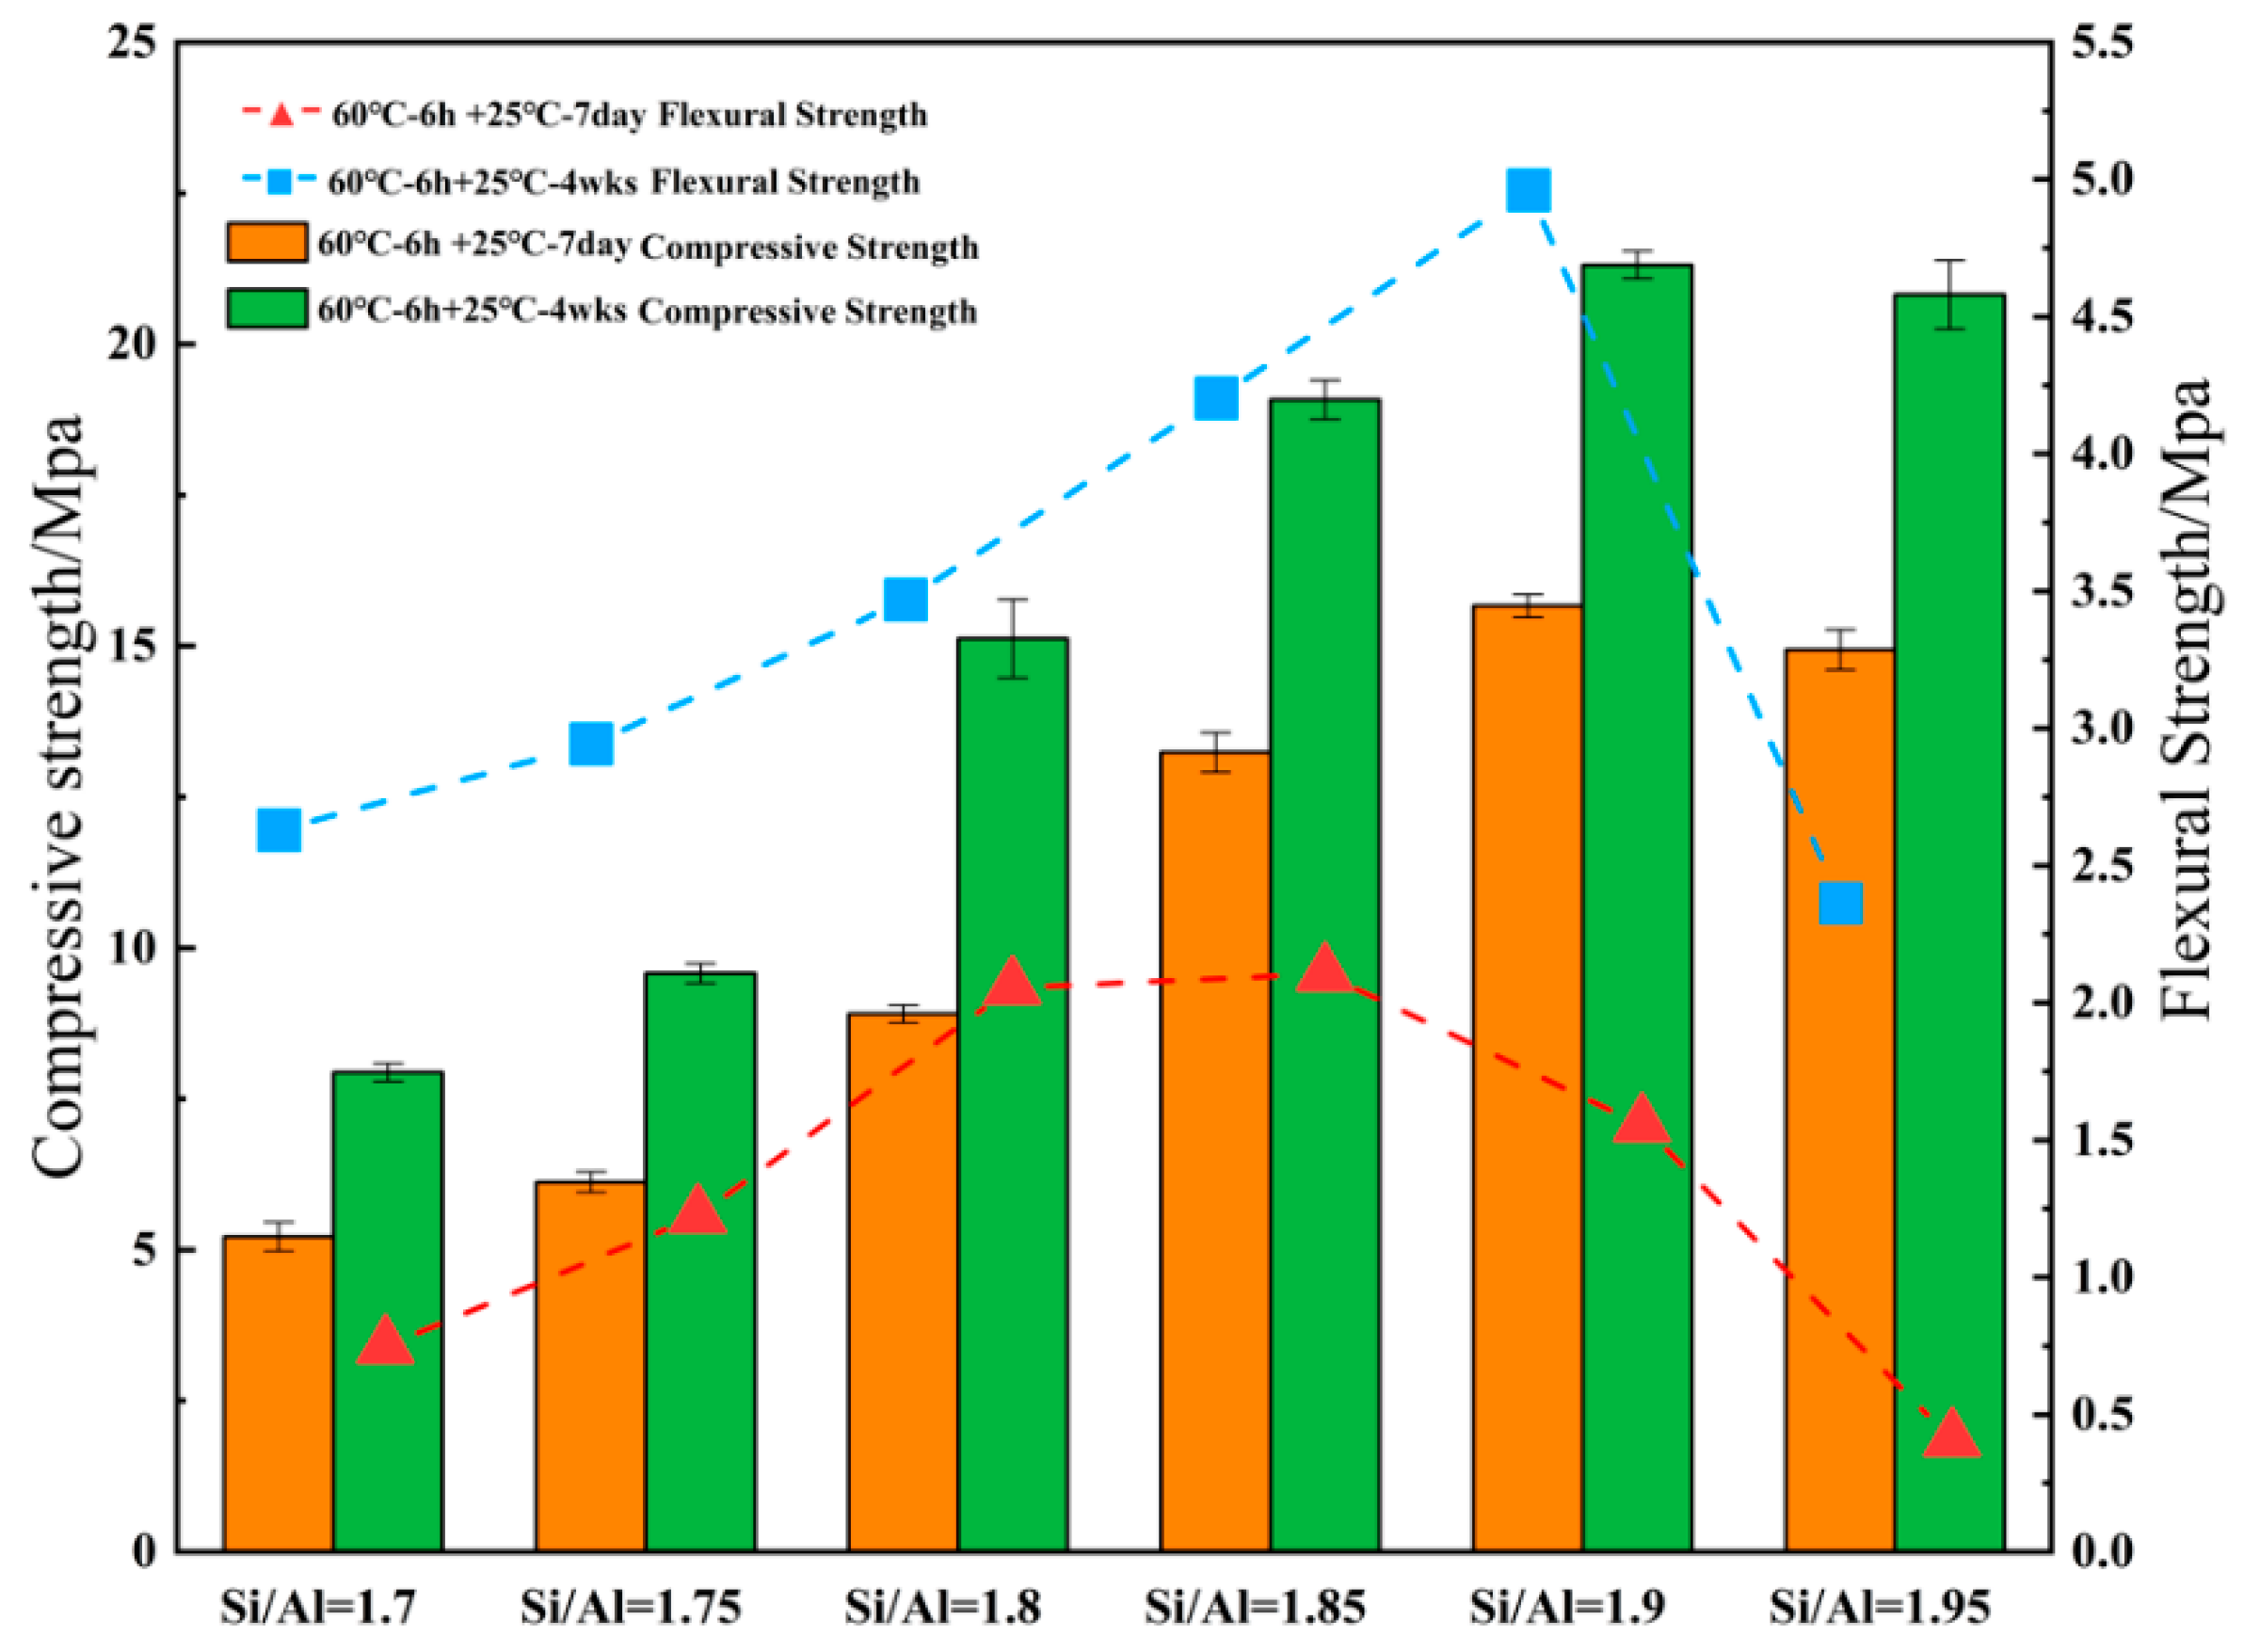
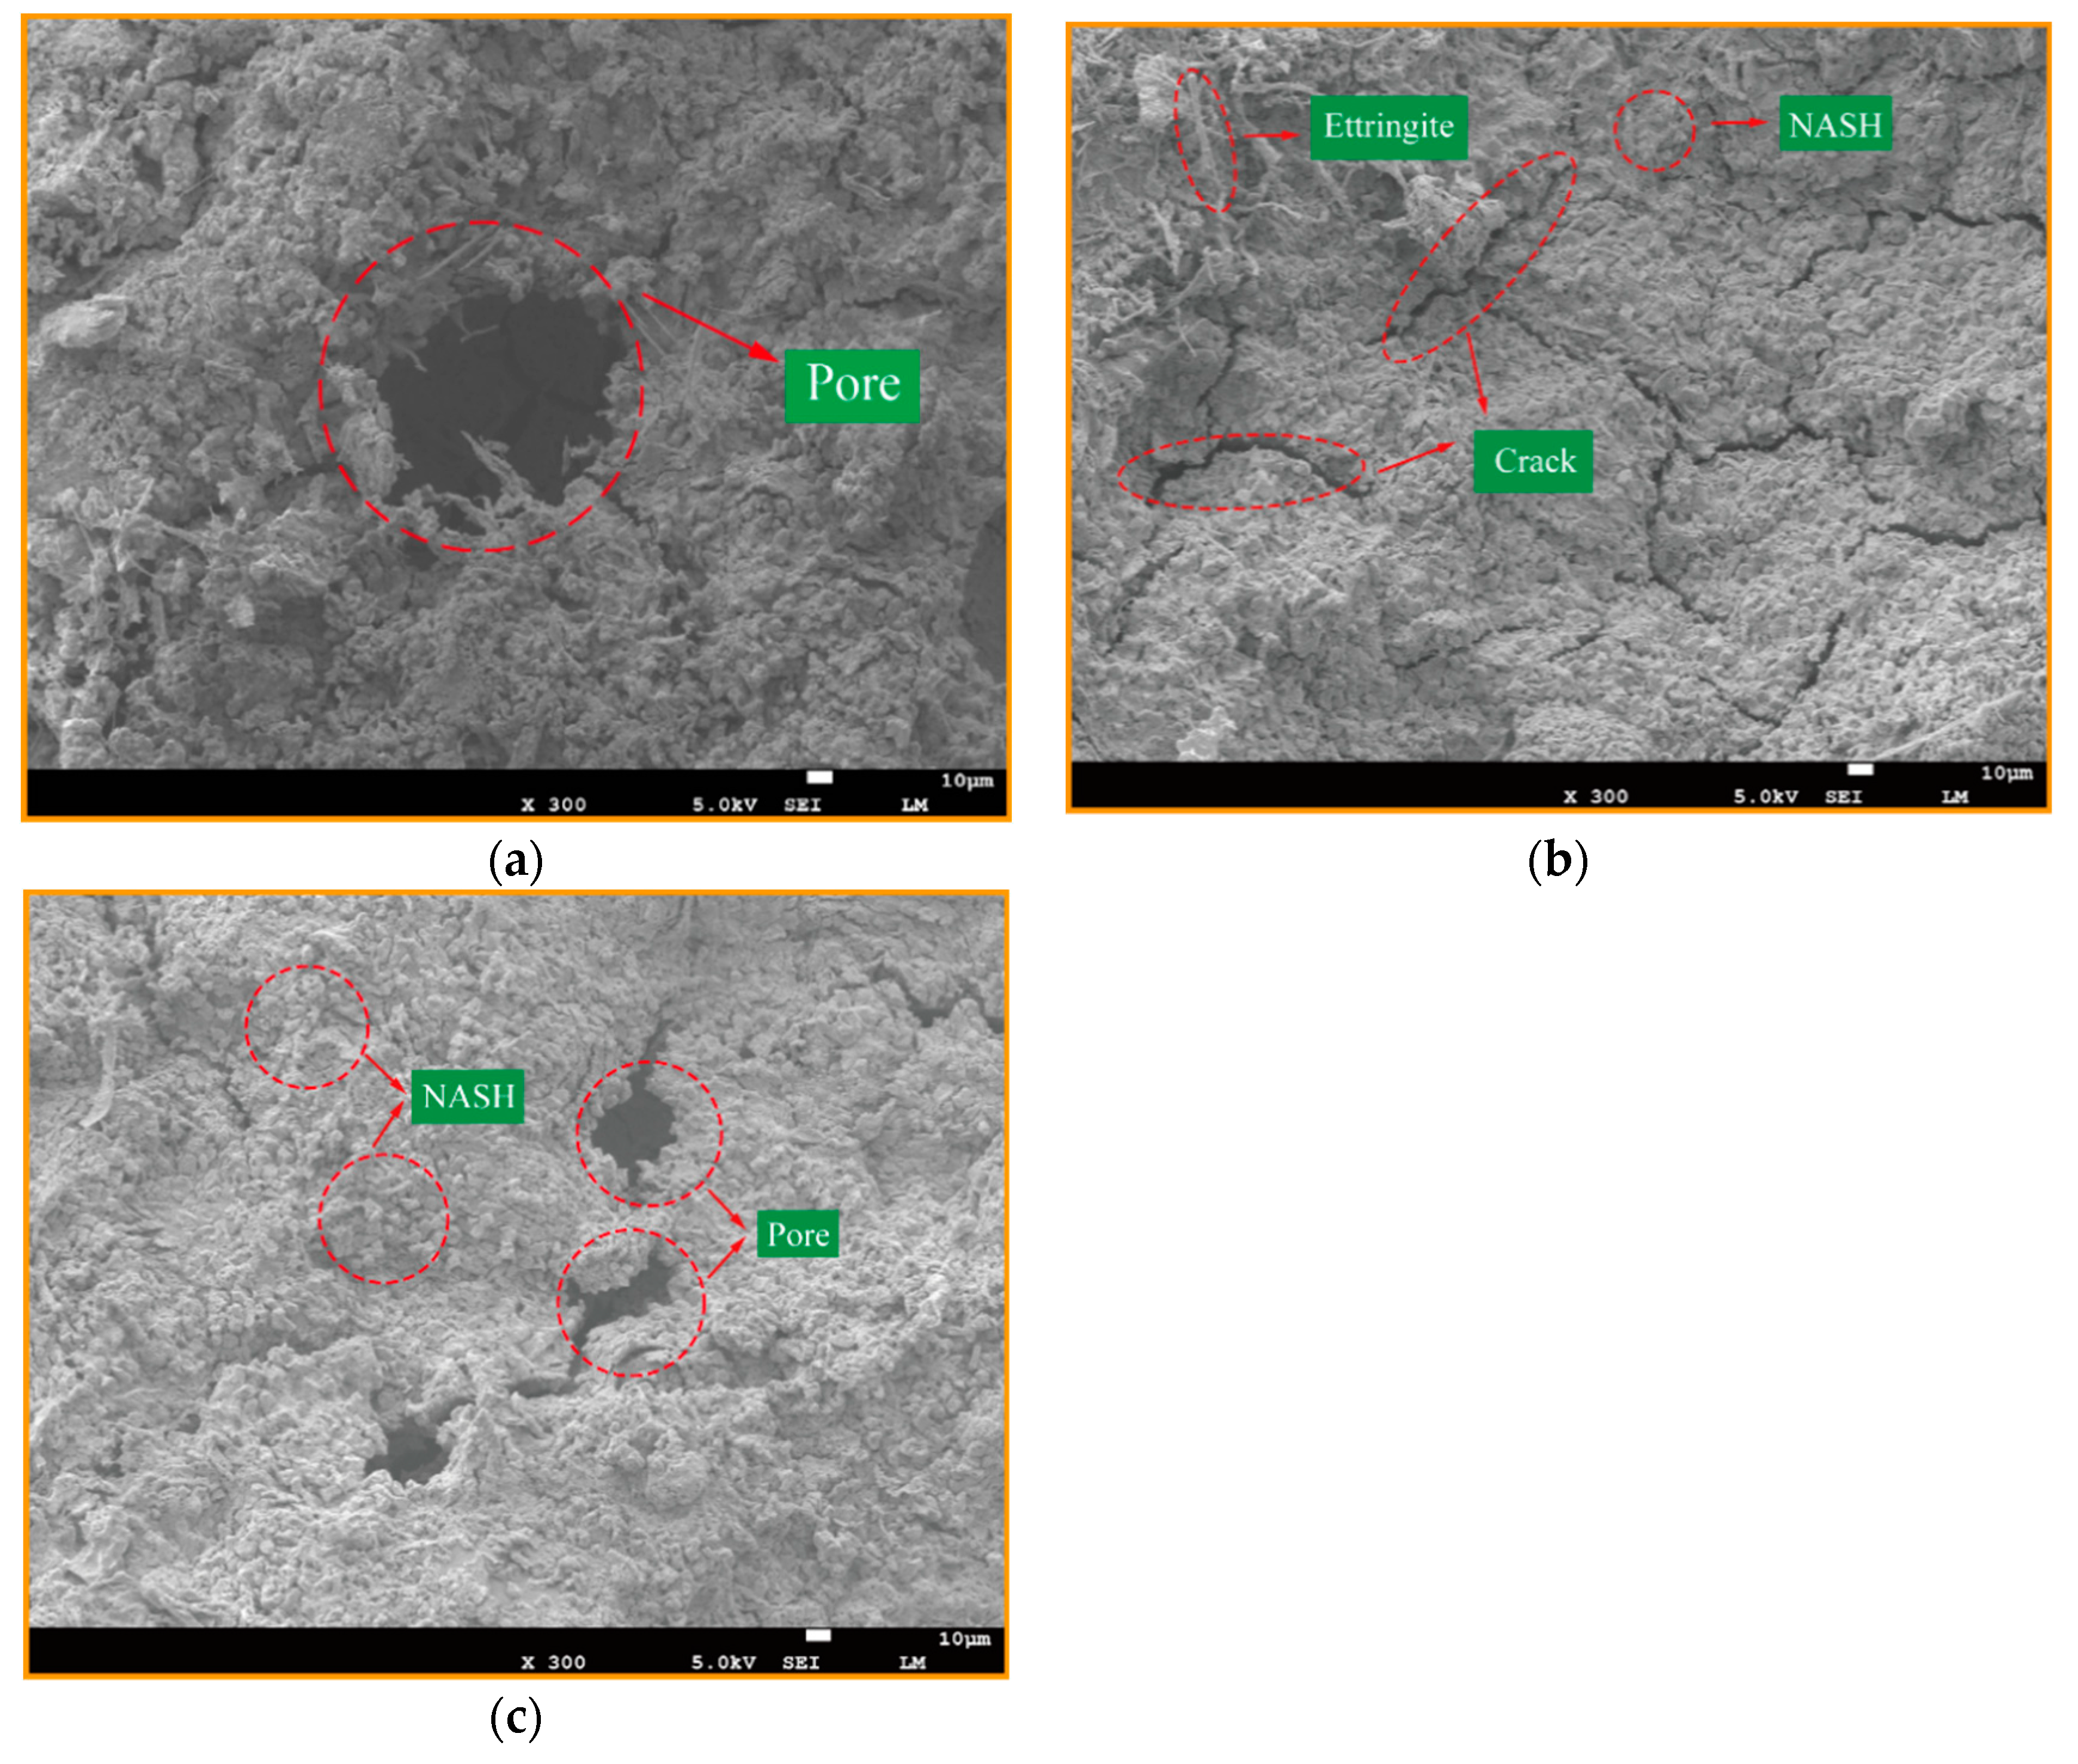
3.1. Effect of Various Si/Al ratios on Microstructure and Mechanical Properties
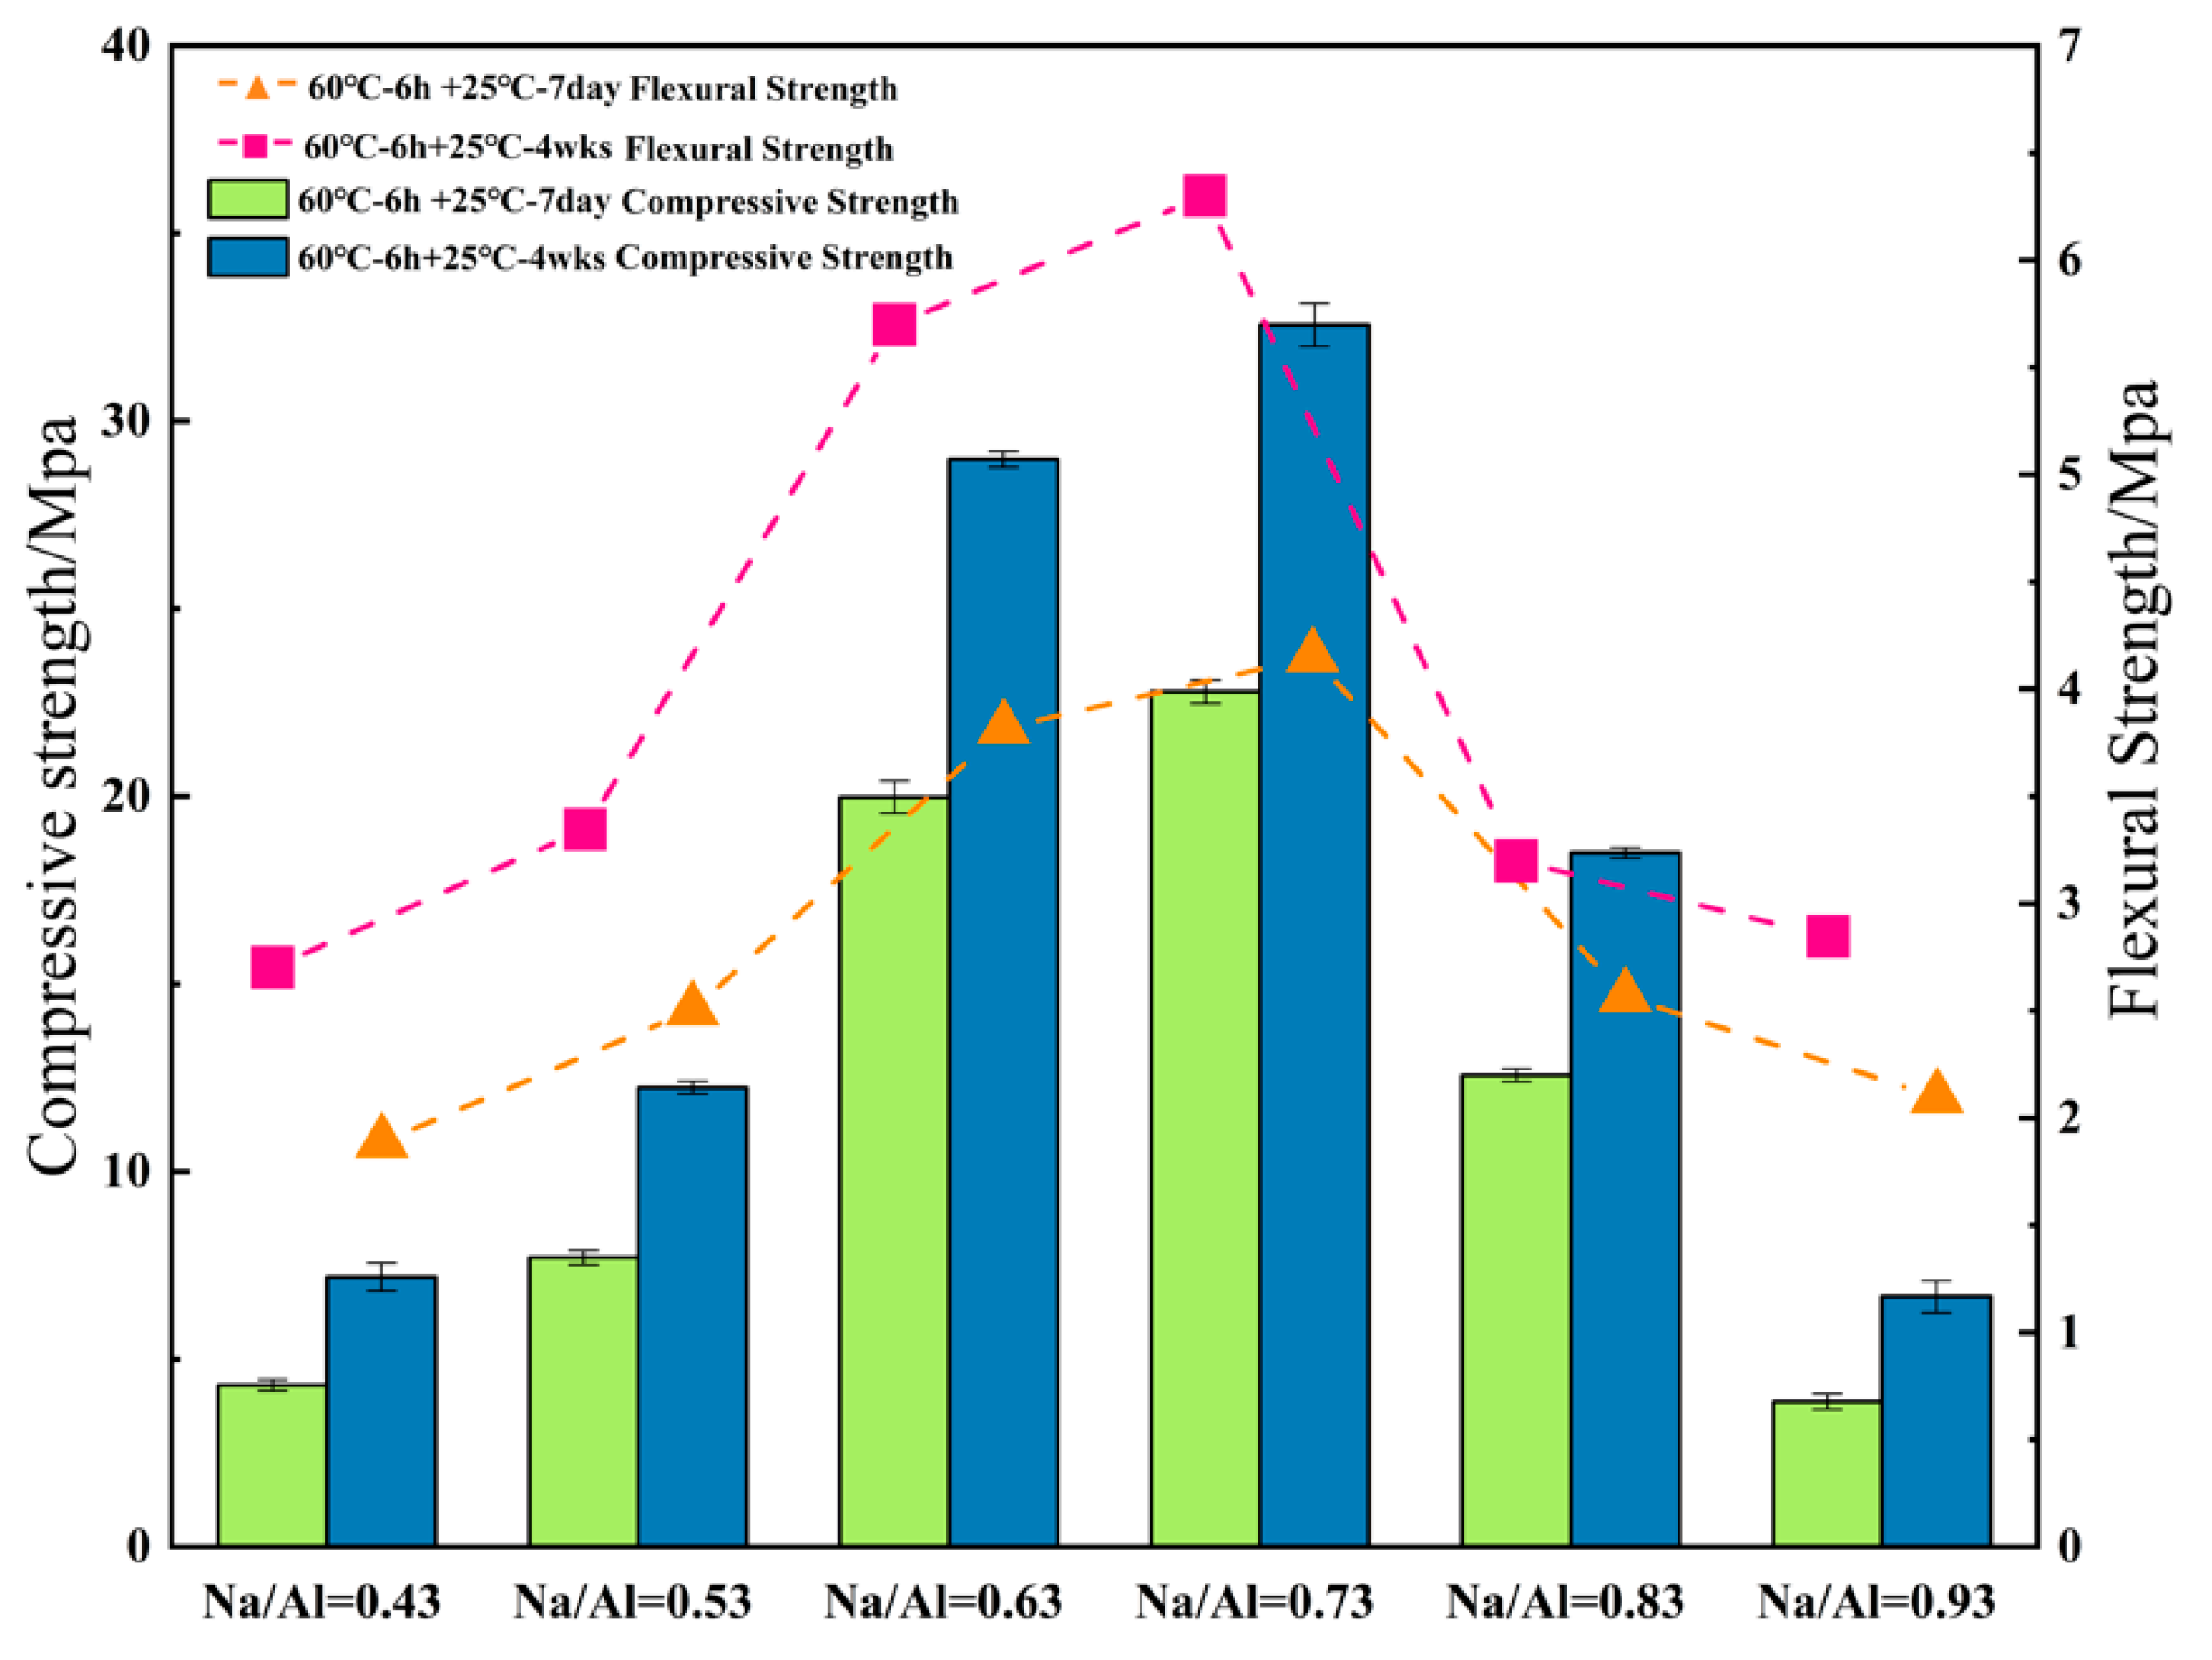
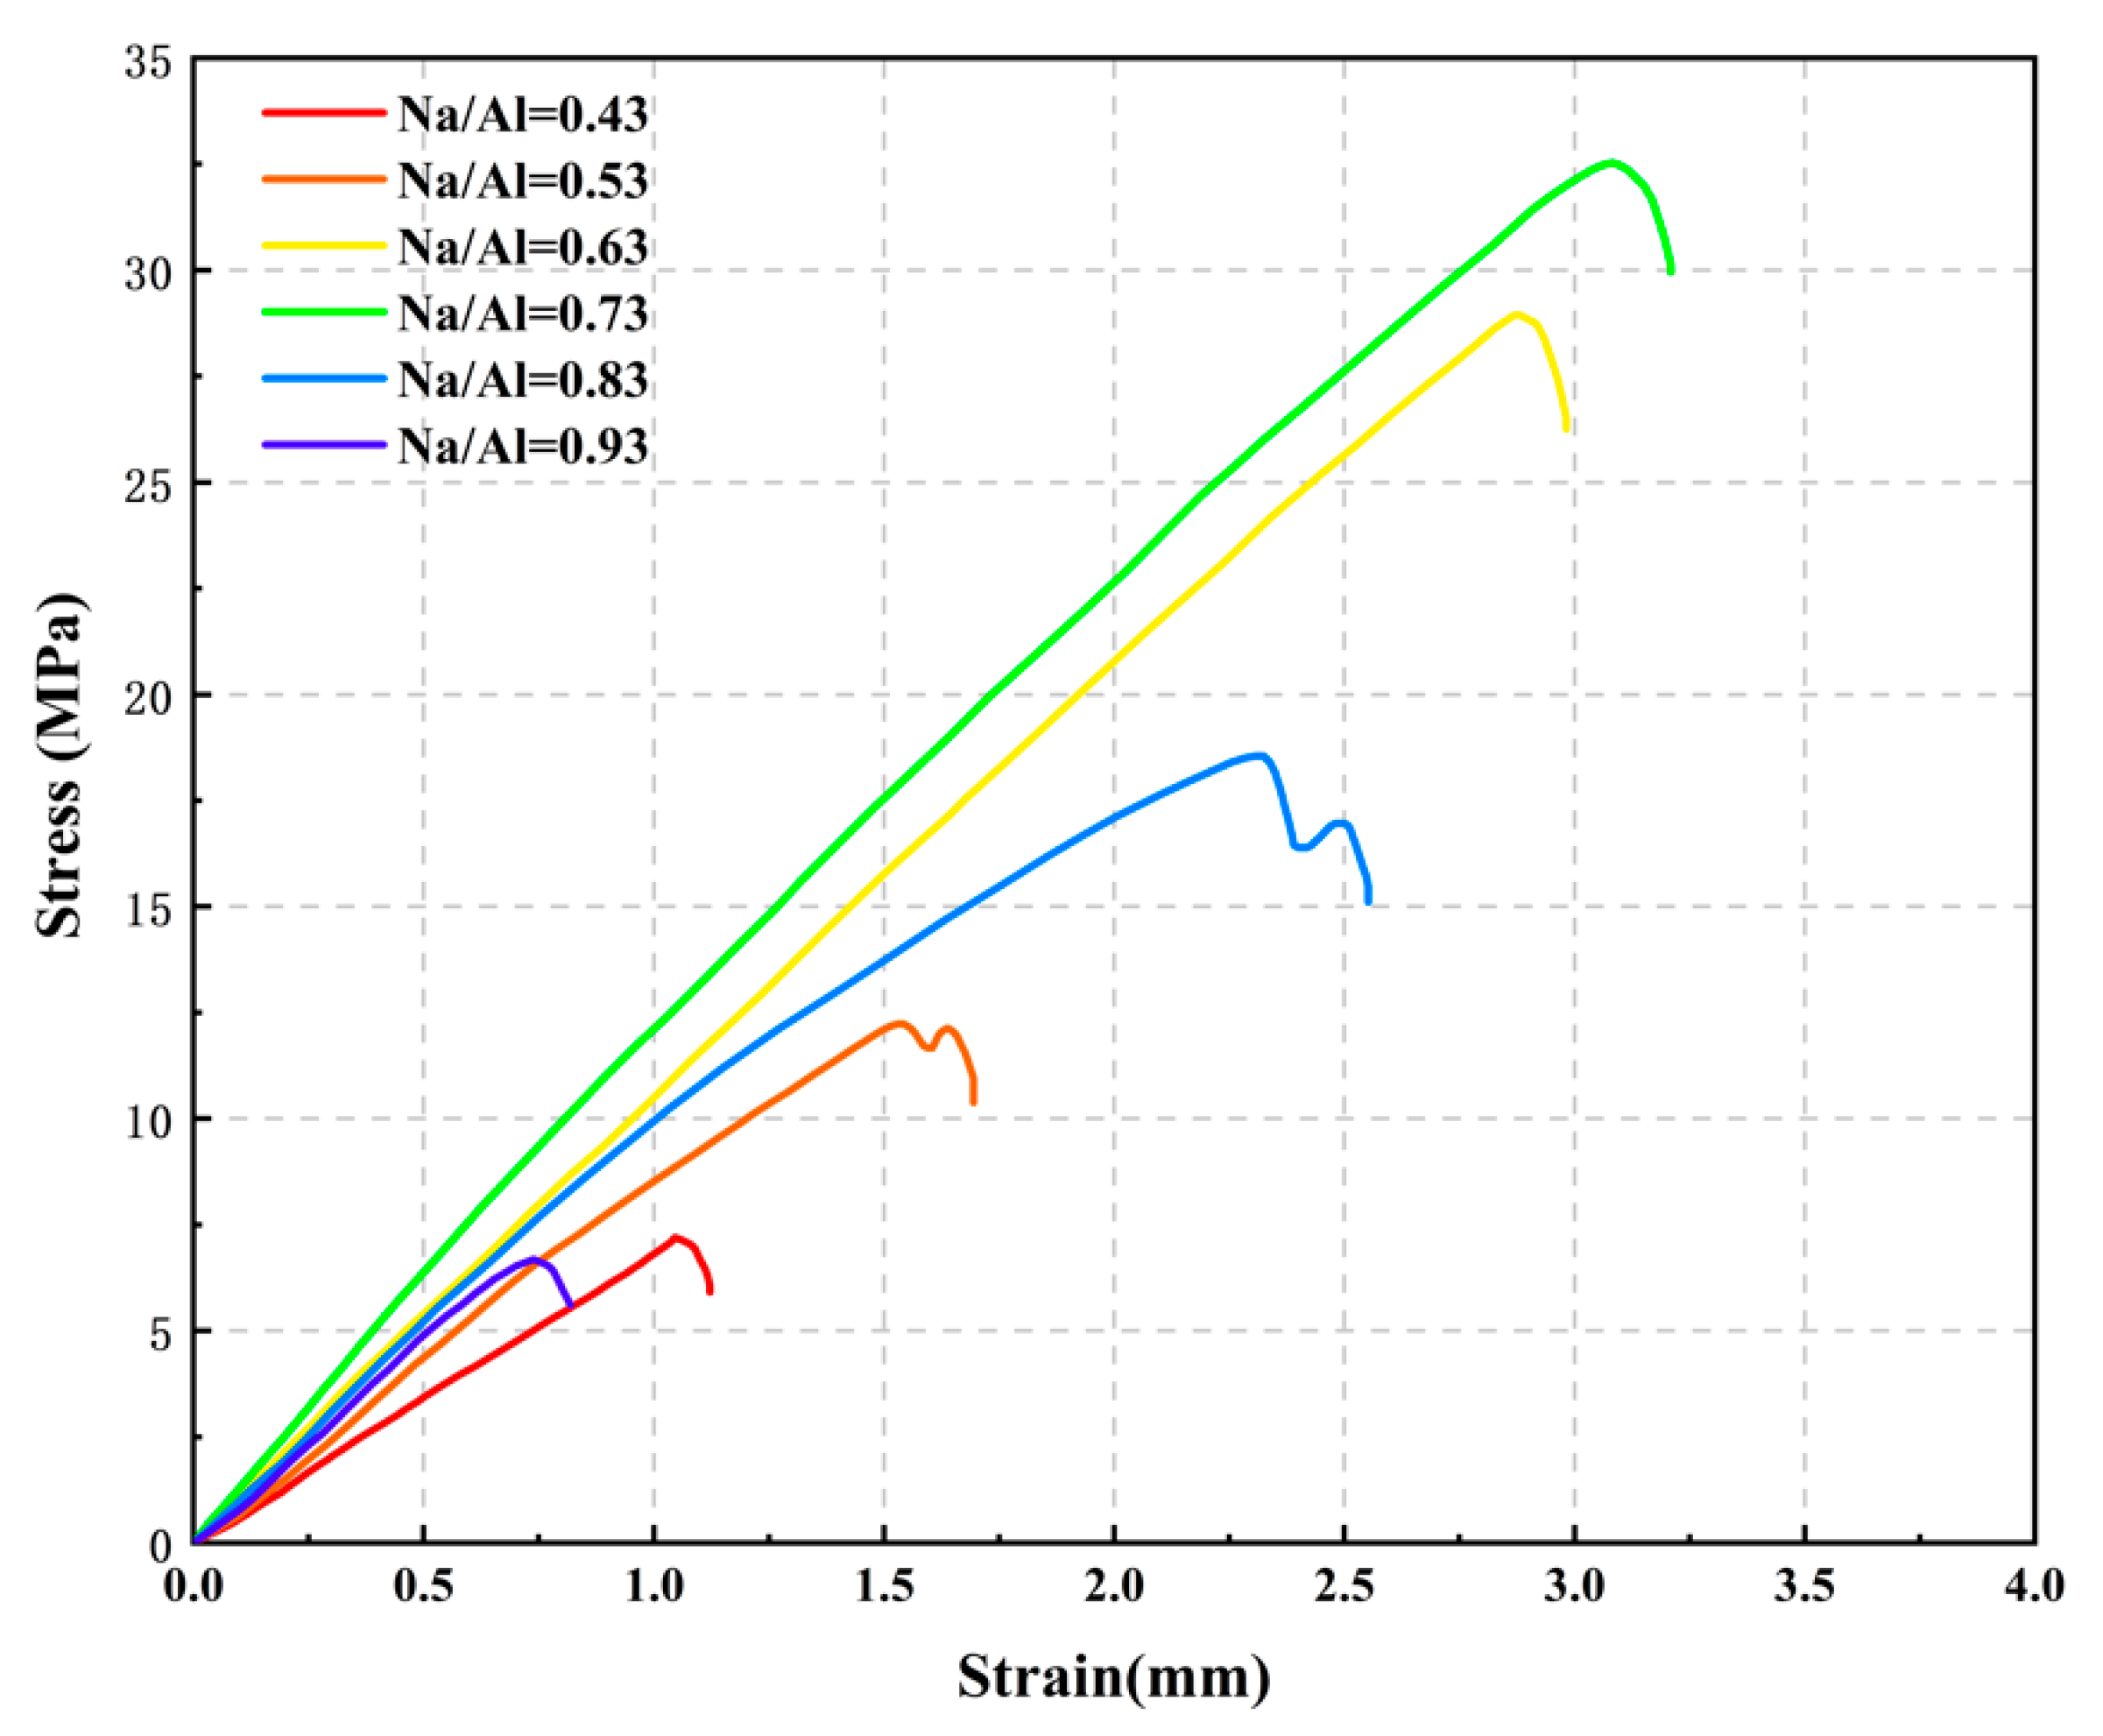
3.2. The Effect of Various Na/Al Molar Ratios on a Geopolymer
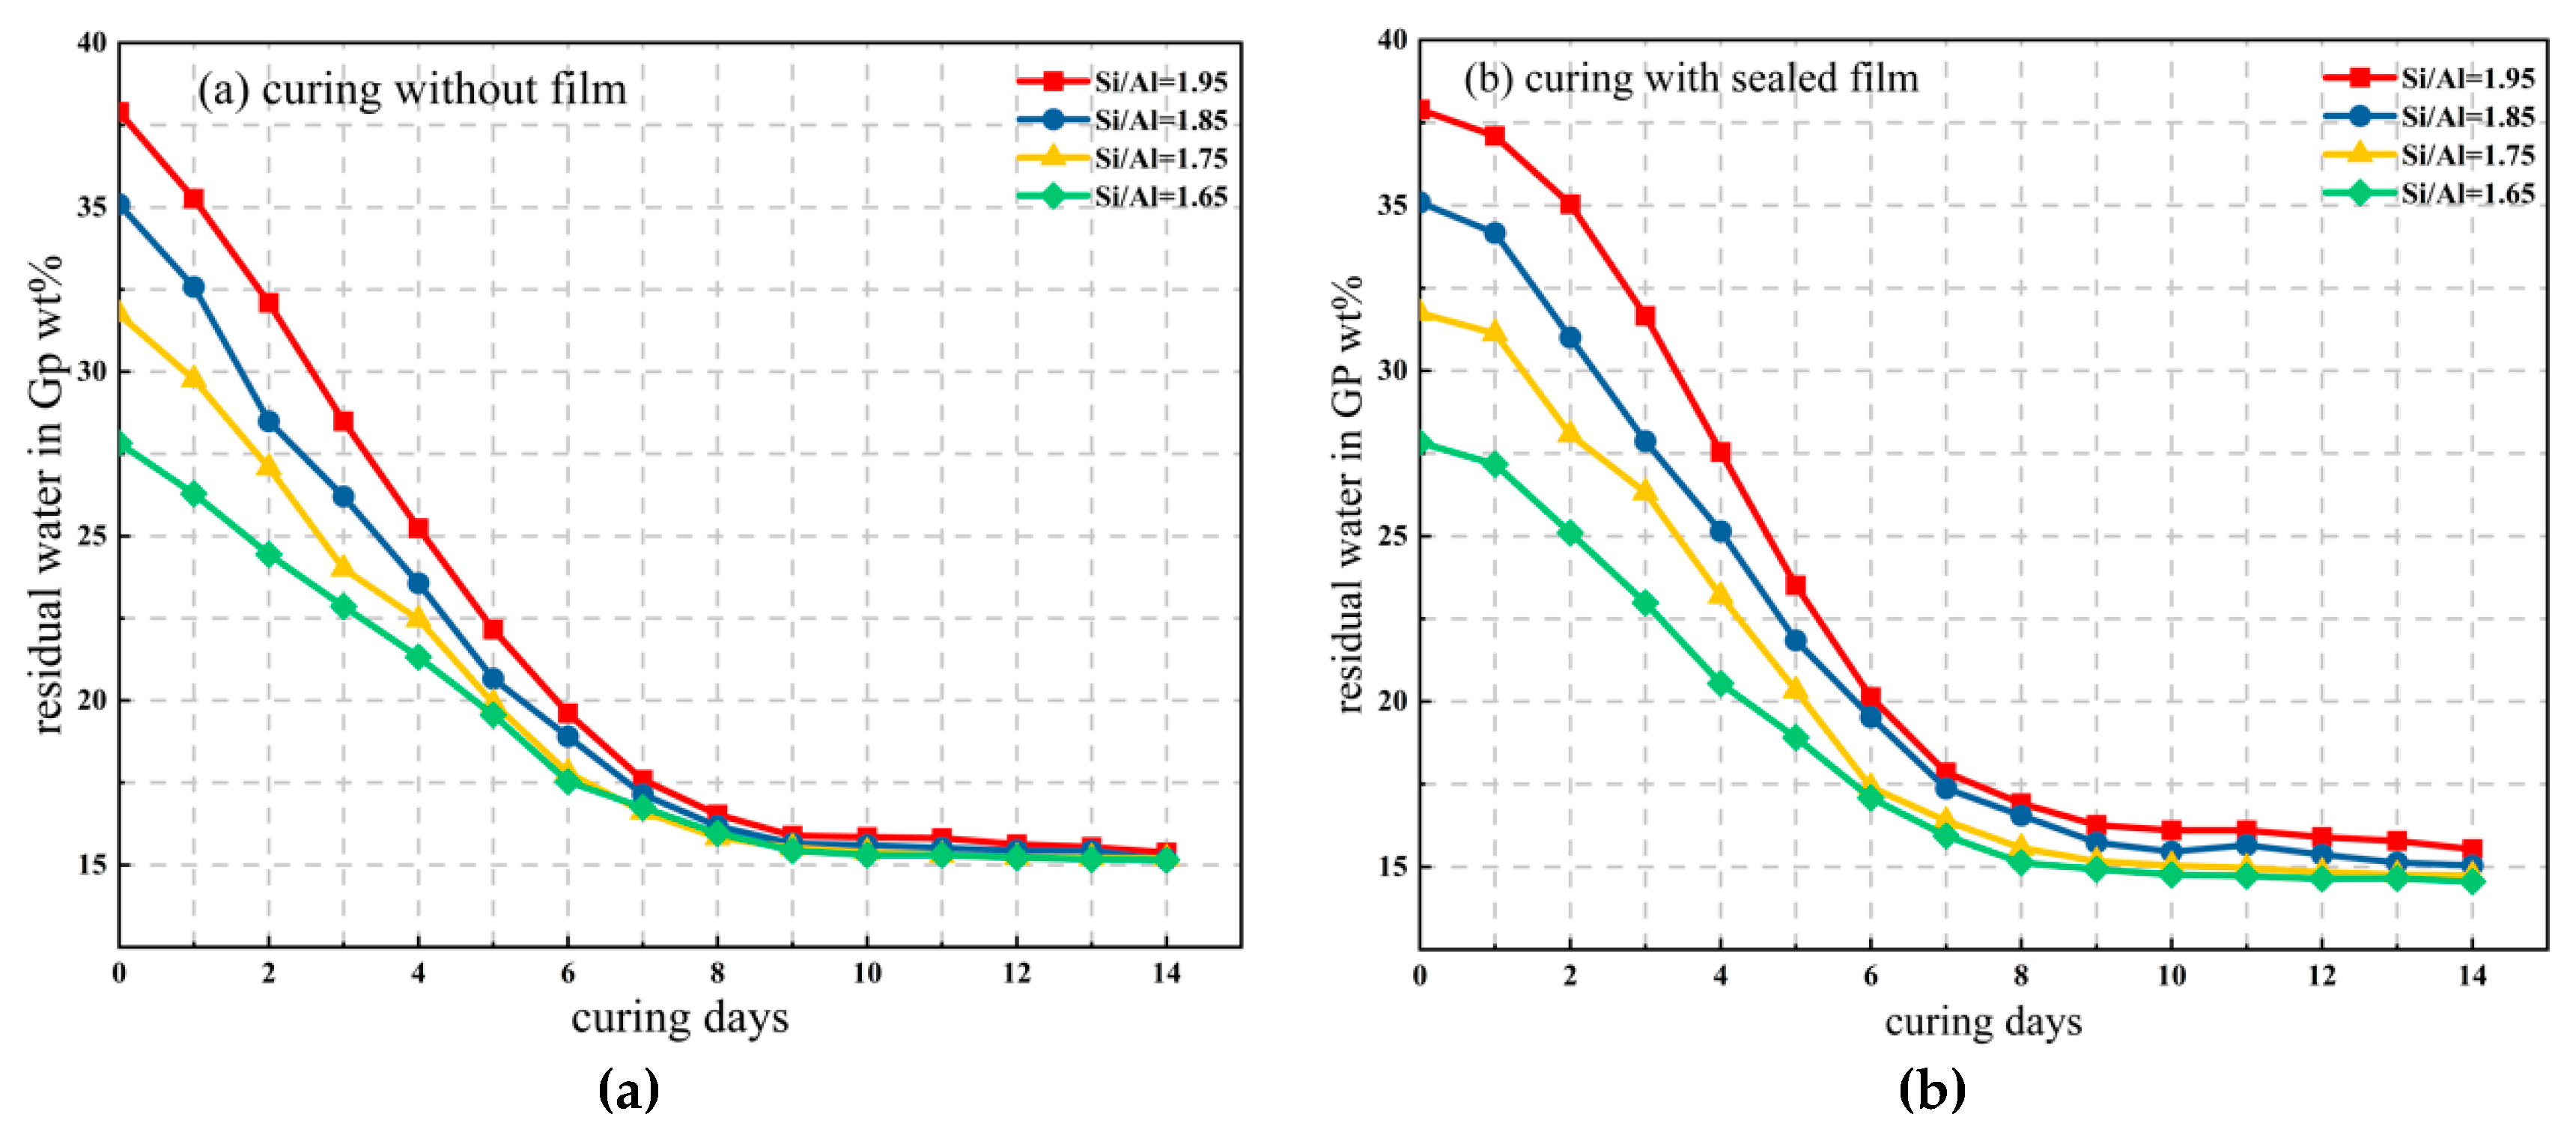
3.3. Investigation into the Changes to Water in Geopolymerization
- (1)
- About 60% of the water was free water, also known as pore water, which mainly existed between the gel particles and pore structures of the geopolymer, while the pore diameter was generally several hundred nanometers. It was basically not affected by the physical interaction, so it could participate in the reaction of the hydration process.
- (2)
- Another part of about 35% was combined water, also called the interlayer water, its binding force relied on capillary tension and strong hydrogen bonding, hydrating with C-A-S-H and adhering to the pore surface. The pore diameter was at a nanometers scale. This part of bound water had a significant influence on the shrinkage of the microscopic pore structure and would combine with active silicon and aluminum cations to form hydration ions.
- (3)
- The remaining part of 5% was structural water [26], which was an integral part of the chemical structure of the hydration structural products of geopolymers. They existed in the form of hydroxyl groups in the geopolymer products, with a strong chemical bond binding ability. Destroying their chemical bonds would consume a lot of energy and also change the molecular structure and morphology, so the structure water of this part was the most stable.
4. Discussion and Conclusions
- (1)
- The mechanical properties of the geopolymer attained a peak value of 21.3 MPa when Si/Al was equal to 1.90. Under various Si/Al ratios, the macro-strength of a geopolymer mainly relies on the formation of NASH gel rather than the zeolites or silicate derivatives.
- (2)
- Increasing the alkalinity within a suitable range in the polymer reaction system was beneficial to the dissolution rate of the MK and geopolymerization. Whereas, a ultra-high Na/Al molar ratio caused a high alkali environment, it would enhance the crystallization and inhibit the polyreaction, resulting in significantly worse geopolymer performance.
- (3)
- No matter how high the initial water content in the geopolymer, the discrepancy of water evaporation was only large in the early stages. The water content of all samples was almost the same after 16–20 days curing, and the bound water content in the final geopolymer was near to 15%.
- (4)
- On account of the influence of various external factors and raw aluminosilicate material activity, the optimal mixture ratio of geopolymer may vary. It was necessary to explore the mixing ratio to achieve an optimal performance.
Author Contributions
Funding
Institutional Review Board Statement
Informed Consent Statement
Data Availability Statement
Conflicts of Interest
References
- Purdon, A.O. The Action of Alkalis on Blast—Furnace Slag. Soc.Chem. Ind. Trans. Commun. 1940, 59, 191–202. [Google Scholar]
- Glukhovsky, V.D. Soil Silicates: Their Properties, Technology and Manufacturing and Fields of Application; Civil Engineering Institute: Kiev, Ukraine, 1965. [Google Scholar]
- Davidovits, J.; Davidovics, M. Geopolymer: Room-Temperature Ceramic Matrix for Composites. Ceram. Eng. Sci. Proc. 1988, 9, 835–842. [Google Scholar] [CrossRef]
- Davidovits, J. Geopolymers and geopolymeric materials. J. Therm. Anal. 1989, 35, 429–441. [Google Scholar] [CrossRef]
- Fernández-Jiménez, A.; Palomo, A.; Criado, M. Microstructure development of alkali-activated fly ash cement: A descriptive model. Cem. Concr. Res. 2005, 35, 1204–1209. [Google Scholar] [CrossRef]
- Criado, M.; Fernández-Jiménez, A.; Palomo, A. Alkali activation of fly ash. Part III: Effect of curing conditions on reaction and its graphical description. Fuel 2010, 89, 3185–3192. [Google Scholar] [CrossRef]
- Myers, R.; Bernal, S.; San Nicolas, R.; Provis, J. Generalized Structural Description of Calcium-Sodium Aluminosilicate Hydrate Gels: The Cross-Linked Substituted Tobermorite Model. Langmuir ACS J. Surf. Colloids 2013, 29. [Google Scholar] [CrossRef] [PubMed]
- Richardson, I.G.; Groves, G.W. The incorporation of minor and trace elements into calcium silicate hydrate (C S H) gel in hardened cement pastes. Cem. Concr. Res. 1993, 23, 131–138. [Google Scholar] [CrossRef]
- Mehta, A.; Siddique, R. Sulfuric acid resistance of fly ash based geopolymer concrete. Constr. Build. Mater. 2017, 146, 136–143. [Google Scholar] [CrossRef]
- Aiken, T.A.; Kwasny, J.; Sha, W.; Soutsos, M.N. Effect of slag content and activator dosage on the resistance of fly ash geopolymer binders to sulfuric acid attack. Cem. Concr. Res. 2018, 111, 23–40. [Google Scholar] [CrossRef] [Green Version]
- Alshaaer, M. Synthesis and characterization of self-healing geopolymer composite. Constr. Build. Mater. 2020, 245, 118432. [Google Scholar] [CrossRef]
- Lahoti, M.; Tan, K.H.; Yang, E.-H. A critical review of geopolymer properties for structural fire-resistance applications. Constr. Build. Mater. 2019, 221, 514–526. [Google Scholar] [CrossRef]
- Laskar, S.M.; Talukdar, S. A study on the performance of damaged RC members repaired using ultra-fine slag based geopolymer mortar. Constr. Build. Mater. 2019, 217, 216–225. [Google Scholar] [CrossRef]
- Xiao, R.; Polaczyk, P.; Zhang, M.; Jiang, X.; Zhang, Y.; Huang, B.; Hu, W. Evaluation of Glass Powder-Based Geopolymer Stabilized Road Bases Containing Recycled Waste Glass Aggregate. Transp. Res. Rec. J. Transp. Res. Board 2020, 2674, 22–32. [Google Scholar] [CrossRef]
- Liang, G.; Zhu, H.; Zhang, Z.; Wu, Q.; Du, J. Investigation of the waterproof property of alkali-activated metakaolin geopolymer added with rice husk ash. J. Clean. Prod. 2019, 230, 603–612. [Google Scholar] [CrossRef]
- Tan, T.H.; Mo, K.H.; Ling, T.-C.; Lai, S.H. Current development of geopolymer as alternative adsorbent for heavy metal removal. Environ. Technol. Innov. 2020, 18, 100684. [Google Scholar] [CrossRef]
- Davidovits, J. Geopolymer Chemistry and Applications; Institut Géopolymère: Saint-Quentin, France, 2008; Volume 171. [Google Scholar]
- Poornima, N.; Katyal, D.; Revathi, T.; Sivasakthi, M.; Jeyalakshmi, R. Effect of curing on mechanical strength and microstructure of fly ash blend GGBS geopolymer, Portland cement mortar and its behavior at elevated temperature. Mater. Today Proc. 2021. [Google Scholar] [CrossRef]
- Ishwarya, G.; Singh, B.; Deshwal, S.; Bhattacharyya, S.K. Effect of sodium carbonate/sodium silicate activator on the rheology, geopolymerization and strength of fly ash/slag geopolymer pastes. Cem. Concr. Compos. 2019, 97, 226–238. [Google Scholar] [CrossRef]
- John, S.K.; Nadir, Y.; Girija, K. Effect of source materials, additives on the mechanical properties and durability of fly ash and fly ash-slag geopolymer mortar: A review. Constr. Build. Mater. 2021, 280, 122443. [Google Scholar] [CrossRef]
- Ababneh, F.A.; Alakhras, A.I.; Heikal, M.; Ibrahim, S.M. Stabilization of lead bearing sludge by utilization in fly ash-slag based geopolymer. Constr. Build. Mater. 2019, 227, 116694. [Google Scholar] [CrossRef]
- Ayeni, O.; Onwualu, A.P.; Boakye, E. Characterization and mechanical performance of metakaolin-based geopolymer for sustainable building applications. Constr. Build. Mater. 2021, 272, 121938. [Google Scholar] [CrossRef]
- Steveson, M.; Sagoe-Crentsil, K. Relationships between composition, structure and strength of inorganic polymers. J. Mater. Sci. 2005, 40, 4247–4259. [Google Scholar] [CrossRef]
- De Silva, P.; Sagoe-Crenstil, K.; Sirivivatnanon, V. Kinetics of geopolymerization: Role of Al2O3 and SiO2. Cem. Concr. Res. 2007, 37, 512–518. [Google Scholar] [CrossRef]
- Riahi, S.; Nemati, A.; Khodabandeh, A.R.; Baghshahi, S. The effect of mixing molar ratios and sand particles on microstructure and mechanical properties of metakaolin-based geopolymers. Mater. Chem. Phys. 2020, 240, 122223. [Google Scholar] [CrossRef]
- White, C.E.; Provis, J.L.; Proffen, T.; Van Deventer, J.S.J. The Effects of Temperature on the Local Structure of Metakaolin-Based Geopolymer Binder: A Neutron Pair Distribution Function Investigation. J. Am. Ceram. Soc. 2010, 93, 3486–3492. [Google Scholar] [CrossRef]


| Compositions | SiO2 | Al2O3 | TiO2 | Fe2O3 | CaO | MgO | Na2O | Others |
|---|---|---|---|---|---|---|---|---|
| w.t.(%) | 53 | 39 | 2.71 | 1.76 | 0.17 | 0.9 | 0.3 | 2.14 |
| Fineness | Activity Index | Specific Surface Area (kg/m2) | LOI |
|---|---|---|---|
| 1250 | ≥110 | 437 | 1.62 |
| Sodium Silicate | Na2O (w.t.%) | SiO2 (w.t.%) | H2O (w.t.%) | Be (°C) | Modulus | Transparency (%) |
|---|---|---|---|---|---|---|
| Index values | 8.5 | 26.5 | 65 | 40 | 3.2 | ≥84 |
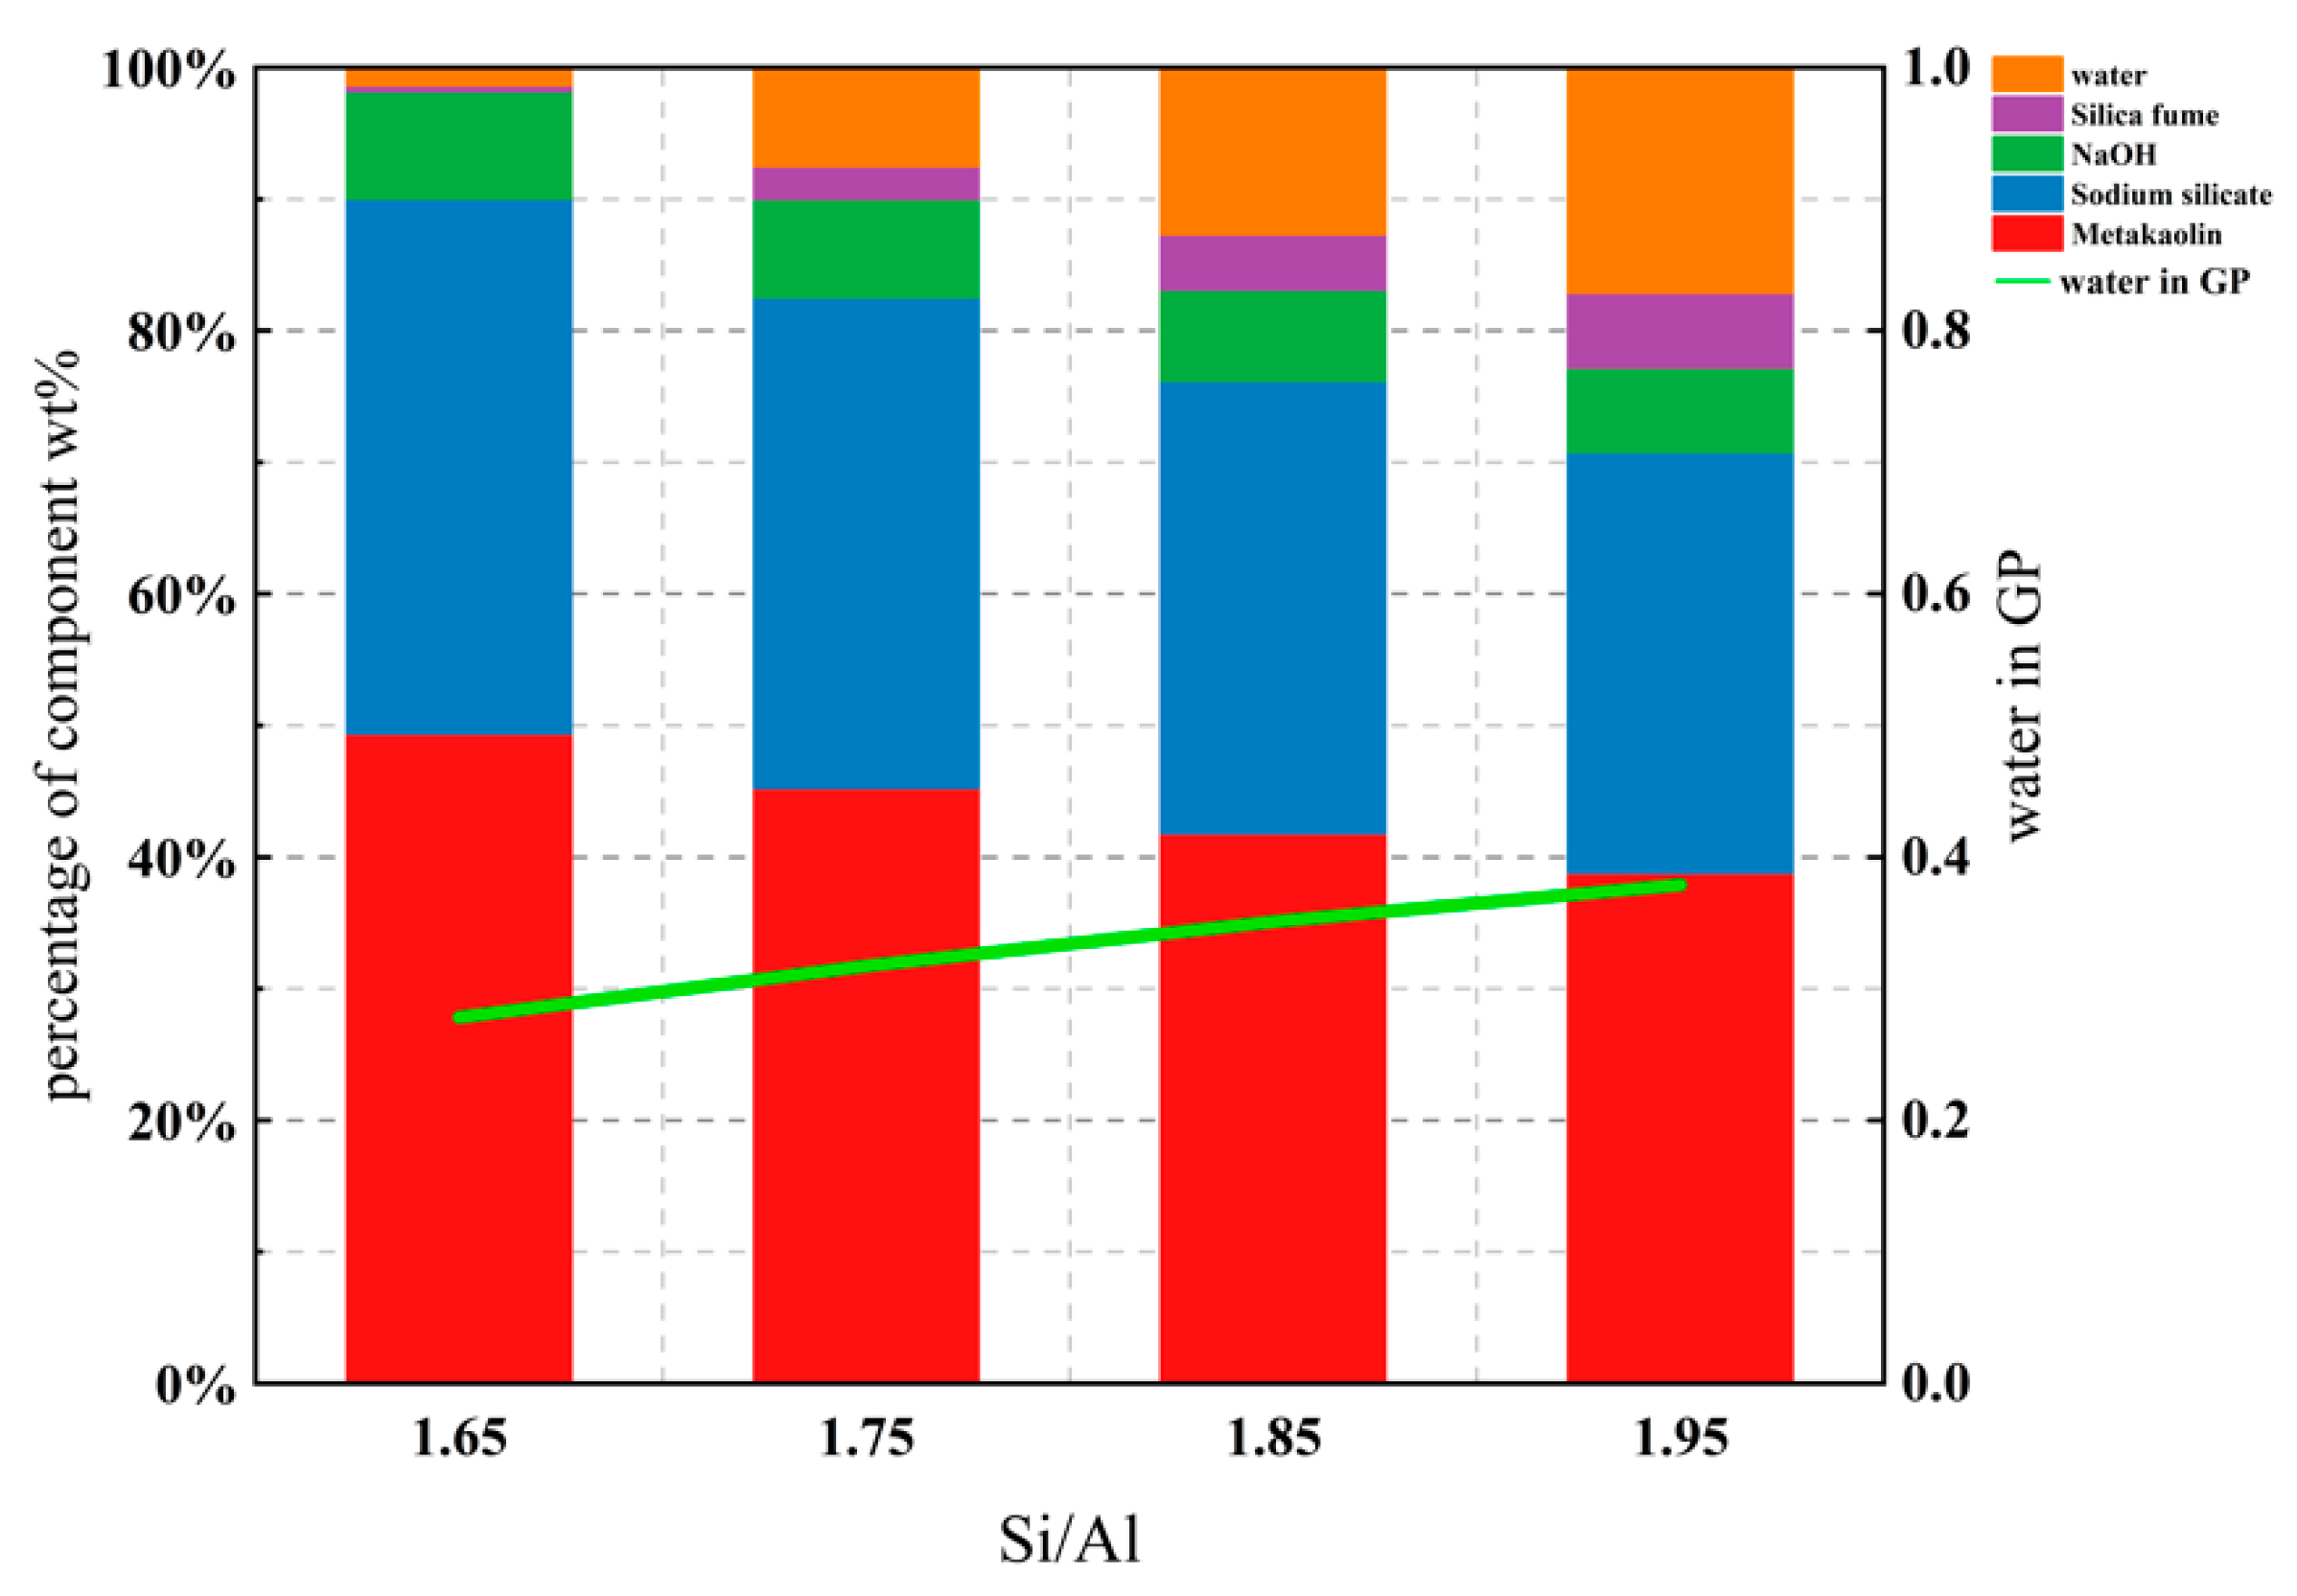
| GP Sample | Metakaolin | Sodium Silicate | Silica Fume | NaOH | Si/Al (Molar Ratio) | Na/Al (Molar Ratio) | Water in GP (w.t.%) |
|---|---|---|---|---|---|---|---|
| MKSiAl1.65 | 1050 | 864 | 9.45 | 173.92 | 1.65 | 0.83 | 0.278 |
| MKSiAl1.7 | 1050 | 864 | 33.54 | 173.92 | 1.70 | 0.83 | 0.298 |
| MKSiAl1.75 | 1050 | 864 | 57.62 | 173.92 | 1.75 | 0.83 | 0.317 |
| MKSiAl1.8 | 1050 | 864 | 81.72 | 173.92 | 1.80 | 0.83 | 0.334 |
| MKSiAl1.85 | 1050 | 864 | 105.80 | 173.92 | 1.85 | 0.83 | 0.350 |
| MKSiAl1.9 | 1050 | 864 | 129.89 | 173.92 | 1.90 | 0.83 | 0.365 |
| MKSiAl1.95 | 1050 | 864 | 153.98 | 173.92 | 1.95 | 0.83 | 0.379 |
| GP Sample | Metakaolin | Sodium Silicate | Silica Fume | NaOH | Si/Al (Molar Ratio) | Na/Al (Molar Ratio) |
|---|---|---|---|---|---|---|
| MKNaAl0.43 | 1050 | 864 | 104.81 | 43.34 | 1.85 | 0.43 |
| MKNaAl0.43 | 1050 | 864 | 104.81 | 75.45 | 1.85 | 0.53 |
| MKNaAl0.43 | 1050 | 864 | 104.81 | 107.56 | 1.85 | 0.63 |
| MKNaAl0.43 | 1050 | 864 | 104.81 | 139.64 | 1.85 | 0.73 |
| MKNaAl0.43 | 1050 | 864 | 104.81 | 173.92 | 1.85 | 0.83 |
| MKNaAl0.43 | 1050 | 864 | 104.81 | 203.92 | 1.85 | 0.93 |
Publisher’s Note: MDPI stays neutral with regard to jurisdictional claims in published maps and institutional affiliations. |
© 2021 by the authors. Licensee MDPI, Basel, Switzerland. This article is an open access article distributed under the terms and conditions of the Creative Commons Attribution (CC BY) license (https://creativecommons.org/licenses/by/4.0/).
Share and Cite
Wang, H.; Wu, H.; Xing, Z.; Wang, R.; Dai, S. The Effect of Various Si/Al, Na/Al Molar Ratios and Free Water on Micromorphology and Macro-Strength of Metakaolin-Based Geopolymer. Materials 2021, 14, 3845. https://doi.org/10.3390/ma14143845
Wang H, Wu H, Xing Z, Wang R, Dai S. The Effect of Various Si/Al, Na/Al Molar Ratios and Free Water on Micromorphology and Macro-Strength of Metakaolin-Based Geopolymer. Materials. 2021; 14(14):3845. https://doi.org/10.3390/ma14143845
Chicago/Turabian StyleWang, Hongguang, Hao Wu, Zhiqiang Xing, Rui Wang, and Shoushuai Dai. 2021. "The Effect of Various Si/Al, Na/Al Molar Ratios and Free Water on Micromorphology and Macro-Strength of Metakaolin-Based Geopolymer" Materials 14, no. 14: 3845. https://doi.org/10.3390/ma14143845
APA StyleWang, H., Wu, H., Xing, Z., Wang, R., & Dai, S. (2021). The Effect of Various Si/Al, Na/Al Molar Ratios and Free Water on Micromorphology and Macro-Strength of Metakaolin-Based Geopolymer. Materials, 14(14), 3845. https://doi.org/10.3390/ma14143845