
Preparation and Mechanical-Fatigue Properties of Elastic Polyurethane Concrete Composites


Abstract
:1. Introduction
2. Experimental Methods
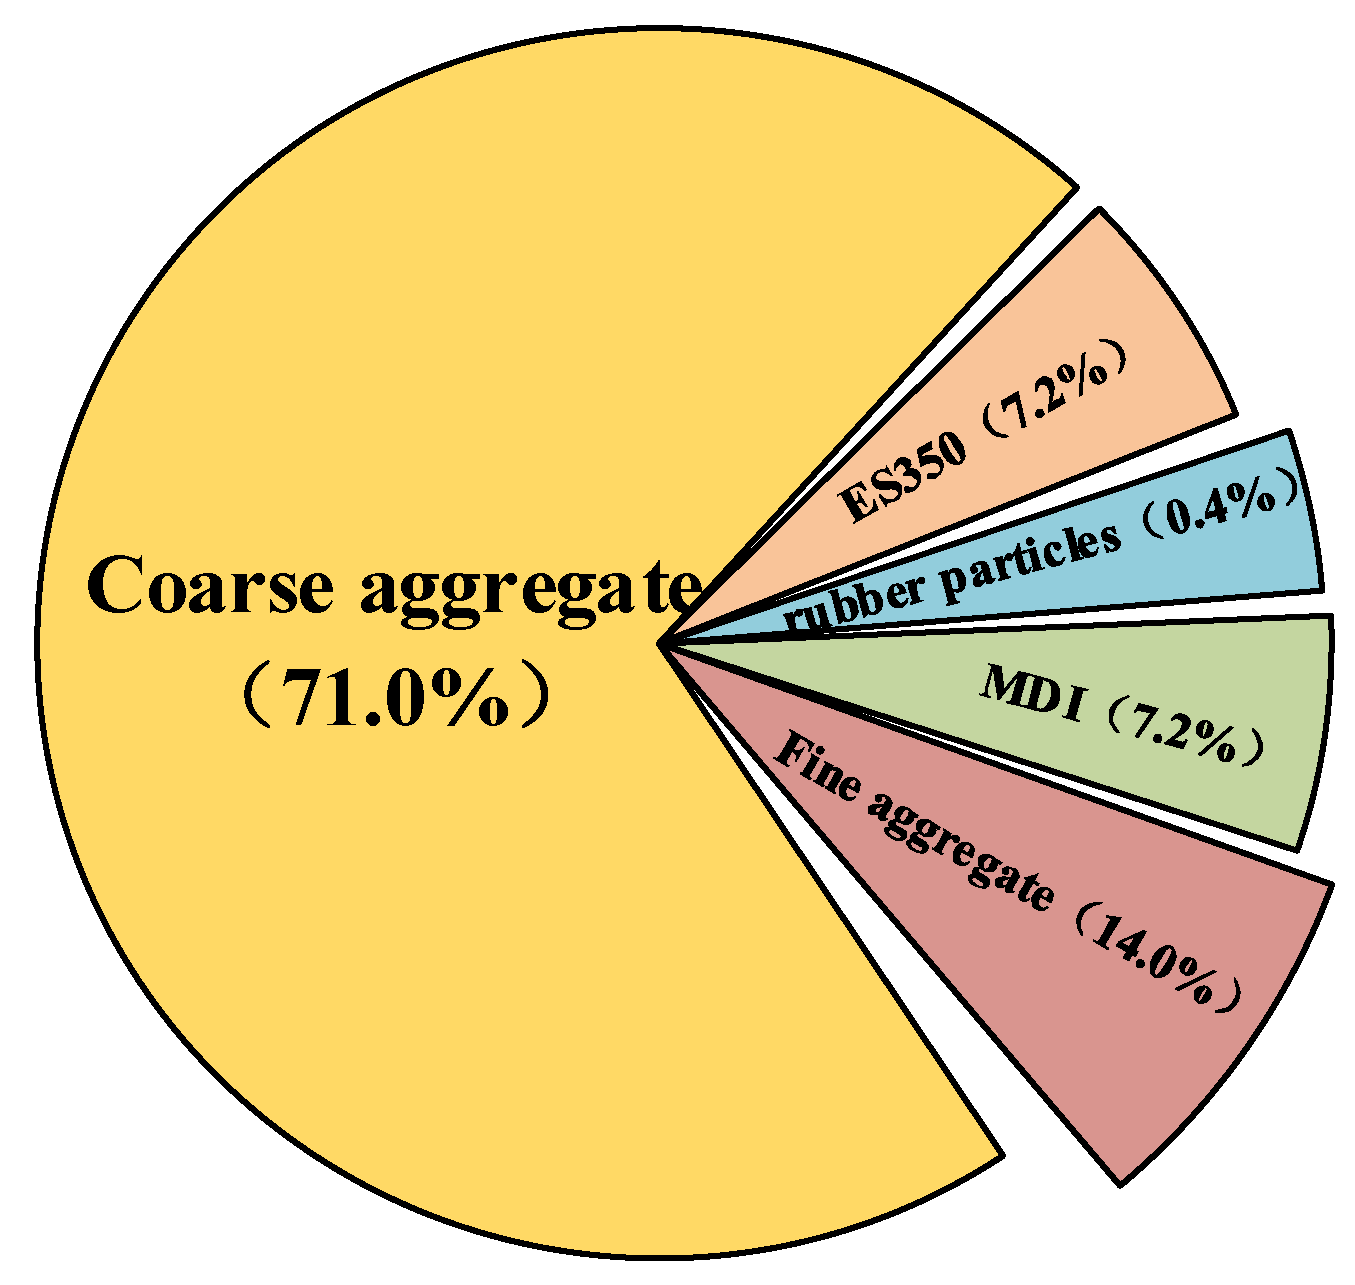
2.1. Materials
2.2. Preparation of Reversible Photochromic PUC
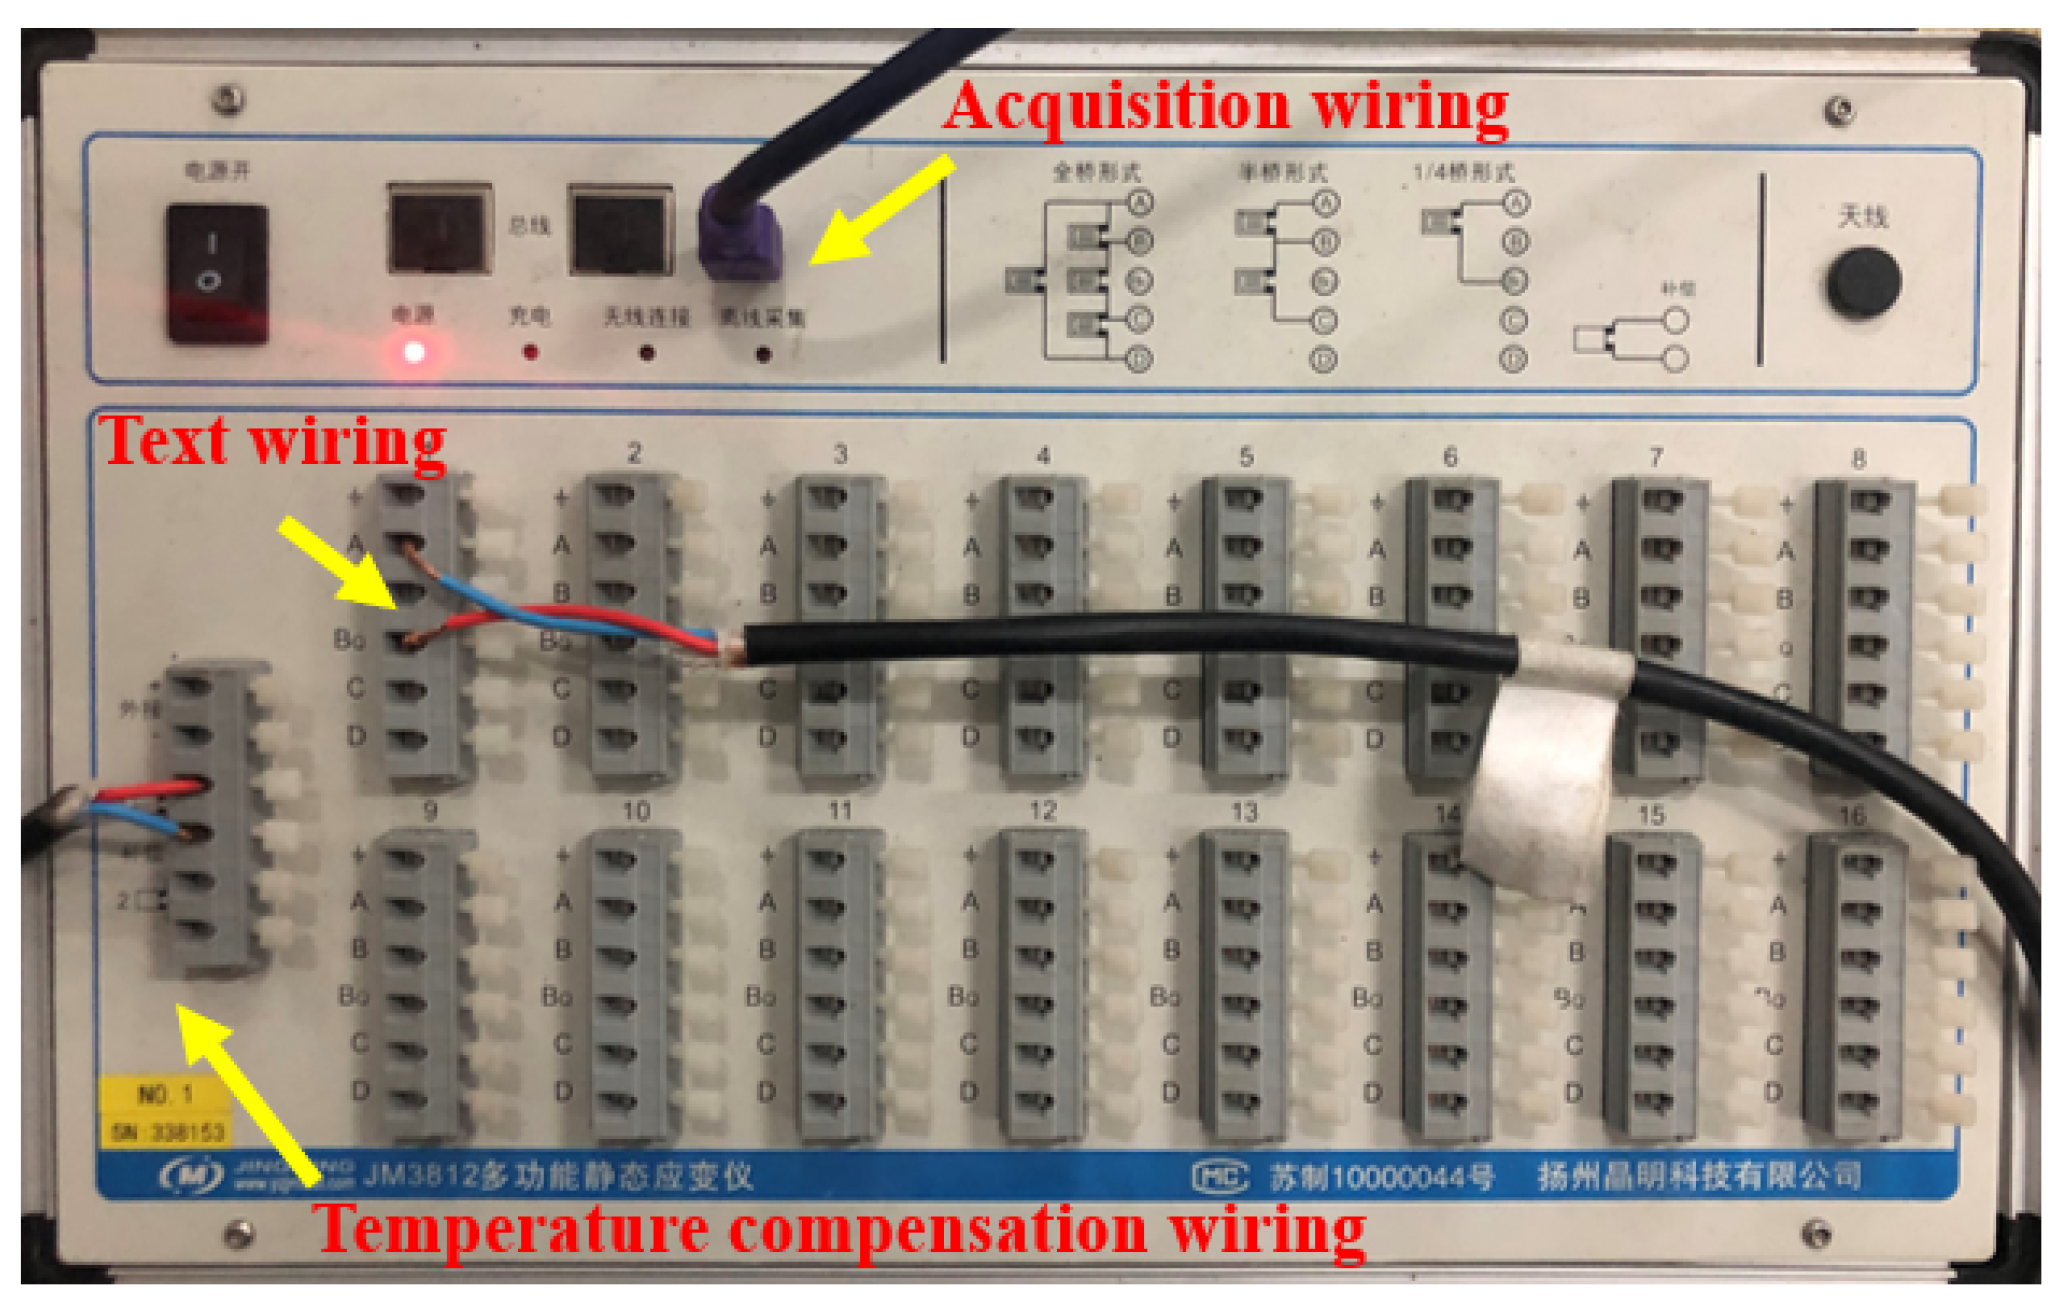
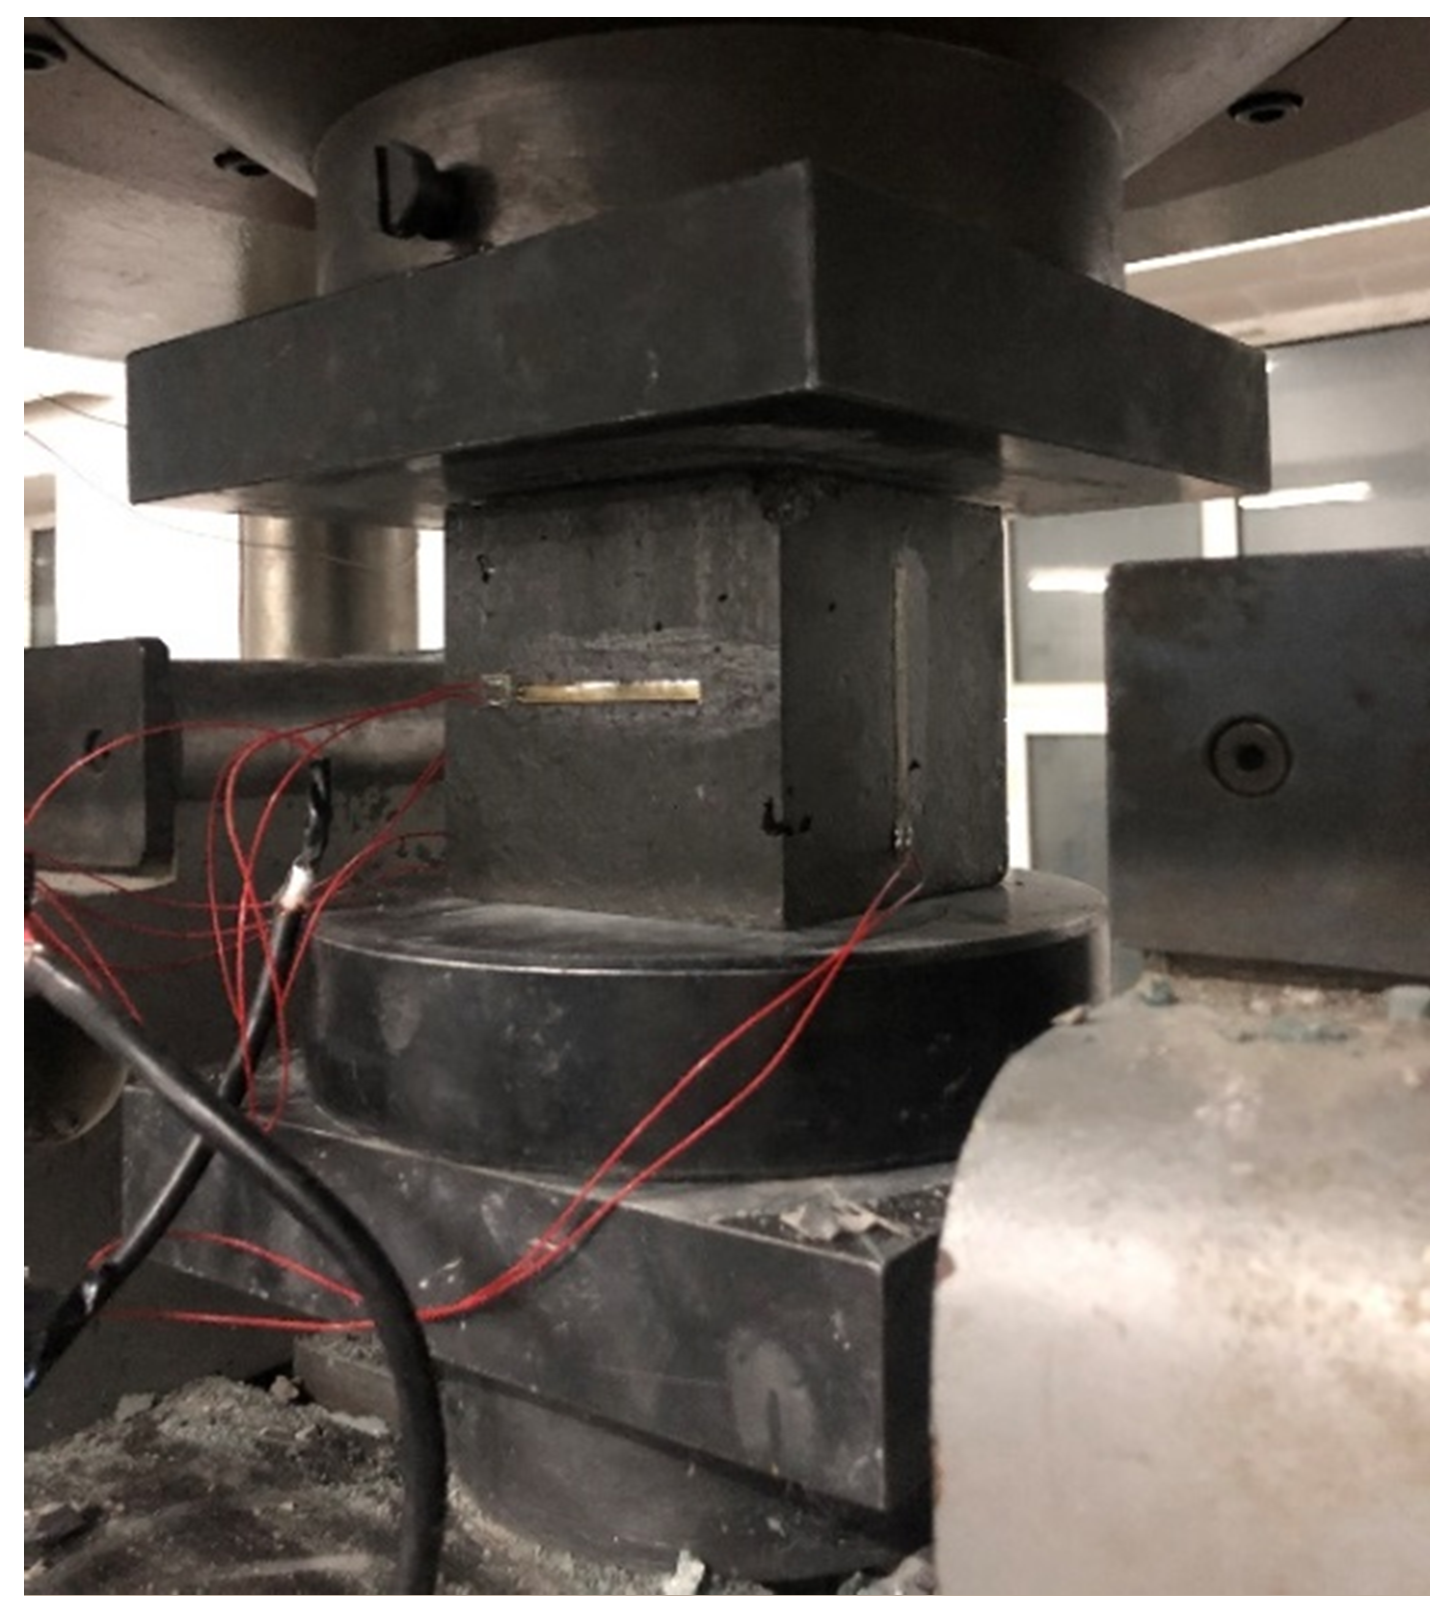
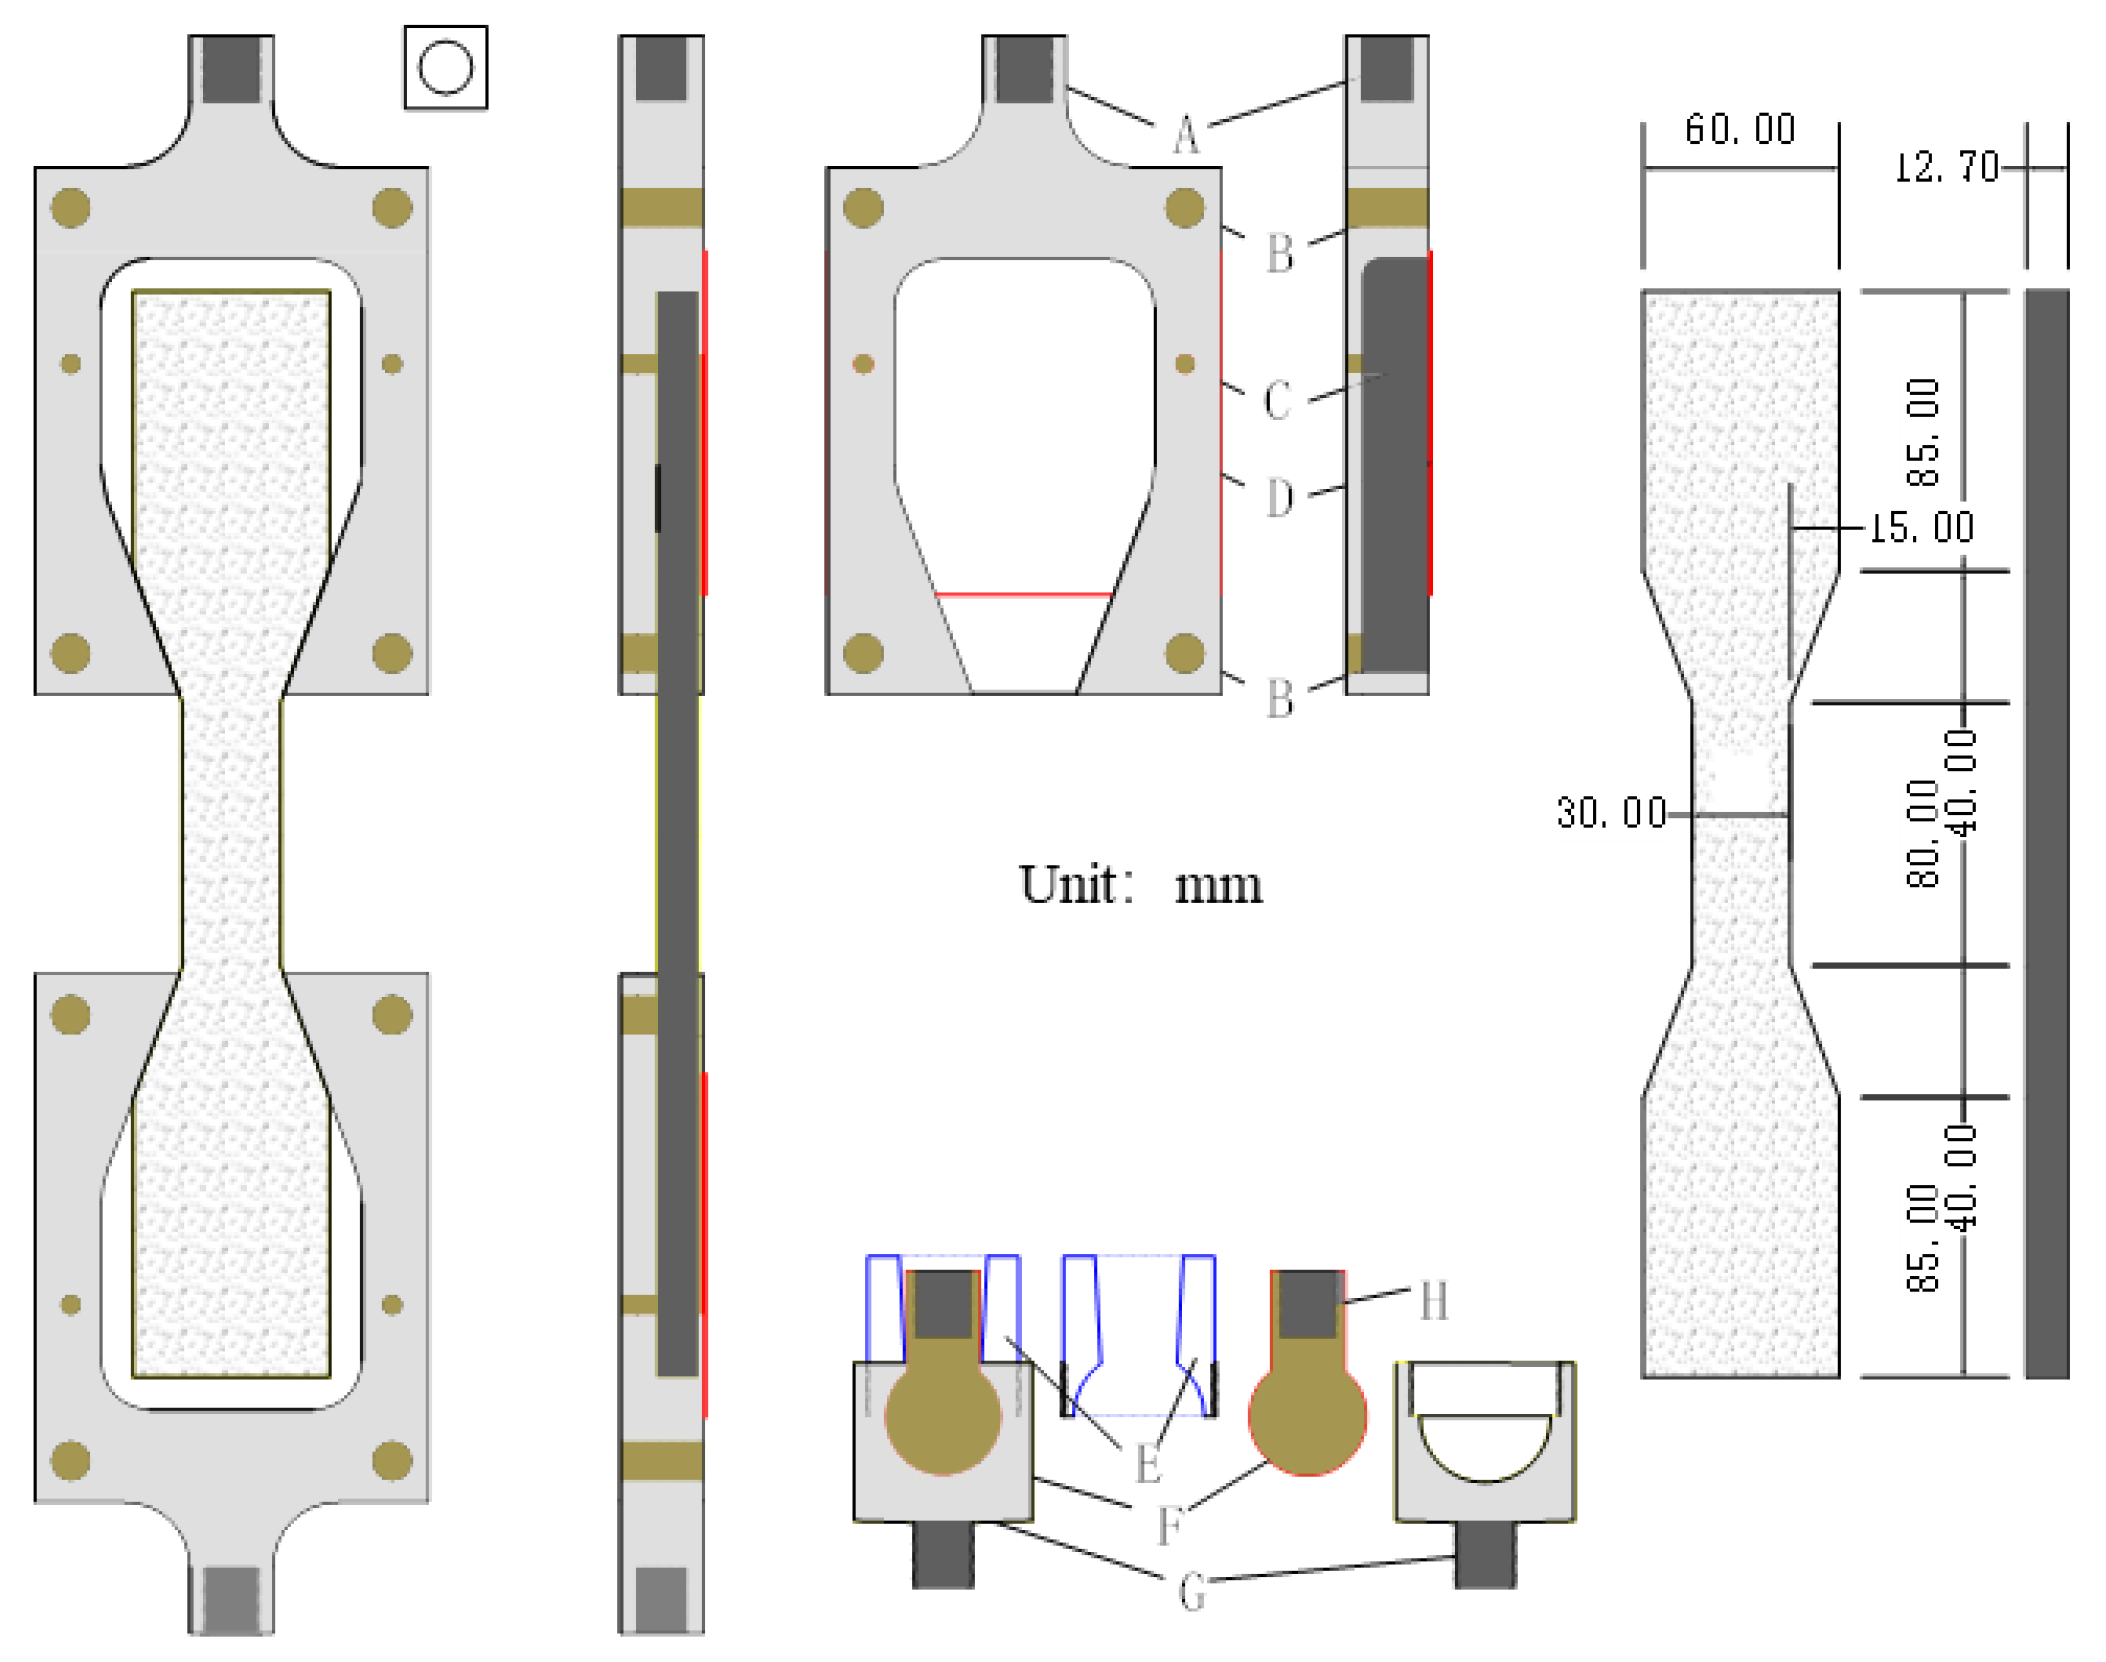
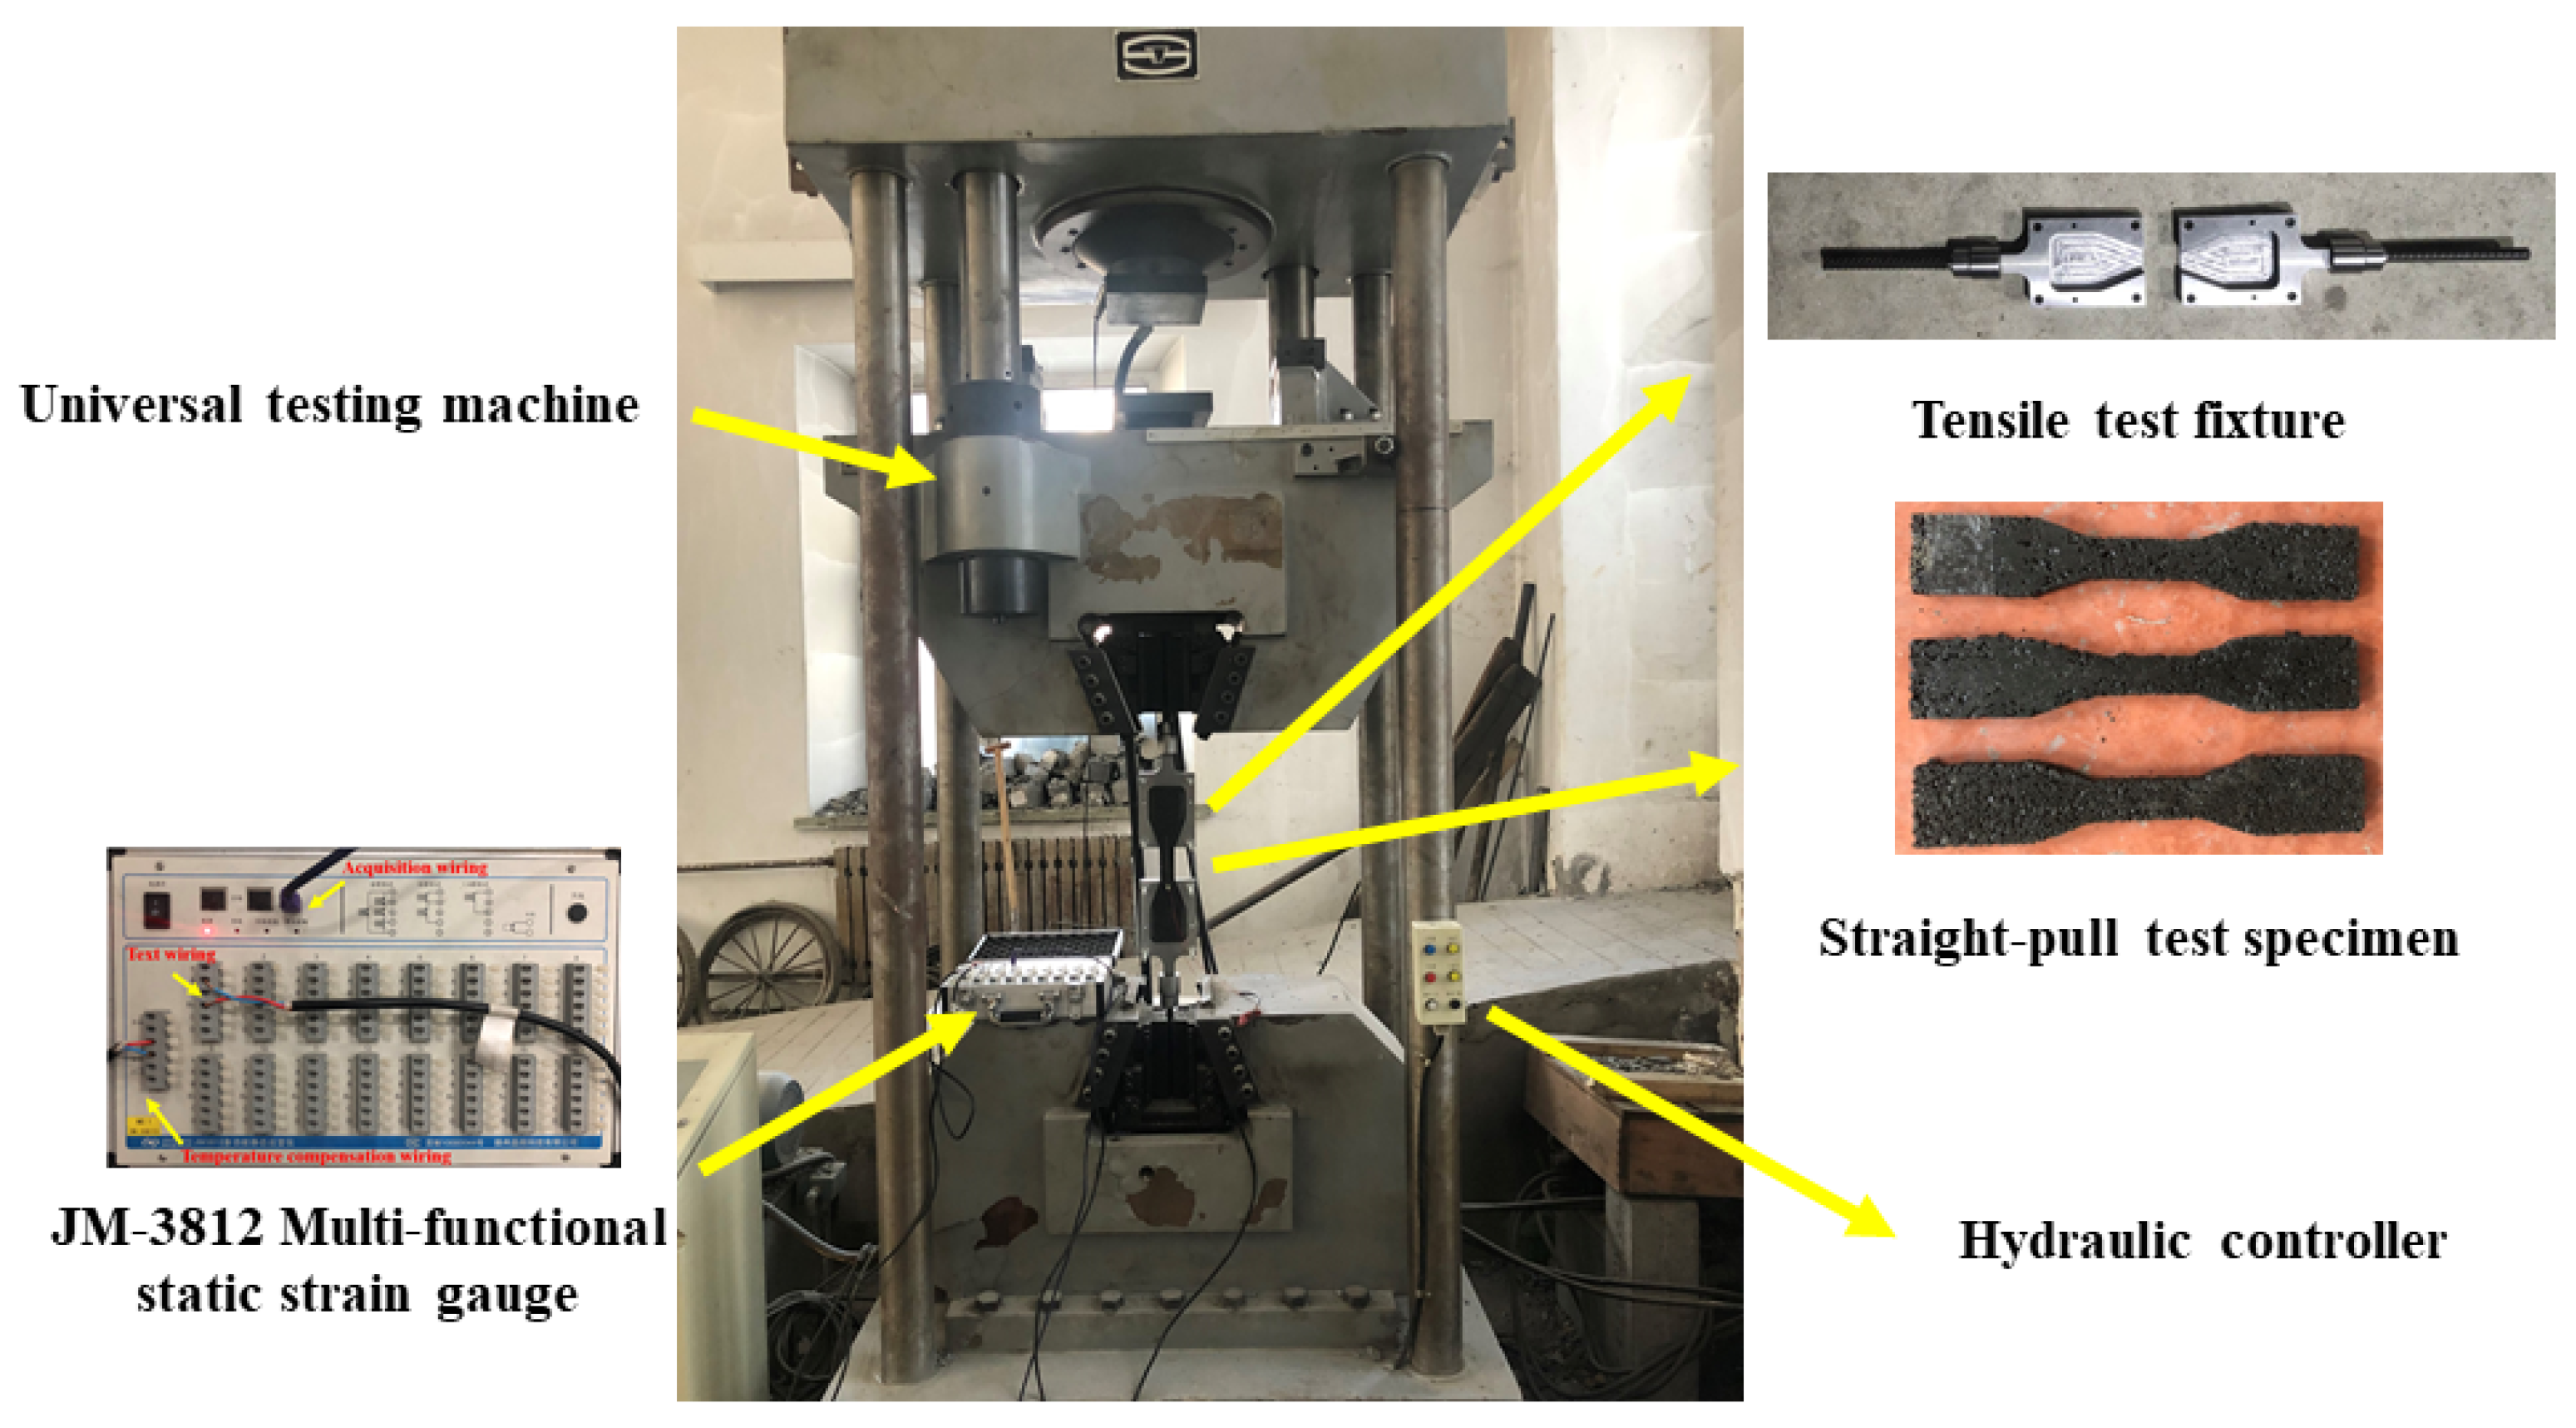
2.3. Mechanical Properties Test
- F—ultimate load (N);
- A—compression area (mm2).
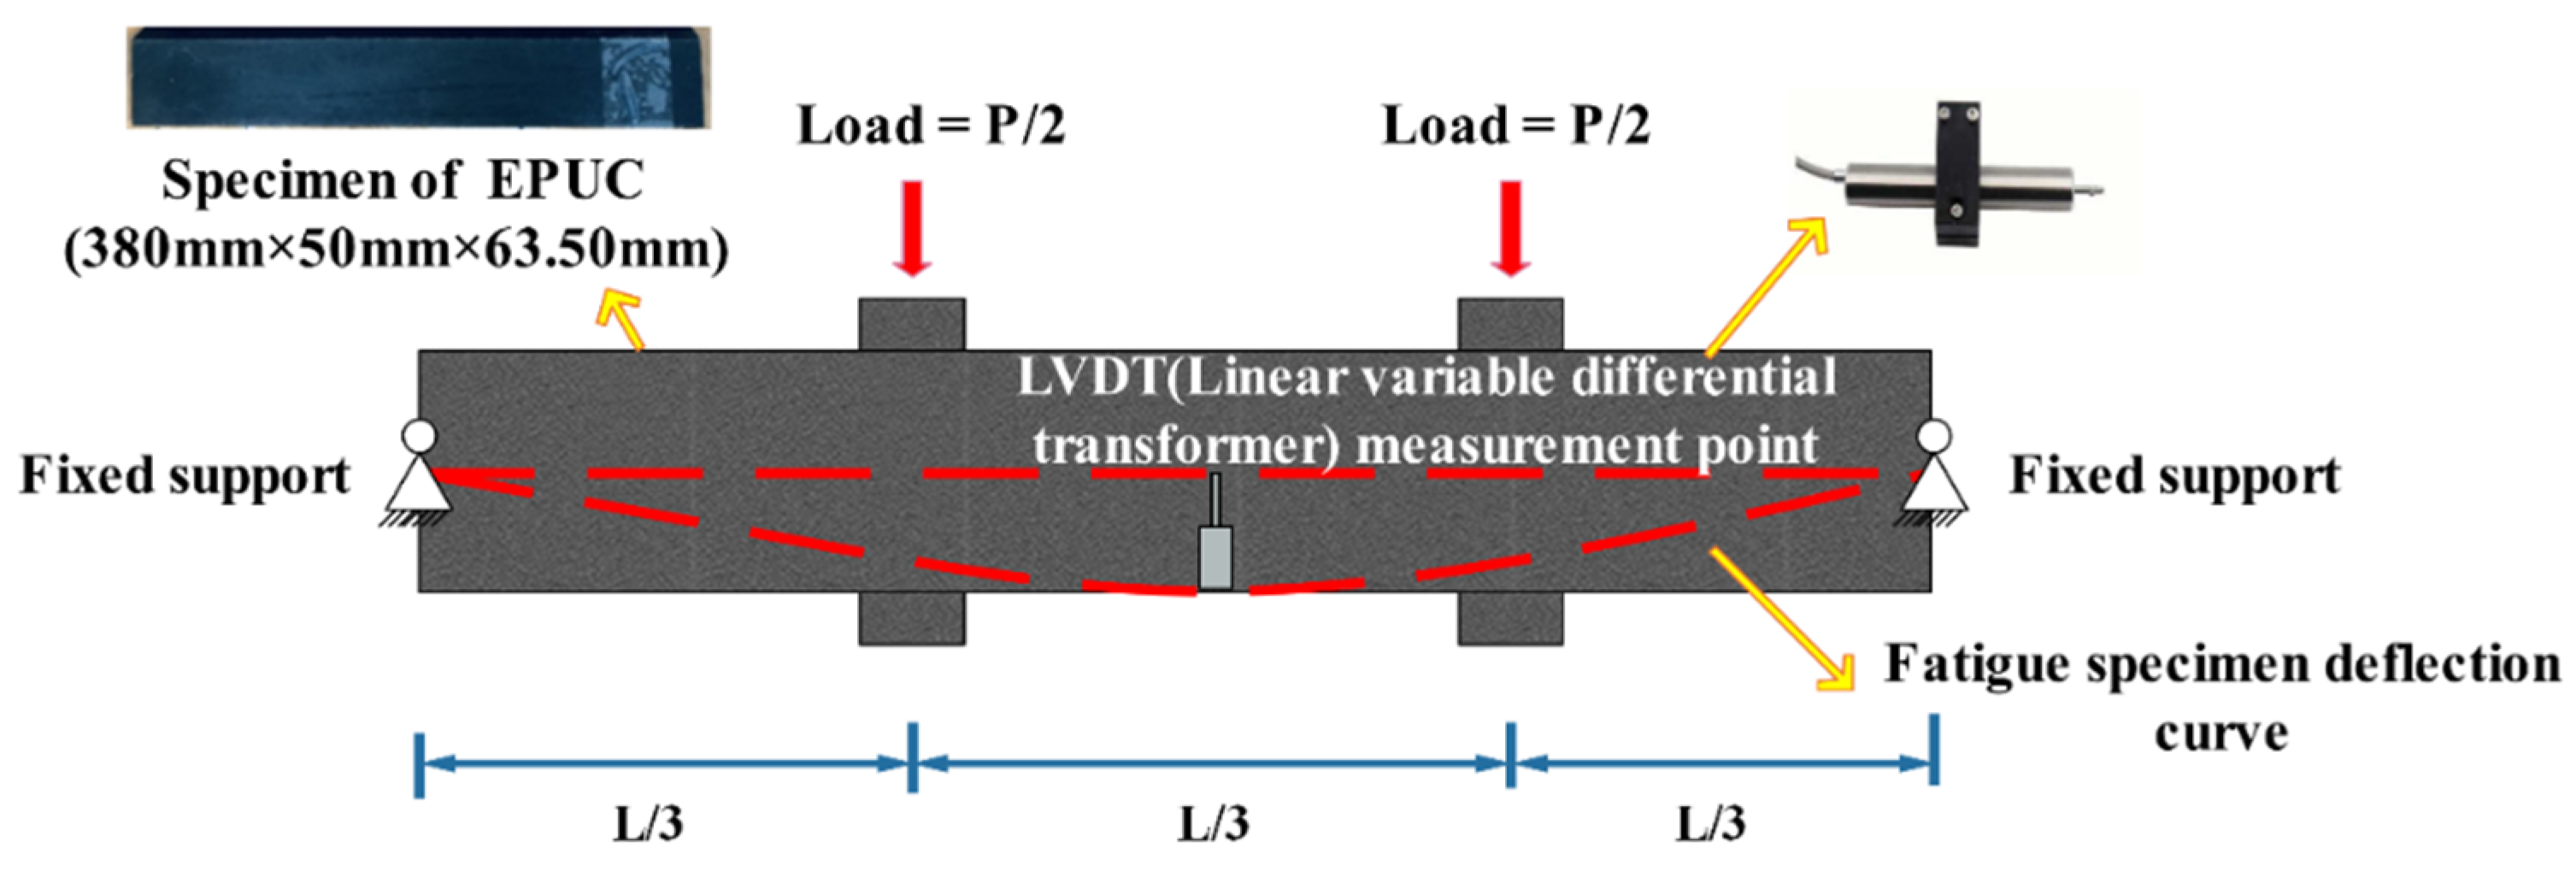
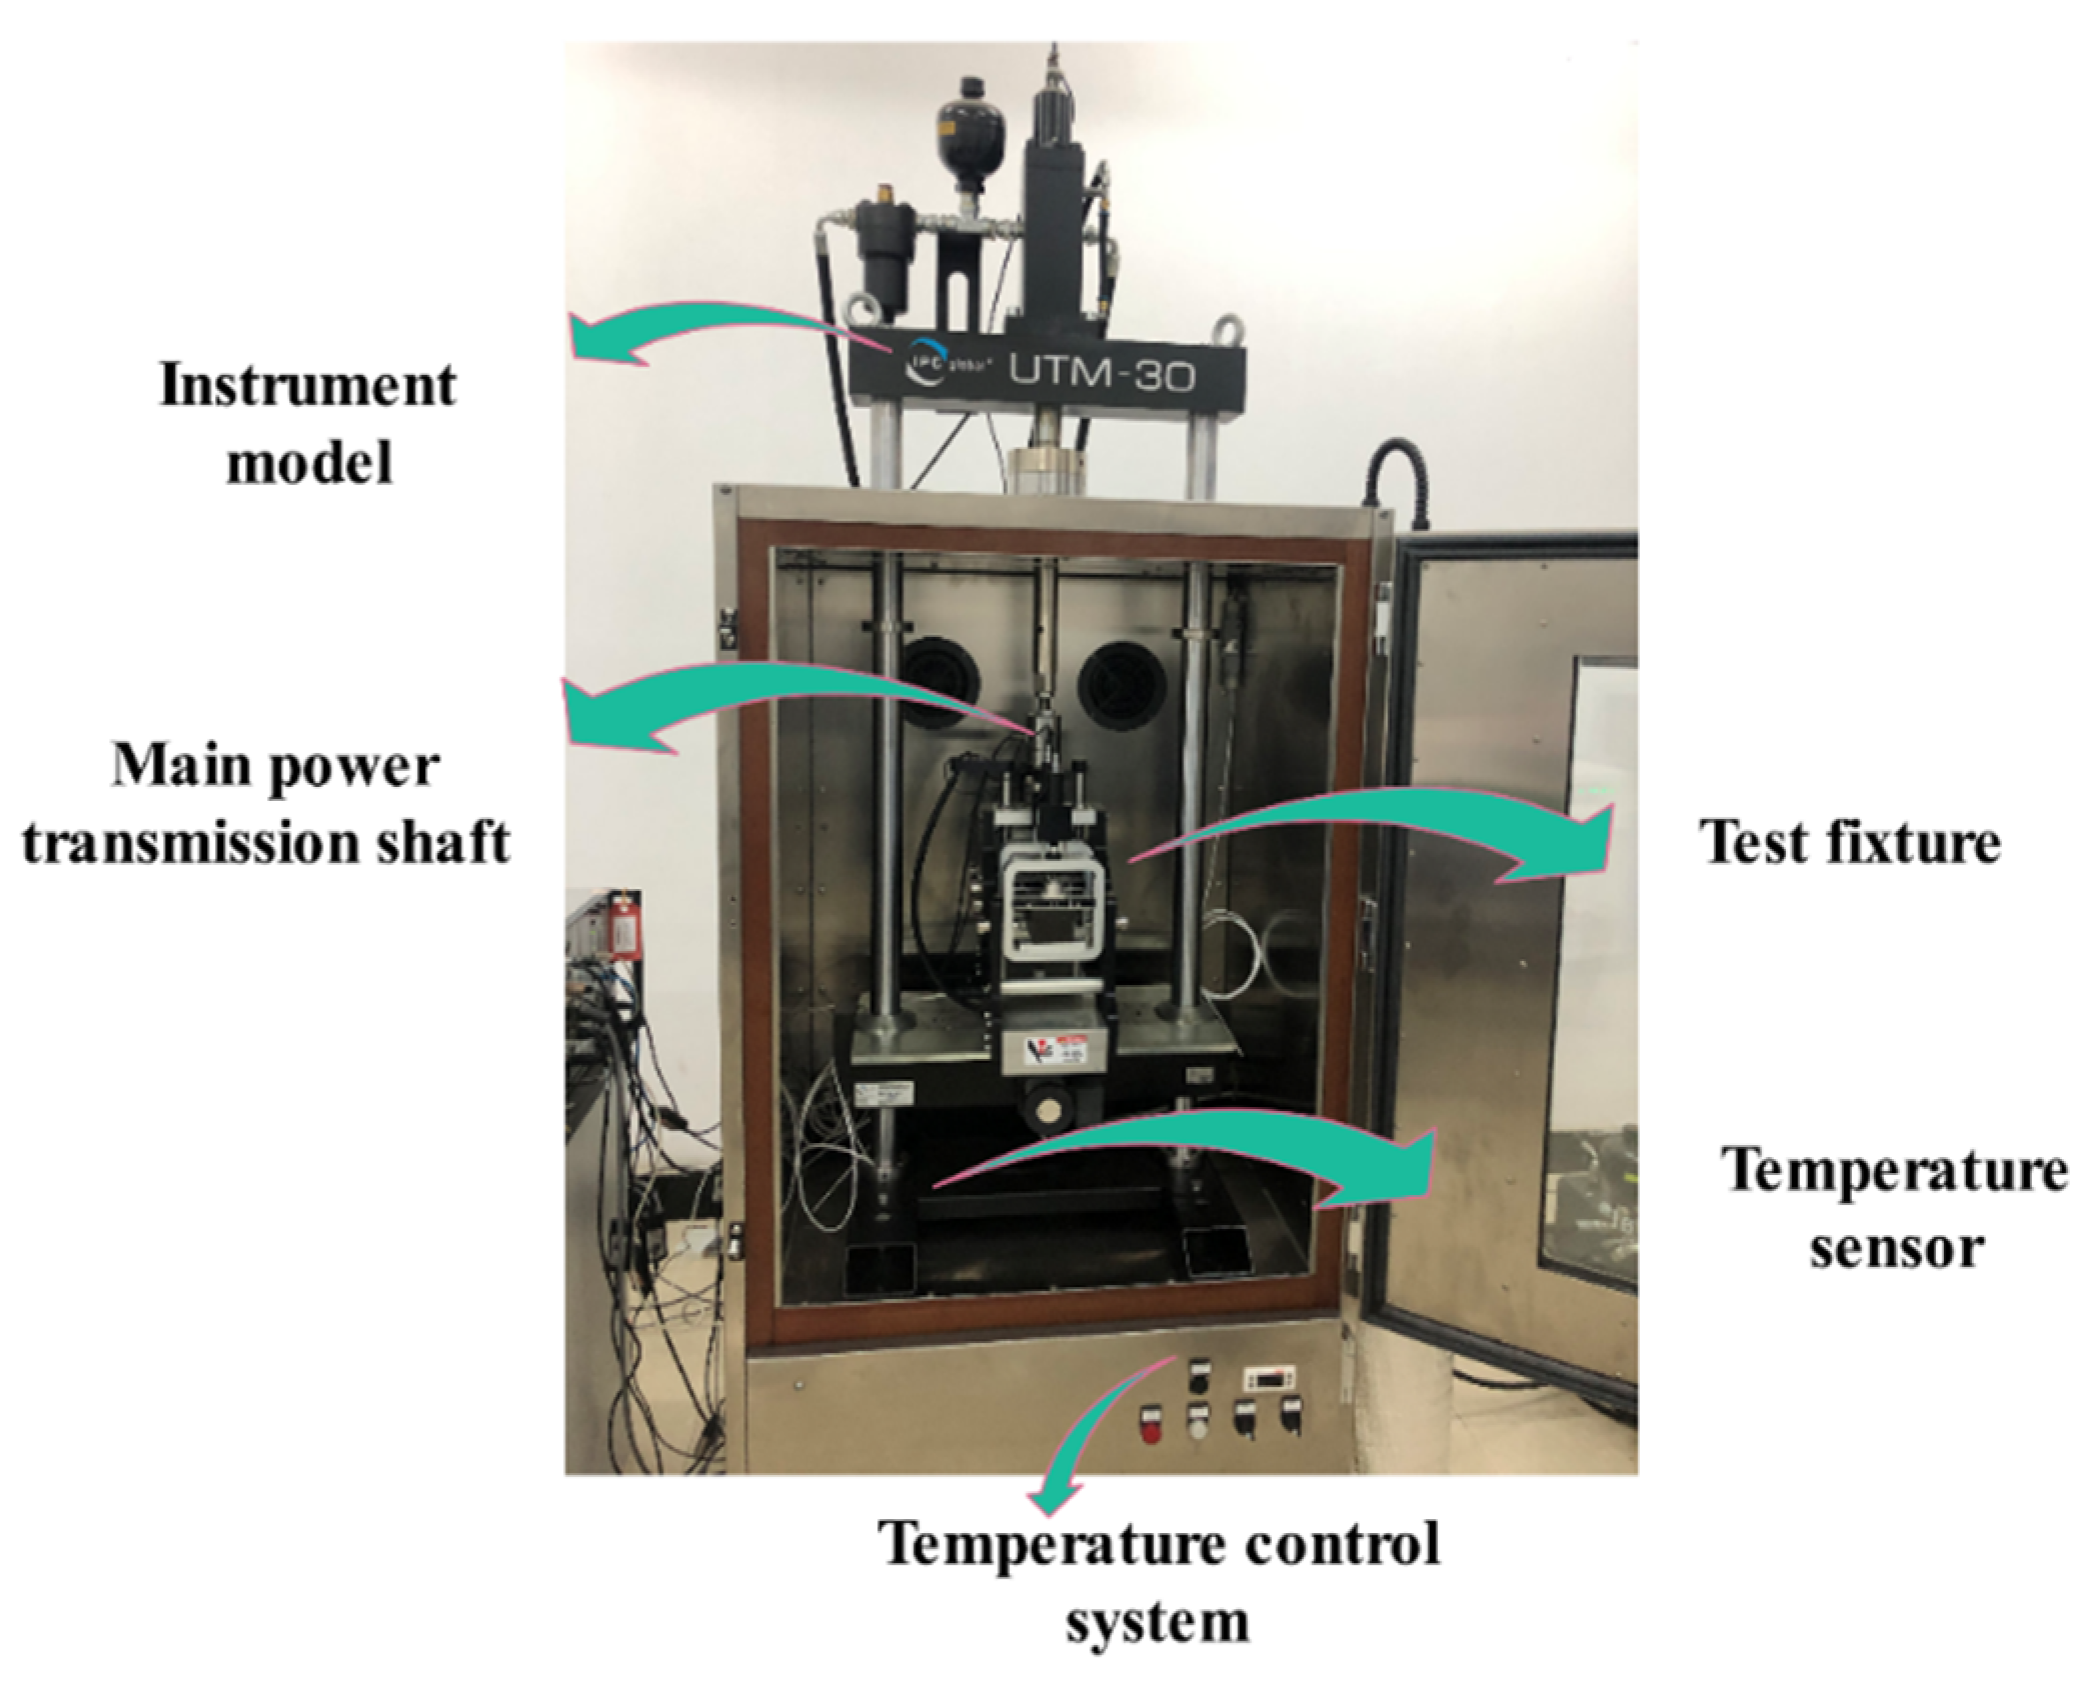
2.4. Fatigue Test
- P = the peak load (N);
- = the width of the bending specimen;
- h = the height of the bending specimen;
- = the maximum strain of the specimen center;
- a = the intermediate spacing between adjacent collets (m).
- f = loading frequency (Hz);
- t = time of hysteresis deformation (s).where = dissipated energy of a single cycle (J/m3).where = cumulative dissipated energy (J/m3);
- = dissipated energy of a single cycle (J/m3).
2.5. Characterizations
3. Results and Discussion
3.1. Mechanical Properties
- (1)
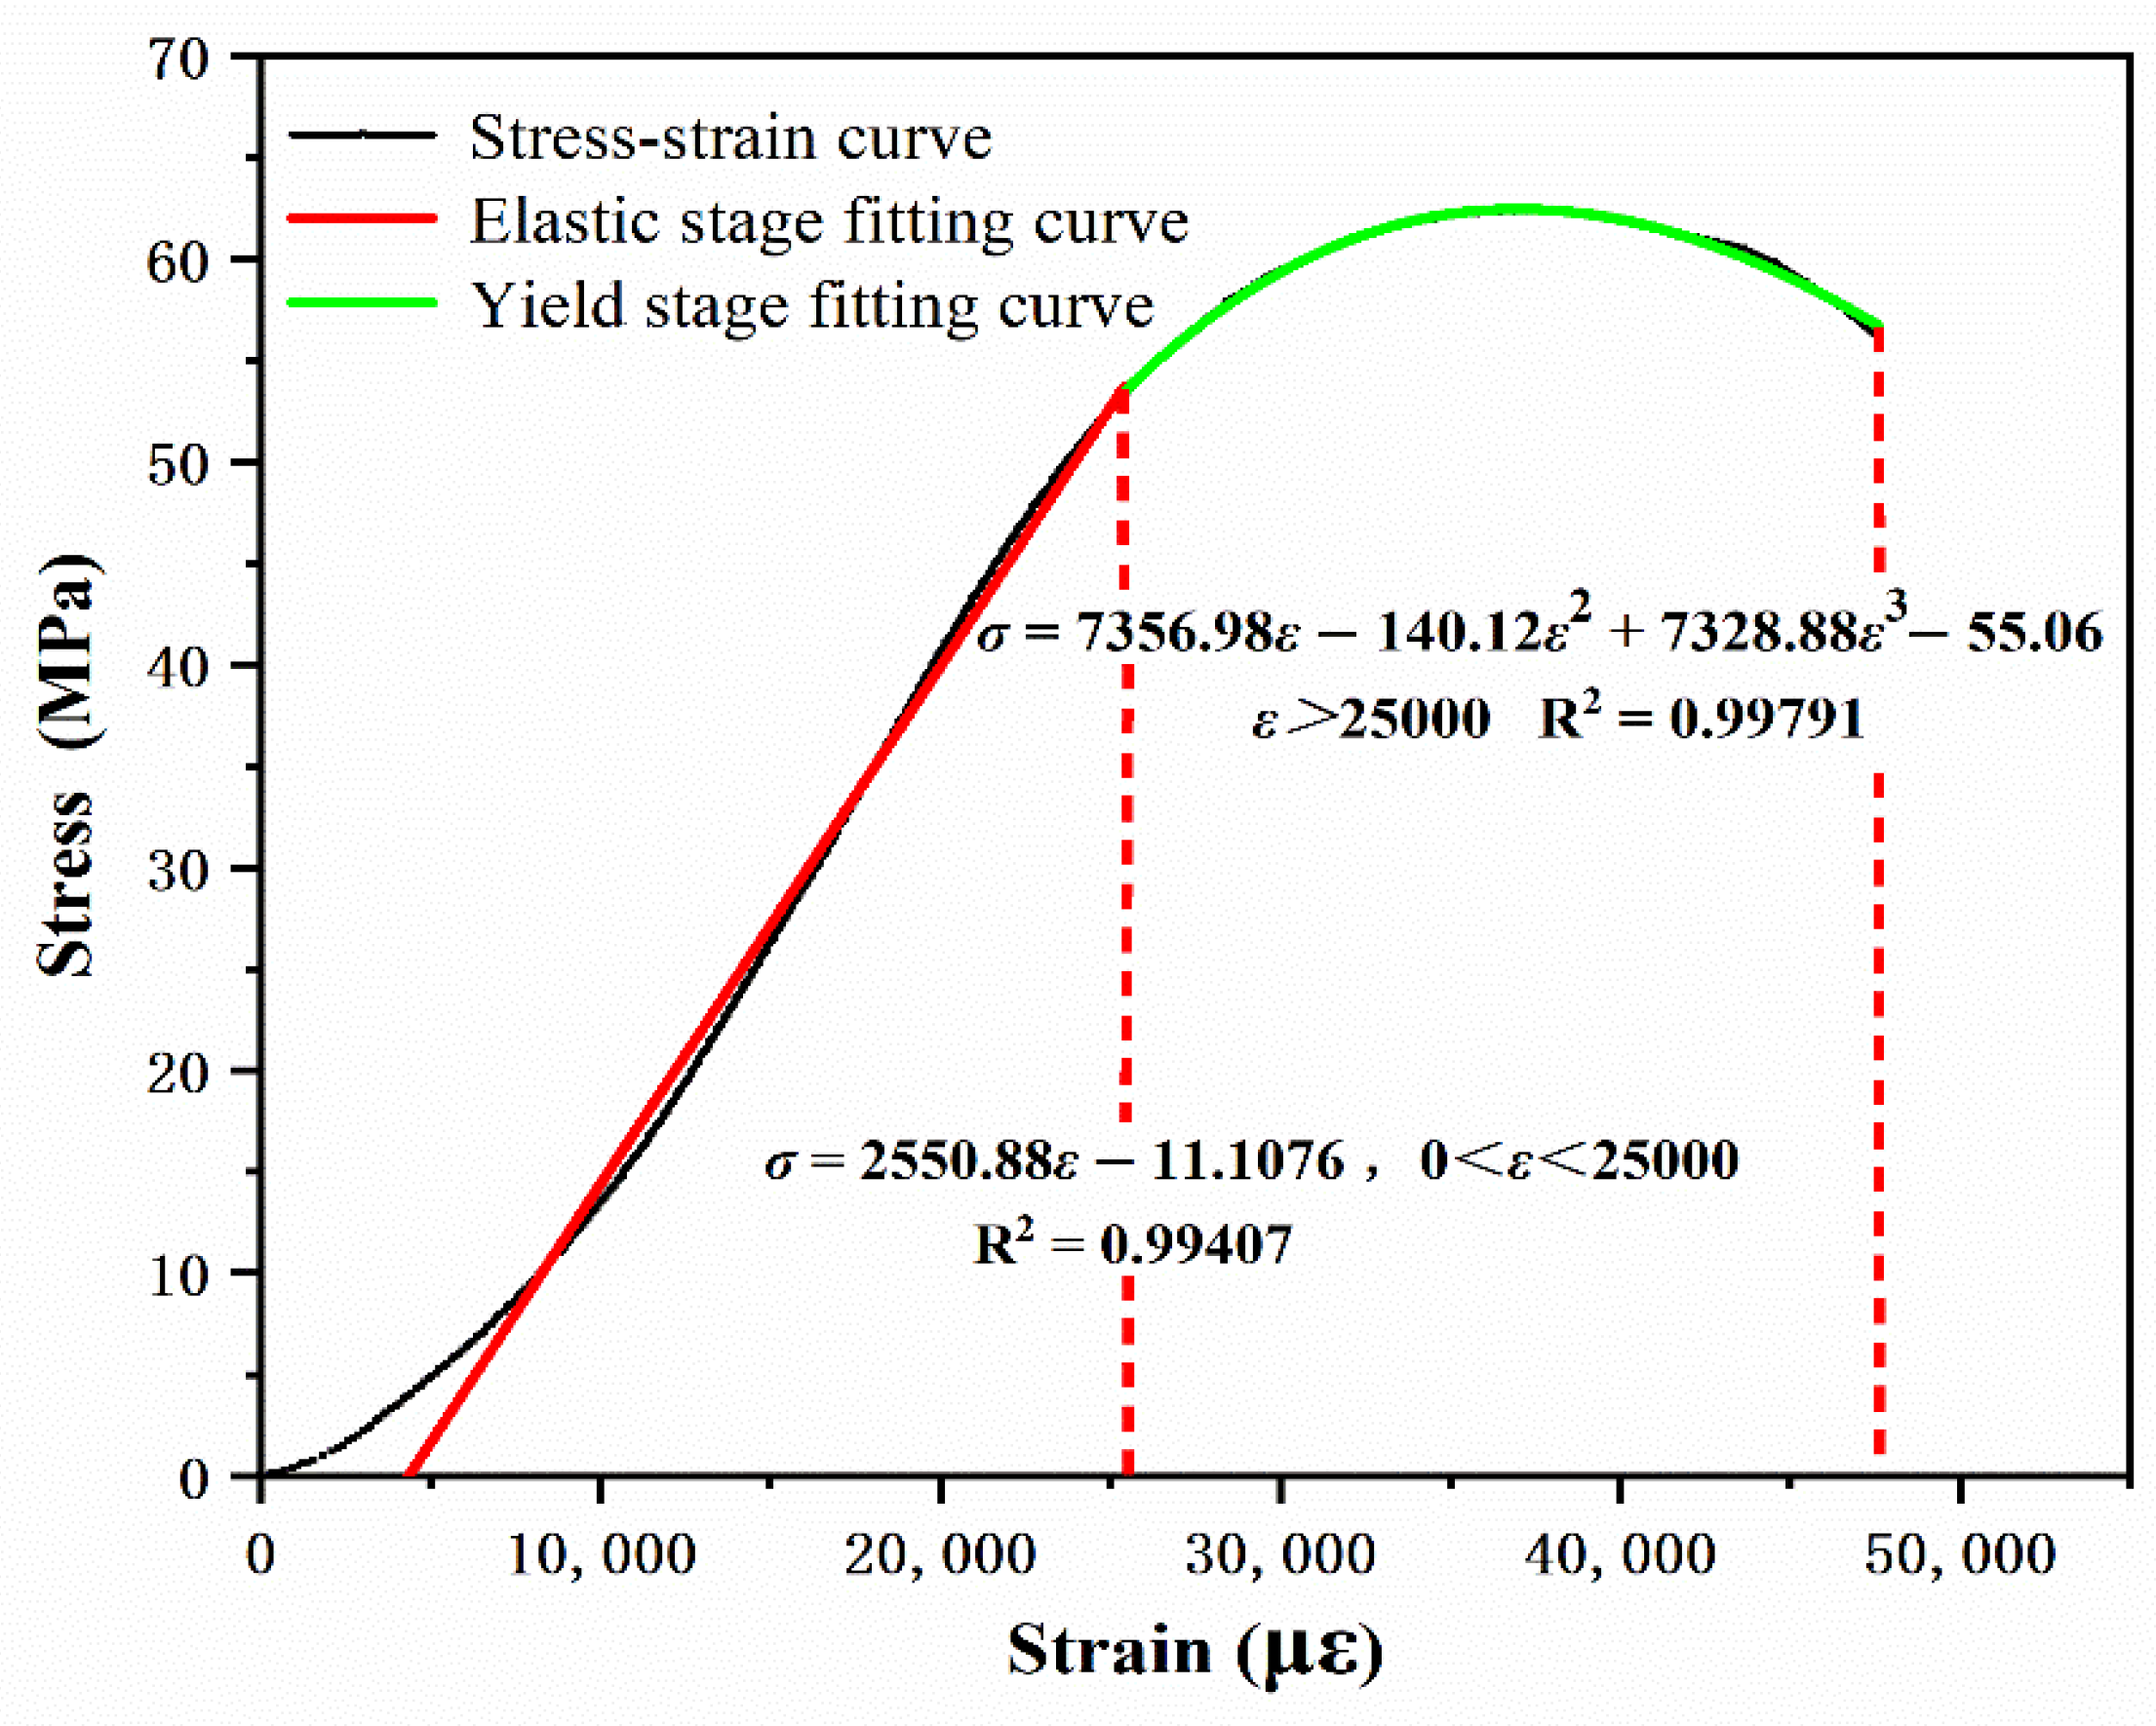
- Compression properties
- (2)
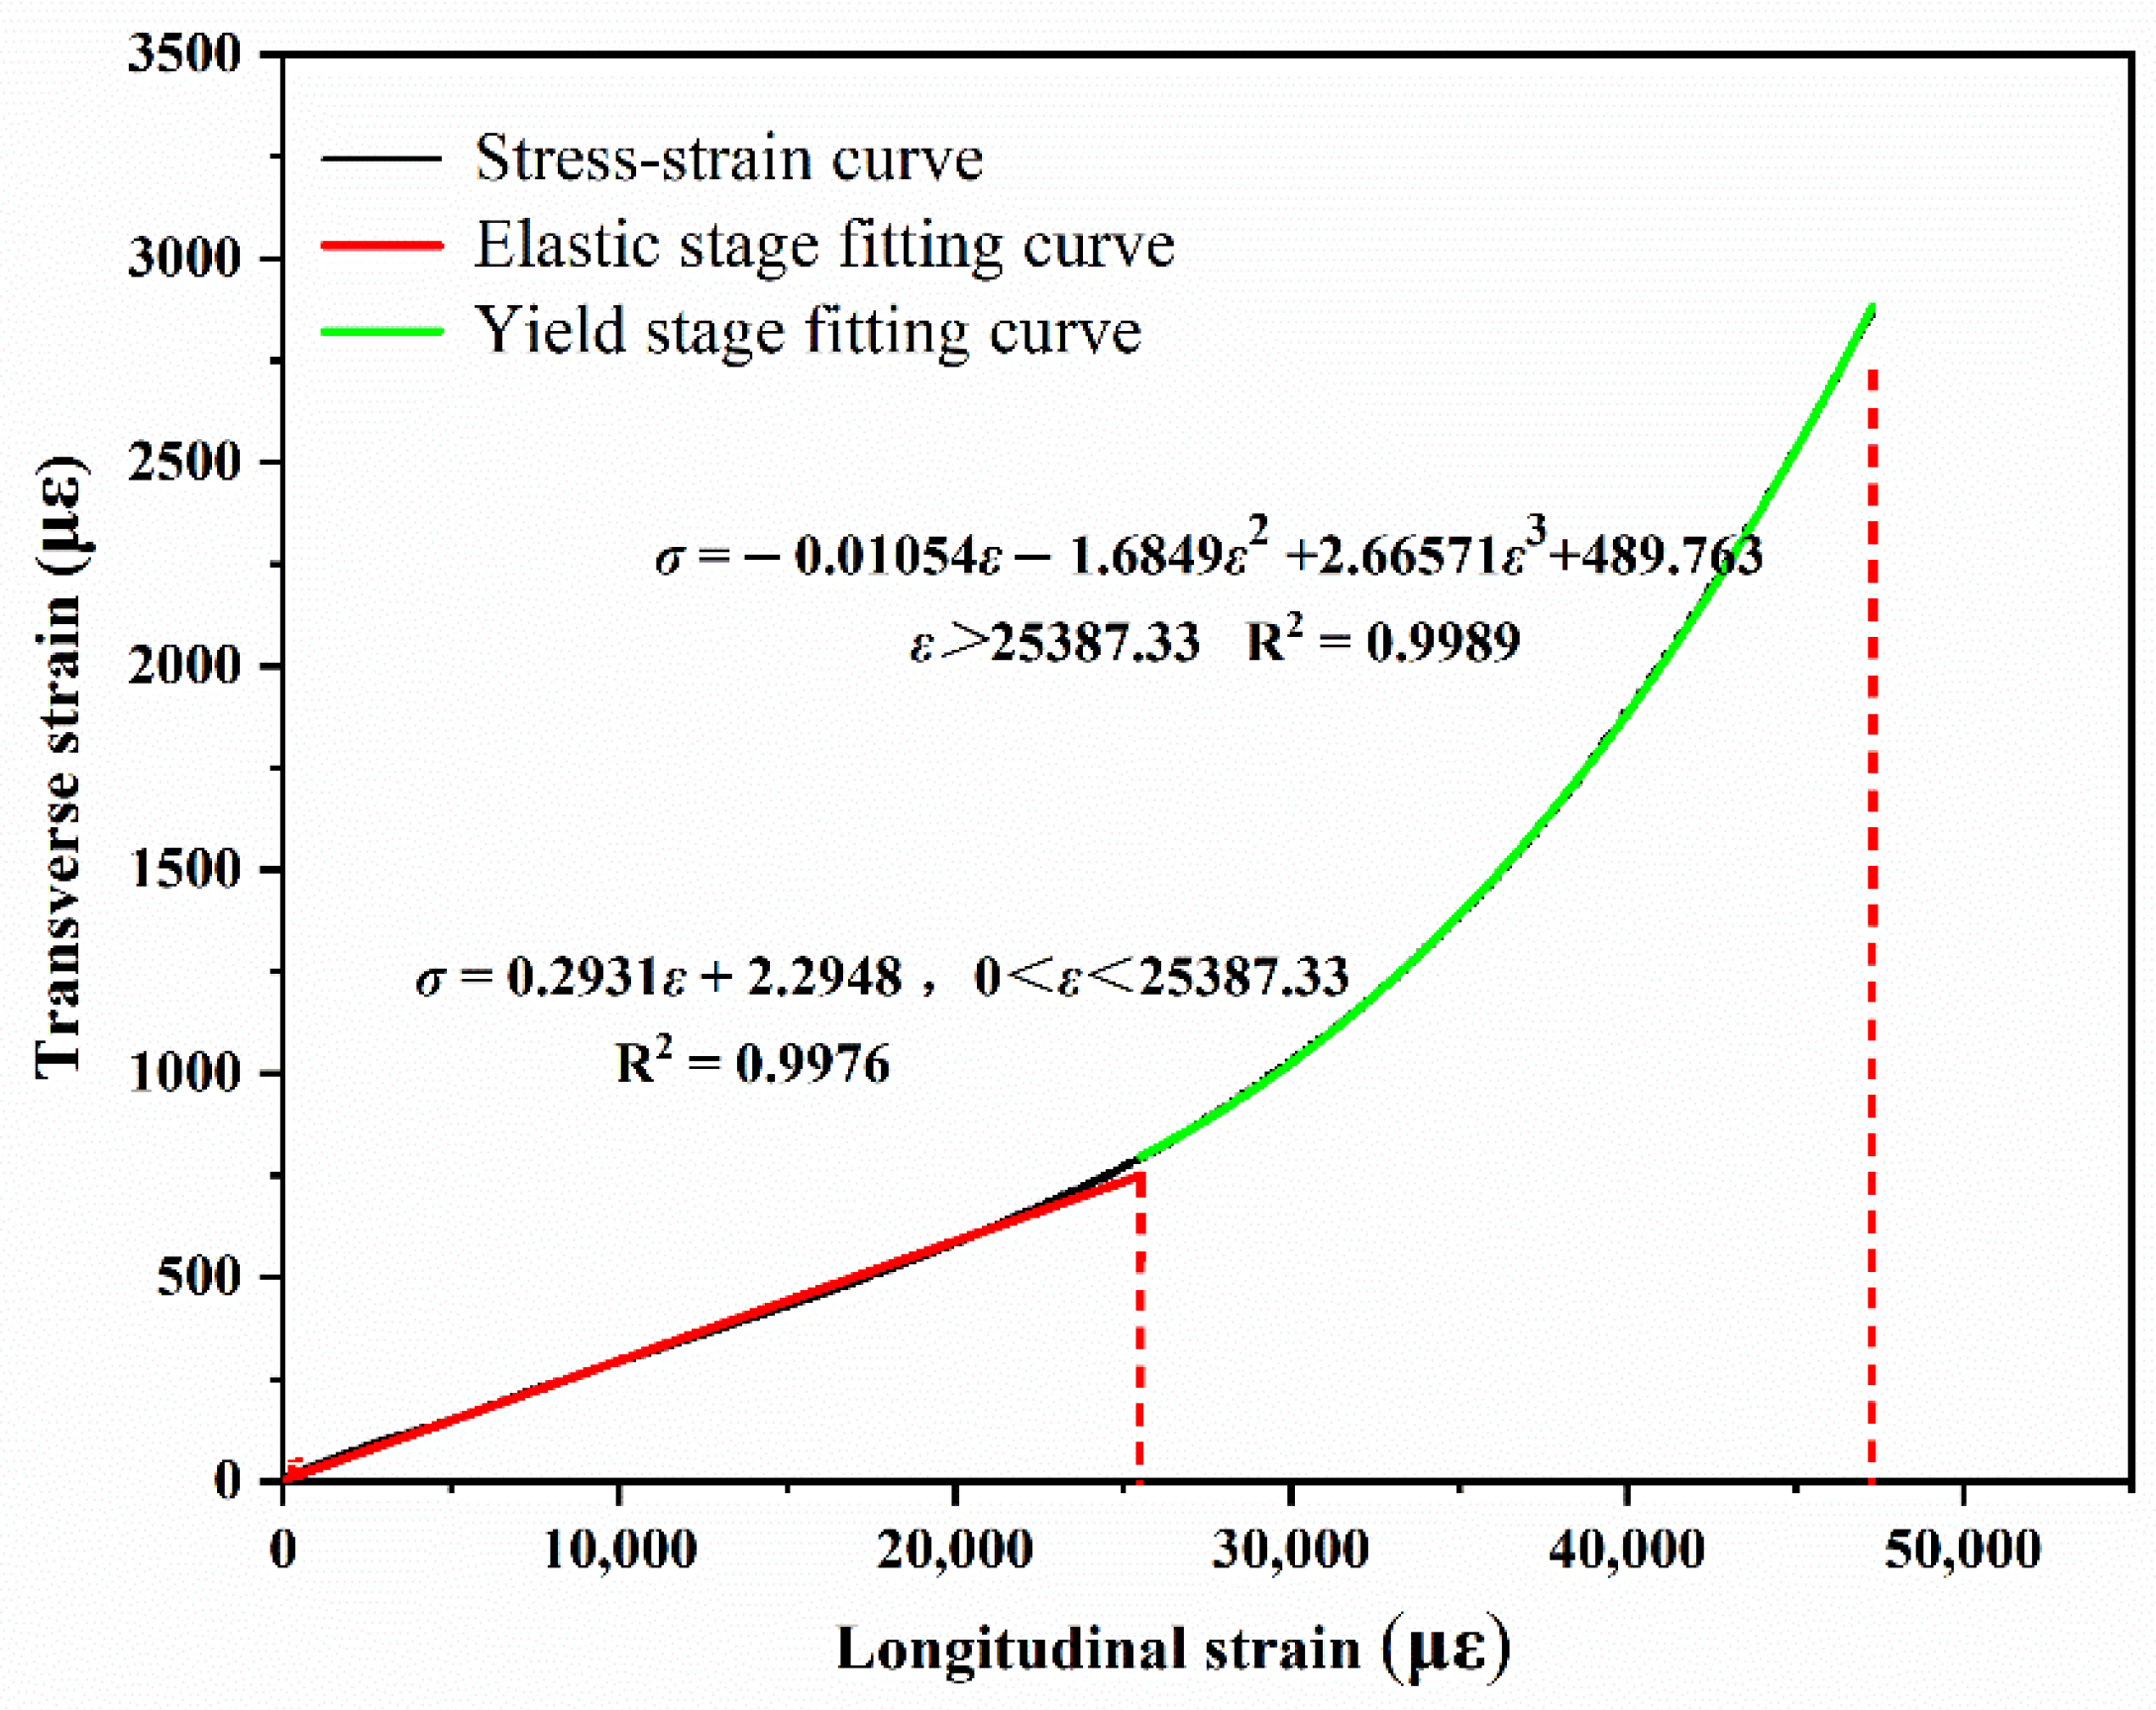
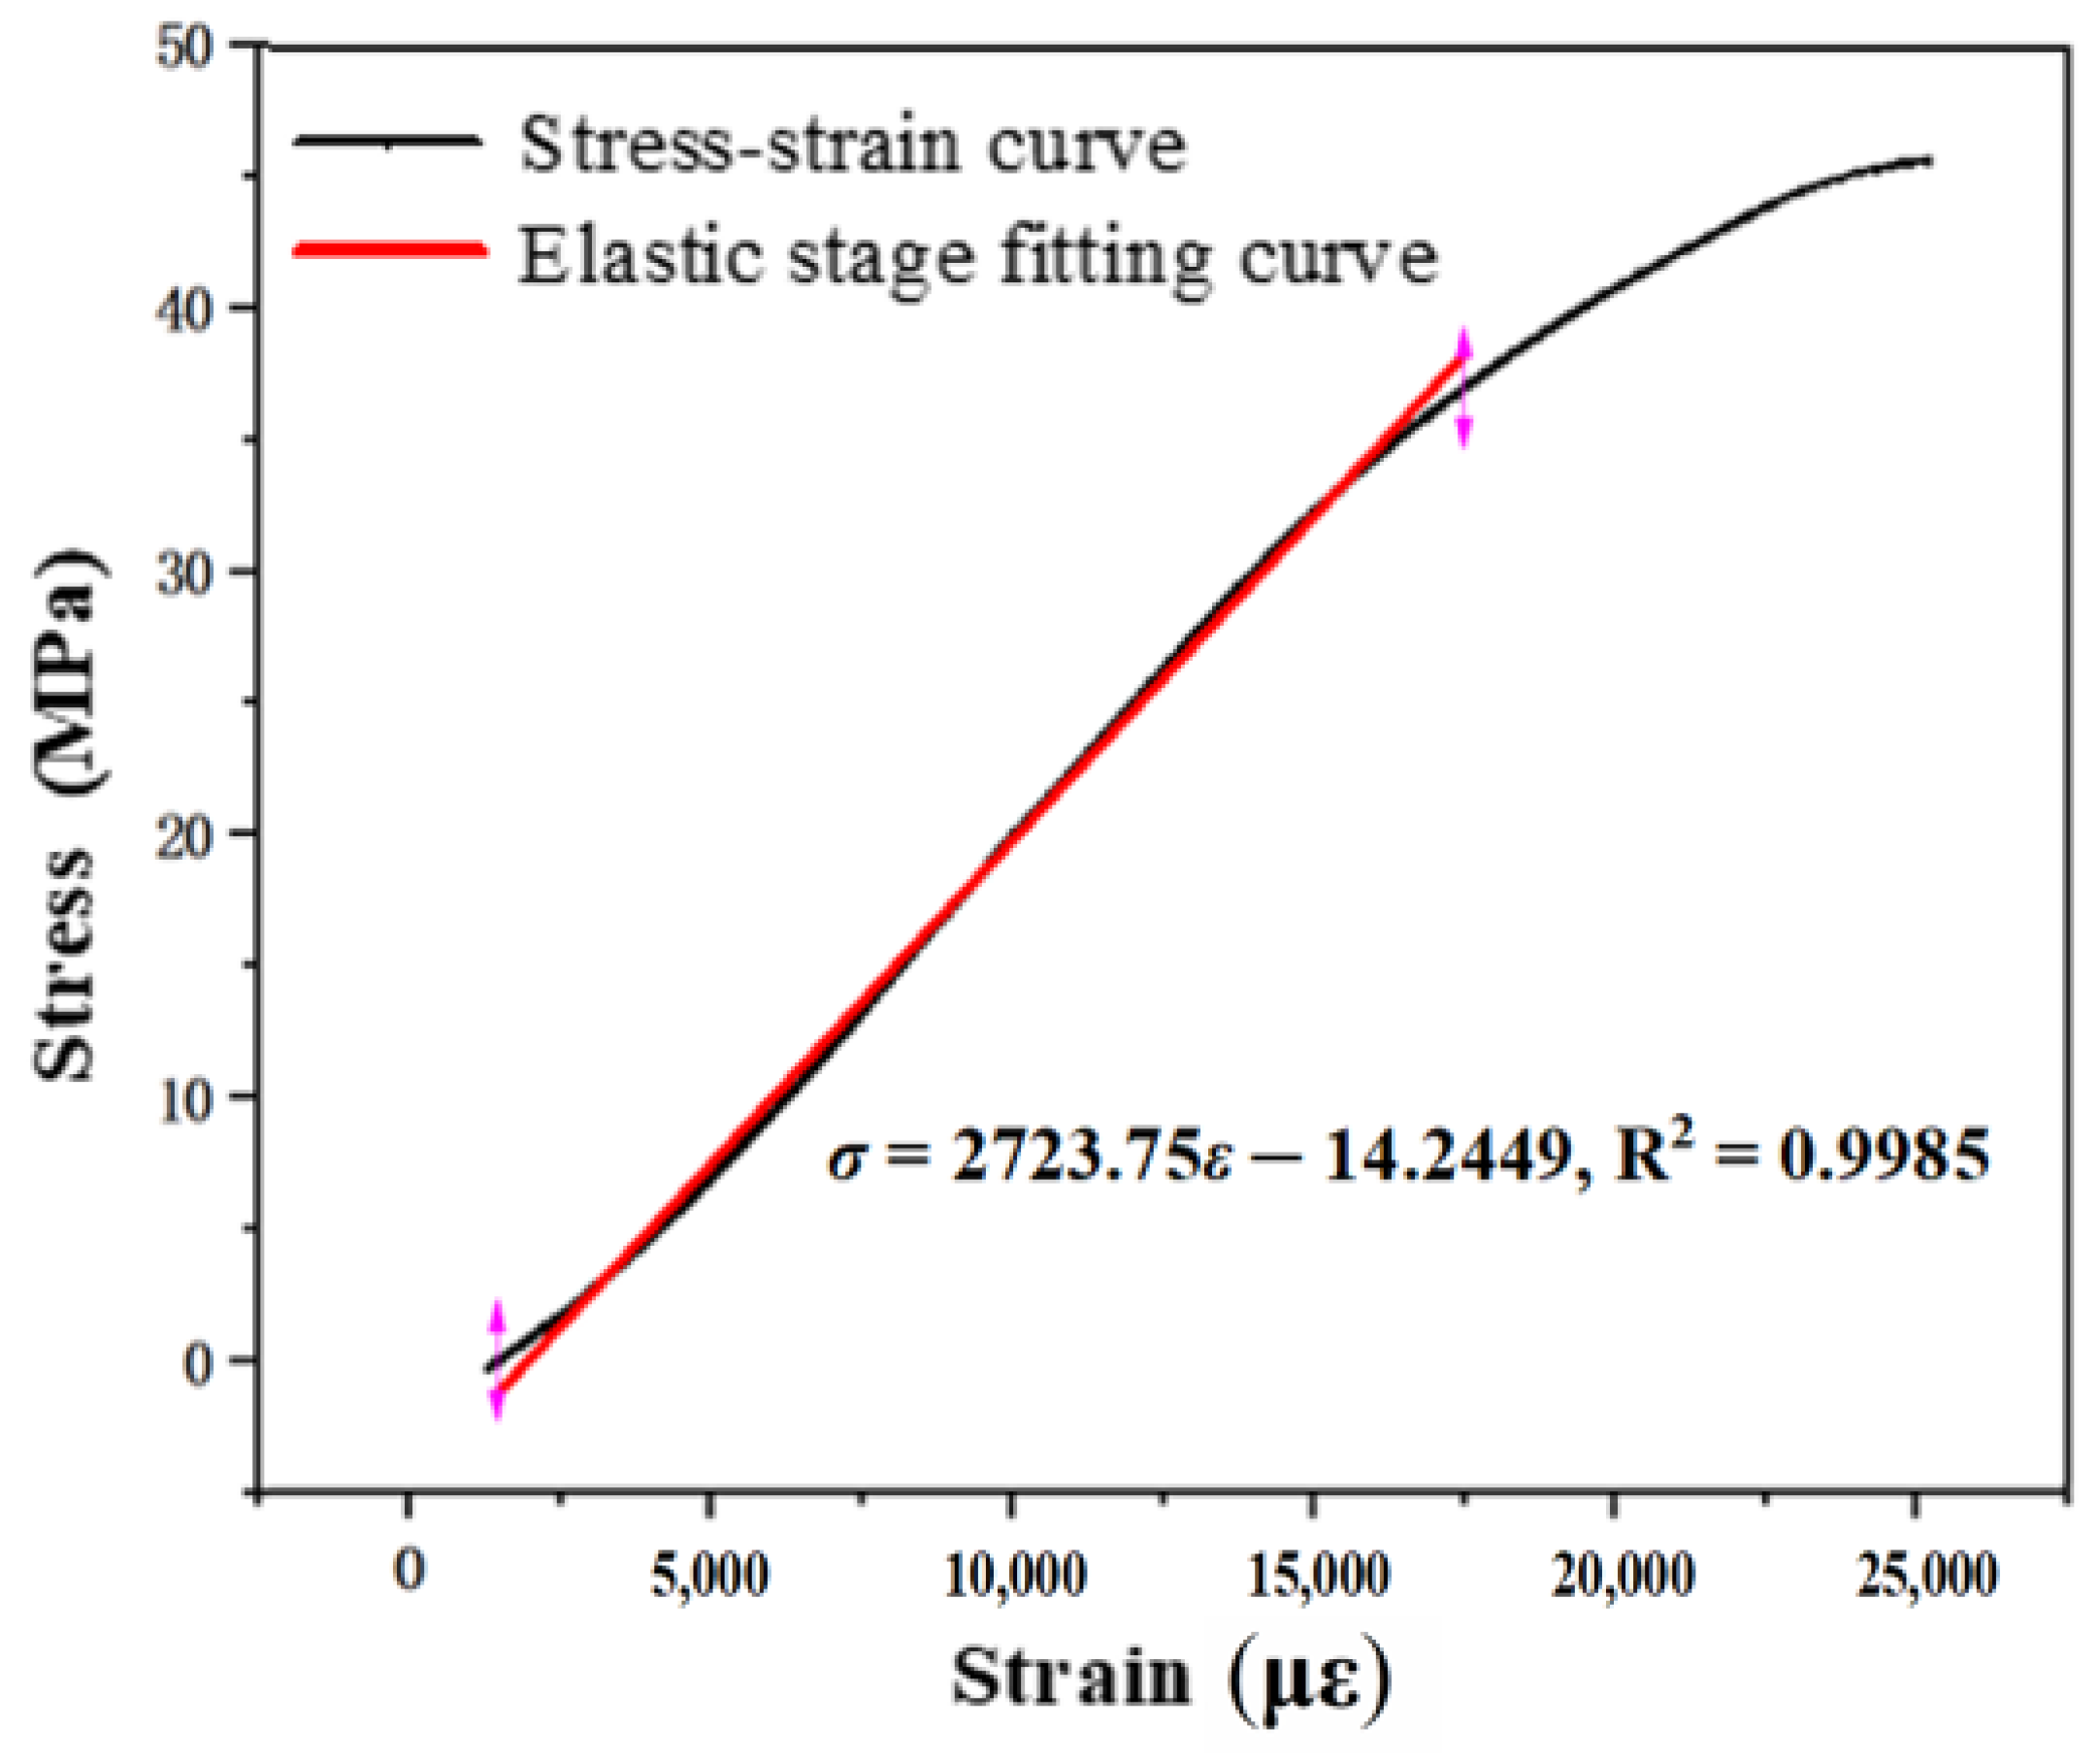
- Tensile properties
3.2. Analysis of Microscopic Morphology and Failure Mode
- (1)
- Microscopic morphology analysis
- (2)
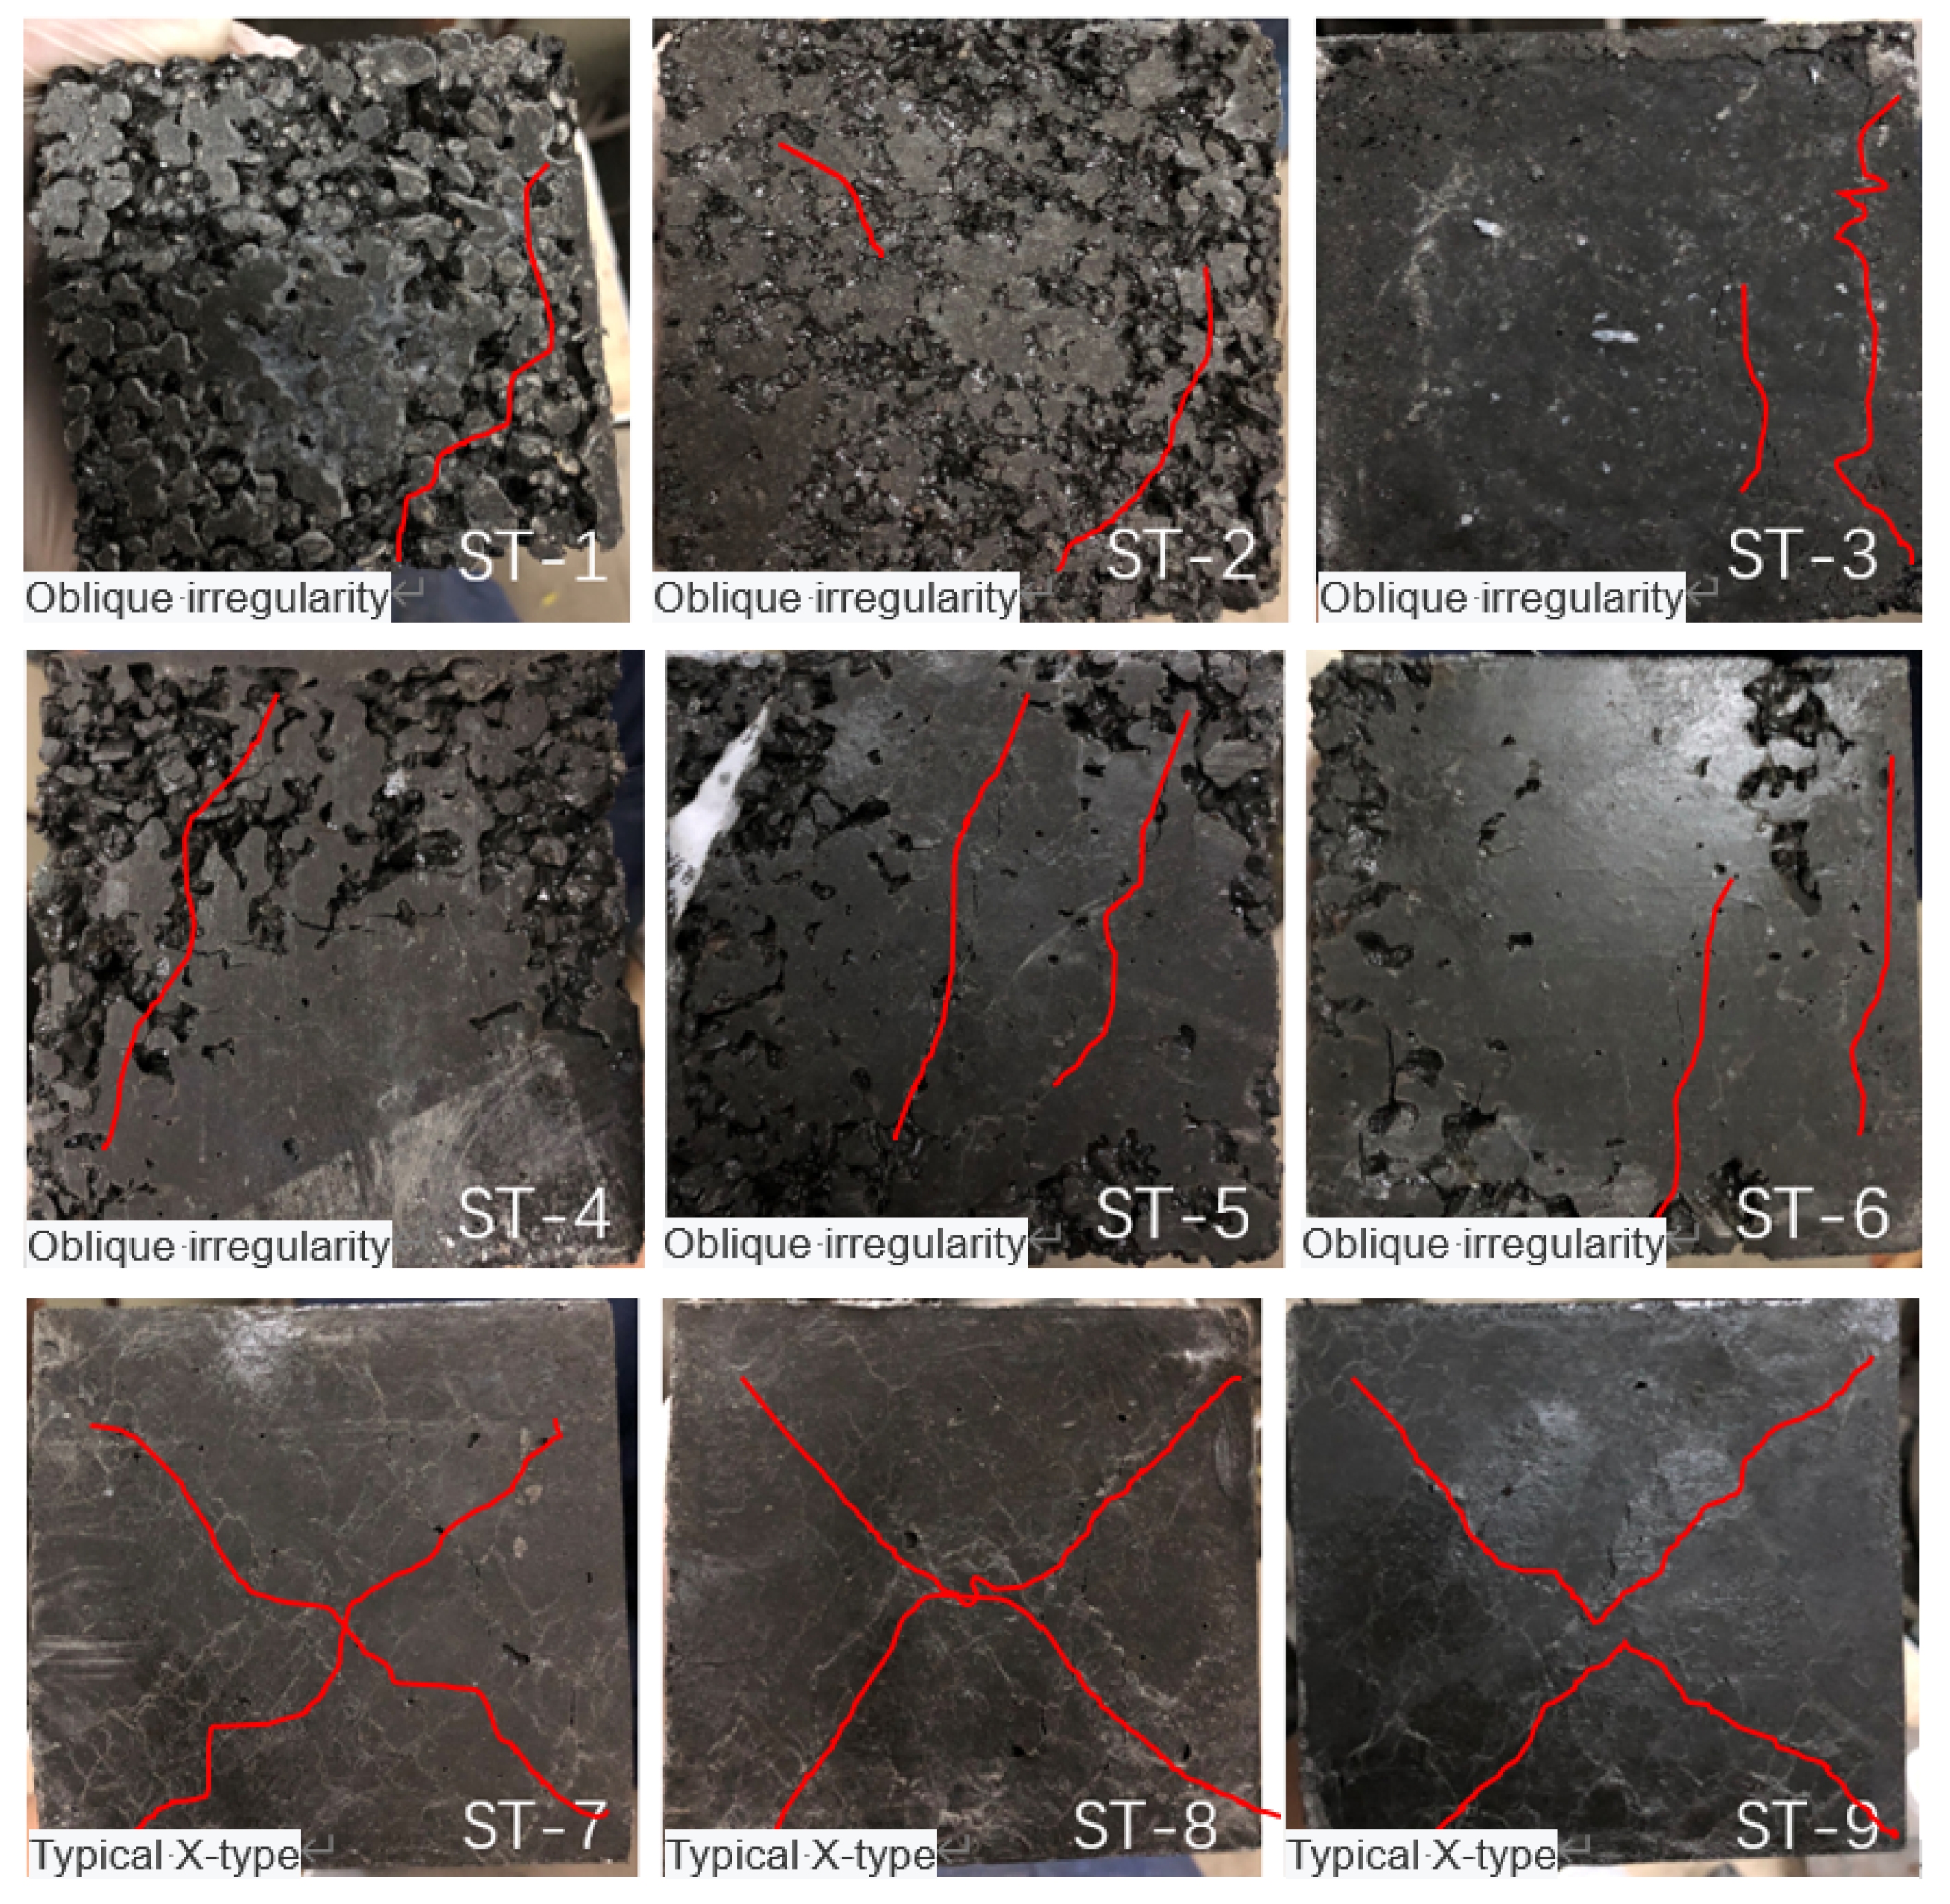
- Failure mode analysis
3.3. Fatigue Properties
- (1)
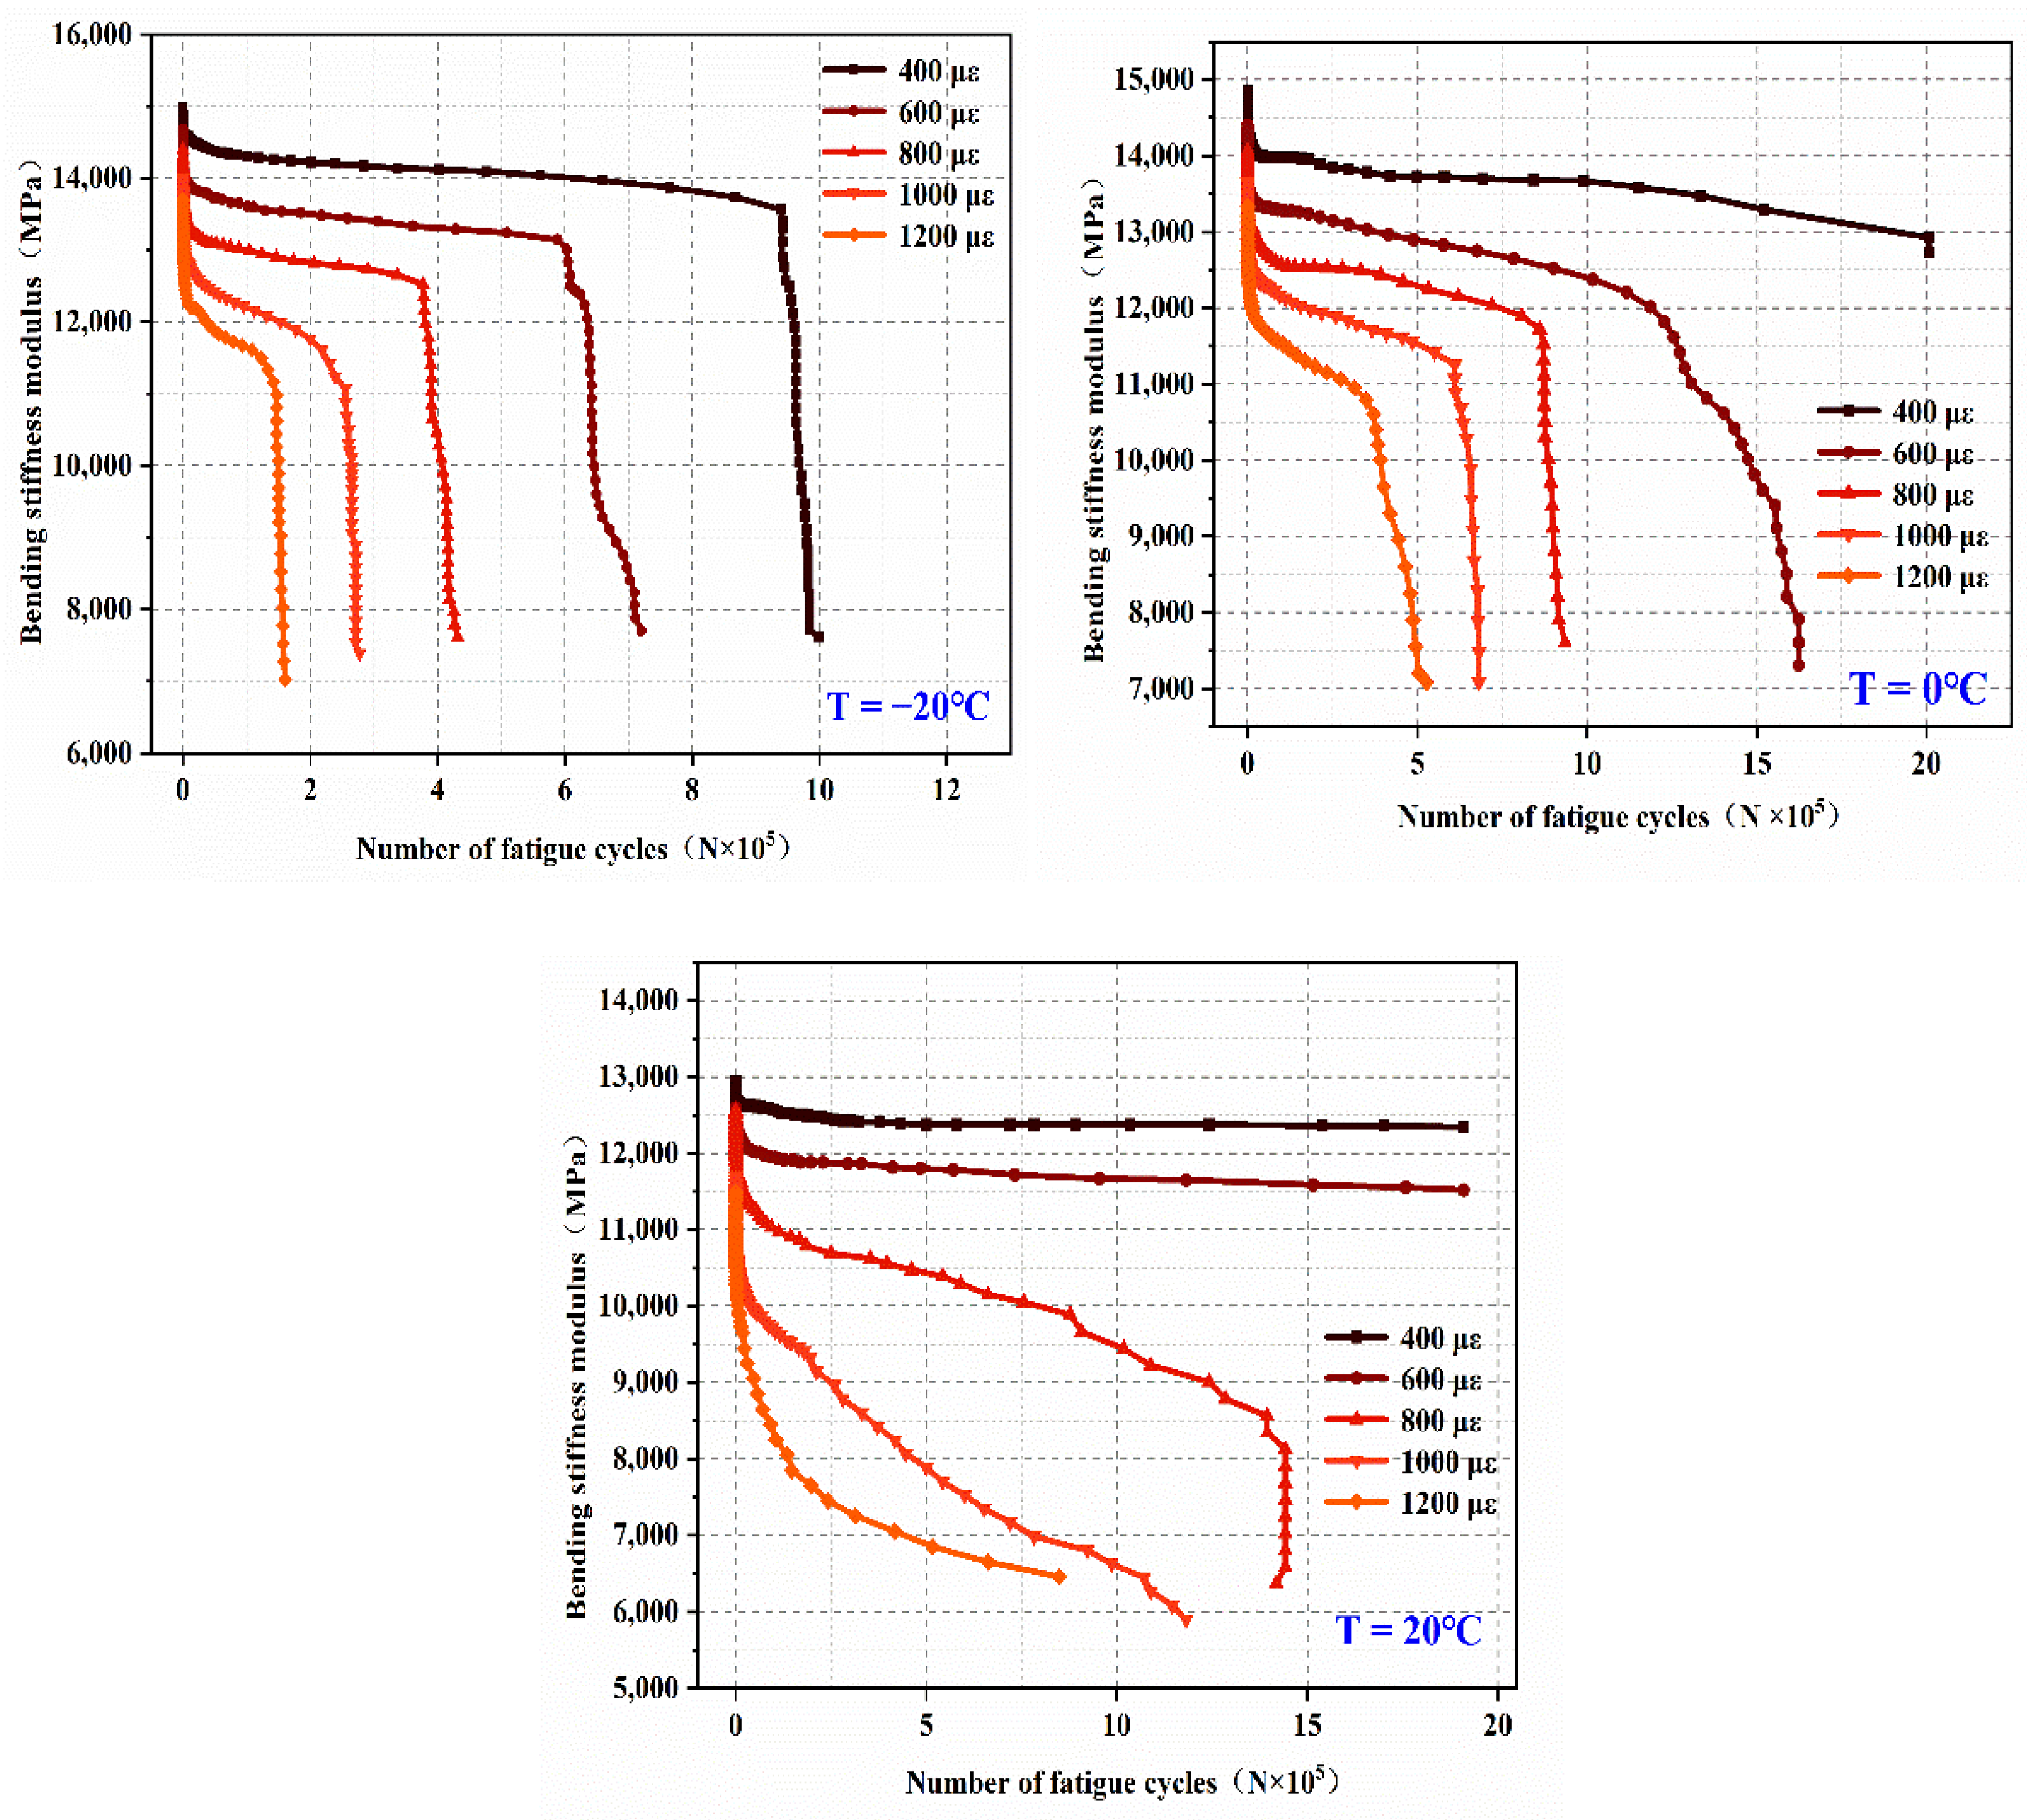
- Analysis of bending stiffness modulus
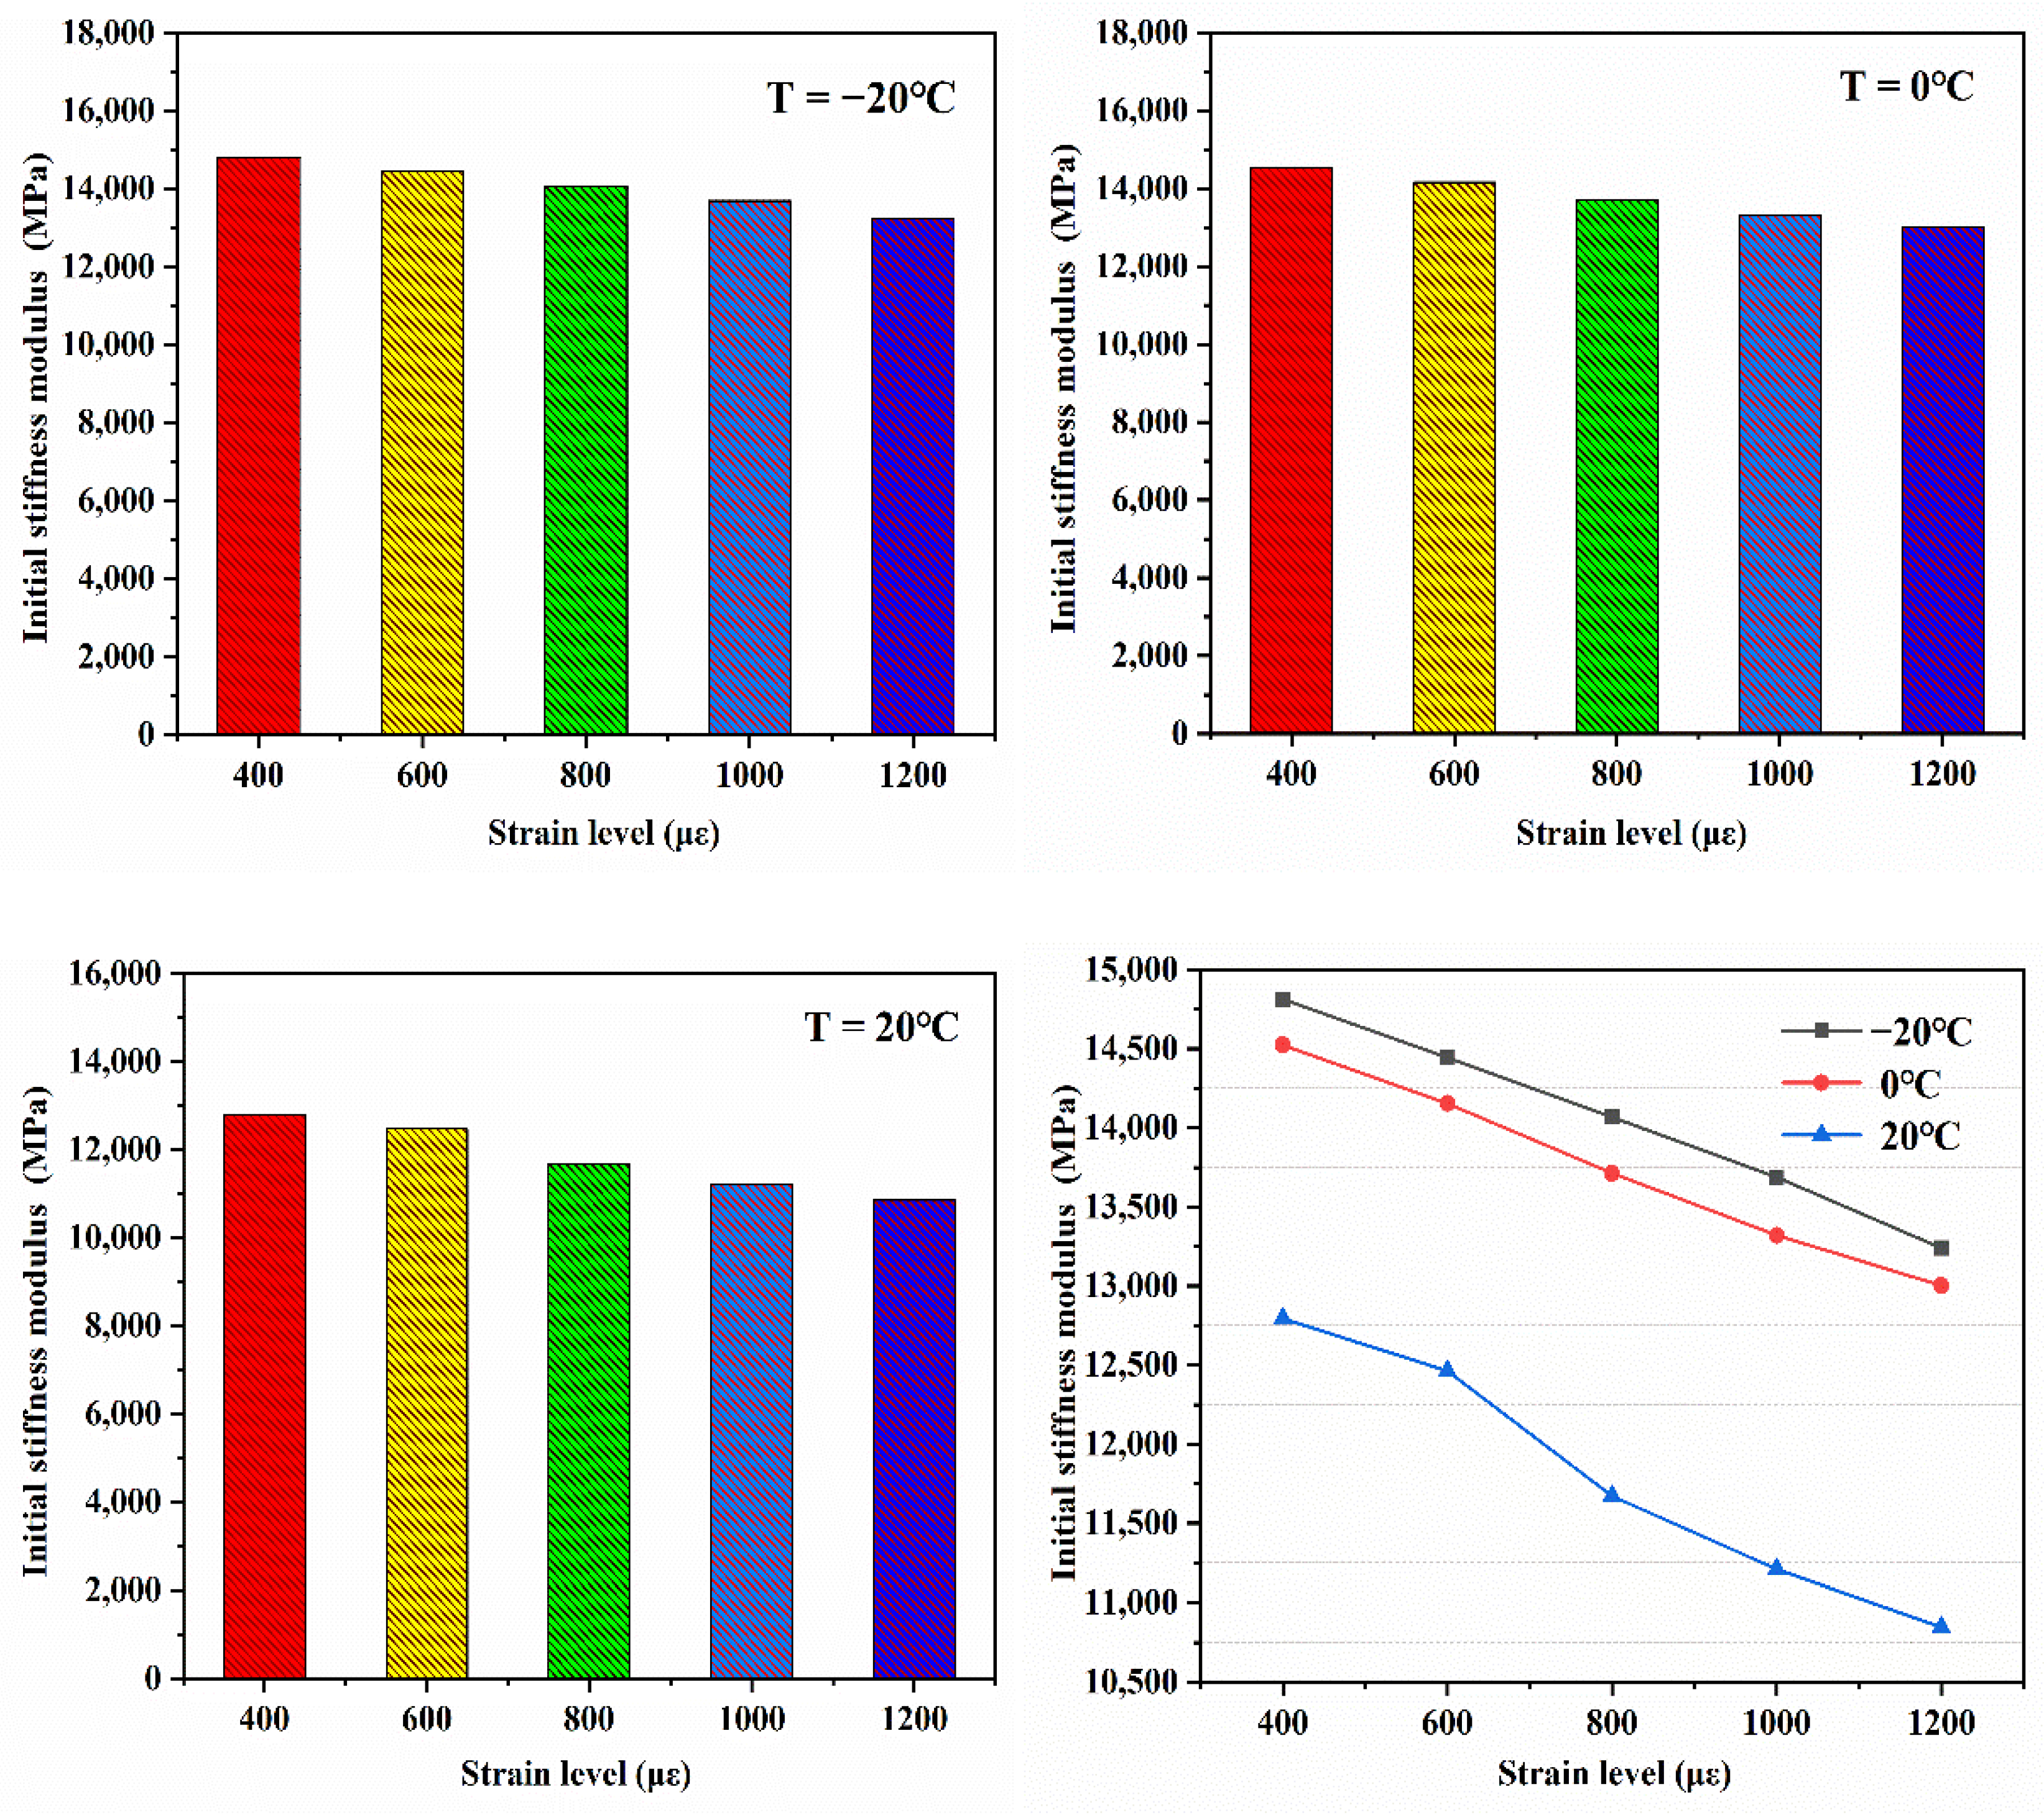
- (2)
- Analysis of initial stiffness modulus
- (3)
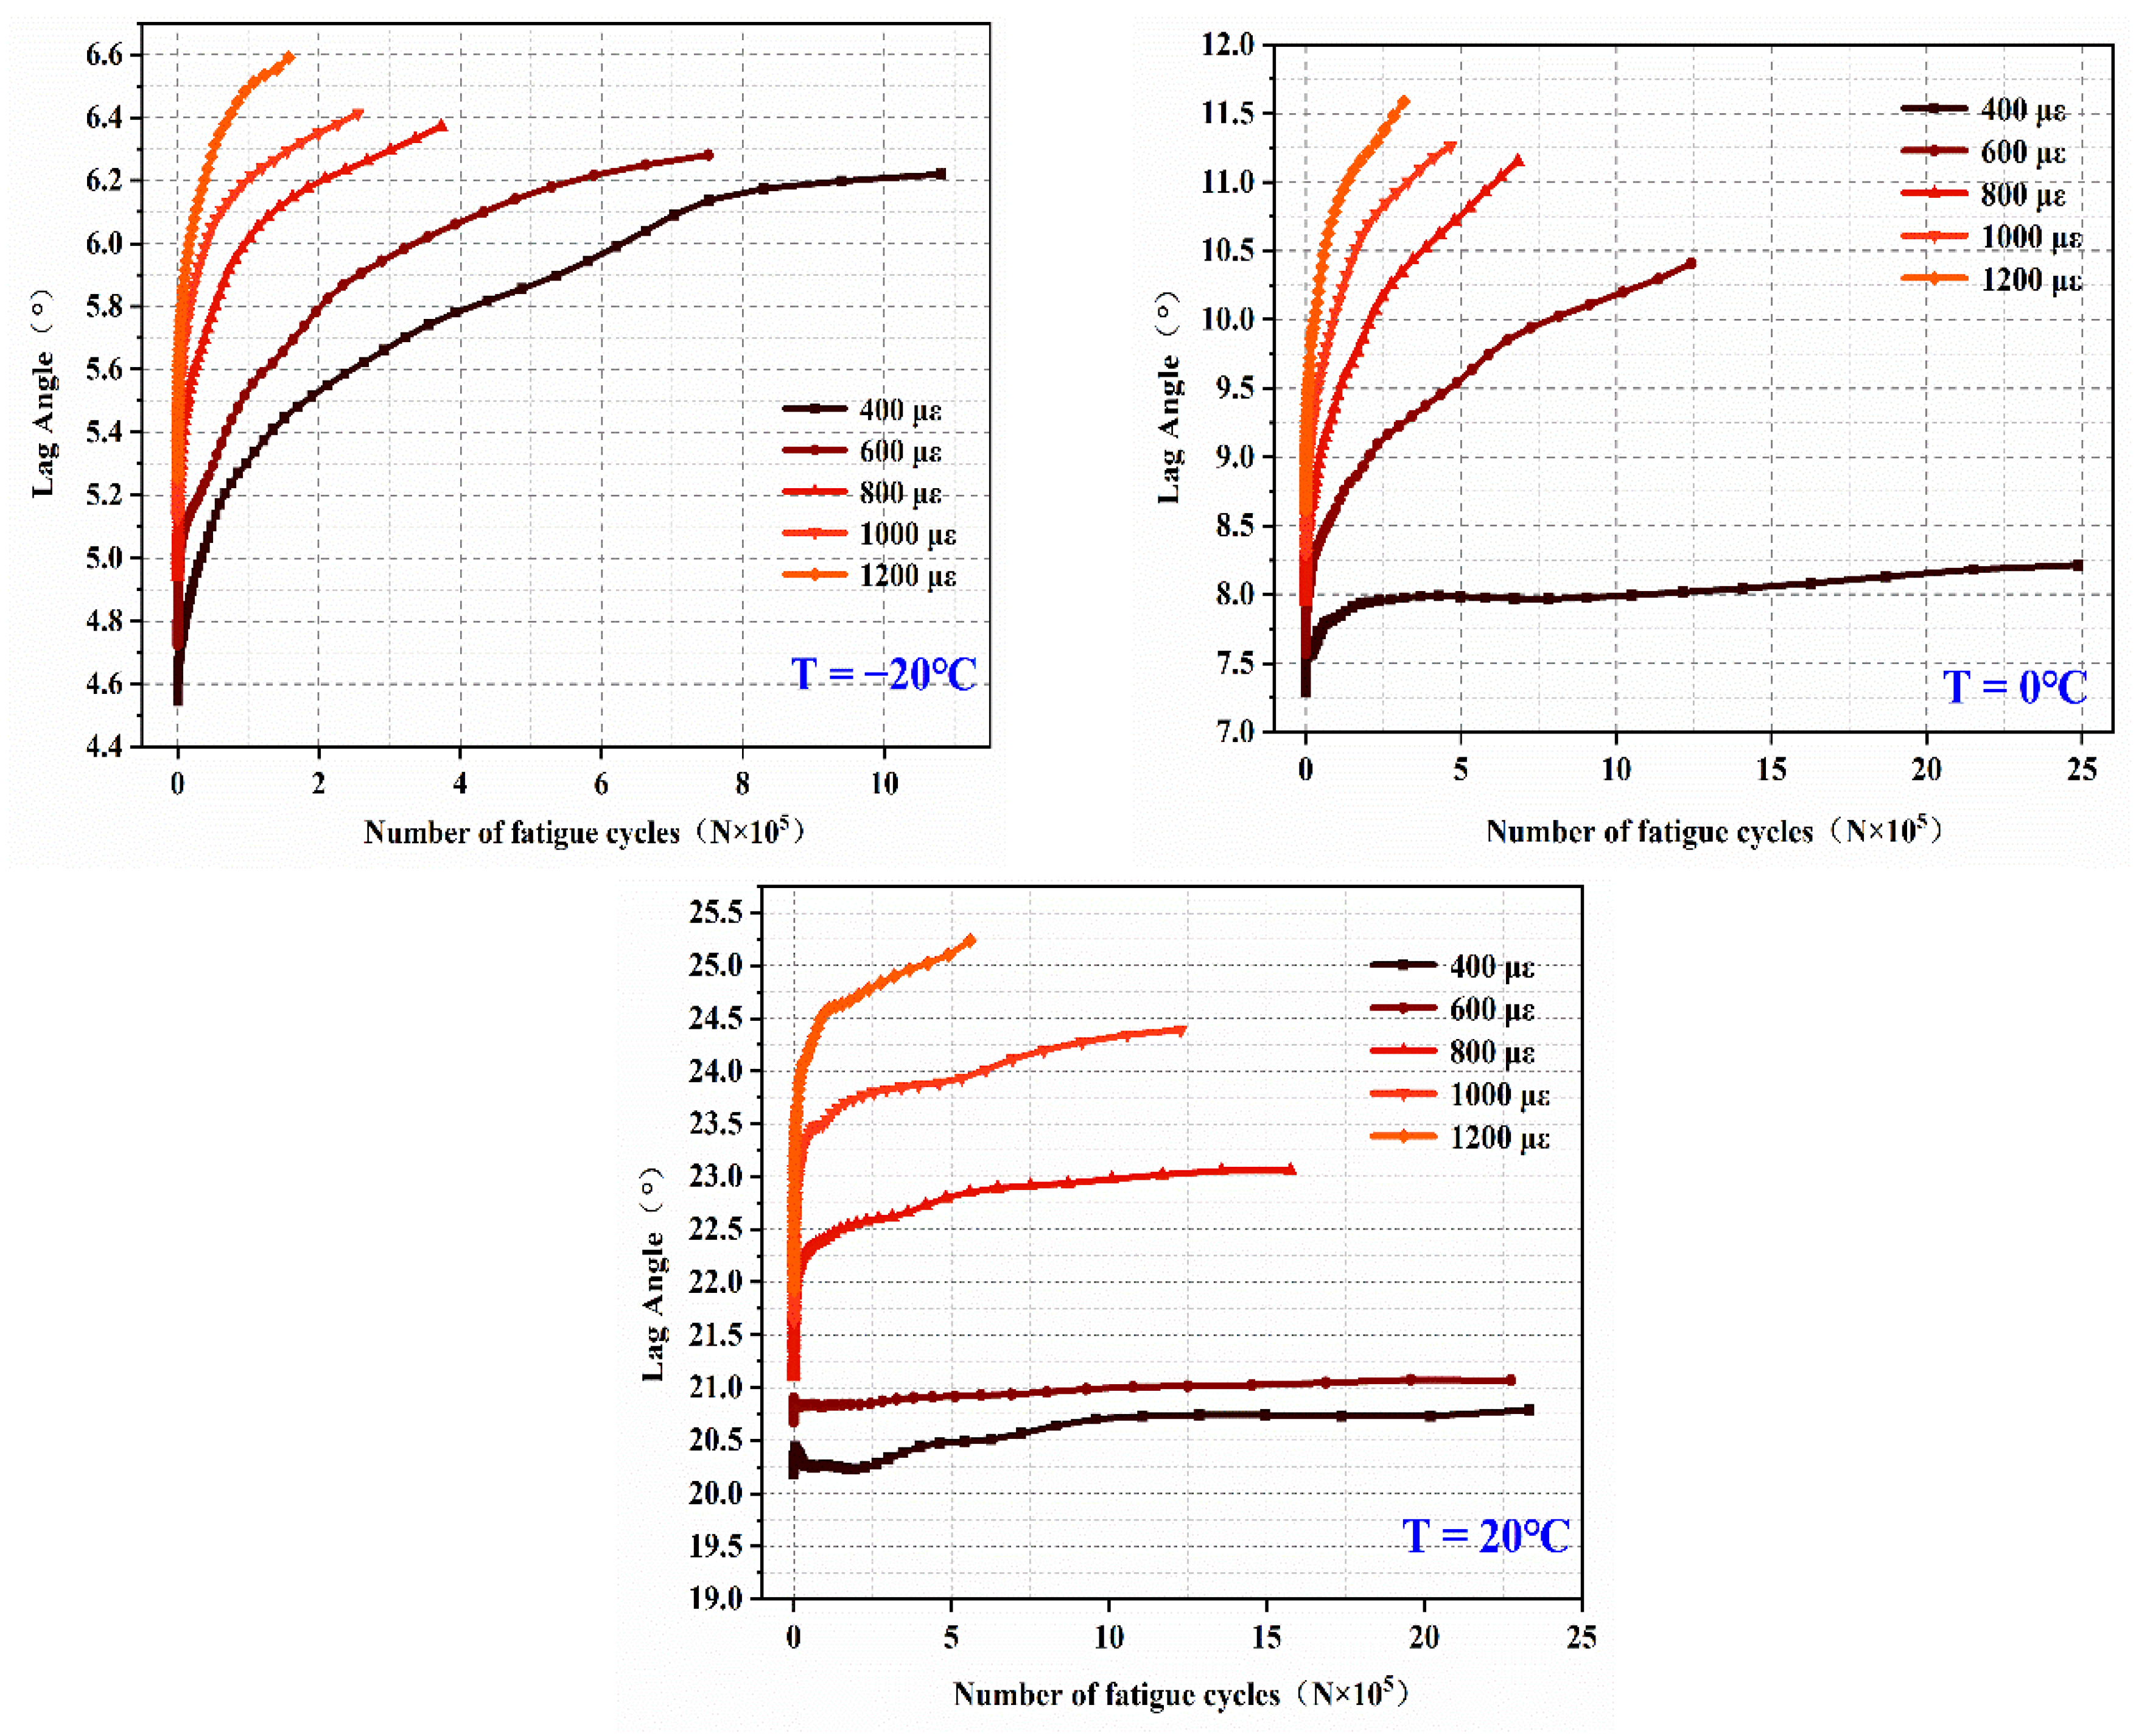
- Analysis of lag Angle
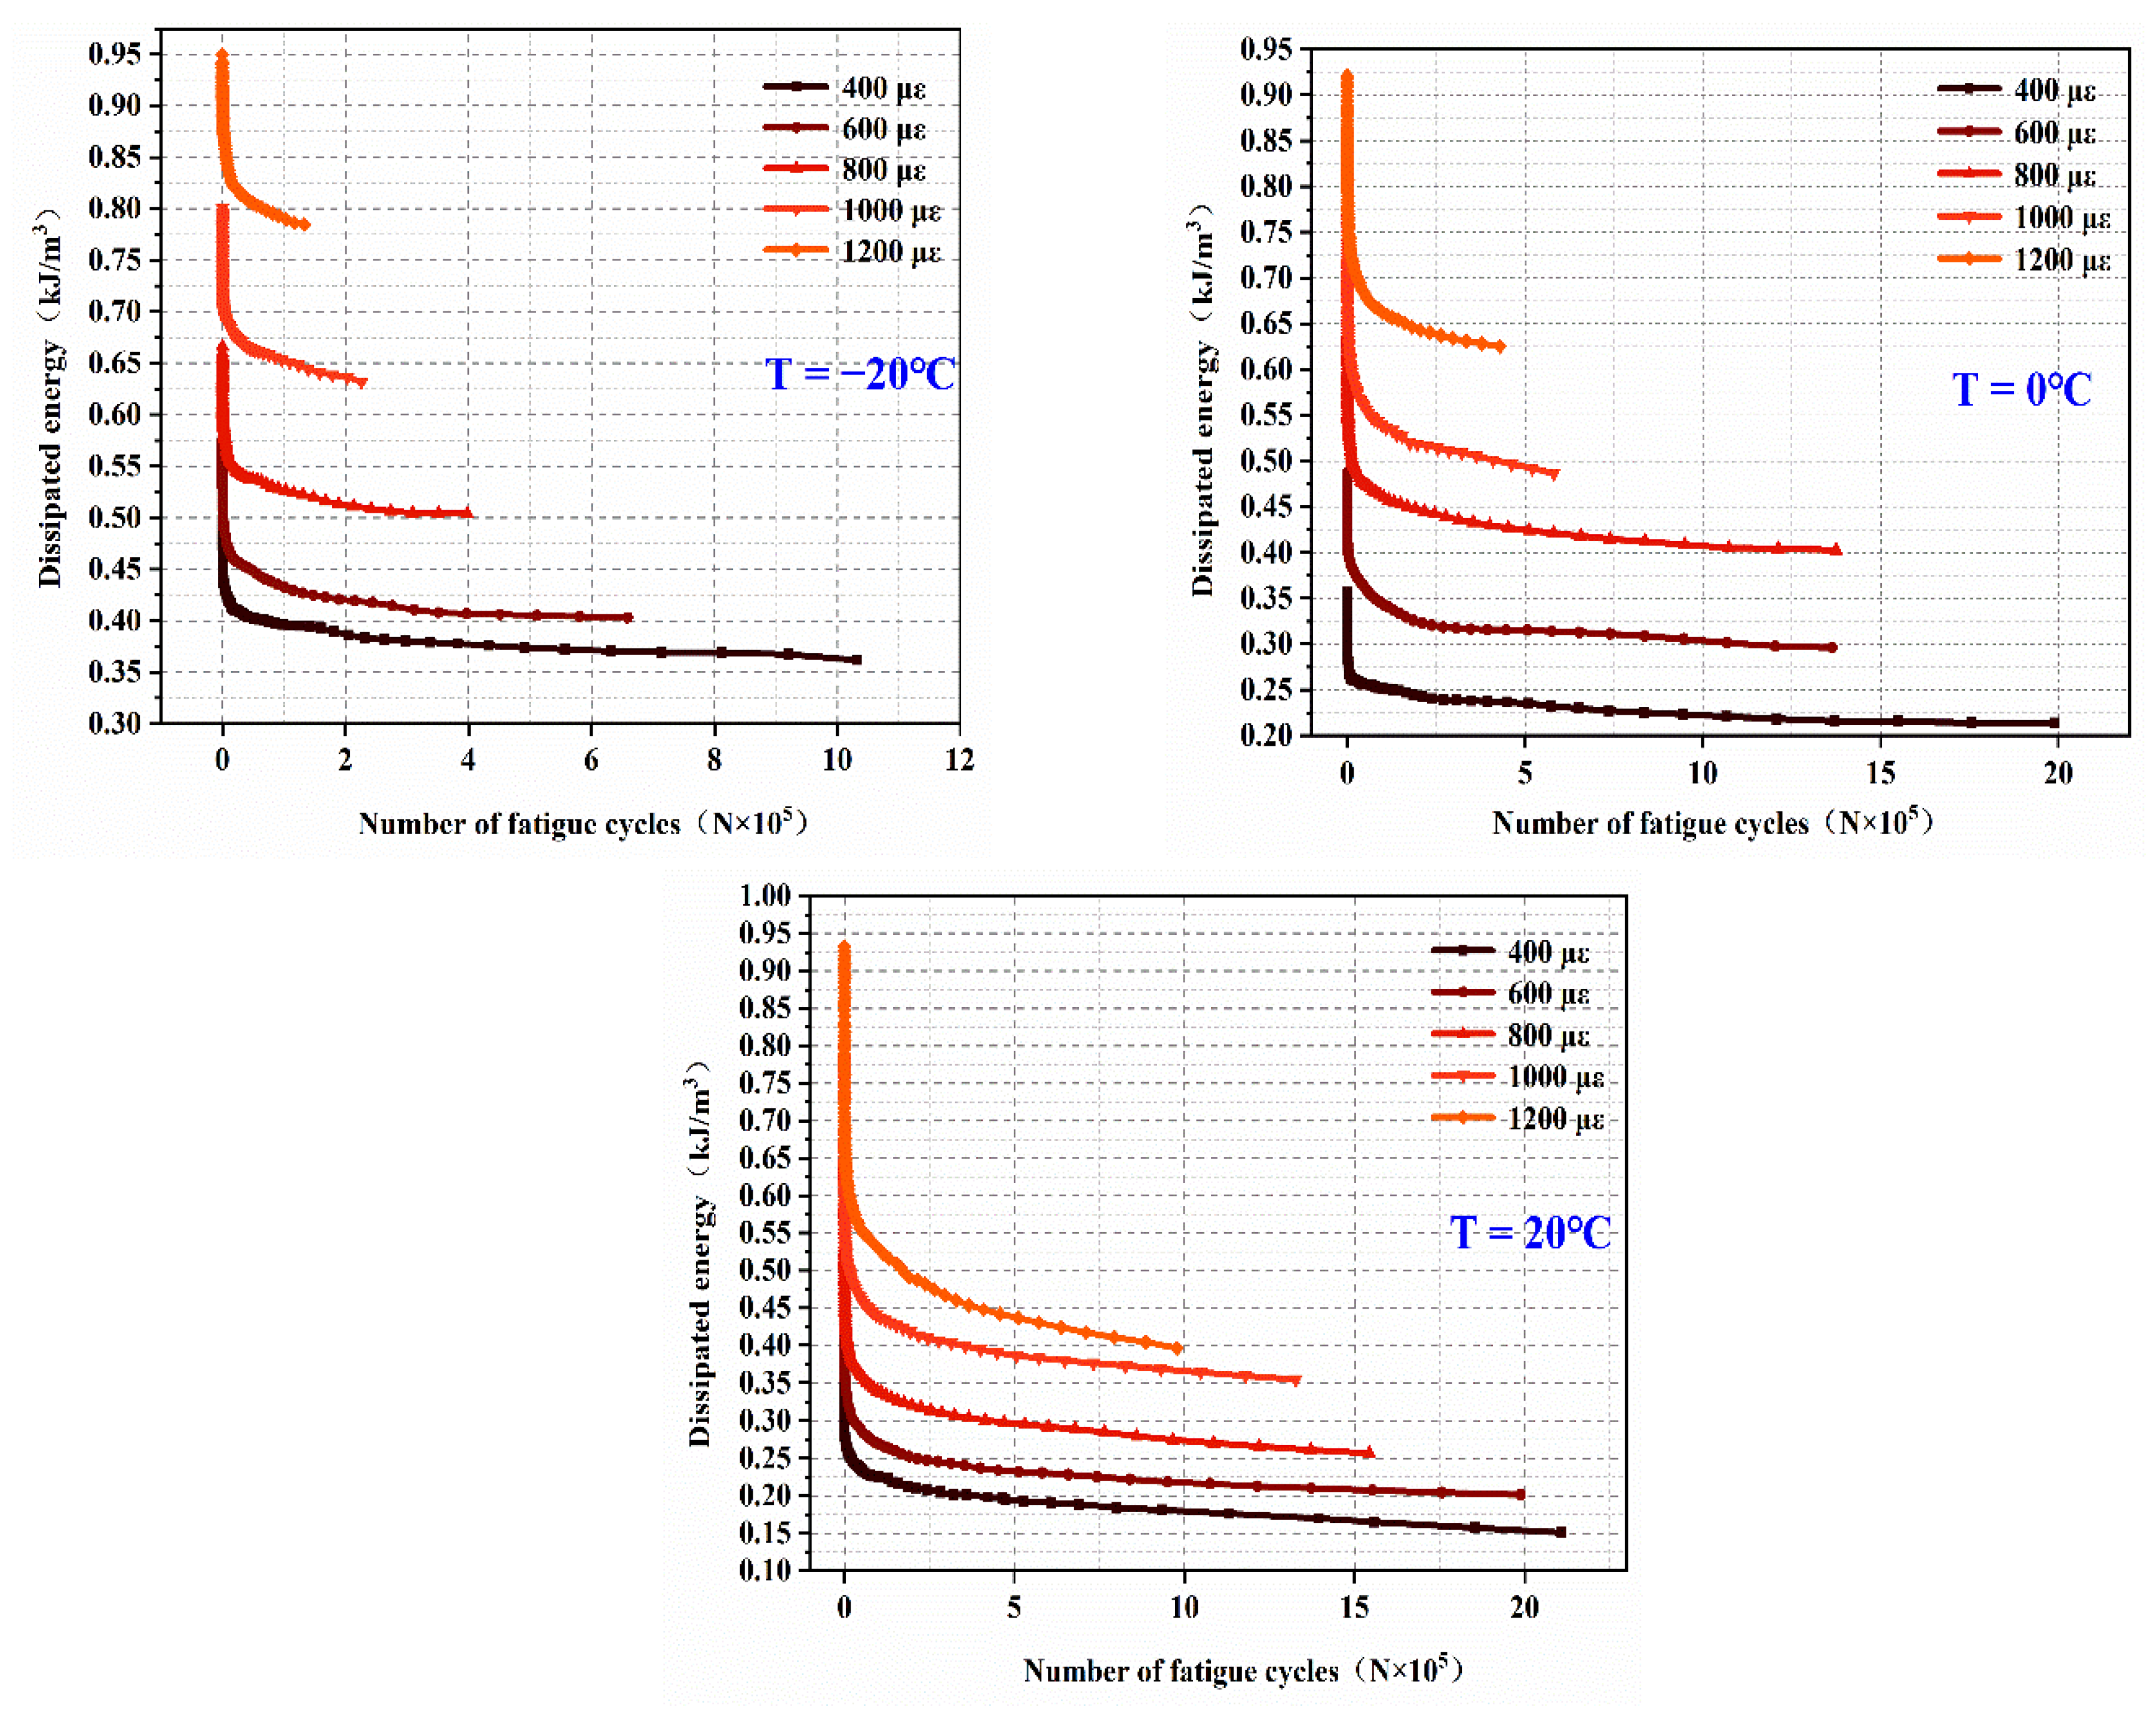
- (4)
- Analysis of dissipated energy
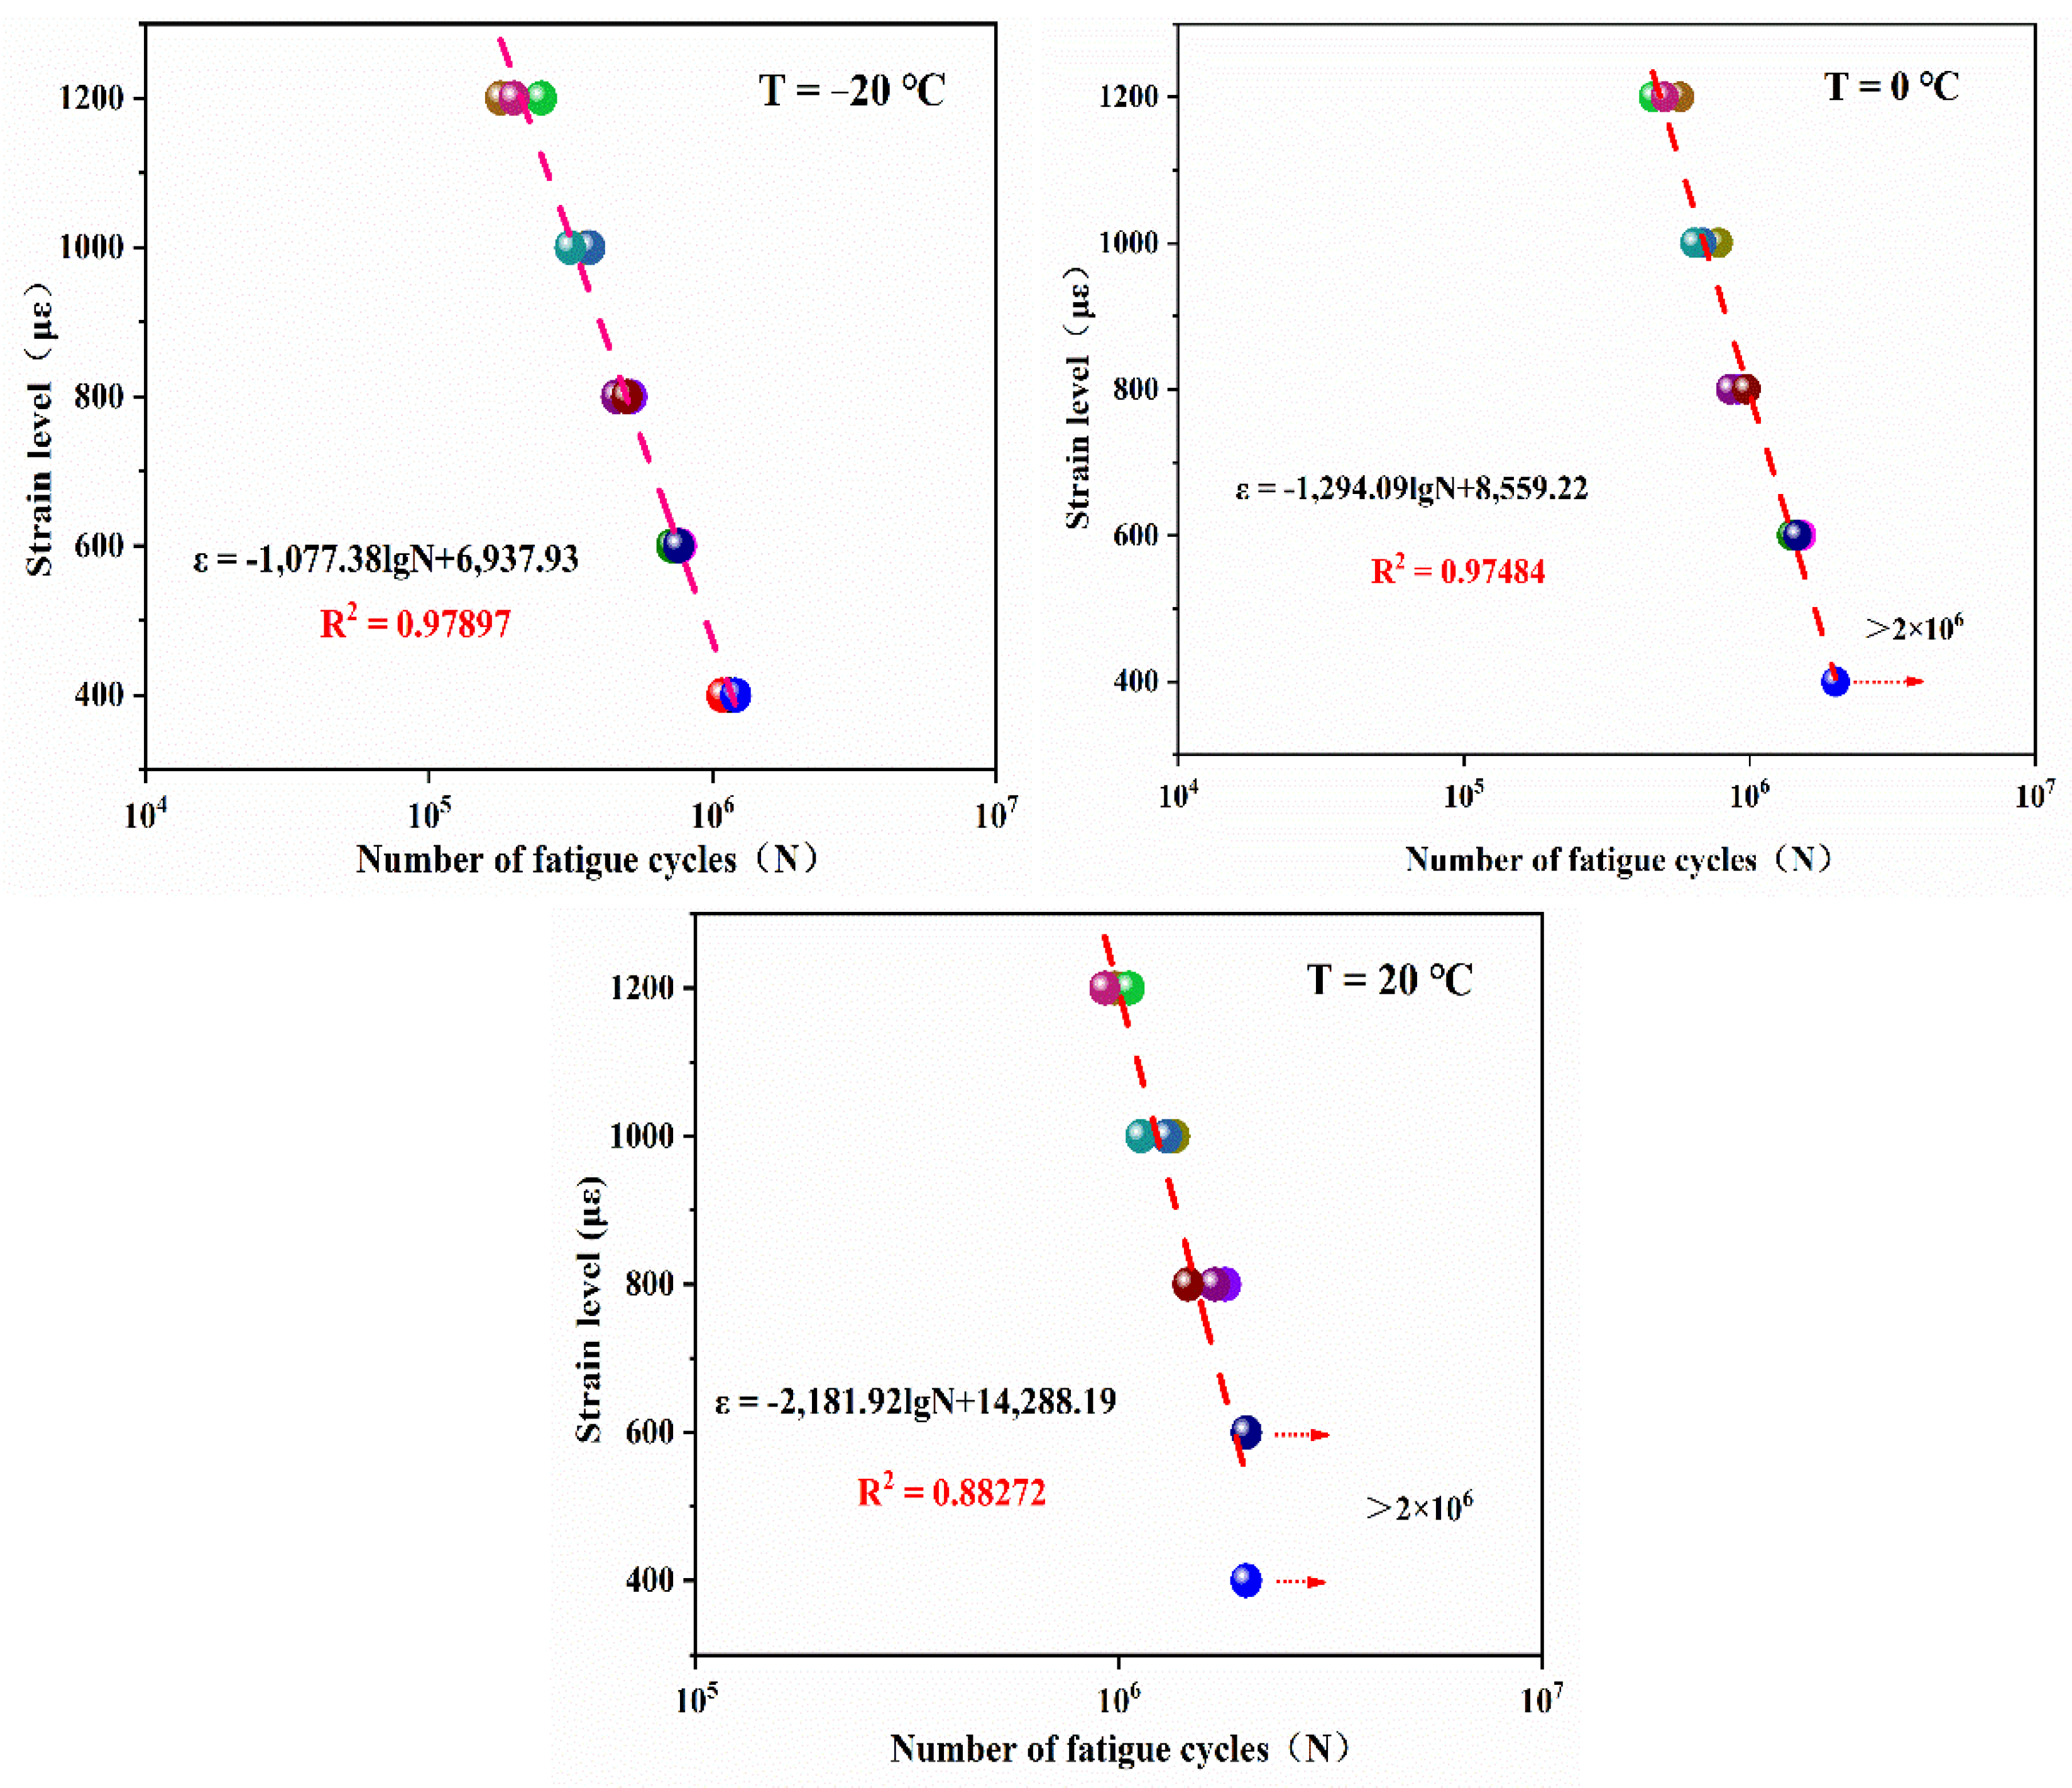
- (5)
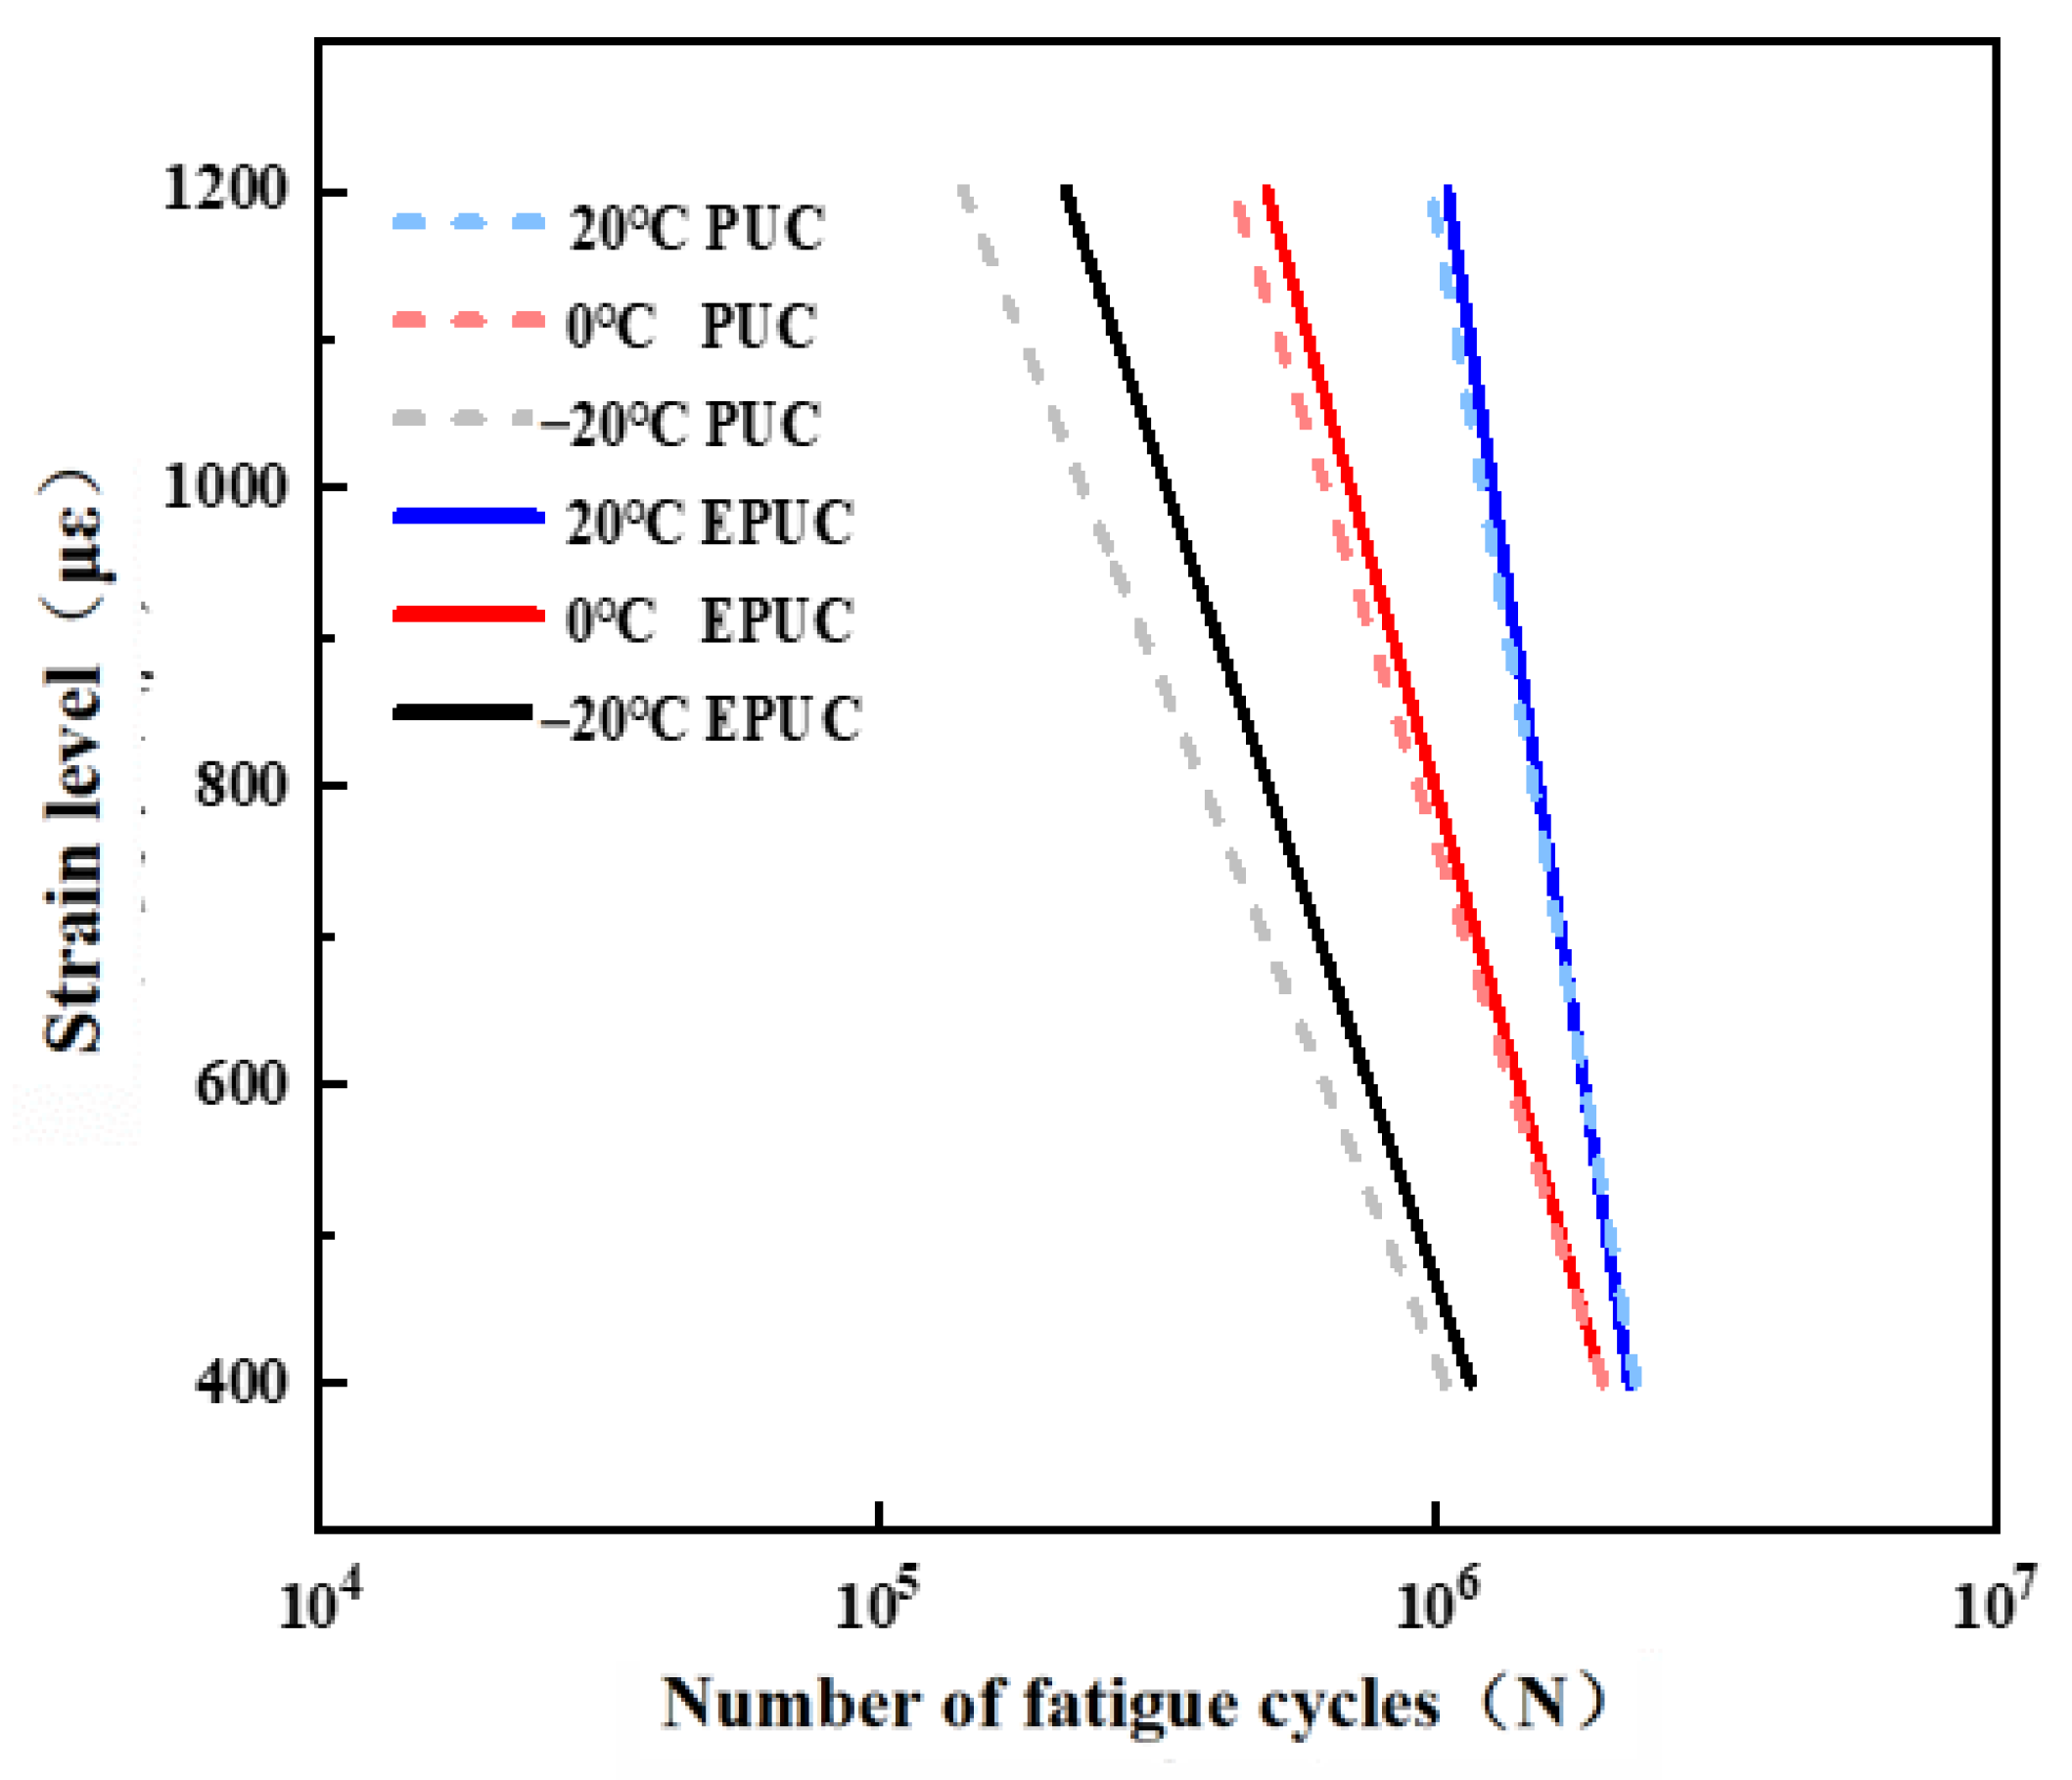
- Fatigue equation of EPUC
4. Conclusions
Author Contributions
Funding
Institutional Review Board Statement
Informed Consent Statement
Data Availability Statement
Acknowledgments
Conflicts of Interest
References
- Li, Y.; Lyu, Y.; Xu, M.; Fan, L.; Zhang, Y. Determination of Construction Temperatures of Crumb Rubber Modified Bitumen Mixture Based on CRMB Mastic. Materials 2019, 12, 3851. [Google Scholar] [CrossRef] [Green Version]
- Ma, W.; Zhao, Z.; Guo, S.; Zhao, Y.; Wu, Z.; Yang, C. Performance Evaluation of the Polyurethane-Based Composites Prepared with Recycled Polymer Concrete Aggregate. Materials 2020, 13, 616. [Google Scholar] [CrossRef] [Green Version]
- Zhou, S.; Ding, Y.; Wang, Z.; Dong, J.; She, A.; Wei, Y.; Li, R. Weathering of Roofing Insulation Materials under Multi-Field Coupling Conditions. Materials 2019, 12, 3348. [Google Scholar] [CrossRef] [Green Version]
- Li, F.R.; Wu, Y.Y.; Xie, X.H.; Zhao, K.; Yu, Z. Experimental study on the dynamic behavior of rubber concrete under compression considering earthquake magnitude strain rate. J. Civ. Eng. Manag. 2020, 26, 733–748. [Google Scholar] [CrossRef]
- Eldin, N.; Senouci, A.B. Rubber-tire particles as concrete aggregates. J. Mater. Civ. Eng. 1993, 5, 478–496. [Google Scholar] [CrossRef]
- Khatib, Z.K.; Bayomy, F.M. Rubberized Portland Cement Concrete. J. Mater. Civ. Eng. 1999, 11, 206–213. [Google Scholar] [CrossRef]
- Zhang, K.; Sun, Q. Experimental Study of Reinforced Concrete T-beams Strengthened with a Composite of Prestressed Steel Wire Ropes Embedded in Polyurethane Cement (PSWR–PUC). Int. J. Civ. Eng. 2018, 16, 1109–1123. [Google Scholar] [CrossRef]
- Zhang, K.; Sun, Q. The use of Wire Mesh-Polyurethane Cement (WM-PUC) composite to strengthen RC T-beams under flexure. J. Build. Eng. 2017, 15, 122–136. [Google Scholar] [CrossRef]
- Zhang, K.; Sun, Q. Strengthening of a Reinforced Concrete Bridge with Polyurethane-cement Composite (PUC). Open Civ. Eng. J. 2016, 10, 768–781. [Google Scholar] [CrossRef]
- Yang, N.; Zhang, K.; Sun, Q. Dispersion and Pressure Sensitivity of Carbon Nanofiber-Reinforced Polyurethane Cement. Appl. Sci. 2018, 8, 2375. [Google Scholar] [CrossRef] [Green Version]
- Hussain, H.K.; Zhang, L.Z.; Liu, G.W. An experimental study on strengthening reinforced concrete T-beams using new material poly-urethane-cement (PUC). Constr. Build. Mater. 2013, 40, 104–117. [Google Scholar] [CrossRef]
- Hussain, H.K.; Liu, G.W.; Yong, Y.W. Experimental study to investigate mechanical properties of new material polyurethane-cement composite (PUC). Constr. Build. Mater. 2014, 50, 200–208. [Google Scholar] [CrossRef]
- Agavriloaie, L.; Oprea, S.; Barbuta, M.; Luca, F. Characterization of polymer concrete with epoxy polyurethane acryl matrix. Constr. Build. Mater. 2012, 37, 190–196. [Google Scholar] [CrossRef]
- Hu, Z.-X.; Hu, X.-M.; Cheng, W.-M.; Zhao, Y.-Y.; Wu, M.-Y. Performance optimization of one component polyurethane healing agent for self-healing concrete. Constr. Build. Mater. 2018, 179, 151–159. [Google Scholar] [CrossRef]
- Harith, I.K. Study on polyurethane foamed concrete for use in structural applications. Case Stud. Constr. Mater. 2018, 8, 79–86. [Google Scholar] [CrossRef]
- Ai, S.; Tang, L.; Mao, Y.; Liu, Y.; Fang, D. Numerical analysis on the failure behavior of PUC at high strain rates in compression. Comput. Mater. Sci. 2013, 69, 389–395. [Google Scholar] [CrossRef]
- Chen, J.; Ma, X.; Wang, H.; Xie, P.; Huang, W. Experimental study on anti-icing and deicing performance of polyurethane concrete as road surface layer. Constr. Build. Mater. 2018, 161, 598–605. [Google Scholar] [CrossRef]
- Van Belleghem, B.; Kessler, S.; Heede, P.V.D.; Van Tittelboom, K.; De Belie, N. Chloride induced reinforcement corrosion behavior in self-healing concrete with encapsulated polyurethane. Cem. Concr. Res. 2018, 113, 130–139. [Google Scholar] [CrossRef]
- Jia, D.; Bao, W.; Jia, Z.; Sun, Q. Preparation and photo-responsive behavior of reversible photochromic polyurethane cement composites. Appl. Phys. A 2020, 126, 373. [Google Scholar] [CrossRef]
- ASTM International. Standard Practice for Making and Curing Concrete Test Specimens in the Laboratory; US-ASTM C192; C192M-2018; ASTM International: Washington, DC, USA, 2018. [Google Scholar]
- Yang, L.; Xie, H.; Fang, S.; Huang, C.; Chao, Y.J. Experimental study on mechanical properties and damage mechanism of basalt fiber reinforced concrete under uniaxial compression. Structures 2021, 31, 330–340. [Google Scholar] [CrossRef]
- Haiyan, Z.; Liang, C.; Bo, W. Tensile and bond properties and strength degradation mechanism of geopolymer mortar after exposure to elevated temperatures. J. Harbin Inst. Technol. 2016, 48, 128–134. [Google Scholar] [CrossRef]
- U.S. Department of Transportation. Superpave Fundamantals Reference Manual; American Asphalt Association: Washington, DC, USA, 2005.
- Yadong, Z.; Qingguo, F.; Shaoqing, W. Numerical investigation of the loading frequency for fatigue test of C/SiC materials. J. Vib. Eng. 2016, 29, 985–991. [Google Scholar] [CrossRef]
- Gao, H.; Sun, Q. Study on Fatigue Test and Life Prediction of Polyurethane Cement Composite (PUC) under High or Low Temperature Conditions. Adv. Mater. Sci. Eng. 2020. [Google Scholar] [CrossRef] [Green Version]
- Sampaio, C.H.; Cazacliu, B.G.; Ambrós, W.; Kronbauer, M.A.; Mc Tubino, R.; Molin, D.C.D.; Oliva, J.; Miltzarek, G.L.; Waskow, R.P.; Dos Santos, V.L. Demolished concretes recycling by the use of pneumatic jigs. Waste Manag. Res. 2020, 4, 392–399. [Google Scholar] [CrossRef] [PubMed]


| Mesh Size (mm) | 9.5 | 4.75 | 2.36 | 1.18 | 0.6 | 0.3 | 0.15 | 0.075 | Mineral Powder |
|---|---|---|---|---|---|---|---|---|---|
| Percentage of through sieve | 95.0% | 60.0% | 44.0% | 32.0% | 22.5% | 16.0% | 11.0% | 6.0% | —— |
| Aggregate mass (per 1000 g) | 50.0 | 380.0 | 319.2 | 170.5 | 62.2 | 15.2 | 2.6 | 0.3 | 0.02 |
| Number | F01 | F02 | F03 | F04 | F05 | F06 | Average | Standard Deviation | Coefficient of Variation (%) |
|---|---|---|---|---|---|---|---|---|---|
| Density(kg/m3) | 1760 | 1775 | 1774 | 1781 | 1759 | 1762 | 1768.5 | 86.7 | 4.902 |
| Compression strength (MPa) | 58.5 | 58.9 | 60.3 | 58.7 | 60.6 | 61.2 | 59.7 | 1.3 | 2.178 |
| Number | ZL01 | ZL02 | ZL03 | ZL04 | ZL05 | ZL06 | Average | Standard Deviation | Coefficient of Variation (%) |
|---|---|---|---|---|---|---|---|---|---|
| Density(kg/m3) | 1760 | 1775 | 1774 | 1781 | 1759 | 1762 | 1768.5 | 86.7 | 4.902 |
| Tensile strength (MPa) | 40.9 | 41.9 | 40.3 | 41.6 | 40.9 | 41.1 | 41.1 | 0.322 | 0.783 |
| Number | Temperature | S-N Fatigue Equation |
|---|---|---|
| 1 | −20 °C | lgN = 7.4397 − 0.0672σ |
| 2 | 0 °C | lgN = 7.6141 − 0.0559σ |
| 3 | 20 °C | lgN = 7.5484 − 0.0332σ |
Publisher’s Note: MDPI stays neutral with regard to jurisdictional claims in published maps and institutional affiliations. |
© 2021 by the authors. Licensee MDPI, Basel, Switzerland. This article is an open access article distributed under the terms and conditions of the Creative Commons Attribution (CC BY) license (https://creativecommons.org/licenses/by/4.0/).
Share and Cite
Jia, Z.; Jia, D.; Sun, Q.; Wang, Y.; Ding, H. Preparation and Mechanical-Fatigue Properties of Elastic Polyurethane Concrete Composites. Materials 2021, 14, 3839. https://doi.org/10.3390/ma14143839
Jia Z, Jia D, Sun Q, Wang Y, Ding H. Preparation and Mechanical-Fatigue Properties of Elastic Polyurethane Concrete Composites. Materials. 2021; 14(14):3839. https://doi.org/10.3390/ma14143839
Chicago/Turabian StyleJia, Zhen, Dongzhe Jia, Quansheng Sun, Yanqi Wang, and Hongjian Ding. 2021. "Preparation and Mechanical-Fatigue Properties of Elastic Polyurethane Concrete Composites" Materials 14, no. 14: 3839. https://doi.org/10.3390/ma14143839
APA StyleJia, Z., Jia, D., Sun, Q., Wang, Y., & Ding, H. (2021). Preparation and Mechanical-Fatigue Properties of Elastic Polyurethane Concrete Composites. Materials, 14(14), 3839. https://doi.org/10.3390/ma14143839