
Evaluation of the Impact of Different Natural Zeolite Treatments on the Capacity of Eliminating/Reducing Odors and Toxic Compounds


 and
and 
Abstract
1. Introduction
2. Materials and Methods
2.1. Zeolite Samples
2.2. Materials
2.3. Zeolite Treatments
2.4. Characterization
2.5. Experimental Plan
2.6. PAHs Analysis
2.7. Statistical Data Analysis
3. Results and Discussion
3.1. Characterization of Zeolites
3.2. Experiment 1
3.3. Experiment 2
4. Conclusions
Author Contributions
Funding
Institutional Review Board Statement
Informed Consent Statement
Data Availability Statement
Conflicts of Interest
References
- Castro, J.B.; Ramanathan, A.; Chennubhotla, C.S. Categorical Dimensions of Human Odor Descriptor Space Revealed by Non-Negative Matrix Factorization. PLoS ONE 2013, 8, e73289. [Google Scholar] [CrossRef]
- Dalton, P.; Claeson, A.-S.; Horenziak, S. The Impact of Indoor Malodor: Historical Perspective, Modern Challenges, Negative Effects, and Approaches for Mitigation. Atmosphere 2020, 11, 126. [Google Scholar] [CrossRef]
- Hooiveld, M.; van Dijk, C.; van der Sman-de Beer, F.; Smit, L.A.; Vogelaar, M.; Wouters, I.M.; Heederik, D.J.; Yzermans, C.J. Odour annoyance in the neighbourhood of livestock farming—Perceived health and health care seeking behaviour. Ann. Agric. Environ. Med. 2015, 22, 55–61. [Google Scholar] [CrossRef] [PubMed][Green Version]
- Takahashi, Y.K.; Nagayama, S.; Mori, K. Detection and Masking of Spoiled Food Smells by Odor Maps in the Olfactory Bulb. J. Neurosci. 2004, 24, 8690–8694. [Google Scholar] [CrossRef] [PubMed]
- Huang, Y.; Doh, I.-J.; Bae, E. Design and Validation of a Portable Machine Learning-Based Electronic Nose. Sensors 2021, 21, 3923. [Google Scholar] [CrossRef]
- Terpstra, M.J.; Steenbekkers, L.P.A.; de Maertelaere, N.C.M.; Nijhuis, S. Food storage and disposal: Consumer practices and knowledge. Br. Food J. 2005, 107, 526–533. [Google Scholar] [CrossRef]
- Hajdusianek, W.; Żórawik, A.; Waliszewska-Prosół, M.; Poręba, R.; Gać, P. Tobacco and Nervous System Development and Function—New Findings 2015–2020. Brain Sci. 2021, 11, 797. [Google Scholar] [CrossRef]
- Kurmus, H.; Mohajerani, A.; Grist, S. Polycyclic Aromatic Hydrocarbons (PAHs) in Fired Clay Bricks Incorporating Cigarette Butts. Materials 2021, 14, 2032. [Google Scholar] [CrossRef]
- Ding, Y.S.; Ward, J.; Hammond, D.; Watson, C.H. Mouth-Level Intake of Benzo[a]pyrene from Reduced Nicotine Cigarettes. Int. J. Environ. Res. Public Health 2014, 11, 11898–11914. [Google Scholar] [CrossRef]
- Neda, K.; Farshid, M.R.; Amber, M.; Farhan, A.; Farid, A.; Ulrika, N.; Lars, B.; Lennart, B. Nanocellulose–Zeolite Composite Films for Odor Elimination. ACS Appl. Mater. Interfaces 2015, 7, 14254–14262. [Google Scholar]
- Abdullah, N.H.; Shameli, K.; Etesami, M.; Abdullah, C.E.; Abdullah, L.C. Facile and green preparation of magnetite/zeolite nanocomposites for energy application in a single-step procedure. J. Alloy. Compd. 2017, 719, 218–226. [Google Scholar] [CrossRef]
- Zhang, P.; Yang, G.; Tan, L.; Ai, P.; Yang, R.; Tsubaki, N. Direct synthesis of liquefied petroleum gas from syngas over H-ZSM-5 enwrapped Pd-based zeolite capsule catalyst. Catal. Today 2018, 303, 77–85. [Google Scholar] [CrossRef]
- van Speybroeck, V.; Hemelsoet, K.; Joos, L.; Waroquier, M.; Bell, R.G.; Catlow, C.R.A. Advances in theory and their application within the field of zeolite chemistry. Chem. Soc. Rev. 2015, 44, 7044–7111. [Google Scholar] [CrossRef]
- Baek, S.W.; Kim, J.R.; Ihm, S.K. Design of dual functional adsorbent/catalyst system for the control of VOC’s by using metal-loaded hydrophobic Y-zeolites. Catal. Today 2004, 93, 575–581. [Google Scholar] [CrossRef]
- Dubinin, M.M.; Astakhov, V.A. Description of adsorption equilibria of vapors on zeolites over wide ranges of temperature and pressure. Adv. Chem. 1971, 69–85. [Google Scholar] [CrossRef]
- Sing, K.S.W. Reporting physisorption data for gas/solid systems with special reference to the determination of surface area and porosity. Pure Appl. Chem. 1985, 57, 603–619. [Google Scholar] [CrossRef]
- Luo, J.; Lindsey, S. The use of pine bark and natural zeolite as biofilter media to remove animal rendering process odours. Bioresour. Technol. 2006, 97, 1461–1469. [Google Scholar] [CrossRef] [PubMed]
- Ayodele, O.B.; Sulaimon, A.A.; Alaba, P.A.; Tian, Z.Y. Influence of metakaolinization temperature on the structure and activity of metakaolin supported Ni catalyst in dry methane reforming. J. Environ. 2020, 8, 103239. [Google Scholar] [CrossRef]
- Castro, C.J.; Shyu, H.Y.; Xaba, L.; Bair, R.; Yeh, D.H. Performance and onsite regeneration of natural zeolite for ammonium removal in a field-scale non-sewered sanitation system. Sci. Total Environ. 2021, 776, 145938. [Google Scholar] [CrossRef] [PubMed]
- Yuming, F.; Lingzhi, S.; Ling, T.; Hong, L. Ethylene removal efficiency and bacterial community diversity of a natural zeolite biofilter. Bioresour. Technol. 2011, 102, 576–584. [Google Scholar]
- Wolfram, M.; Milos, M.; Rebeca, Z.; Marcus, S.; Eberhard, H.; Urban, P. Reduction potential of microbial, odour and ammonia emissions from a pig facility by biofilters. Int. J. Hyg. Environ. Health 2001, 203, 335–345. [Google Scholar]
- Baiming, R.; Nathalie, L.; Yaqian, Z.; Ange, N. Simultaneous hydrogen sulfide removal and wastewater purification in a novel alum sludge-based odor-gas aerated biofilter. Chem. Eng. J. 2021, 419, 129558. [Google Scholar]
- Jianwei, L.; Jianbin, S.; Chen, L.; Peng, Y.; Xinyue, K.; Xueli, L. Bioaerosol emissions of pilot-scale low-pH and neutral-pH biofilters treating odors from landfill leachate: Characteristics and impact factors. Waste Manag. 2021, 128, 64–72. [Google Scholar]
- Lei, X.; Zheng, Z.; Graham, N.J.D.; Mengjie, L.; Wenzheng, Y. Enhancing ultrafiltration performance by gravity-driven up-flow slow biofilter pre-treatment to remove natural organic matters and biopolymer foulants. Water Res. 2021, 195, 1170010. [Google Scholar]
- Guang, H.; Yang, J.; Duan, X.; Farnood, R.; Yang, C.; Yang, J.; Liu, W.; Liu, Q. Recent developments and challenges in zeolite-based composite photocatalysts for environmental applications. Chem. Eng. J. 2021, 417, 129209. [Google Scholar]
- Liu, W.; Aldahri, T.; Xu, C.; Li, C.; Rohani, S. Synthesis of sole gismondine-type zeolite from blast furnace slag during CO2 mineralization process. J. Environ. Chem. Eng. 2020, 9, 104652. [Google Scholar] [CrossRef]
- Cadar, O.; Senila, M.; Hoaghia, M.A.; Scurtu, D.; Miu, I.; Levei, E.A. Effects of Thermal Treatment on Natural Clinoptilolite-Rich Zeolite Behavior in Simulated Biological Fluids. Molecules 2020, 25, 2570. [Google Scholar] [CrossRef]
- Nychas, G.-J.E.; Panagou, E. Microbiological spoilage of foods and beverages. In Food and Beverage Stability and Shelf Life, 1st ed.; Kilcast, D., Subramaniam, P., Eds.; Woodhead Publishing: Cambridge, UK, 2011; Volume 1, pp. 3–28. [Google Scholar]
- Ma, Y.; Tang, K.; Xu, Y.; Thomas-Danguin, T. A dataset on odor intensity and odor pleasantness of 222 binary mixtures of 72 key food odorants rated by a sensory panel of 30 trained assessors. Data Brief 2021, 36, 107143. [Google Scholar] [CrossRef]
- San Cristóbal, A.G.; Castelló, R.; Martín Luengo, M.A.; Vizcayno, C. Zeolites prepared from calcined and mechanically modified kaolins: A comparative study. Appl. Clay Sci. 2010, 49, 239–246. [Google Scholar] [CrossRef]
- Elaiopoulos, K.; Perraki, T.; Grigoropoulou, E. Mineralogical study and porosimetry measurements of zeolites from Scaloma area, Thrace, Greece. Microporous Mesoporous Mater. 2008, 112, 441–449. [Google Scholar] [CrossRef]
- Ramesh, K.; Reddy, D.D. Advances in Agronomy; Sparks, D.L., Ed.; Academic Press: Newark, DE, USA, 2011; Volume 113, pp. 219–241. [Google Scholar]
- Buchori, L.; Widayat, W.; Muraza, O.; Amali, M.I.; Maulida, R.W.; Prameswari, J. Effect of temperature and concentration of zeolite catalysts from geothermal solid waste in biodiesel production from used cooking oil by esterification–transesterification process. Processes 2020, 8, 1629. [Google Scholar] [CrossRef]
- Araújo, R.S.; Azevedo, D.C.S.; Cavalcante, C.L.; Jiménez-López, A.; Rodríguez-Castellón, E. Adsorption of polycyclic aromatic hydrocarbons (PAHs) from isooctane solutions by mesoporous molecular sieves: Influence of the surface acidity. Microporous Mesoporous Mater. 2008, 108, 213–220. [Google Scholar] [CrossRef]
- Wirawan, S.K.; Sudibyo, H.; Setiaji, M.F.; Warmada, I.W.; Wahyuni, E.T. Development of natural zeolites adsorbent: Chemical analysis and preliminary TPD adsorption study. J. Eng. Sci. Technol. 2015, 4, 87–95. [Google Scholar]


| Sample Code | Description |
|---|---|
| Initial 1 | Zeolite, particle size 1–3 mm |
| Initial 2 | Zeolite, particle size 3–5 mm |
| Cal 1 | Thermally treated zeolite, particle size 1–3 mm |
| Cal 2 | Thermally treated zeolite, particle size 3–5 mm |
| HCl 1 | Chemically modified zeolite with HCl, particle size 1–3 mm |
| HCl 2 | Chemically modified zeolite with HCl, particle size 3–5 mm |
| NaOH 1 | Chemically modified zeolite with NaOH, particle size 1–3 mm |
| NaOH 2 | Chemically modified zeolite with NaOH, particle size 3–5 mm |
| Test Type | Performed Analysis | Burning Interval |
|---|---|---|
| Air from the sealed chamber into which only tobacco was introduced (control sample) | Fuel gases | Immediately after the combustion stopped |
| Sampling on PM10 particle filter from the sealed chamber in which only tobacco was introduced (control sample) | Polycyclic aromatic hydrocarbons | Immediately after the combustion stopped |
| Air from the sealed chamber | Fuel gases | Immediately after the combustion stopped |
| Cal 1, NaOH, 2 HCl 2 | Polycyclic aromatic hydrocarbons | 24 h after the combustion stopped |
| Sampling with cotton buds from the bottom of the sealed chamber | Polycyclic aromatic hydrocarbons | 24 h after the combustion stopped |
| Sampling on PM10 particle filter from the sealed chamber | Polycyclic aromatic hydrocarbons | 24 h after the combustion stopped |
| Step | Equipment/Materials Used | Parameters |
|---|---|---|
| Extraction | Ultrasonic bath, LBS, Falc, Italy |
|
| Purification | Cellulose filter without metals |
|
| Concentration | Rotavapor HeiVap Precision Heidolph, Schwabach, Germany |
|
| Analysis | HPLC-FLD, Perkin Elmer 200 Series Shelton, CT, USA |
|
| Sample | Initial 1 | Initial 2 | Cal 1 | Cal 2 | NaOH 1 | NaOH 2 | HCl 1 | HCl 2 |
|---|---|---|---|---|---|---|---|---|
| Na2O | 0.33 ± 0.03 | 0.33 ± 0.02 | 0.44 ± 0.03 | 0.45 ± 0.03 | 3.40 ± 0.31 | 3.45 ± 0.32 | <0.14 | <0.14 |
| K2O | 2.87 ± 0.24 | 2.47 ± 0.30 | 2.47 ± 0.34 | 3.01 ± 0.27 | 2.41 ± 0.24 | 1.87 ± 0.20 | 3.10 ± 0.29 | 2.34 ± 0.26 |
| CaO | 2.48 ± 0.29 | 2.47 ± 0.33 | 3.19 ± 0.27 | 2.60 ± 0.29 | 4.83 ± 0.39 | 5.24 ± 0.56 | 1.72 ± 0.18 | 2.16 ± 0.24 |
| MgO | <0.14 | 0.96 ± 0.09 | 0.97 ± 0.12 | 1.17 ± 0.11 | 0.83 ± 0.09 | 0.98 ± 0.08 | 1.02 ± 0.11 | 1.10 ± 0.13 |
| Al2O3 | 12.64 ± 1.23 | 12.64 ± 1.29 | 12.33 ± 1.30 | 12.57 ± 1.28 | 10.58 ± 1.29 | 10.96 ± 1.10 | 12.41 ± 1.21 | 11.64 ± 1.21 |
| Fe2O3 | 2.54 ± 0.19 | 2.55 ± 0.21 | 2.31 ± 0.26 | 2.53 ± 0.19 | 1.91 ± 0.23 | 1.93 ± 0.17 | 2.27 ± 0.20 | 2.20 ± 0.17 |
| SiO2 | 69.79 ± 7.04 | 69.79 ± 6.78 | 70.50 ± 7.06 | 70.22 ± 7.11 | 67.24 ± 6.83 | 67.78 ± 6.67 | 72.38 ± 7.29 | 74.04 ± 7.33 |
| LOI | 4.87 ± 0.45 | 4.87 ± 0.42 | 5.04 ± 0.49 | 4.92 ± 0.51 | 5.60 ± 0.48 | 5.45 ± 0.56 | 5.14 ± 0.49 | 5.61 ± 0.55 |
| Sample | Humidity, Initial (%) | Humidity, Final (%) |
|---|---|---|
| Cal 1 | 0.62 ± 0.03 | 8.26 ± 0.41 |
| Cal 2 | 0.30 ± 0.02 | 6.65 ± 0.33 |
| NaOH 1 | 3.27 ± 0.16 | 9.72 ± 0.49 |
| NaOH 2 | 2.61 ± 0.13 | 9.28 ± 0.46 |
| HCl 1 | 2.55 ± 0.13 | 8.85 ± 0.44 |
| HCl 2 | 3.16 ± 0.16 | 8.44 ± 0.42 |
| Parameter | Control | Cal 1 | Cal 2 | NaOH 1 | NaOH 2 | HCl 1 | HCl 2 |
|---|---|---|---|---|---|---|---|
| CO2 (%) | 12.6 ± 1.4 | 7.2 ± 0.8 | 8.8 ± 1.0 | 7.8 ± 0.9 | 8.3 ± 0.9 | 9.9 ± 1.1 | 6.9 ± 0.8 |
| O2 (%) | 8 ± 0.9 | 11.2 ± 1.2 | 12.8 ± 1.4 | 10.9 ± 1.2 | 12 ± 1.3 | 11.9 ± 1.3 | 13.3 ± 1.5 |
| NH3 (ppm) | 37 ± 4.1 | 7 ± 0.8 | 9 ± 1.0 | 24 ± 2.6 | 9 ± 1.0 | 18 ± 2.0 | 2 ± 0.2 |
| CO (ppm) | 9 ± 1.0 | 6 ± 0.7 | 2 ± 0.2 | 7 ± 0.8 | 5 ± 0.6 | 6 ± 0.7 | 4 ± 0.4 |
| H2S (ppm) | 90 ± 9.9 | 27 ± 3.0 | 51 ± 5.6 | 59 ± 6.5 | 34 ± 3.7 | 59 ± 6.5 | 32 ± 3.5 |
| Sample | CO2 | O2 | NH3 | H2S | Humidity | Final Grade |
|---|---|---|---|---|---|---|
| Cal 1 | 9 | 6 | 9 | 10 | 10 | 93 |
| Cal 2 | 6 | 9 | 8 | 7 | 7 | 73 |
| NaOH 1 | 8 | 5 | 5 | 5 | 8 | 65 |
| NaOH 2 | 7 | 8 | 7 | 8 | 9 | 81 |
| HCl 1 | 5 | 7 | 6 | 6 | 6 | 60 |
| HCl 2 | 10 | 10 | 10 | 9 | 5 | 78 |
| Parameter | Obtained Value (ng/m3) | |||
|---|---|---|---|---|
| Blank | Cal 1 | NaOH 2 | HCl 2 | |
| Naphthalene | 0.88 ± 0.11 | <LQ * | <LQ * | <LQ * |
| Acenaphthene | 0.15 ± 0.02 | <LQ * | <LQ * | <LQ * |
| Fluorene | 0.72 ± 0.09 | 0.72 ± 0.09 | 0.15 ± 0.02 | 0.55 ± 0.07 |
| Phenanthrene | 0.72 ± 0.09 | 0.49 ± 0.06 | 0.97 ± 0.12 | 0.75 ± 0.09 |
| Anthracene | 0.87 ± 0.10 | 0.05 ± 0.01 | 0.41 ± 0.05 | 0.49 ± 0.06 |
| Fluoranthene | 2.13 ± 0.26 | 0.59 ± 0.07 | 0.67 ± 0.08 | 0.51 ± 0.06 |
| Pyrene | 5.68 ± 0.68 | 0.52 ± 0.06 | 0.64 ± 0.08 | 0.32 ± 0.04 |
| Benzo(a)anthracene | 8.68 ± 1.04 | 0.19 ± 0.02 | 0.32 ± 0.04 | 0.21 ± 0.03 |
| Chrysene | 0.92 ± 0.11 | 0.17 ± 0.02 | 0.22 ± 0.03 | 0.12 ± 0.01 |
| Benzo(b)fluoranthene | <LQ * | <LQ * | <LQ * | <LQ * |
| Benzo(k)fluoranthene | <LQ * | <LQ * | <LQ * | <LQ * |
| Benzo(a)pyrene | <LQ * | <LQ * | <LQ * | <LQ * |
| Dibenzo(a,h)anthracene | <LQ * | <LQ * | <LQ * | <LQ * |
| Benzo(g,h,i)perylene | <LQ * | <LQ * | <LQ * | <LQ * |
| Indeno(1,2,3-cd)pyrene | <LQ * | <LQ * | <LQ * | <LQ * |
| Total PAHs | 20.74 ± 2.49 | 2.73 ± 0.33 | 3.38 ± 0.41 | 2.95 ± 0.35 |
| Parameter | Obtained Value (ng/m3) | |||
|---|---|---|---|---|
| Blank | Cal 1 | NaOH 2 | HCl 2 | |
| Naphthalene | 11.36 ± 1.36 | 0.31 ± 0.04 | 2.09 ± 0.25 | 2.30 ± 0.28 |
| Acenaphthene | 0.81 ± 0.10 | <LQ * | <LQ * | <LQ * |
| Fluorene | 11.60 ± 1.39 | 0.63 ± 0.08 | 0.49 ± 0.06 | 0.24 ± 0.03 |
| Phenanthrene | 32.13 ± 3.86 | 0.63 ± 0.08 | 0.50 ± 0.06 | 0.19 ± 0.02 |
| Anthracene | 3.03 ± 0.36 | 0.03 ± 0.00 | <LQ * | <LQ * |
| Fluoranthene | 9.19 ± 1.10 | 0.13 ± 0.02 | 0.18 ± 0.02 | 0.18 ± 0.02 |
| Pyrene | 0.77 ± 0.09 | 0.09 ± 0.01 | 0.17 ± 0.02 | 0.17 ± 0.02 |
| Benzo(a)anthracene | 1.11 ± 0.13 | <LQ * | <LQ * | <LQ * |
| Chrysene | 4.32 ± 0.52 | <LQ * | <LQ * | <LQ * |
| Benzo(b)fluoranthene | 0.36 ± 0.04 | <LQ * | <LQ * | <LQ * |
| Benzo(k)fluoranthene | 0.12 ± 0.01 | <LQ * | <LQ * | <LQ * |
| Benzo(a)pyrene | 0.15 ± 0.02 | <LQ * | <LQ * | <LQ * |
| Dibenzo(a,h)anthracene | <LQ | <LQ * | <LQ * | <LQ * |
| Benzo(g,h,i)perylene | 0.12 ± 0.01 | <LQ * | <LQ * | <LQ * |
| Indeno(1,2,3-cd)pyrene | 0.59 ± 0.07 | <LQ * | <LQ * | <LQ * |
| Total PAHs | 75.69 ± 9.08 | 1.82 ± 0.22 | 3.42 ± 0.41 | 3.08 ± 0.37 |
| Parameter | PAHs (ng/g) | ||
|---|---|---|---|
| Cal 1 | NaOH 2 | HCl 2 | |
| Naphthalene | 0.32 ± 0.04 | 0.52 ± 0.06 | 0.91 ± 0.11 |
| Acenaphthene | 0.31 ± 0.04 | 0.26 ± 0.03 | 0.14 ± 0.02 |
| Fluorene | 0.55 ± 0.07 | 4.31 ± 0.52 | 8.98 ± 1.08 |
| Phenanthrene | 12.67 ± 1.52 | 15.37 ± 1.84 | 22.69 ± 2.72 |
| Anthracene | 3.16 ± 0.38 | 2.97 ± 0.36 | 1.53 ± 0.18 |
| Fluoranthene | 9.10 ± 1.09 | 14.67 ± 1.76 | 21.94 ± 2.63 |
| Pyrene | 9.26 ± 1.11 | 15.06 ± 1.81 | 20.67 ± 2.48 |
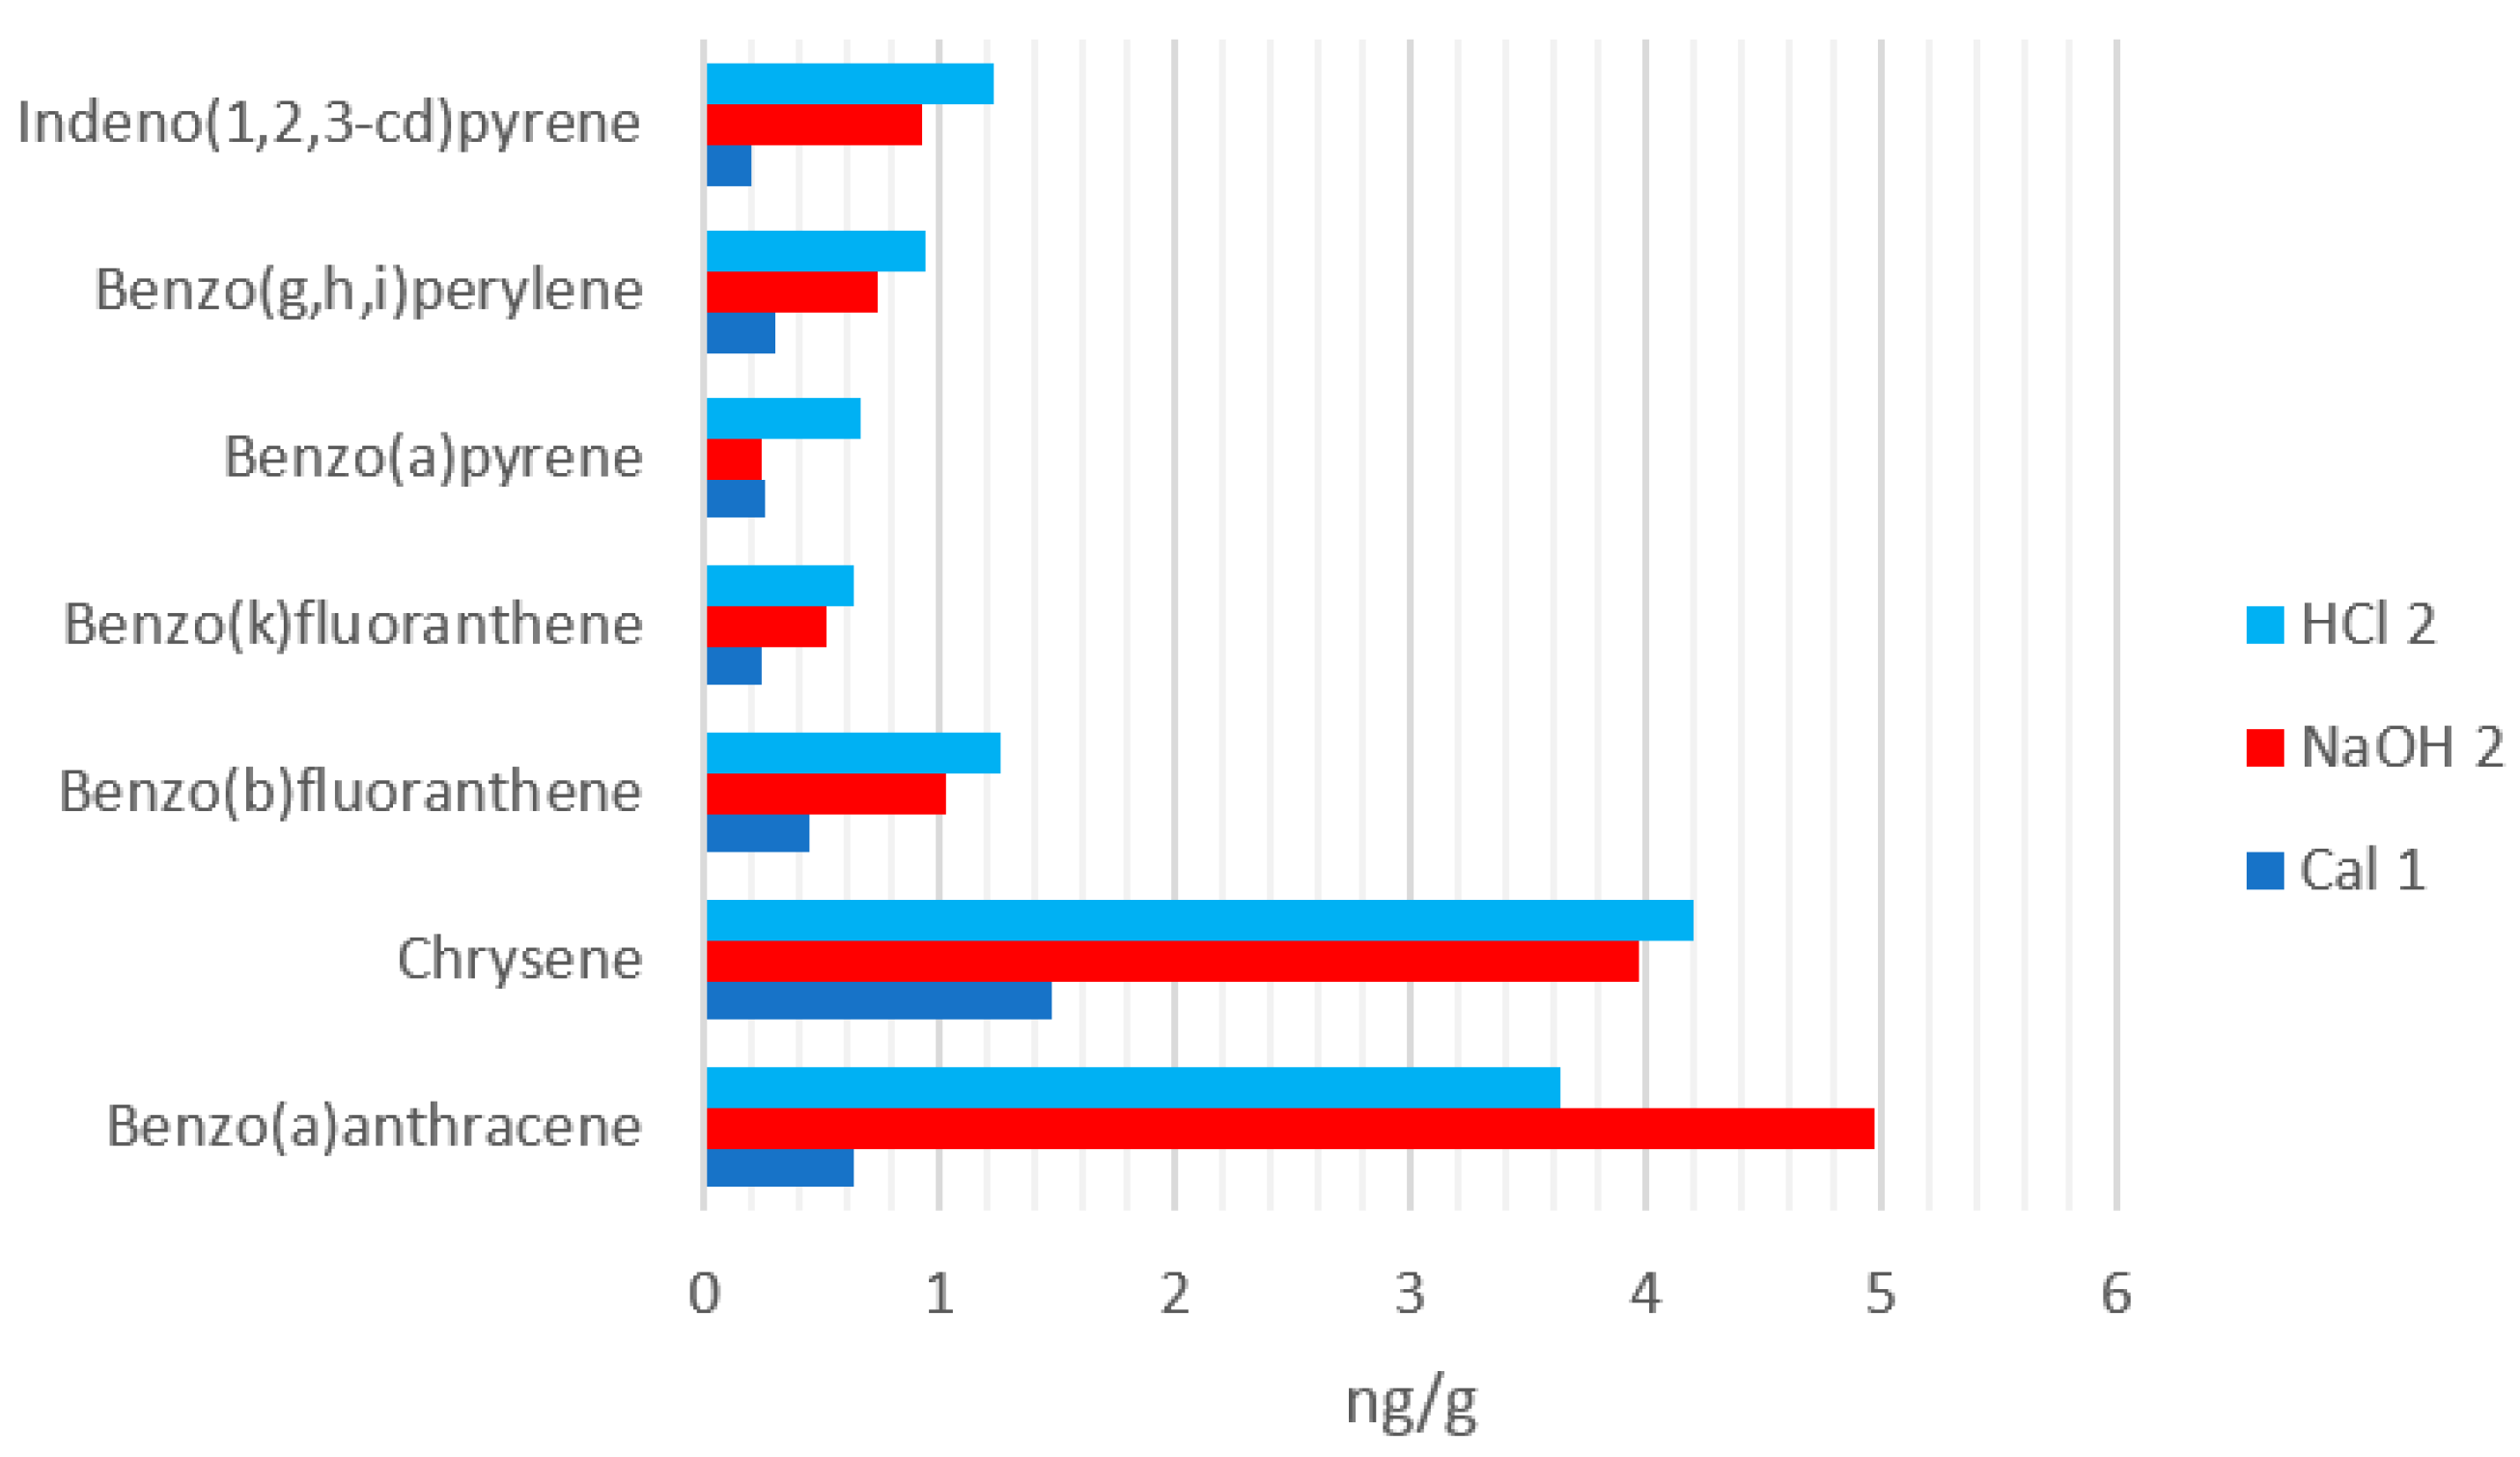
| Benzo(a)anthracene | 0.64 ± 0.08 | 4.97 ± 0.60 | 3.63 ± 0.44 |
| Chrysene | 1.47 ± 0.18 | 3.97 ± 0.48 | 4.20 ± 0.50 |
| Benzo(b)fluoranthene | 0.45 ± 0.05 | 1.03 ± 0.12 | 1.26 ± 0.15 |
| Benzo(k)fluoranthene | 0.24 ± 0.03 | 0.52 ± 0.06 | 0.63 ± 0.08 |
| Benzo(a)pyrene | 0.25 ± 0.03 | 0.24 ± 0.03 | 0.66 ± 0.08 |
| Dibenzo(a,h)anthracene | <LQ * | <LQ * | 0.16 ± 0.02 |
| Benzo(g,h,i)perylene | 0.30 ± 0.04 | 0.74 ± 0.09 | 0.94 ± 0.11 |
| Indeno(1,2,3-cd)pyrene | 0.20 ± 0.02 | 0.93 ± 0.11 | 1.23 ± 0.15 |
| Total PAHs | 38.92 ± 4.67 | 65.56 ± 7.87 | 89.56 ± 10.75 |
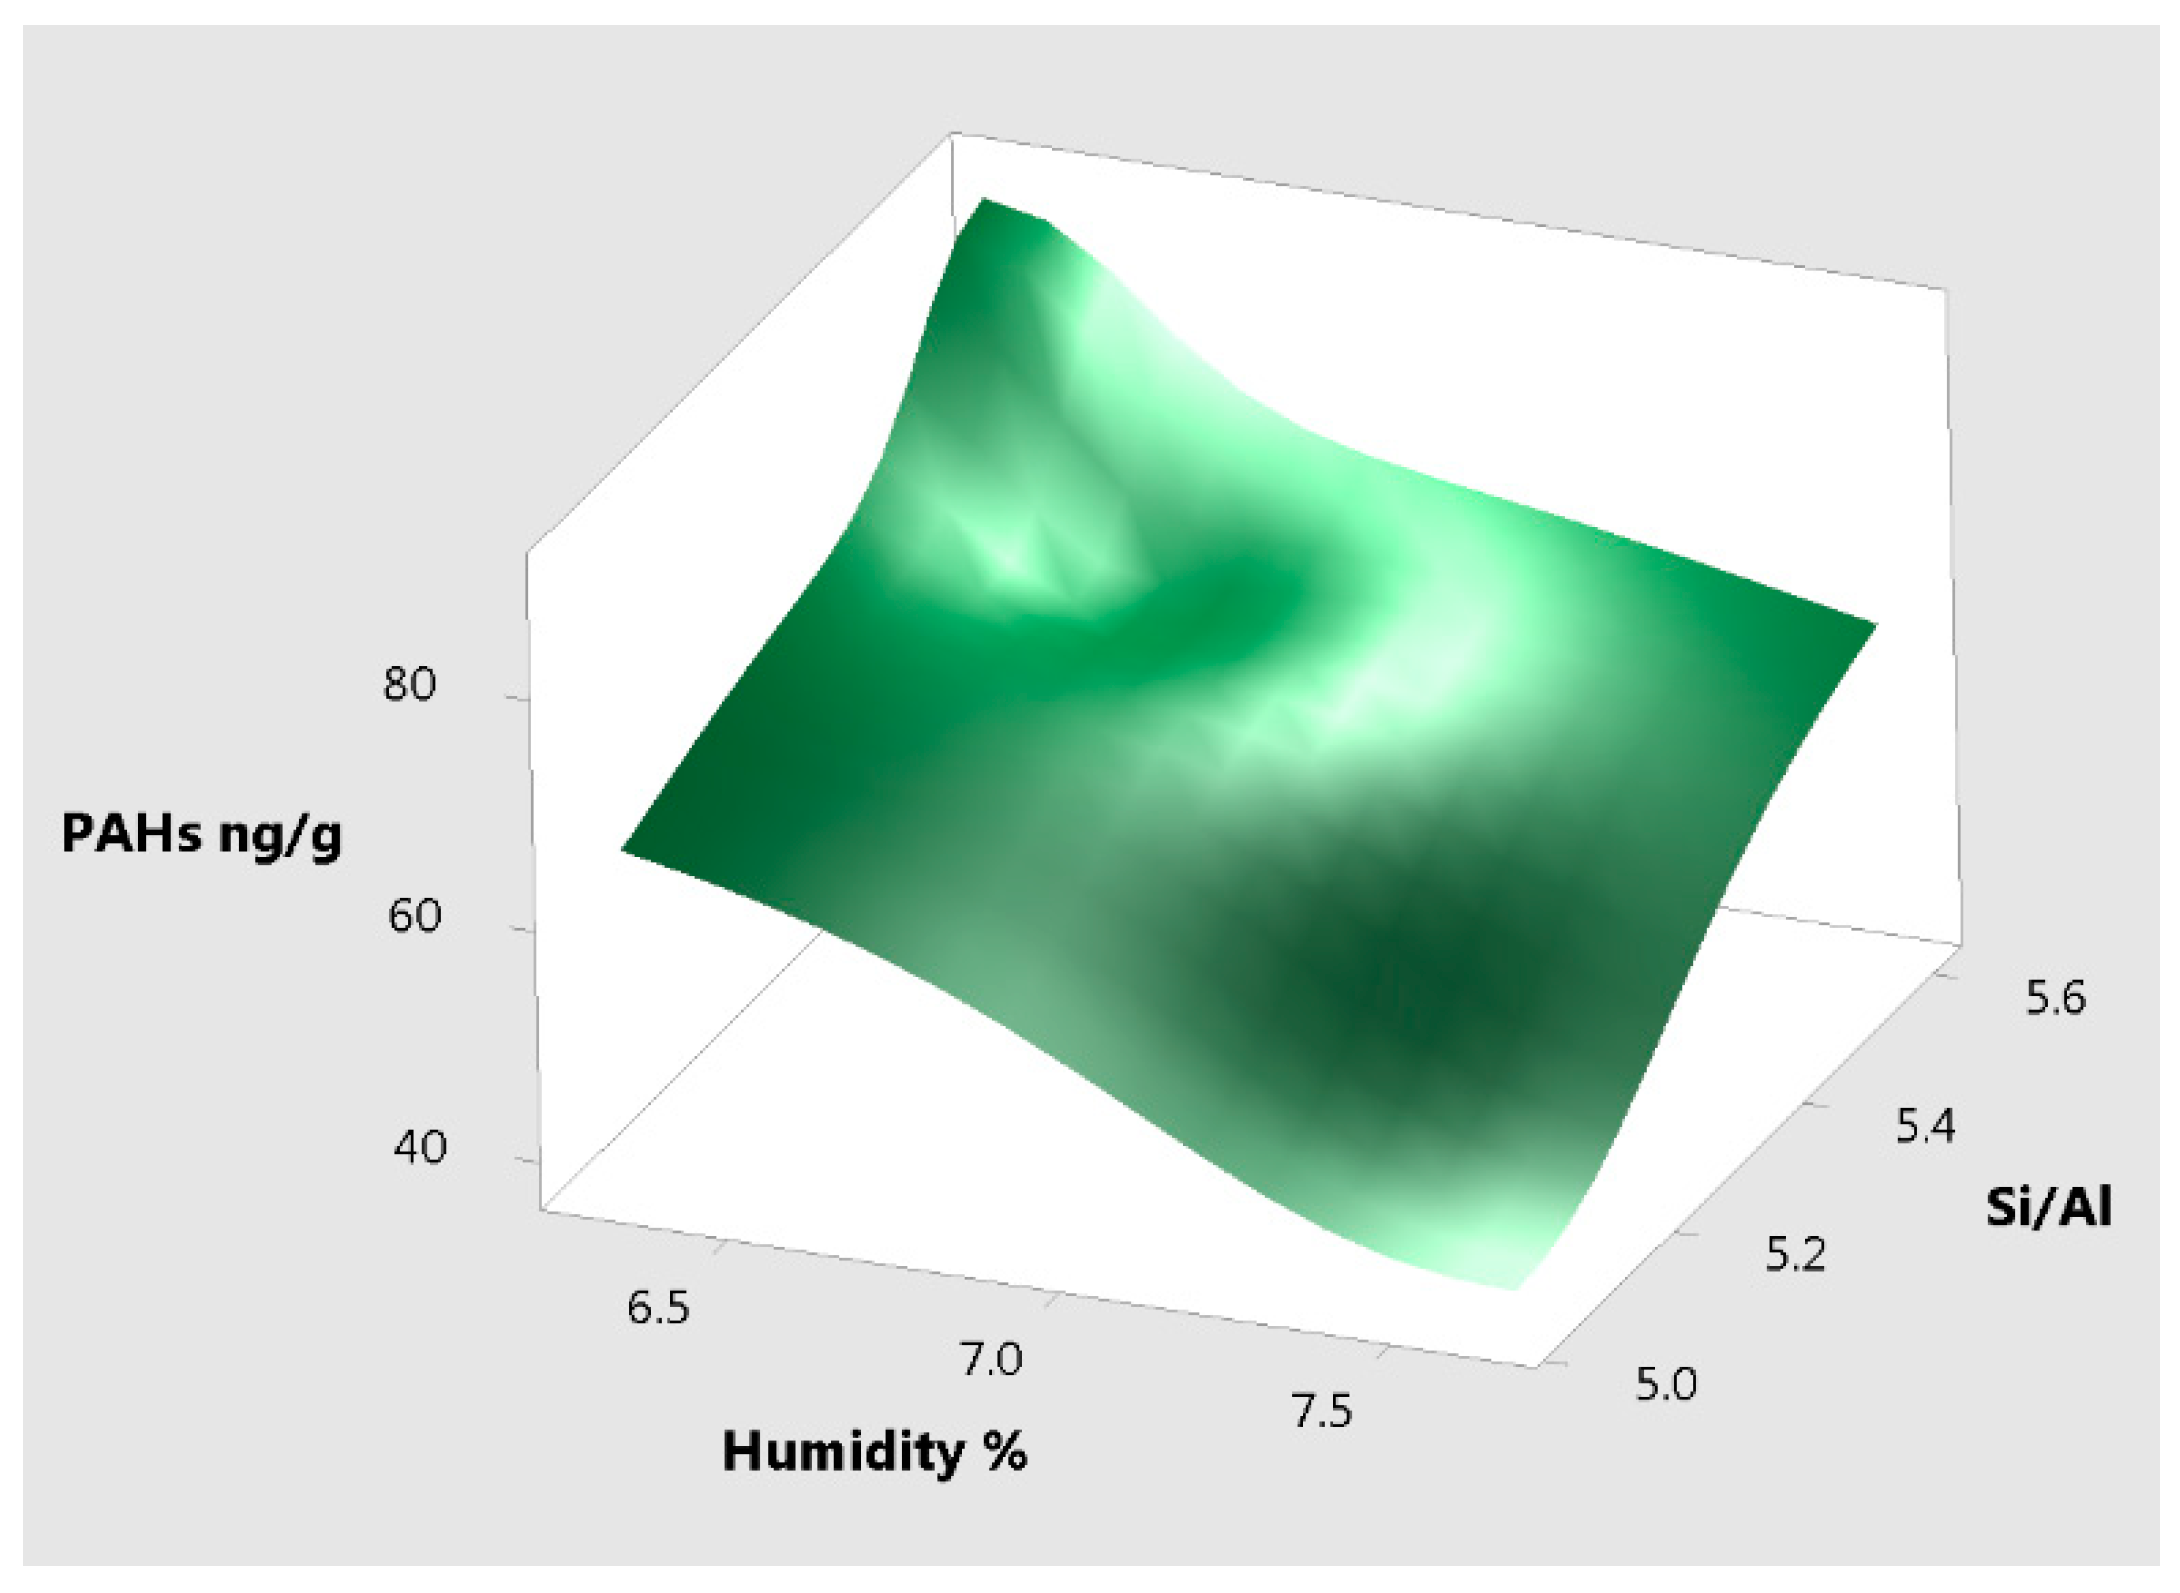
| Parameter | NH3 | H2S | Humidity | Si/Al | PAHs |
|---|---|---|---|---|---|
| NH3 | 1.000 | - | - | - | - |
| H2S | 0.038 | 1.000 | - | - | - |
| Humidity | 0.491 | −0.852 | 1.000 | - | - |
| Si/Al | −0.495 | 0.849 | −1.000 | 1.000 | - |
| PAHs | −0.671 | 0.715 | −0.975 | 0.976 | 1.000 |
Publisher’s Note: MDPI stays neutral with regard to jurisdictional claims in published maps and institutional affiliations. |
© 2021 by the authors. Licensee MDPI, Basel, Switzerland. This article is an open access article distributed under the terms and conditions of the Creative Commons Attribution (CC BY) license (https://creativecommons.org/licenses/by/4.0/).
Share and Cite
Fuss, V.L.B.; Bruj, G.; Dordai, L.; Roman, M.; Cadar, O.; Becze, A. Evaluation of the Impact of Different Natural Zeolite Treatments on the Capacity of Eliminating/Reducing Odors and Toxic Compounds. Materials 2021, 14, 3724. https://doi.org/10.3390/ma14133724
Fuss VLB, Bruj G, Dordai L, Roman M, Cadar O, Becze A. Evaluation of the Impact of Different Natural Zeolite Treatments on the Capacity of Eliminating/Reducing Odors and Toxic Compounds. Materials. 2021; 14(13):3724. https://doi.org/10.3390/ma14133724
Chicago/Turabian StyleFuss, Vanda Liliana Babalau, Gabriel Bruj, Lucian Dordai, Marius Roman, Oana Cadar, and Anca Becze. 2021. "Evaluation of the Impact of Different Natural Zeolite Treatments on the Capacity of Eliminating/Reducing Odors and Toxic Compounds" Materials 14, no. 13: 3724. https://doi.org/10.3390/ma14133724
APA StyleFuss, V. L. B., Bruj, G., Dordai, L., Roman, M., Cadar, O., & Becze, A. (2021). Evaluation of the Impact of Different Natural Zeolite Treatments on the Capacity of Eliminating/Reducing Odors and Toxic Compounds. Materials, 14(13), 3724. https://doi.org/10.3390/ma14133724