
Wire Arc Additive Manufacturing of Al-Mg Alloy with the Addition of Scandium and Zirconium

Abstract
:1. Introduction
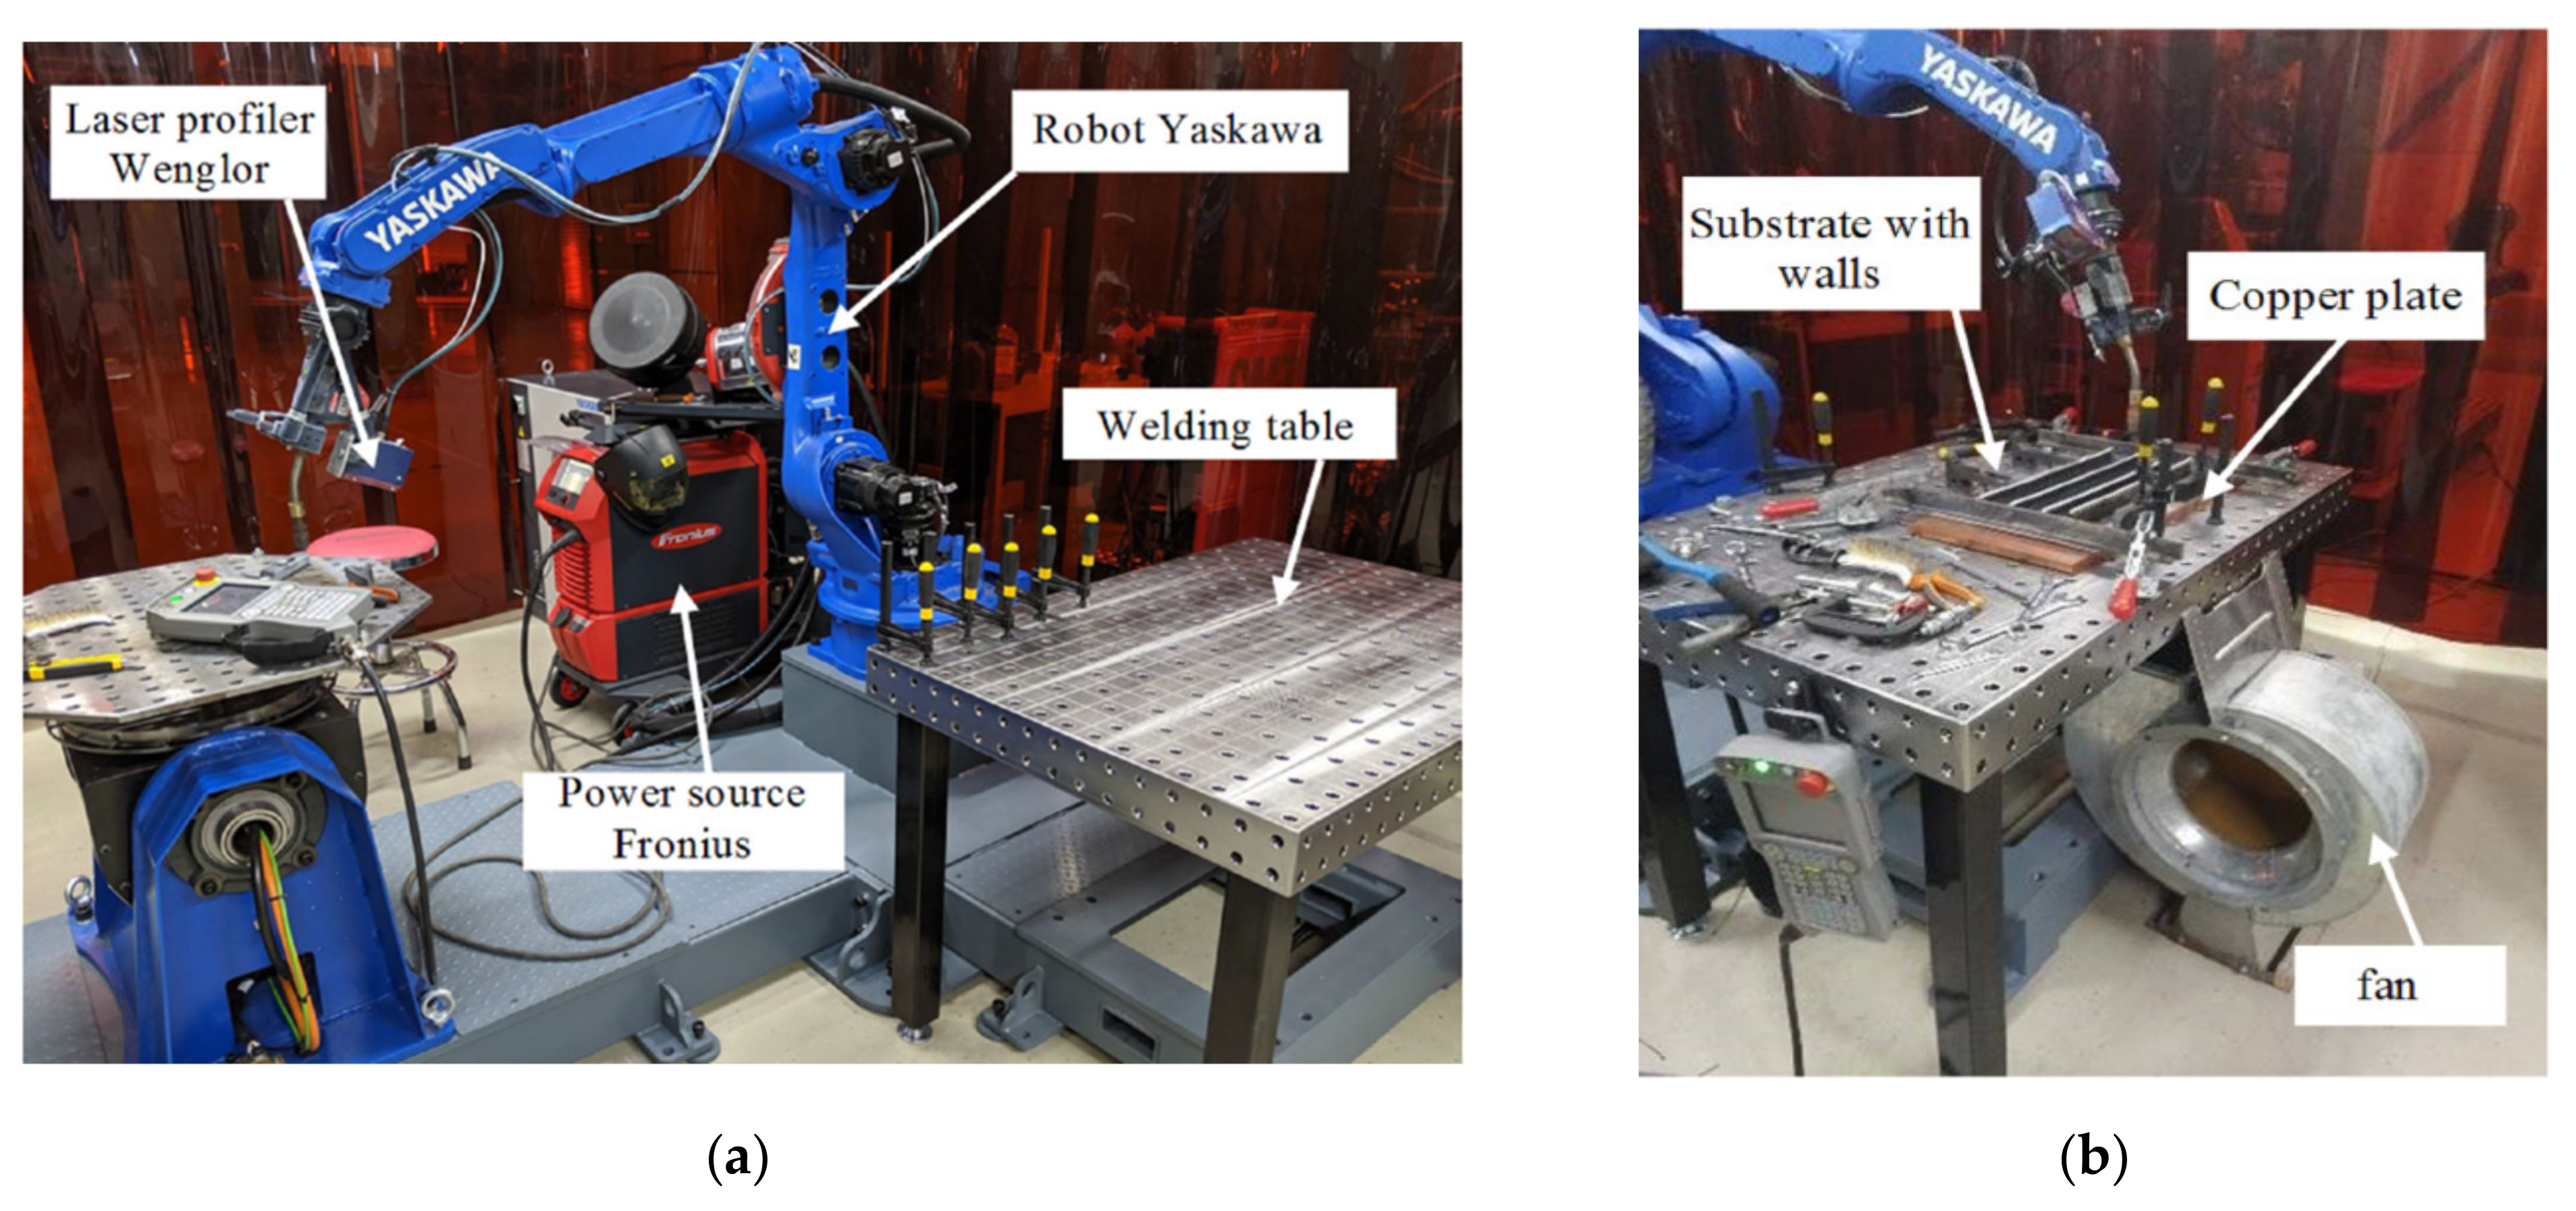
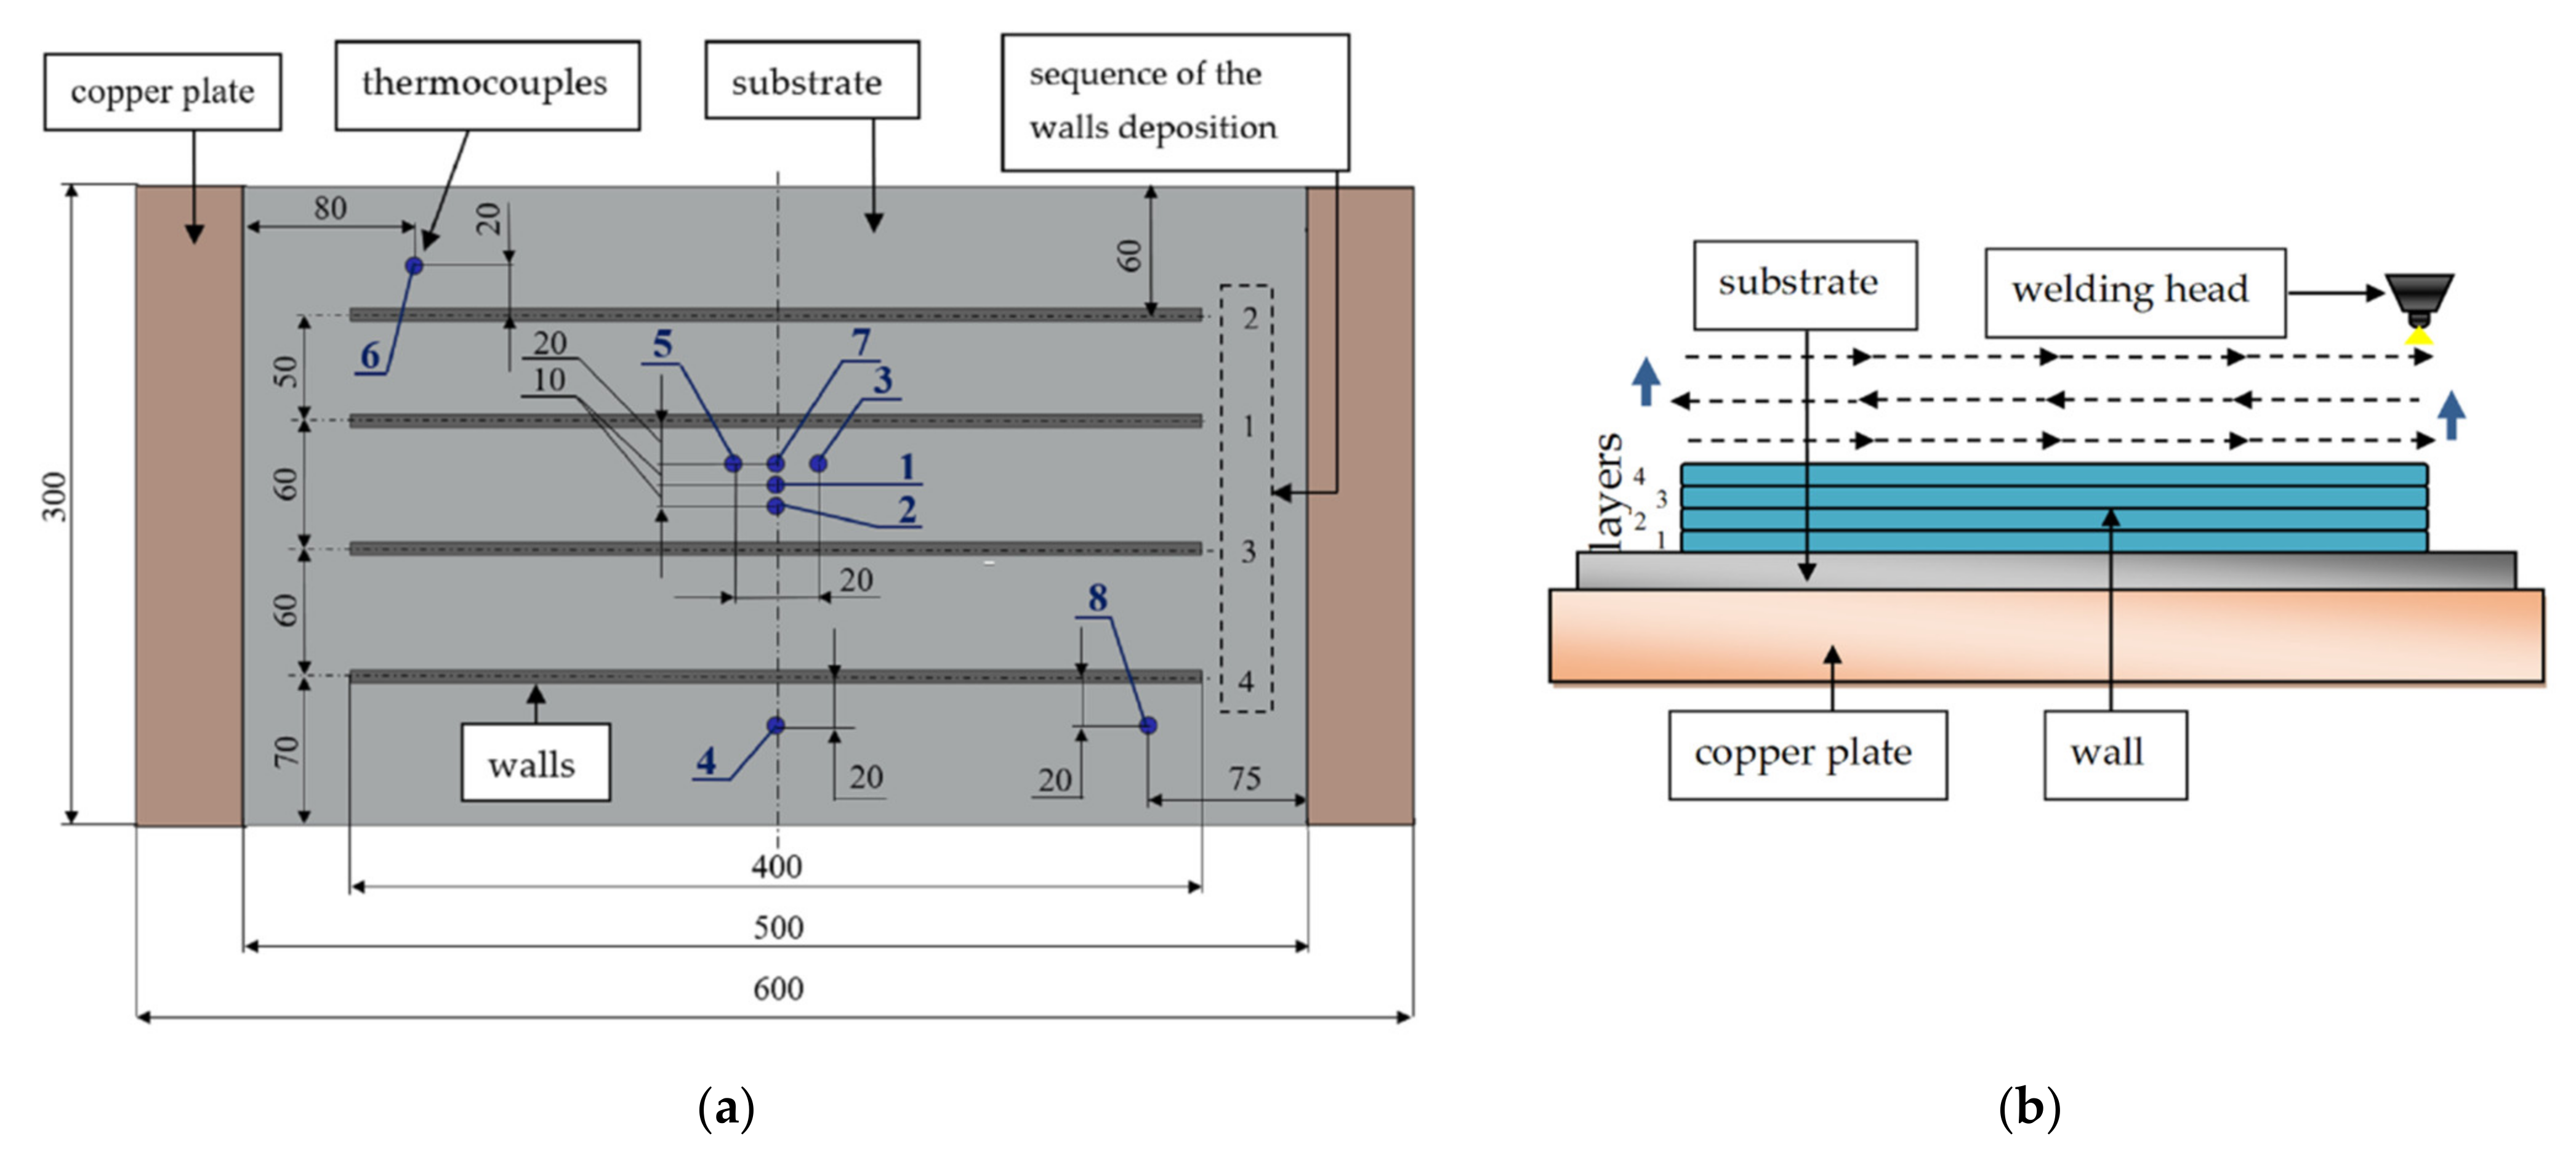
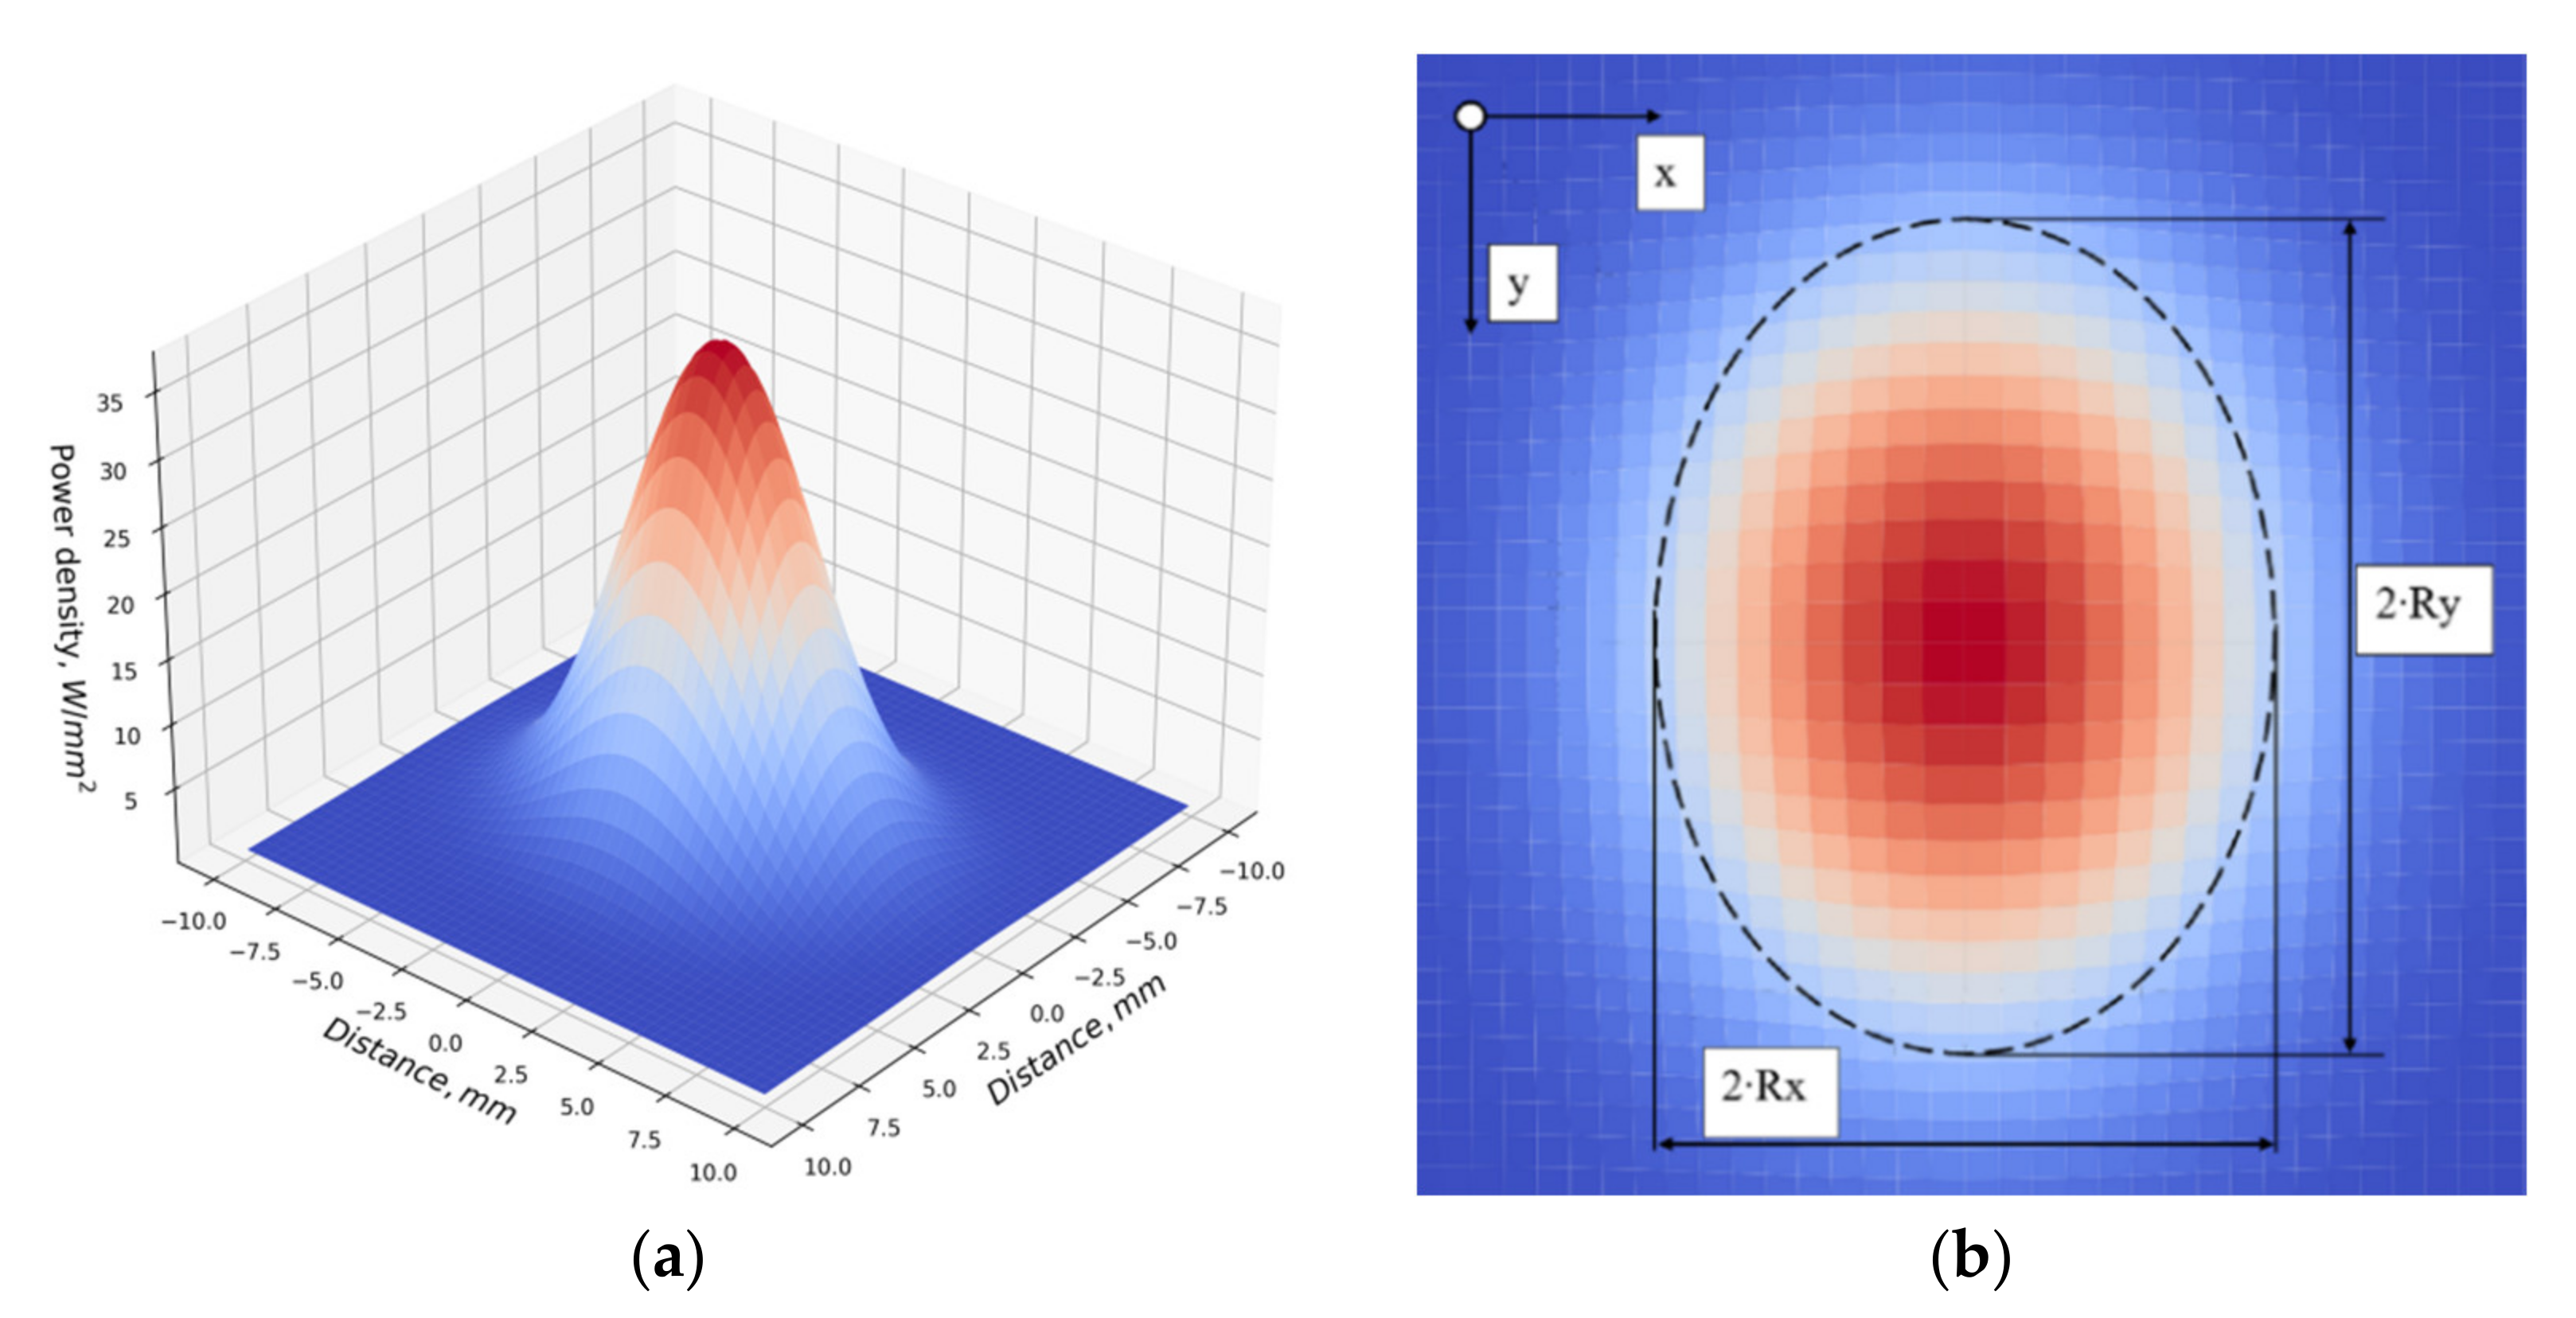
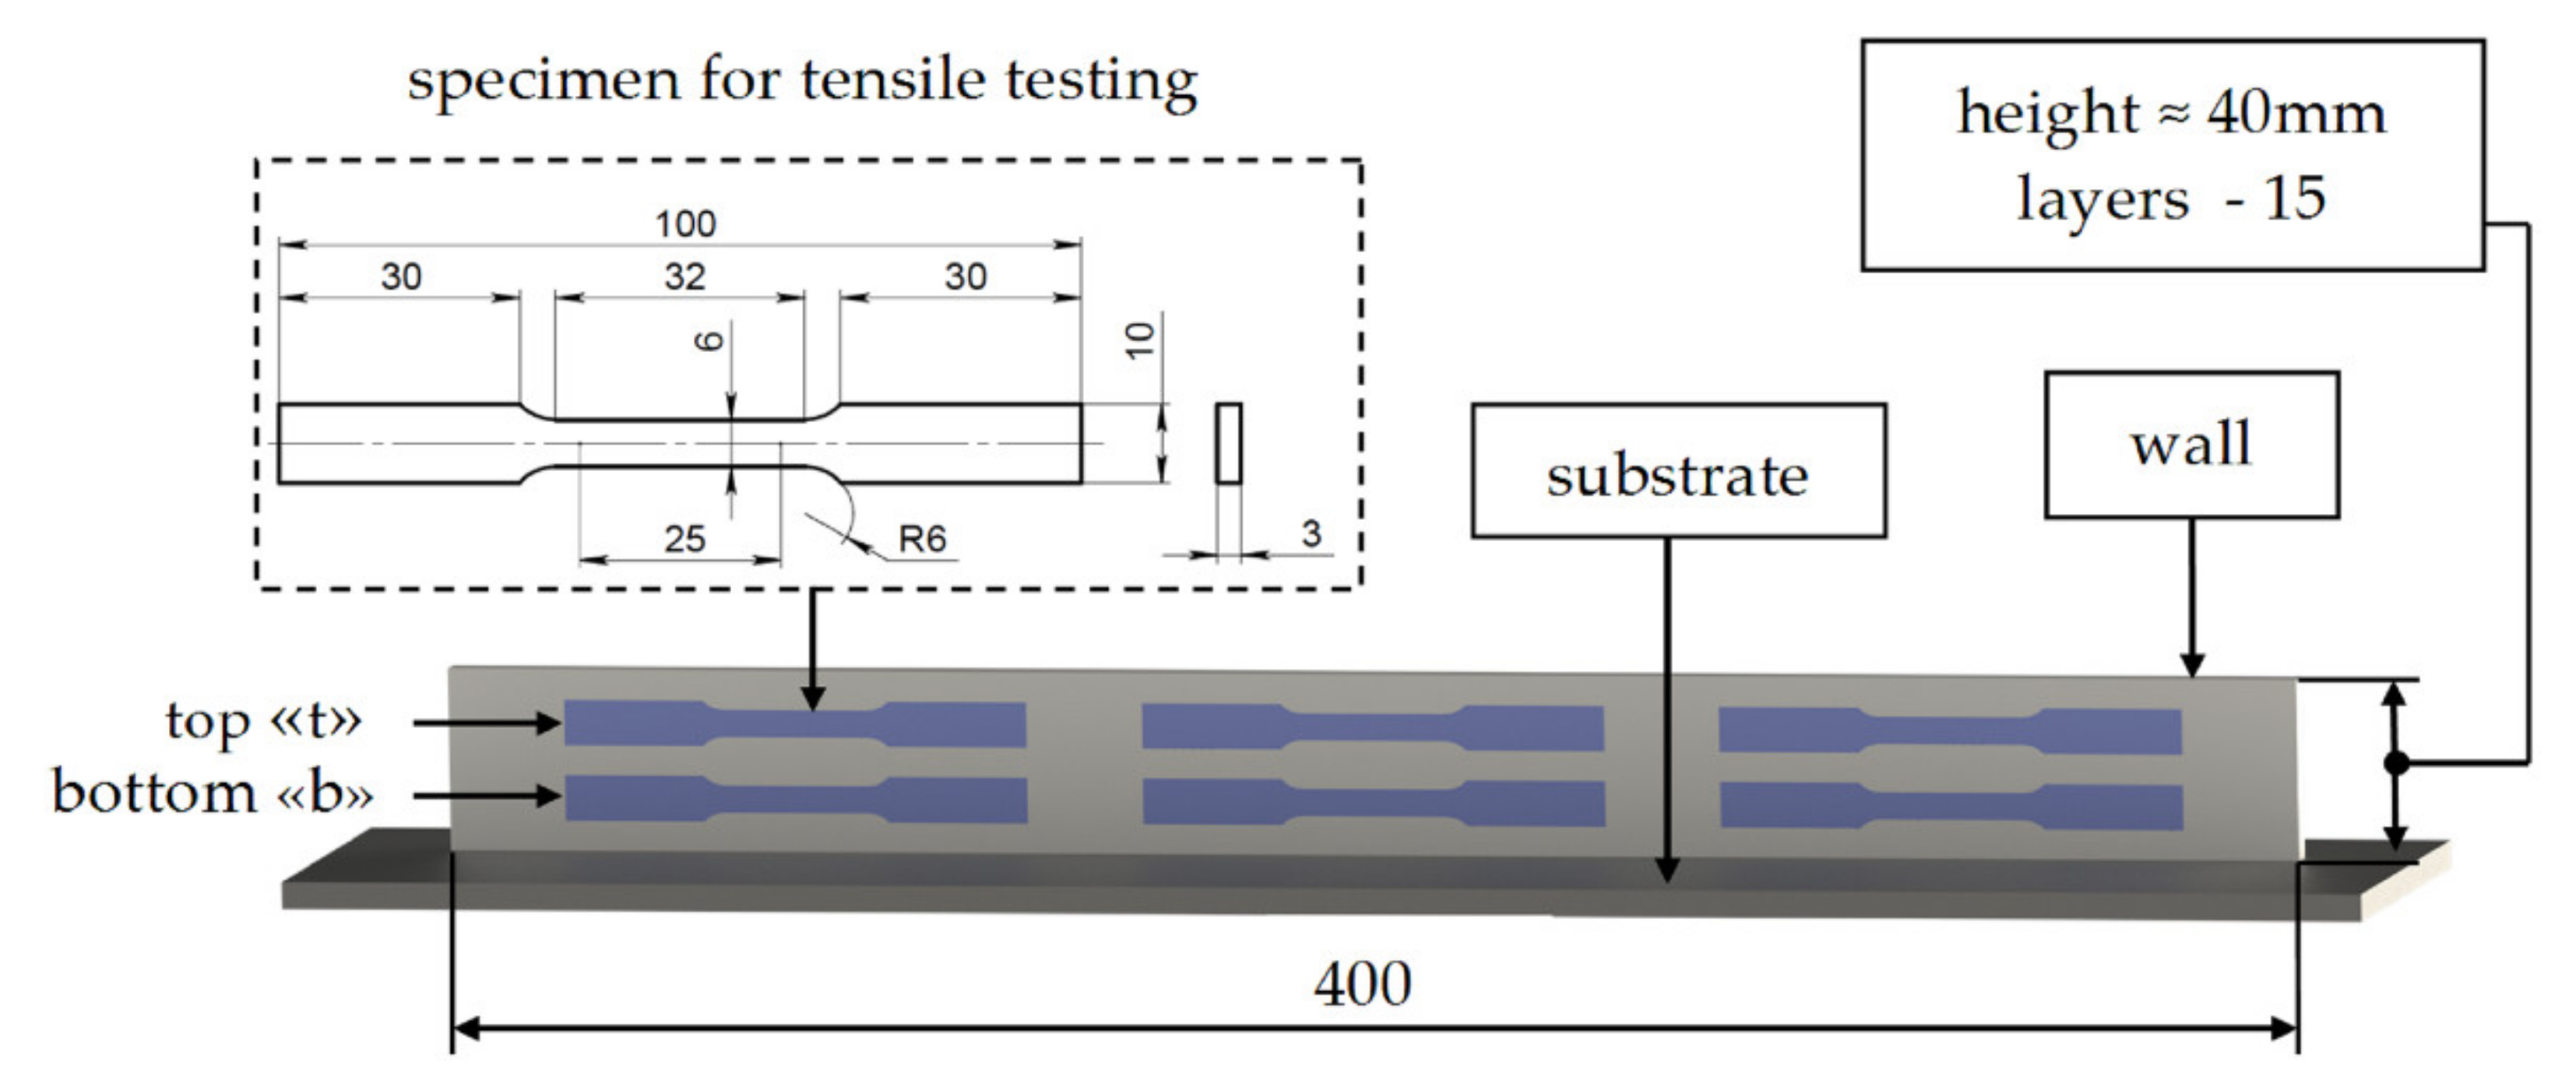
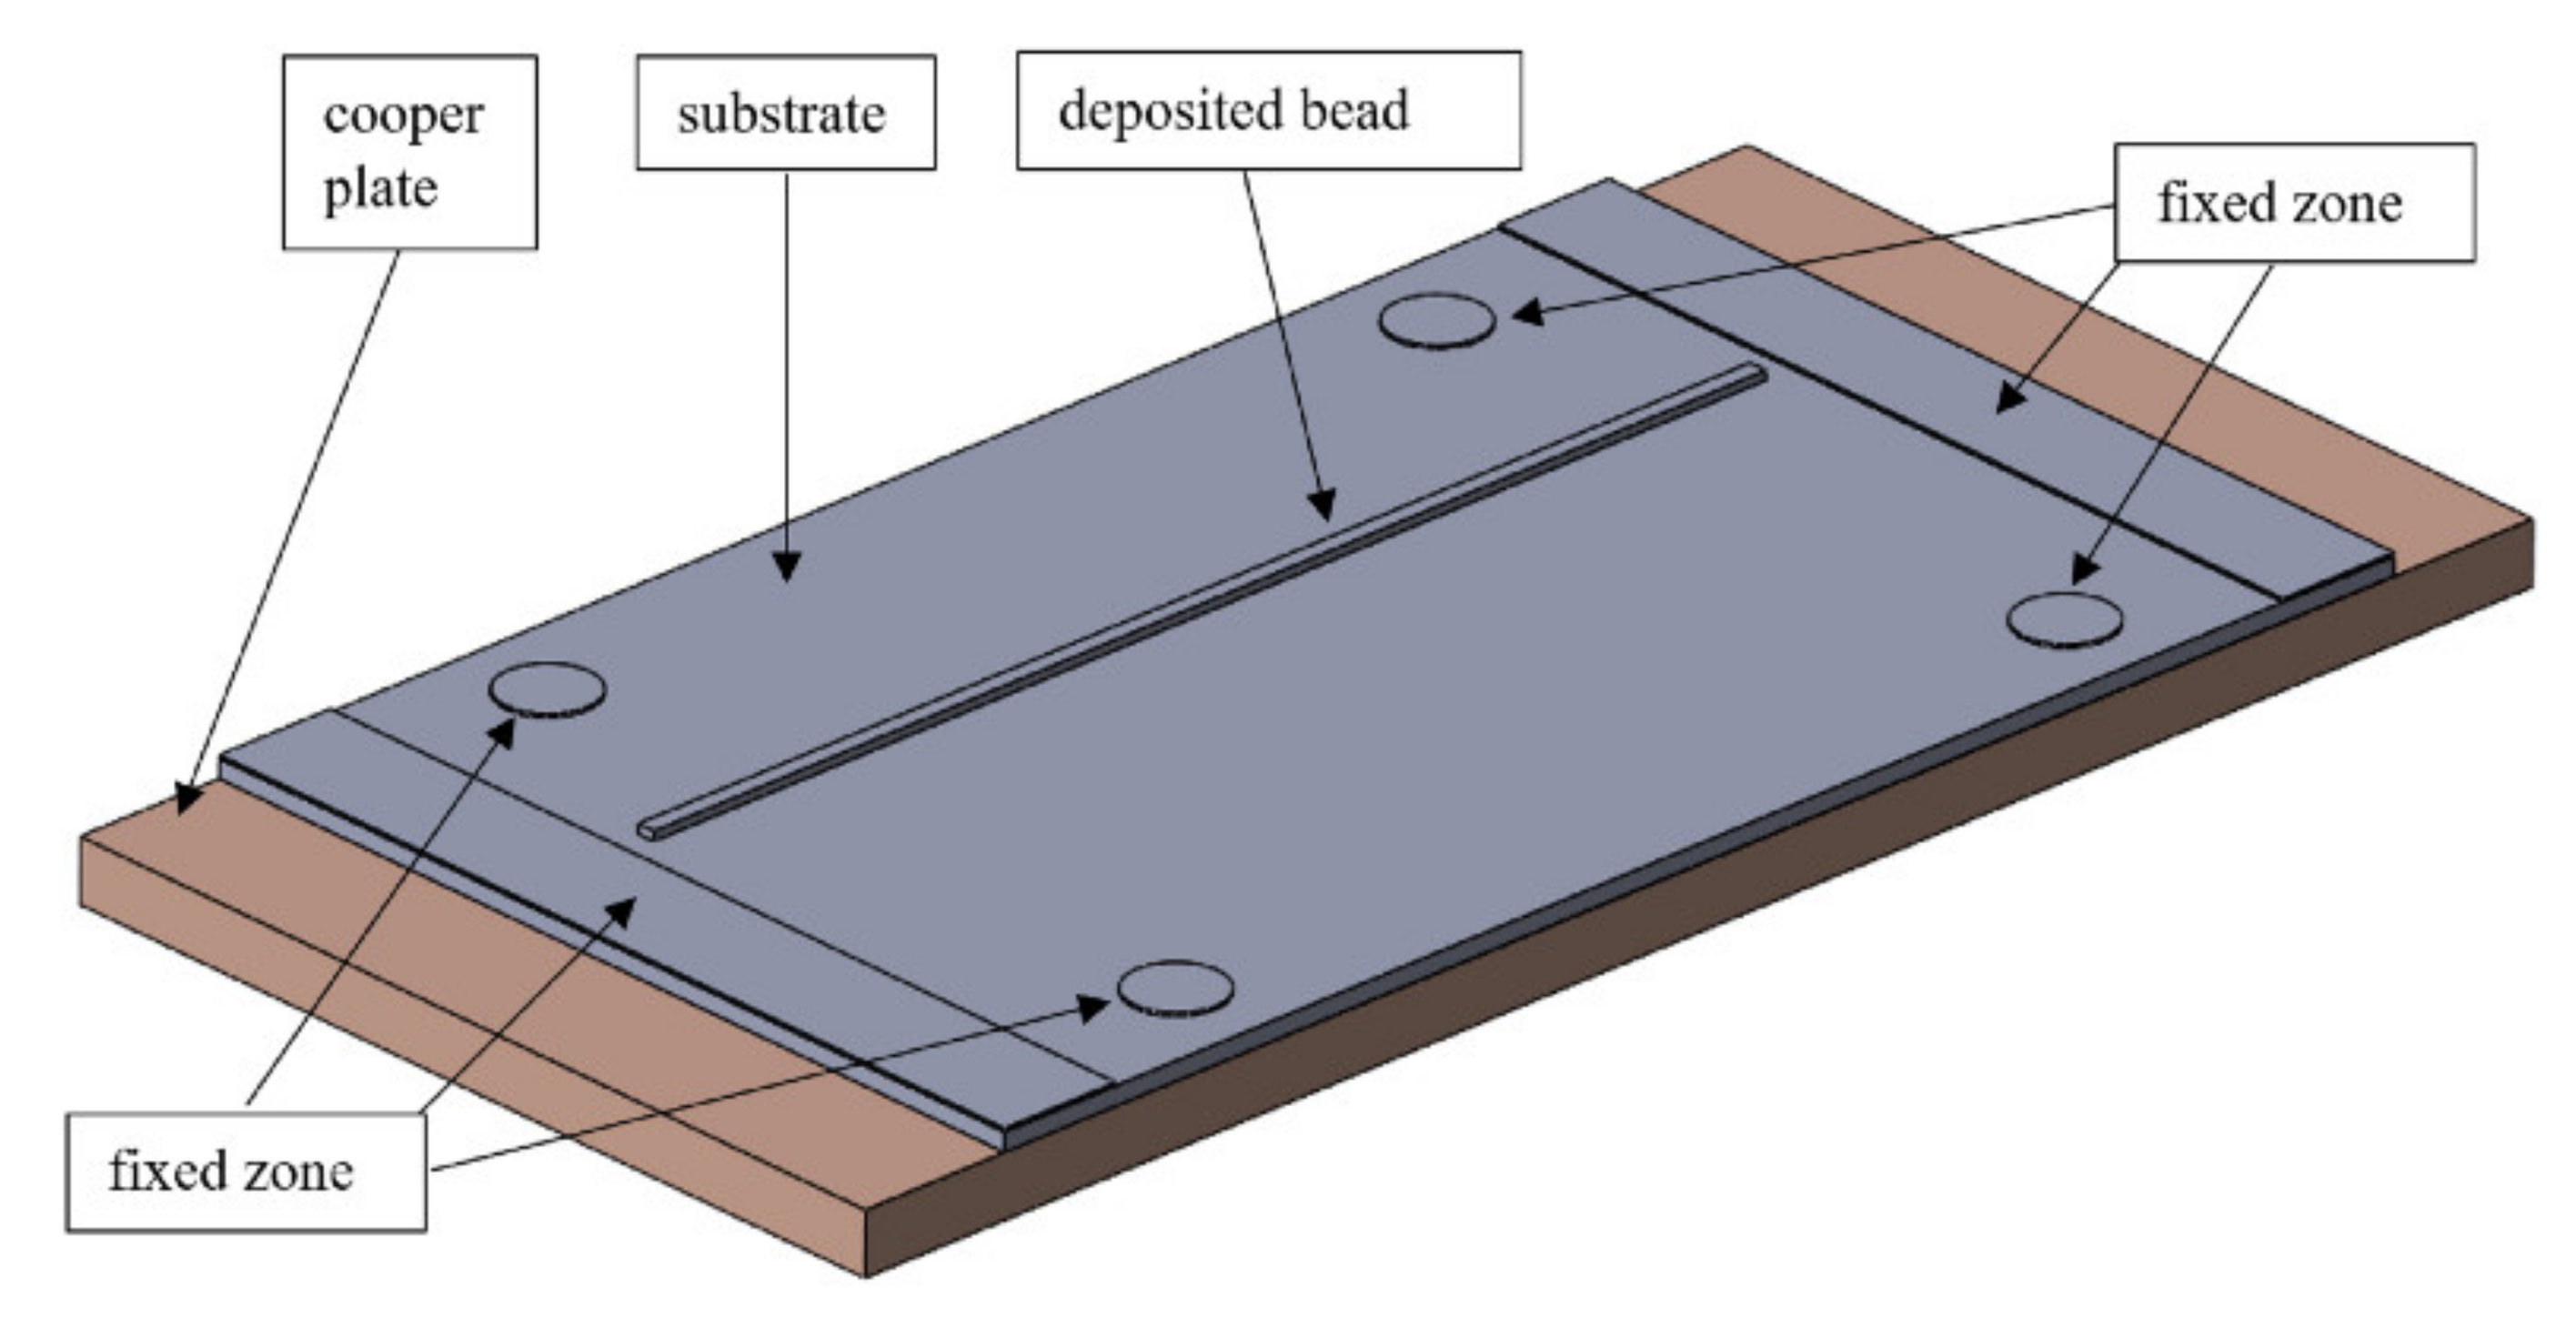
2. Materials and Methods
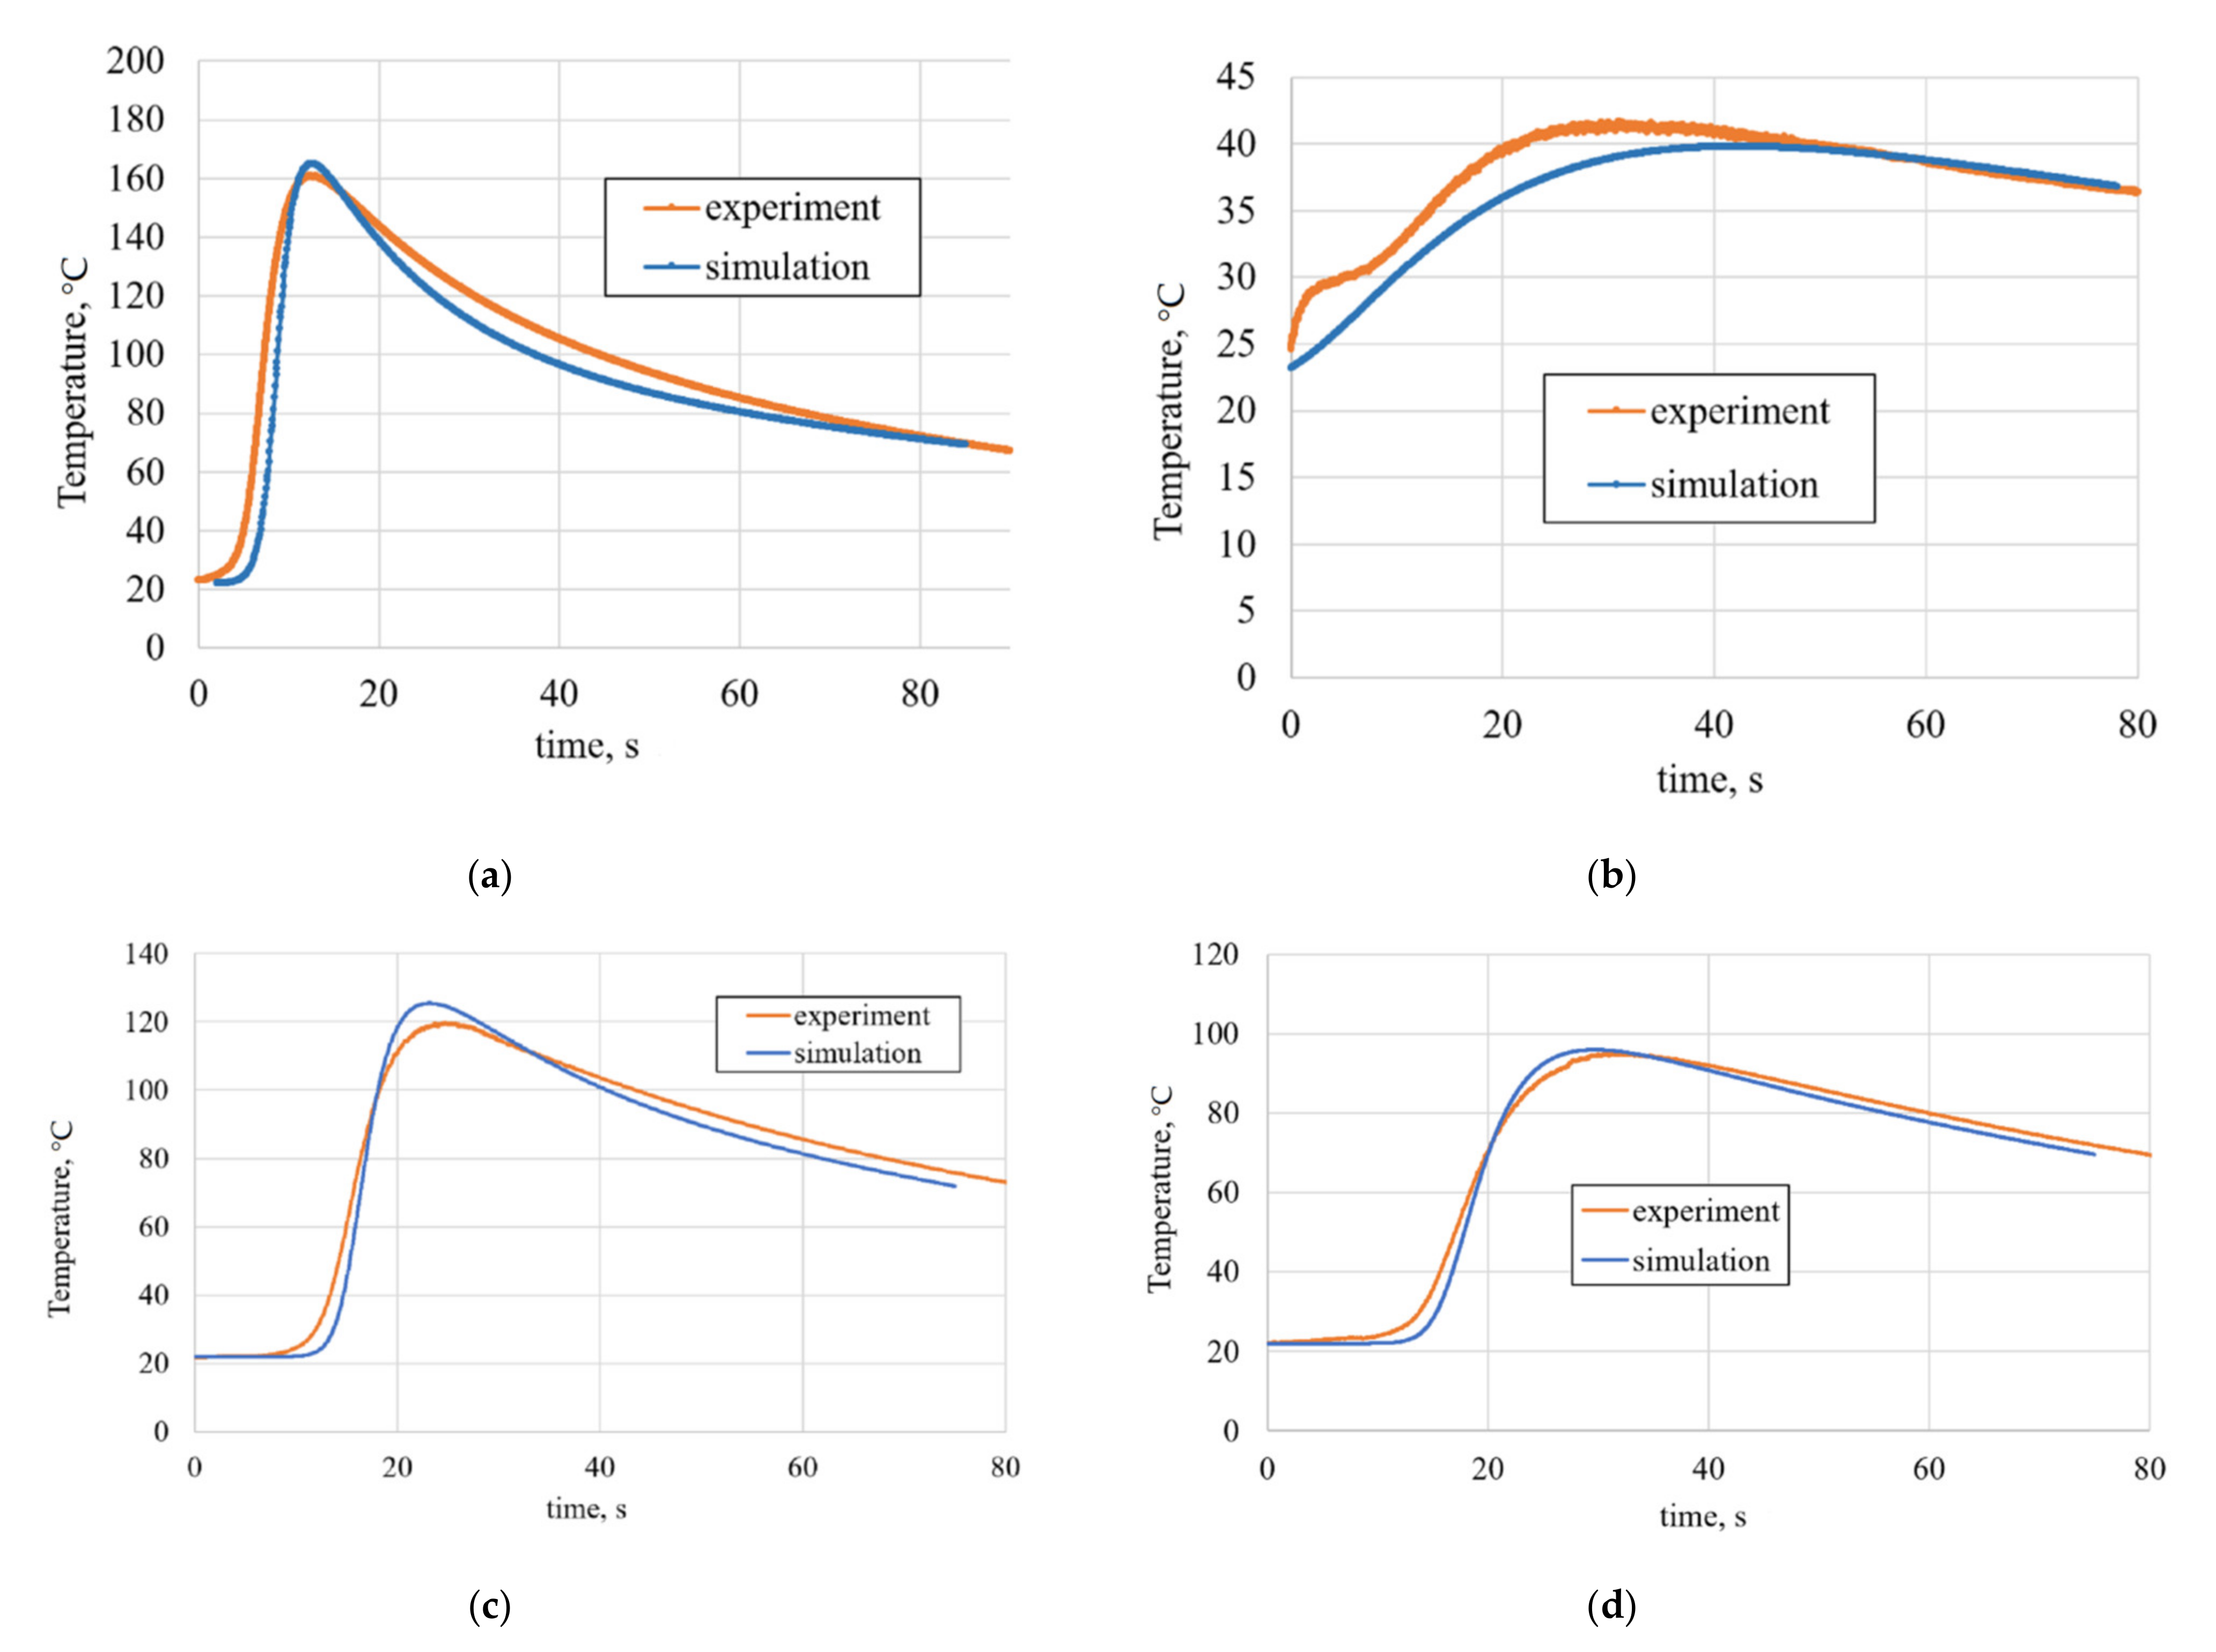
3. Results and Discussions
4. Conclusions
- The supersaturated solid solution, after deposition that is prone to further aging, can be obtained without additional conditions of cooling;
- The high yield strength of 268 MPa and ultimate strength of 403 MPa of WAAM 1575 alloy deposits were obtained. The welding wire, with a complex addition of scandium and zirconium, expands the application area of WAAM and makes it possible to manufacture large-sized aluminum products with high mechanical properties with all advantages inherent in this technology;
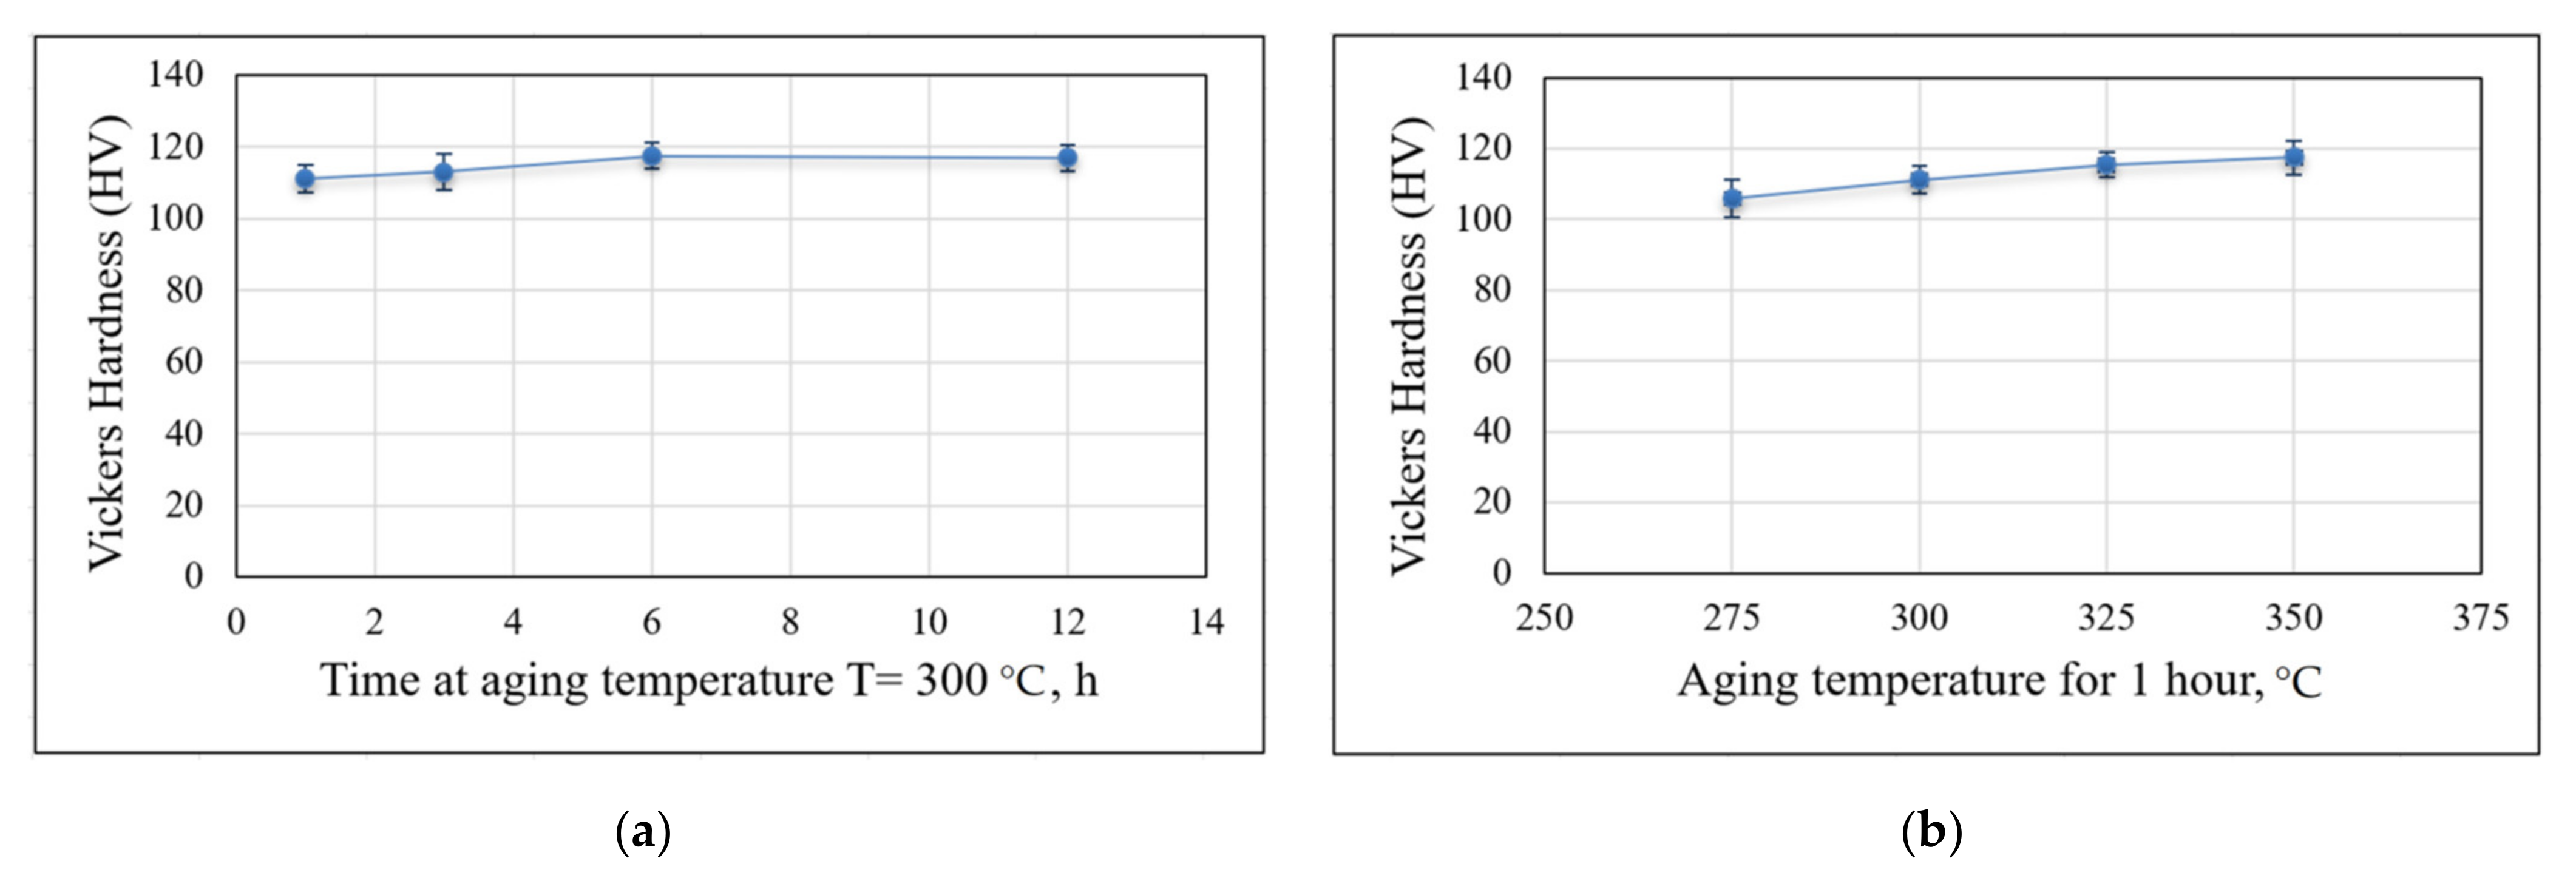
- The optimal heat treatment is aging at 300 °C for 1 h from the point of view of obtaining high strength properties, good plasticity, and minimum energy costs;
- Potentially, the mechanical properties can be increased by means of greater alloying and the achievement of a higher cooling rate at deposition.
Author Contributions
Funding
Institutional Review Board Statement
Informed Consent Statement
Data Availability Statement
Conflicts of Interest
References
- Manfredi, D.; Calignano, F.; Krishnan, M.; Canali, R.; Paola, E.; Biamino, S.; Ugues, D.; Pavese, M.; Fino, M.P.A.P. Additive Manufacturing of Al Alloys and Aluminium Matrix Composites (AMCs). In Light Metal Alloys Applications; Monteiro, W.A., Ed.; InTechOpen: London, UK, 2014; pp. 3–34. [Google Scholar] [CrossRef] [Green Version]
- Huang, K.; Chang, T.X.; Jing, Y.D.; Fang, X.W.; Lu, B.H. Additive manufacturing of magnesium alloys. In Additive and Subtractive Manufacturing, 1st ed.; Davim, J.P., Ed.; De Gruyter: Berlin, Germany, 2020; pp. 149–199. [Google Scholar] [CrossRef]
- Cordis.europa.eu. Available online: https://cordis.europa.eu/project/id/30953/reporting (accessed on 9 April 2021).
- Gu, J.; Ding, J.; Williams, S.W.; Gu, H.; Bai, J.; Zhai, Y.; Ma, P. The strengthening effect of inter-layer cold working and post-deposition heat treatment on the additively manufactured Al–6.3Cu alloy. Mater. Sci. Eng. A 2016, 651, 18–26. [Google Scholar] [CrossRef] [Green Version]
- Zhong, H.; Qi, B.; Cong, B.; Qi, Z.; Sun, H. Microstructure and Mechanical Properties of Wire + Arc Additively Manufactured 2050 Al–Li Alloy Wall Deposits. Chin. J. Mech. Eng. 2019, 32, 1–7. [Google Scholar] [CrossRef] [Green Version]
- Ren, L.; Gu, H.; Wang, W.; Wang, S.; Li, C.; Wang, Z.; Zhai, Y.; Ma, P. The Microstructure and Properties of an Al-Mg-0.3Sc Alloy Deposited by Wire Arc Additive Manufacturing. Metals 2020, 10, 320. [Google Scholar] [CrossRef] [Green Version]
- Zhang, C.; Li, Y.; Gao, M.; Zeng, X. Wire arc additive manufacturing of Al-6Mg alloy using variable polarity cold metal transfer arc as power source. Mater. Sci. Eng. A 2018, 711, 415–423. [Google Scholar] [CrossRef]
- Sales, A.; Ricketts, N.J. Effect of Scandium on Wire Arc Additive Manufacturing of 5 Series Aluminium Alloys. J. Light Met. 2019, 1455–1461. [Google Scholar] [CrossRef]
- Filatov, Y.; Yelagin, V.; Zakharov, V. New Al–Mg–Sc alloys. Mater. Sci. Eng. A 2000, 280, 97–101. [Google Scholar] [CrossRef]
- Lathabai, S.; Lloyd, P. The effect of scandium on the microstructure, mechanical properties and weldability of a cast Al–Mg alloy. Acta Mater. 2002, 50, 4275–4292. [Google Scholar] [CrossRef]
- Jiang, F.; Zhou, J.; Huang, H.; Qu, J. Characterisation of microstructure and mechanical properties in Al–Mg alloy with addition of Sc and Zr. Mater. Res. Innov. 2014, 18, S4-228–S4-234. [Google Scholar] [CrossRef]
- Babu, N.K.; Bhikanrao, P.Y.; Sivaprasad, K. Enhanced Mechanical Properties of AA5083 GTA Weldments with Current Pulsing and Addition of Scandium. Mater. Sci. Forum 2013, 765, 716–720. [Google Scholar] [CrossRef]
- Bronz, A.V.; Efremov, V.I.; Plotnikov, A.D.; Chernyavsky, A.G. Splav 1570S—Material dlya germetichnyh konstrukcij perspektivnyh mnogorazovyh izdelij «RKK Energiya» (Alloy 1570C-Material for pressurized structures of advanced reusable vehicles of RSC Energia). Kosm. Tekhnika Tekhnologii 2014, 14, 62–67. [Google Scholar]
- Zakharov, V.V. Effect of Scandium on the Structure and Properties of Aluminum Alloys. Met. Sci. Heat Treat. 2003, 45, 246–253. [Google Scholar] [CrossRef]
- Dorin, T.; Ramajayam, M.; Vahid, A.; Langan, T. Aluminium Scandium Alloys. In Fundamentals of Aluminium Metallurgy, 1st ed.; Lumley, R.N., Ed.; Woodhead Publishing: Cambridge, UK, 2018; pp. 439–494. [Google Scholar] [CrossRef]
- Fedorchuk, V.E.; Kushnareva, O.S.; Alekseenko, T.A.; Falchenko, Y.V. Osobennosti legirovaniya skandiem metalla shvov svarnyh soedinenij vysokoprochnyh alyuminievyh splavov (Features of scandium alloying of welded joints of high-strength aluminium alloys). Avtomat. Sv. 2014, 5, 30–34. [Google Scholar]
- Gorbunov, Y.A. Rol i perspektivy redkozemel’nyh metallov v razvitii fiziko-mekhanicheskih harakteristik i oblastej primeneniya deformiruemyh alyuminievyh splavov (The role and prospects of rare earth metals in the development of physical and mechanical characteristics and areas of application of wrought aluminium alloys). J. Sib. Fed. Univ. Tekhka Tekhii 2015, 8, 636–645. [Google Scholar] [CrossRef]
- Cherkasov, V.V.; Pobezhimov, P.P.; Nefedova, L.P. Osobennosti formirovaniya struktury i svojstv litejnyh Al–Mg-splavov, legirovannyh skandiem (Features of the formation of the structure and properties of cast Al-Mg alloys alloyed with scandium). Metall. Heat Treat. Met. 1996, 6, 30–32. [Google Scholar]
- Panchenko, O.; Kurushkin, D.; Mushnikov, I.; Khismatullin, A.; Popovich, A. A high-performance WAAM process for Al–Mg–Mn using controlled short-circuiting metal transfer at increased wire feed rate and increased travel speed. Mater. Des. 2020, 195, 109040. [Google Scholar] [CrossRef]
- Kisarev, A.V.; Kobernik, N.V. Study on formation of aluminum alloy thin wall produced with WAAM method under various thermal conditions. J. Phys. Conf. Ser. 2020, 759, 012014. [Google Scholar] [CrossRef]
- Goldak, J.; Chakravarti, A.; Bibby, M. A new finite element model for welding heat sources. Met. Mater. Trans. A 1984, 15, 299–305. [Google Scholar] [CrossRef]
- ASTM E8/E8M-16ae1, Standard Test Methods for Tension Testing of Metallic Materials; ASTM International: West Conshohocken, PA, USA, 2016. [CrossRef]
- Reznik, P.L. Vliyanie Parametrov Obrabotki na Strukturu i Mekhanicheskie Svojstva Slitkov i Polufabrikatov Alyuminievyh Splavov Sistem Al-Mg-Mn-Sc-Zr i Al-Cu-Mg-Si (Influence of Processing Parameters on the Structure and Mechanical Properties of Ingots and Semi-Finished Products of Aluminium Alloys of the Al-Mg-Mn-Sc-Zr and Al-Cu-Mg-Si Systems). Ph.D. Thesis, Ural Federal University, Yekaterinburg, Russia, 14 December 2017. [Google Scholar]
- Kou, S. Welding Metallurgy, 2nd ed.; John Wiley & Sons, Inc.: Hoboken, NJ, USA, 2003; ISBN 0-471-43491-4. [Google Scholar]
- Huang, X.; Pan, Q.; Li, B.; Liu, Z.; Huang, Z.; Yin, Z. Effect of minor Sc on microstructure and mechanical properties of Al–Zn–Mg–Zr alloy metal–inert gas welds. J. Alloys Compd. 2015, 629, 197–207. [Google Scholar] [CrossRef]
- Loginova, I.; Khalil, A.; Pozdniakov, A.; Solonin, A.; Zolotorevskiy, V. Effect of Pulse Laser Welding Parameters and Filler Metal on Microstructure and Mechanical Properties of Al-4.7Mg-0.32Mn-0.21Sc-0.1Zr Alloy. Metals 2017, 7, 564. [Google Scholar] [CrossRef] [Green Version]
- Malopheyev, S.; Mironov, S.; Kulitskiy, V.; Kaibyshev, R. Friction Stir Welding of an Al-Mg-Sc-Zr Alloy with Ultra-Fined Grained Structure. Mater. Sci. Forum 2014, 794–796, 365–370. [Google Scholar] [CrossRef]


| Alloy | Mg | Mn | Zr | Sc | Cr | Ti | Ni | Fe | Si | Cu | Al |
|---|---|---|---|---|---|---|---|---|---|---|---|
| Sv1575 | 5.82 | 0.42 | 0.19 | 0.23 | 0.051 | 0.028 | 0.013 | 0.12 | 0.05 | 0.058 | Balance |
| Al-6Mg (substrate) | 5.8–6.8 | 0.5–0.8 | - | - | - | 0.02–0.1 | - | 0.4 | 0.4 | 0.1 | Balance |
| Layer | Travel Speed, cm/min | Wire Feed Speed, m/min | Current, A | Arc Voltage, V | Pause Time between Layers, s |
|---|---|---|---|---|---|
| 1 | 48 | 8.5 | 125 | 14 | 20 |
| 2 | 60 | 8.8 | 127 | 15 | 60 |
| 3 | 45 | 5.5 | 78 | 11 | 180 |
| 4 | 45 | 5.5 | 79 | 12 | 180 |
| 5–15 | 48 | 5.5–5.6 | 78–79 | 11–12 | 180 |
| Parameter | Value |
|---|---|
| Rx, mm | 6 |
| Ry, mm | 7.5 |
| Q, W | 1750 |
| qmax, W/mm2 | 37.1 |
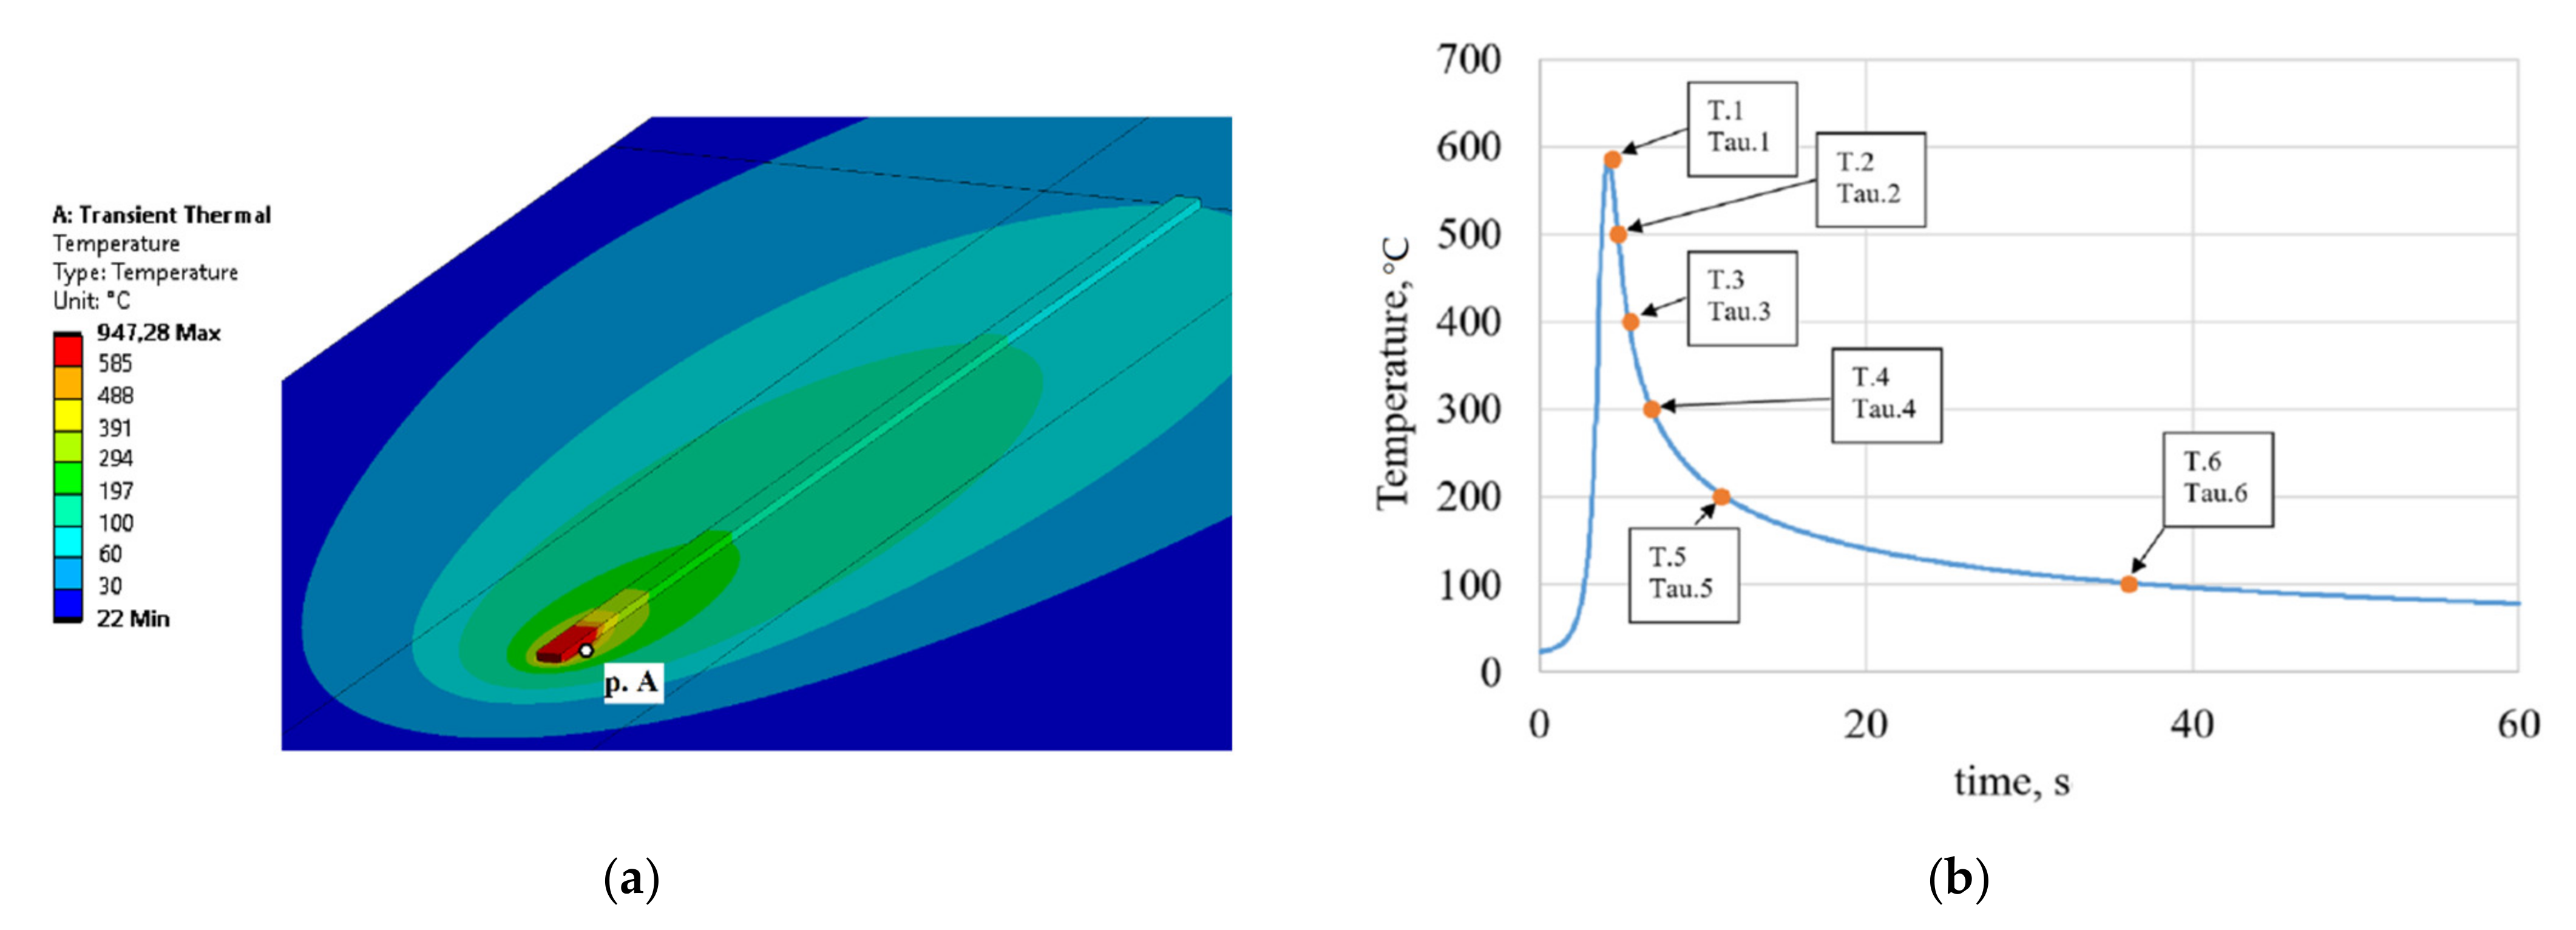
| № | Temperature, °C | Time, s | Average Cooling Rate, (ΔT/ΔTau) °C/s |
|---|---|---|---|
| 1 | T.1 = 585 | Tau.1 = 4.5 | 283.3 |
| T.2 = 500 | Tau.2 = 4.8 | ||
| 2 | T.1 = 585 | Tau.1 = 4.5 | 168.2 |
| T.3 = 400 | Tau.3 = 5.6 | ||
| 3 | T.1 = 585 | Tau.1 = 4.5 | 118.7 |
| T.4 = 300 | Tau.4 = 6.9 | ||
| 4 | T.1 = 585 | Tau.1 = 4.5 | 57.9 |
| T.5 = 200 | Tau.5 = 11.1 | ||
| 5 | T.1 = 585 | Tau.1 = 4.5 | 15.3 |
| T.6 = 100 | Tau.6 = 36.1 |
| Heat Treatment | Specimens Number | Values | UTS, MPa | YS, MPa | El, % |
|---|---|---|---|---|---|
| - | 8 | A 1 | 337 | 176 | 27 |
| SD 2 | 2.8 | 3.7 | 1.2 | ||
| CV 3 | 0.8% | 2.1% | 4.4% | ||
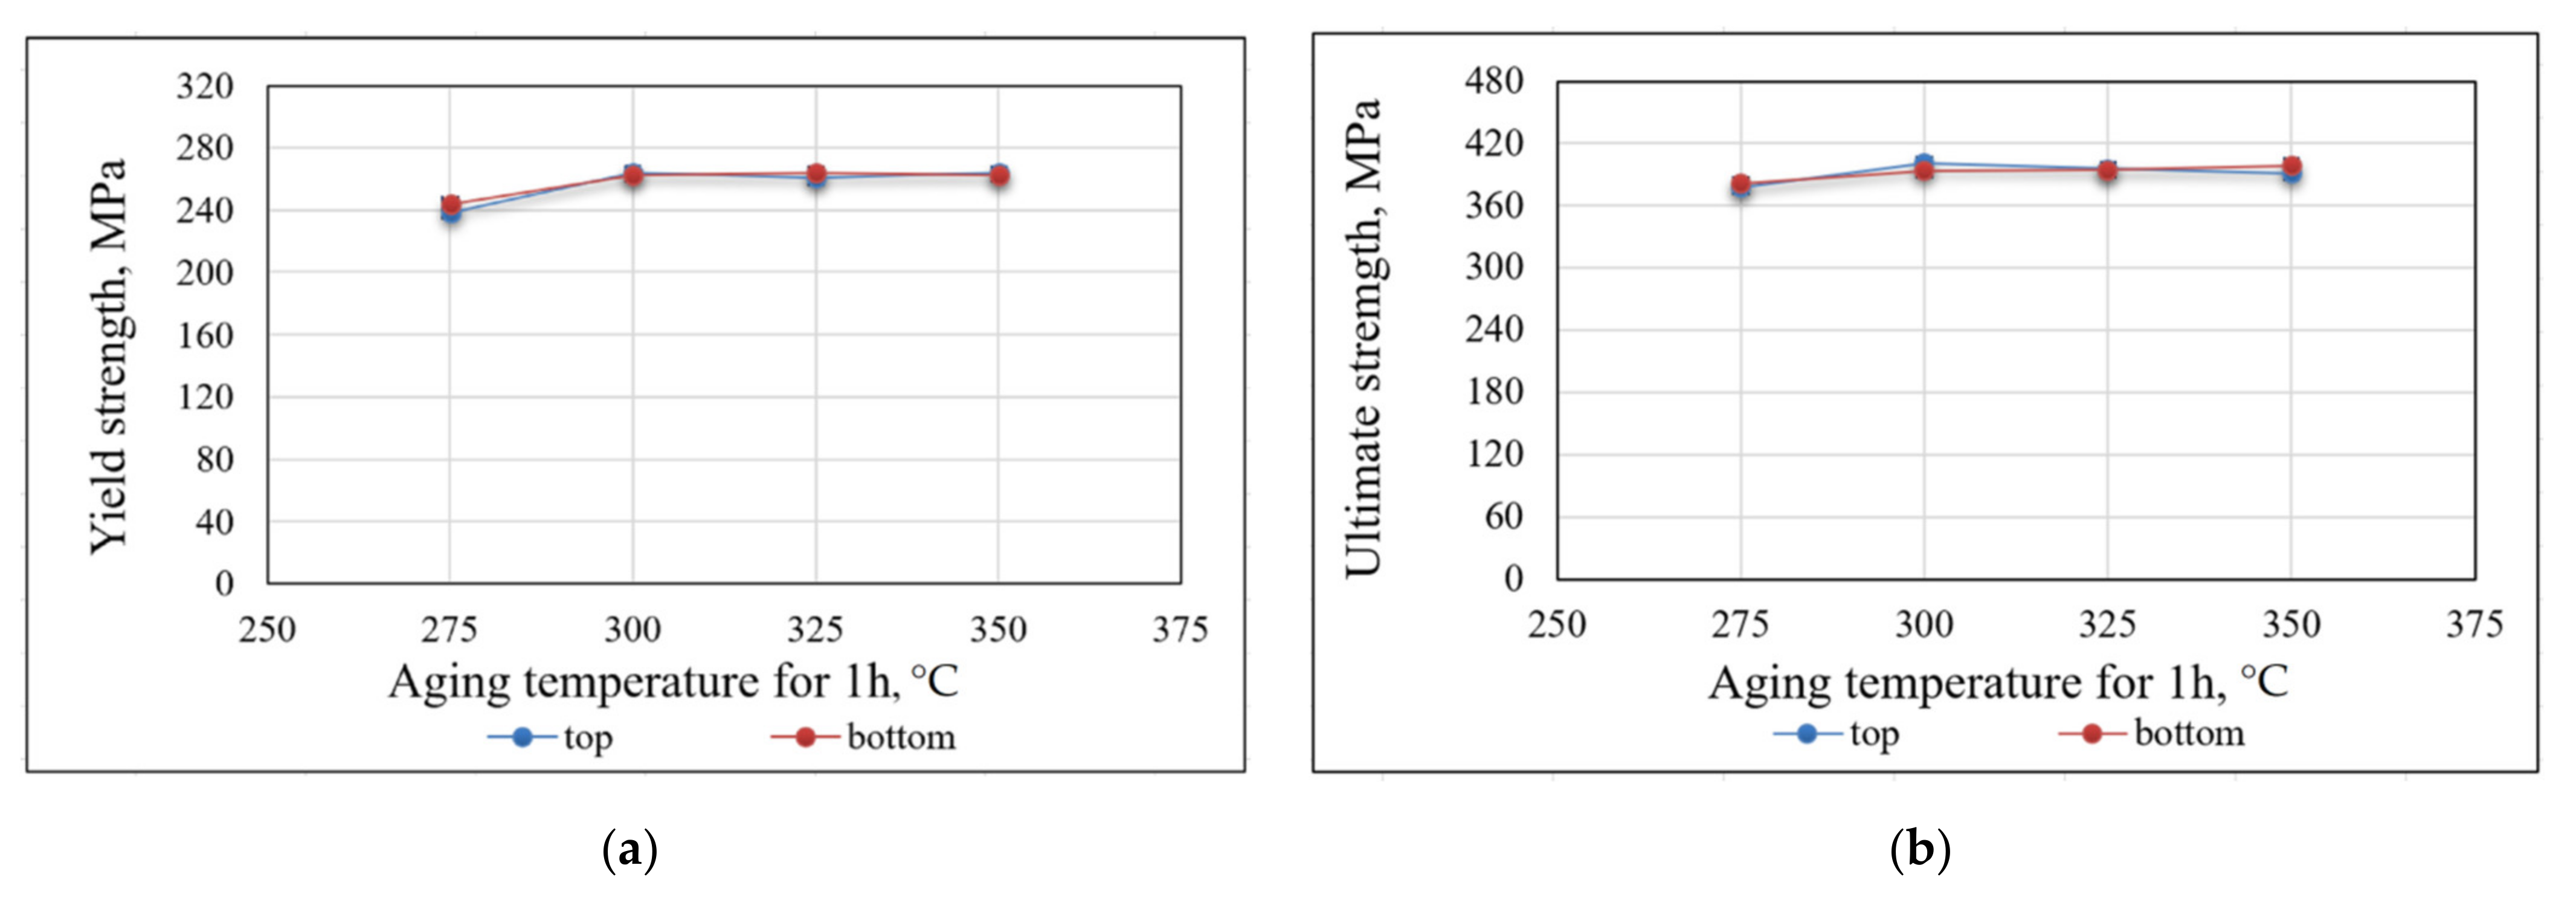
| 275 °C-1 h | 4 | A | 380 | 241 | 21 |
| SD | 2.8 | 3.3 | 1.3 | ||
| CV | 0.7% | 1.4% | 6.2% | ||
| 275 °C-3 h | 4 | A | 381 | 253 | 16 |
| SD | 8.1 | 1.9 | 3.7 | ||
| CV | 2.1% | 0.8% | 23.1% | ||
| 275 °C-6 h | 2 | A | 388 | 259 | 18 |
| SD | 3.3 | 3.7 | 2.4 | ||
| CV | 0.9% | 1.4% | 13.3% | ||
| 300° C-1 h | 4 | A | 397 | 263 | 20 |
| SD | 5.5 | 3.1 | 1.2 | ||
| CV | 1.4% | 1.2% | 6.0% | ||
| 300 °C-3 h | 4 | A | 398 | 265 | 20 |
| SD | 1.5 | 2.5 | 1.2 | ||
| CV | 0.4% | 0.9% | 6.0% | ||
| 300 °C-6 h | 3 | A | 401 | 268 | 20 |
| SD | 5.3 | 4.4 | 4.3 | ||
| CV | 1.3% | 1.6% | 21.5% | ||
| 300 °C-12 h | 3 | A | 403 | 268 | 20 |
| SD | 4.0 | 2.4 | 2.1 | ||
| CV | 1.0% | 0.9% | 10.5% | ||
| 325 °C-1 h | 4 | A | 395 | 262 | 19 |
| SD | 3.4 | 3.0 | 2.0 | ||
| CV | 0.9% | 1.1% | 10.5% | ||
| 325 °C-6 h | 2 | A | 402 | 261 | 22 |
| SD | 1.3 | 2.1 | 4.0 | ||
| CV | 0.3% | 0.8% | 18.2% | ||
| 350 °C-1 h | 4 | A | 395 | 255 | 24 |
| SD | 4.7 | 4.6 | 1.2 | ||
| CV | 1.2% | 1.8% | 5.0% |
| Aging Temperature, °C | Aging Time, h | Hardness, HV | Standard Deviation | Coefficient of Variation, % |
|---|---|---|---|---|
| - | 0 | 89 | 2.1 | 2.4 |
| 275 | 1 | 106 | 5.4 | 5.1 |
| 300 | 1 | 111 | 3.8 | 3.4 |
| 3 | 113 | 5.1 | 4.5 | |
| 6 | 118 | 3.7 | 3.1 | |
| 12 | 117 | 3.7 | 3.2 | |
| 325 | 1 | 115 | 3.6 | 3.1 |
| 350 | 1 | 118 | 4.8 | 4.1 |
| Alloy | Without Heat Treatment | Heat Treatment | With Heat Treatment | Reference | |||||
|---|---|---|---|---|---|---|---|---|---|
| UTS, MPa | YS, MPa | El, % | UTS, MPa | YS, MPa | El, % | ||||
| 5183 | +0.24 Sc | 321 | 161 | 25 | 300 °C-1 h | 335 | 214 | 19 | [8] |
| +0.41 Sc | 350 | 212 | 22 | 300 °C-5 h | 377 | 259 | 17 | ||
| +0.075 Sc | 268 | 119 | 22 | no data | 271 | 125 | 18 | ||
| +0.11 Zr | |||||||||
| +0.26 Sc | 306 | 161 | 18 | 312 | 169 | 22 | |||
| +0.1 Zr | |||||||||
| 5356 | +0.23 Sc | 323 | 179 | 21 | 337 | 196 | 24 | ||
| Sv1575 | +0.23 Sc +0.19 Zr | 337 | 176 | 27 | 300 °C-1 h | 397 | 263 | 20 | |
| 300 °C-6 h | 401 | 268 | 20 | this study | |||||
| 300 °C-12 h | 403 | 268 | 20 | ||||||
Publisher’s Note: MDPI stays neutral with regard to jurisdictional claims in published maps and institutional affiliations. |
© 2021 by the authors. Licensee MDPI, Basel, Switzerland. This article is an open access article distributed under the terms and conditions of the Creative Commons Attribution (CC BY) license (https://creativecommons.org/licenses/by/4.0/).
Share and Cite
Ponomareva, T.; Ponomarev, M.; Kisarev, A.; Ivanov, M. Wire Arc Additive Manufacturing of Al-Mg Alloy with the Addition of Scandium and Zirconium. Materials 2021, 14, 3665. https://doi.org/10.3390/ma14133665
Ponomareva T, Ponomarev M, Kisarev A, Ivanov M. Wire Arc Additive Manufacturing of Al-Mg Alloy with the Addition of Scandium and Zirconium. Materials. 2021; 14(13):3665. https://doi.org/10.3390/ma14133665
Chicago/Turabian StylePonomareva, Taisiya, Mikhail Ponomarev, Arseniy Kisarev, and Maxim Ivanov. 2021. "Wire Arc Additive Manufacturing of Al-Mg Alloy with the Addition of Scandium and Zirconium" Materials 14, no. 13: 3665. https://doi.org/10.3390/ma14133665
APA StylePonomareva, T., Ponomarev, M., Kisarev, A., & Ivanov, M. (2021). Wire Arc Additive Manufacturing of Al-Mg Alloy with the Addition of Scandium and Zirconium. Materials, 14(13), 3665. https://doi.org/10.3390/ma14133665