
Combining Raman Spectroscopy, DFT Calculations, and Atomic Force Microscopy in the Study of Clinker Materials


Abstract
:
1. Introduction
2. Experimental
2.1. Computational Details
2.2. Raman Spectroscopy of Clinker
3. Results and Discussion


4. Conclusions
Supplementary Materials
Author Contributions
Funding
Institutional Review Board Statement
Acknowledgments
Conflicts of Interest
References
- Đuroković, M. Chemical Resistance of Cement Paste to the Action of Deionized Water. Ph.D. Thesis, University of Zagreb, Zagreb, Croatia, 19 December 2019. [Google Scholar]
- Blezard, R.G. The history of calcareous cements. In Lea’s Chemistry of Cement and Concrete, 4th ed.; Hewlett, P.C., Ed.; Elsevier: Oxford, UK, 2005; pp. 1–23. [Google Scholar]
- The European Cement Association. Activity Report for 2017. Available online: https://cembureau.eu/media/vxyilmsd/activity-report-2017.pdf (accessed on 10 June 2021).
- Andrew, R.M. Global CO2 emissions from cement production. 1928–2018. Earth Syst. Sci. Data 2019. [Google Scholar] [CrossRef] [Green Version]
- Bogue, R.H. Calculation of the Compounds in Portland Cement. Ind. Eng. Chem. Anal. Ed. 1929, 1, 192–197. [Google Scholar] [CrossRef]
- Taylor, H.F.W. Cement Chemistry; Thomas Telford: London, UK, 1997. [Google Scholar]
- Maki, I.; Fukuda, K.; Yoshida, H.; Kumaki, J. Effect of MgO and SO3 on the Impurity Concentration in Alite in Portland Cement Clinker. J. Am. Ceram. Soc. 1992, 75, 3163–3165. [Google Scholar] [CrossRef]
- Maki, I.; Goto, K. Factors influencing the phase constitution of alite in portland cement clinker. Cem. Concr. Res. 1982, 12, 301–308. [Google Scholar] [CrossRef]
- Barnes, P.; Fentiman, C.H.; Jeffery, J.W. Structurally related dicalcium silicate phases. Acta Crystallogr. Sect. A 1980, 36, 353–356. [Google Scholar] [CrossRef]
- Barcelo, L.; Kline, J.; Walenta, G.; Gartner, E. Cement and carbon emissions. Mater. Struct. 2013, 47, 1055–1065. [Google Scholar] [CrossRef]
- Aranda, M.A.G.; Dela Torre, A.G. Sulfoaluminate cements. In Eco-Efficient Concrete; Pacheo-Torgal, F., Jalali, S., Labrinda, J., Eds.; Woodhead Publishing Limited: Cambridge, UK, 2013; pp. 488–522. [Google Scholar]
- Pellenq, R.J.-M.; Lequeux, N.; van Damme, H. Engineering the bonding scheme in C–S–H: The iono-covalent framework. Cem. Concr. Res. 2008, 38, 159–174. [Google Scholar] [CrossRef]
- Peled, A.; Castro, J.; Weiss, W. Atomic force and lateral force microscopy (AFM and LFM) examinations of cement and cement hydration products. Cem. Concr. Compos. 2013, 36, 48–55. [Google Scholar] [CrossRef]
- Torres-Carasco, M.; del Campo, A.; de la Rubia, M.A.; Reyes, E.; Moragues, A.; Fernáández, J.F. In situ full view of Portland cement hydration by confocal Raman microscopy. J. Raman Spectrosc. 2019, 50, 720–730. [Google Scholar] [CrossRef]
- Ortaboy, S.; Li, J.; Geng, G.; Myers, R.J.; Monteiro, P.J.M.; Maboudian, R.; Carraro, C. Effects of CO2 and temperature on the structure and chemistry of C-(A-)S-H investigated by Raman spectroscopy. RSC Adv. 2017, 7, 48925–48933. [Google Scholar] [CrossRef] [Green Version]
- Higl, J.; Köhler, M.; Lindén, M. Confocal Raman microscopy as a non-destructive tool to study microstructure of hydrating cementitious materials. Cem. Concr. Res. 2016, 88, 136–143. [Google Scholar] [CrossRef]
- Liu, F.; Sun, Z.; Qi, C. Raman spectroscopy study on the hydration behaviours of Portland cement pastes during setting. J. Mater. Civ. Eng. 2015, 27, 04014223. [Google Scholar] [CrossRef]
- Bullard, J. MicroChar: An application for quantitative analysis of cement and clinker microstructure images. In MicroChar: An Application for Quantitative Analysis of Cement and Clinker Microstructure Images; National Institute of Standards and Technology: Gaithersburg, MD, USA, 2015. [Google Scholar] [CrossRef]
- Thiery, V.; Slomianny, C.; Serris, E. From light and drawings to electrons and X-rays: A primer of Portland cement clinker microscopy. Microsc. Anal. 2016, 29, 17–22. [Google Scholar]
- Trtik, P.; Kaufmann, J.; Volz, U. On the use of peak-force tapping atomic force microscopy for quantification of the local elastic modulus in hardened cement paste. Cem. Concr. Res. 2012, 42, 215–221. [Google Scholar] [CrossRef]
- Lomboy, G.; Sundararajan, S.; Wang, K.; Subramaniam, S. A test method for determining adhesion forces and Hamaker constants of cementitious materials using atomic force microscopy. Cem. Concr. Res. 2011, 41, 1157–1166. [Google Scholar] [CrossRef]
- Dawson, P.; Hadfield, C.; Wilkinson, G. The polarized infra-red and Raman spectra of Mg(OH)2 and Ca(OH)2. J. Phys. Chem. Solids 1973, 34, 1217–1225. [Google Scholar] [CrossRef]
- Buchanan, R.A.; Caspers, H.H.; Murphy, J.; Buchanan, R.A.; Caspers, H.H.; Murphy, J. Lattice Vibration Spectra of Mg(OH)2 and Ca(OH)2. Appl. Opt. 1963, 2, 1147–1150. [Google Scholar] [CrossRef]
- Oehler, O.; Günthard, H.H. Ca(OH)2 and Ca(OD)2 vibrational crystal spectra, normal coordinate analysis, and assignment. J. Chem. Phys. 1968, 48, 2036–2045. [Google Scholar] [CrossRef]
- RRUF Mineral Database. Available online: https://rruff.info./portlandite/display=default/ (accessed on 29 June 2021).
- Voisin, M.; Mon, J.P. Spectre Raman de l’oxyde de calcium. Phys. Status Solidi B 1971, 48, K185–K187. [Google Scholar] [CrossRef]
- Rieder, K.H.; Weinstein, B.A.; Cardona, M.; Bilz, H. Measurement and Comparative Analysis of the Second-Order Raman Spectra of the Alkaline-Earth Oxides with a NaCl Structure. Phys. Rev. B 1973, 8, 4780–4786. [Google Scholar] [CrossRef]
- Martinez-Ramirez, S.; Sanchez-Cortes, S.; Garcia-Ramos, J.; Domingo, C.; Fortes, C.; Blanco-Varela, M.T. Micro-Raman spectroscopy applied to depth profiles of carbonates formed in lime mortar. Cem. Concr. Res. 2003, 33, 2063–2068. [Google Scholar] [CrossRef]
- López-Arce, P.; Gómez-Villalba, L.; Martinez-Ramirez, S.; Álvarez de Buergo, M.; Fort, R. Influence of relative humidity on the carbonation of calcium hydroxide nanoparticles and the formation of calcium carbonate polymorphs. Powder Technol. 2011, 205, 263–269. [Google Scholar] [CrossRef] [Green Version]
- Dubina, E.; Korat, L.; Black, L.; Strupi-Šuput, J.; Plank, J. Influence of water vapour and carbon dioxide on free lime during storage at 80 °C studied by Raman spectroscopy. Spectrochim. Acta Part A Mol. Biomol. Spectrosc. 2013, 111, 299–303. [Google Scholar] [CrossRef] [PubMed]
- Schmid, T.; Dariz, P. Shedding light onto the spectra of lime: Raman and luminescence bands of CaO, Ca(OH)2 and CaCO2. J. Raman Spectrosc. 2015, 46, 141–146. [Google Scholar] [CrossRef]
- Kaszowska, Z.; Malek, K.; Staniszewska-Slezak, E.; Niedzielska, K. Raman scattering of fluorescence emission? Raman spectroscopy study on lime. Spectrochim. Acta Part A Mol. Biomol. Spectrosc. 2016, 169, 7–15. [Google Scholar] [CrossRef]
- Martínez-Ramírez, S.; Fernández-Carrasco, L. Raman spectroscopy: Application to cementitious systems. In Construction and Building: Design, Materials and Techniques; Doyle, S.G., Ed.; Nova Science Publishers, Inc.: New York, NY, USA, 2011; pp. 233–244. [Google Scholar]
- Bensted, J. Uses of Raman Spectroscopy in Cement Chemistry. J. Am. Ceram. Soc. 1976, 59, 140–143. [Google Scholar] [CrossRef]
- Bensted, J. Raman spectral studies of carbonation phenomena. Cem. Concr. Res. 1977, 7, 161–164. [Google Scholar] [CrossRef]
- Krishnamurthy, N.; Soots, V. Raman Spectrum of Gypsum. Can. J. Phys. 1971, 49, 885–896. [Google Scholar] [CrossRef]
- Conjeaud, M.; Boyer, H. Some possibilities of Raman microprobe in cement chemistry. Cem. Concr. Res. 1980, 10, 61–70. [Google Scholar] [CrossRef]
- Handke, M. Vibrational Spectra, Force Constants, and Si-O Bond Character in Calcium Silicate Crystal Structure. Appl. Spectrosc. 1986, 40, 871–877. [Google Scholar] [CrossRef]
- Ibáñez-Insa, J.; Artús, L.; Cuscó, R.; López, Á.; Menéndez, E.; Andrade, M.C. Hydration and carbonation of monoclinic C2S and C3S studied by Raman spectroscopy. J. Raman Spectrosc. 2006, 38, 61–67. [Google Scholar] [CrossRef]
- Garg, N.; Wang, K. Applying Raman spectroscopy for studying cement-based materials. In Microstructural-Related Durability of Cementitious Composites; Ye, G., Van Breugel, K., Sun, W., Miao, C., Eds.; RILEM Publications SARL: Amsterdam, The Netherlands, 2012; pp. 275–282. [Google Scholar]
- Dyer, C.D.; Hendra, P.J.; Forsling, W. The Raman spectroscopy of cement minerals under 1064 nm excitation. Spectrochim. Acta Part A Mol. Spectrosc. 1993, 49, 715–722. [Google Scholar] [CrossRef]
- Bonen, D.; Johnson, T.; Sarkar, S. Characterization of principal clinker minerals by FT-Raman microspectroscopy. Cem. Concr. Res. 1994, 24, 959–965. [Google Scholar] [CrossRef]
- Aminzadeh, A. Fluorescence bands in the FT-Raman spectra of some calcium minerals. Spectrochim. Acta Part A Mol. Biomol. Spectrosc. 1997, 53, 693–697. [Google Scholar] [CrossRef]
- Newman, S.P.; Clifford, S.J.; Coveney, P.V.; Gupta, V.; Blanchard, J.D.; Serafin, F.; Ben-Amotz, R.; Diamond, S. Anomalous fluorescence in near-infrared Raman spectroscopy of cementitious materials. Cem. Concr. Res. 2005, 35, 1620–1628. [Google Scholar] [CrossRef]
- Schootmans, E.M.J.; Wilson, A.J.; Brettell, R.; Munshi, T.; Edwards, H.G.M. Raman spectroscopy as a non-destructive screen technique for studying white substances from archeological and forensic burial contexts. J. Raman Sectrosc. 2014, 45, 1301–1308. [Google Scholar] [CrossRef] [Green Version]
- Potgieter-Vermaak, S.; Potgieter, J.H.; Van Grieken, R. The application of Raman spectrometry to investigate and characterize cement, Part I: A review. Cem. Concr. Res. 2006, 36, 656–662. [Google Scholar] [CrossRef]
- Skibsted, J.; Hall, C. Characterization of cement minerals, cements and their reaction products at the atomic and nano scale. Cem. Concr. Res. 2008, 38, 205–225. [Google Scholar] [CrossRef]
- Black, L. Raman spectroscopy of cementitious materials. Spectrosc. Prop. Inorg. Organomet. Compd. 2009, 40, 72–127. [Google Scholar] [CrossRef]
- Jost, K.H.; Ziemer, B.; Seydel, R. Redetermination of the structure of β-dicalcium silicate. Acta Crystallogr. Sect. B Struct. Crystallogr. Cryst. Chem. 1977, 33, 1696–1700. [Google Scholar] [CrossRef] [Green Version]
- De Noirfontaine, M.-N.; Dunstetter, F.; Courtial, M.; Gasecki, G.; Signes-Frehel, M. Polymorphism of tricalcium silicate, the major compound of Portland cement clinker: Modelling alite for Rietveld analysis, an industrial challenge. Cem. Concr. Res. 2006, 36, 54–64. [Google Scholar] [CrossRef]
- Dunstetter, F.; de Noirfontaine, M.-N.; Courtial, M. Polymorphism of tricalcium silicate, the major compound of Portland cement clinker: Structural data: Review and unified analysis. Cem. Concr. Res. 2006, 36, 39–53. [Google Scholar] [CrossRef]
- Courtial, M.; De Noirfontaine, M.-N.; Dunstetter, F.; Gasecki, G.; Signes-Frehel, M. Polymorphism of tricalcium silicate in Portland cement: A fast visual identification of structure and superstructure. Powder Diffr. 2003, 18, 7–15. [Google Scholar] [CrossRef] [Green Version]
- Dovesi, R.; Orlando, R.; Civalleri, B.; Roetti, C.; Saunders, V.R.; Zicovich-Wilson, C. CRYSTAL: A computational tool for the ab initio study of the electronic properties of crystals. Z. Krist. Cryst. Mater. 2005, 220, 571–573. [Google Scholar] [CrossRef]
- Valenzano, L.; Torres, F.J.; Doll, K.; Pascale, F.; Zicovich-Wilson, C.M.; Dovesi, R. Ab Initio Study of the Vibrational Spectrum and Related Properties of Crystalline Compounds; the Case of CaCO3 Calcite. Z. Phys. Chem. 2006, 220, 893–912. [Google Scholar] [CrossRef]
- Pascale, F.; Zicovich-Wilson, C.; Orlando, R.; Roetti, C.; Ugliengo, P.; Dovesi, R. Vibration Frequencies of Mg3Al2Si3O12 Pyrope. An ab Initio Study with the CRYSTAL Code. J. Phys. Chem. B 2005, 109, 6146–6152. [Google Scholar] [CrossRef] [PubMed]
- Noel, Y.; Catti, M.; D’Arco, P.; Dovesi, R. The vibrational frequencies of forsterite Mg2SiO4: An all-electron ab initio study with the CRYSTAL code. Phys. Chem. Miner. 2006, 33, 383–393. [Google Scholar] [CrossRef]
- Vosko, S.H.; Wilk, L.; Nusair, M. Accurate spin-dependent electron liquid correlation energies for local spin density calculations: A critical analysis. Can. J. Phys. 1980, 58, 1200–1211. [Google Scholar] [CrossRef] [Green Version]
- Dirac, P.A.M. Note on the Exchange in Thomas Atom. Proc. Camb. Philos. Soc. 1930, 26, 376–385. [Google Scholar] [CrossRef] [Green Version]
- Mitchell, R.S. Note on a single-crystal x-ray study of calcium hydroxide. Z. Krist. 1966, 123, 272–273. [Google Scholar] [CrossRef]
- Baranek, P.; Lichanot, A.; Orlando, R.; Dovesi, R. Structural and vibrational properties of solid Mg(OH)2 and Ca(OH)2—Performances of various hamiltonians. Chem. Phys. Lett. 2001, 340, 362–369. [Google Scholar] [CrossRef]
- Perdew, J.P.; Wang, J. Accurate and simple density functional for the electronic exchange energy: Generalized gradient approximation. Phys. Rev. B 1986, 33, 8800–8802. [Google Scholar] [CrossRef] [PubMed]
- Perdew, J.P.; Wang, Y. ERRATUM—Accurate and simple density functional for the electronic exchange energy: Generalized gradient approximation. Phys. Rev. B 1989, 40, 3399. [Google Scholar] [CrossRef]
- Perdew, J.P.; Wang, Y. Accurate and simple analytic representation of the electron-gas correlation energy. Phys. Rev. B 1992, 45, 13244–13249. [Google Scholar] [CrossRef]
- Perdew, J.P. Electronic structure of solids ’91. In Proceedings of the 75 WE-Heraeus-Seminar and 21st Annual International Symposium on Electronic Structure of Solids, Gaussig, Germany, 11–15 March 1991; Akademie Verlag: Berlin, Germany, 1991; p. 11. [Google Scholar]
- Becke, A.D. Density-functional thermochemistry. III. The role of exact exchange. J. Chem. Phys. 1993, 98, 5648–5652. [Google Scholar] [CrossRef] [Green Version]
- Lee, C.; Yang, W.; Parr, R.G. Development of the Colle-Salvetti correlation-energy formula into a functional of the electron density. Phys. Rev. B 1988, 37, 785–789. [Google Scholar] [CrossRef] [Green Version]
- Manzano, H.; Pellenq, R.J.M.; Ulm, F.-J.; Beuhler, M.J.; Van Duin, A.C.T. Hydration ofcalcium oxide surface predicted by reactive force field molecular dynamics. Langmuir 2012, 28, 4187–4197. [Google Scholar] [CrossRef]
- Perdew, J.P.; Burke, K.; Ernzerhof, M. Generalized gradient approximation made simple. Phys. Rev. Lett. 1996, 77, 3865–3868. [Google Scholar] [CrossRef] [Green Version]
- Nishi, F.; Takeuchi, Y.; Maki, I. Tricalcium Silicate Ca3O[SIO4]: The monoclinic superstructure. Z. Krist. Cryst. Mater. 1985, 172, 297–314. [Google Scholar] [CrossRef]
- CRYSPLOT Website. Available online: http://crysplot.crystalsolutions.eu/web_pages_yves3/vibration.html (accessed on 10 June 2021).
- Tlili, M.M.; Ben Amor, M.; Gabrielli, C.; Joiret, S.; Maurin, G.; Rousseau, P. Characterization of CaCO3 hydrates by micro-Raman spectroscopy. J. Raman Spectrosc. 2002, 33, 10–16. [Google Scholar] [CrossRef]
- Ren, X.; Zhang, W.; Ye, J. FTIR study on the polymorphic structure of tricalcium silicate. Cem. Concr. Res. 2017, 99, 129–136. [Google Scholar] [CrossRef]

| Properties | Clinker 217 % Mass | Calcium Sulfoaluminate Cement % Mass |
|---|---|---|
| Loss on ignition | 0.25 | 0.92 |
| Sulfate content, SO3 | 1.72 | 11.49 |
| Insoluble residue in HCl i Na2CO3 | 0.50 | 2.54 |
| Insoluble residue in HCl i KOH | 0.55 | 1.96 |
| Sulfide content, S2− | 0.02 | 0.00 |
| Manganese oxide content, MnO | 0.14 | 0.157 |
| Total silica content SiO2 | 20.24 | 9.12 |
| Iron (III) oxide content, Fe2O3 | 2.89 | 1.61 |
| Aluminium oxide content, Al2O3 | 4.56 | 32.82 |
| Calcium oxide content, CaO (13.14) | 65.50 | 40.08 |
| Magnesium oxide content MgO (13.15) | 2.17 | 4.66 |
| Chloride content, Cl− | 0.014 | 0.188 |
| Sodium oxide content, Na2O | 0.26 | 0.48 |
| Potassium oxide content, K2O | 1.07 | 0.71 |
| Sodium oxide equivalent, Na2O | 0.96 | 1.03 |
| Carbon dioxide content, CO2 | 0.00 | 0.22 |
| Phonon Symmetry | Calculated, This Work (CRYSTAL09) | Observed (Dawson et al. [22]) |
|---|---|---|
| A2u | 3662 | 3640 |
| A1g | 3626 | 3620 |
| Eg | 721 | 680 |
| Eu | 377 | 373 |
| A1g | 374 | 357 |
| A2u | 369 | 334 |
| Eu | 309 | 287 |
| Eg | 265 | 252 |
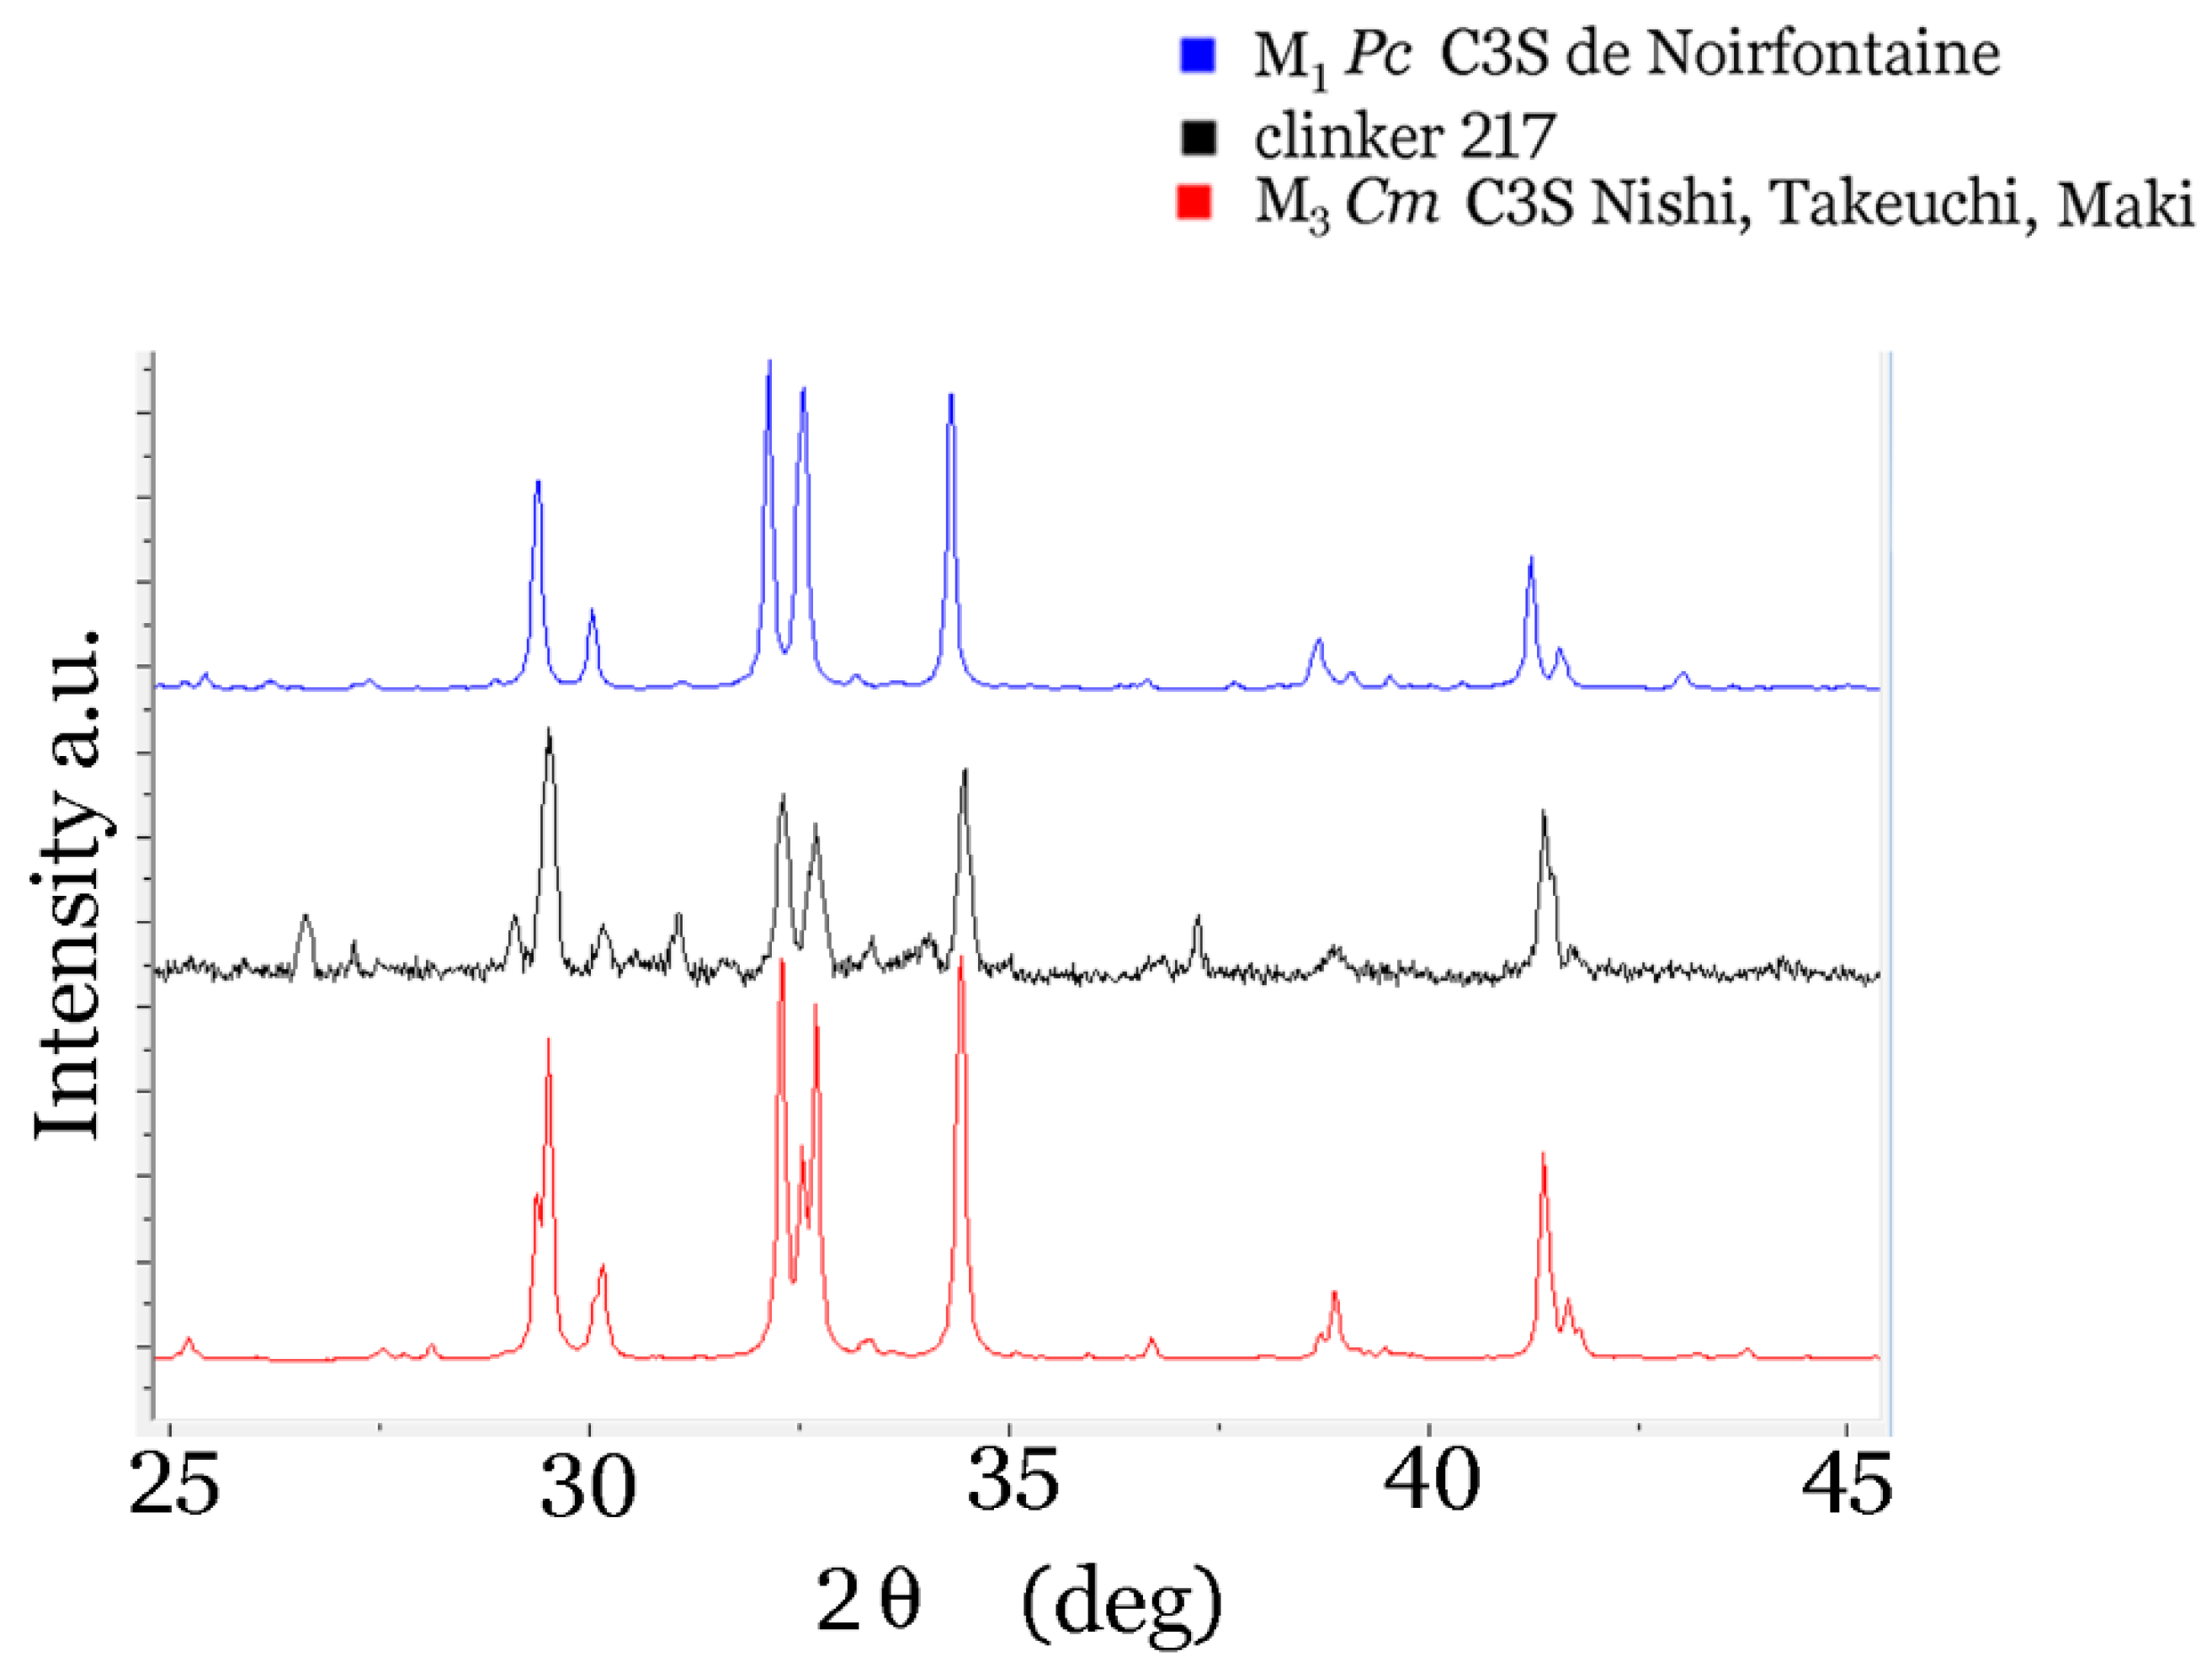
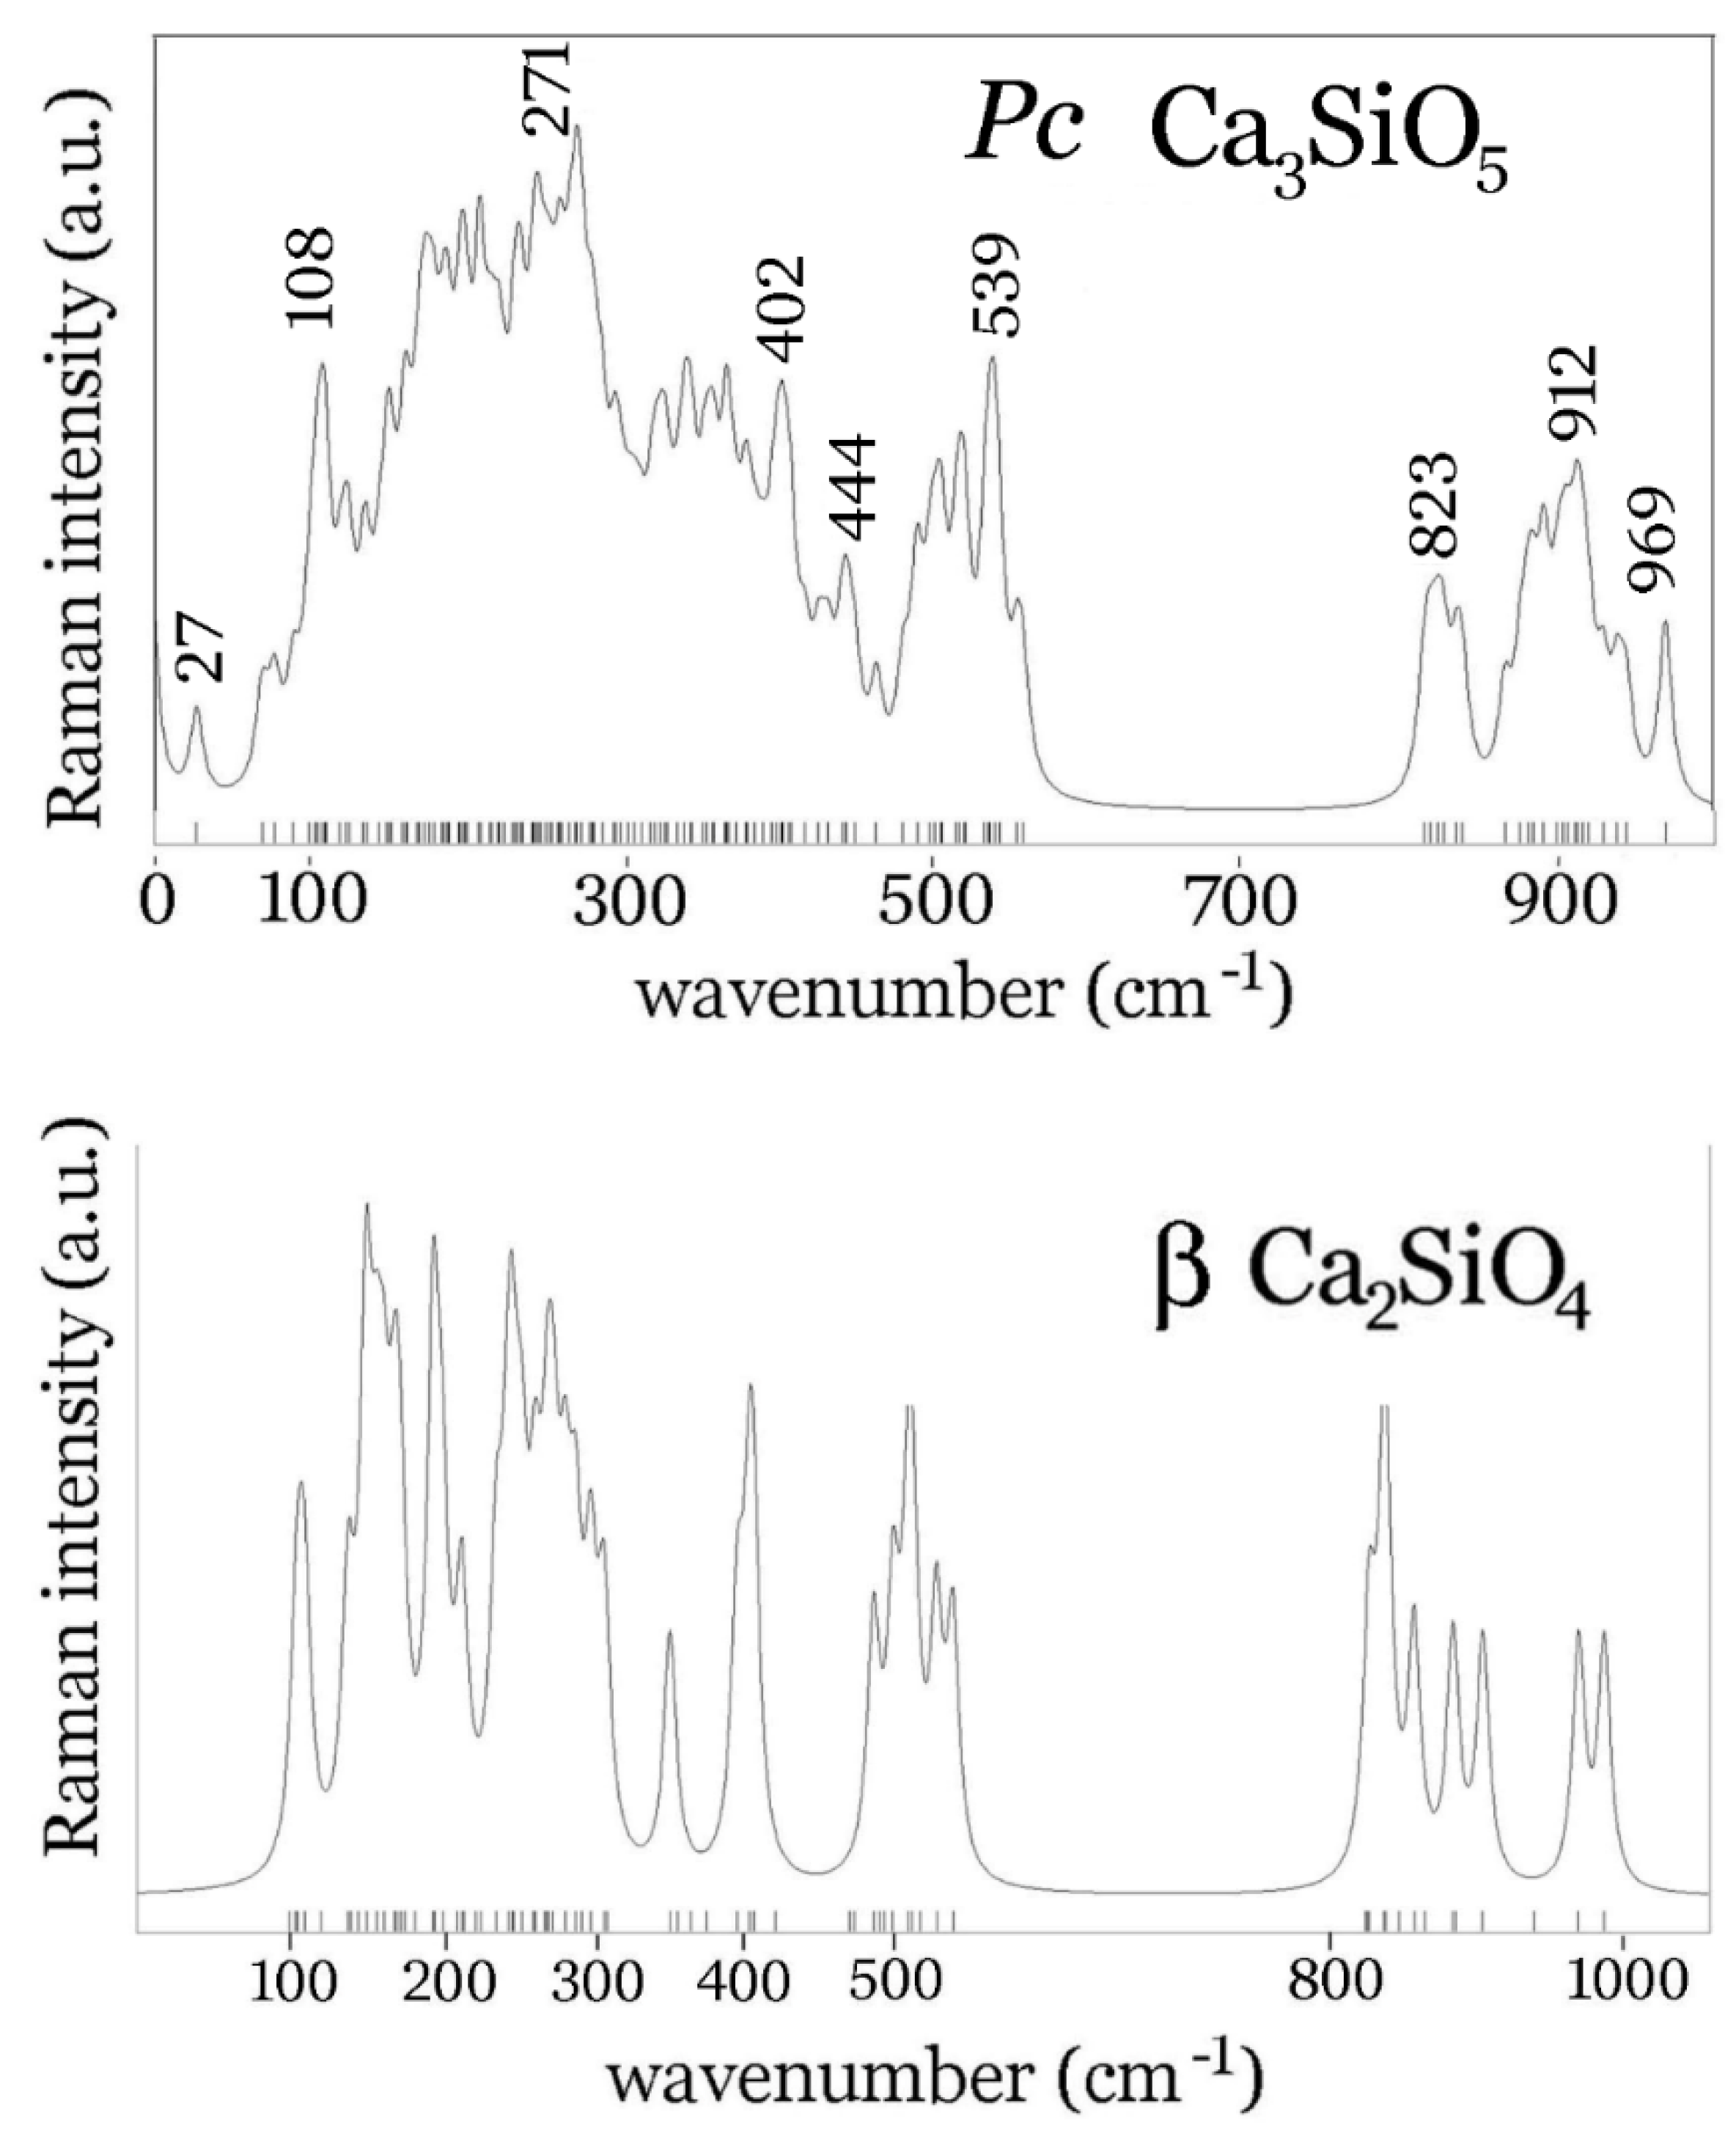
| Compound | C3S | C3S | C2S |
|---|---|---|---|
| space symmetry | Pc | Cm | P21/n |
| structure type | M1 | M3 | β |
| a | 9.2912 Å | 33.083 Å | 5.5075 Å |
| b | 7.059 Å | 7.027 Å | 6.7509 Å |
| c | 12.2575 Å | 18.499 Å | 9.3055 Å |
| β | 116.03° | 94.12° | 94.597° |
| references | de Noirfontaine [50,51,52] | Nishi et al. [69] | Jost [49] |
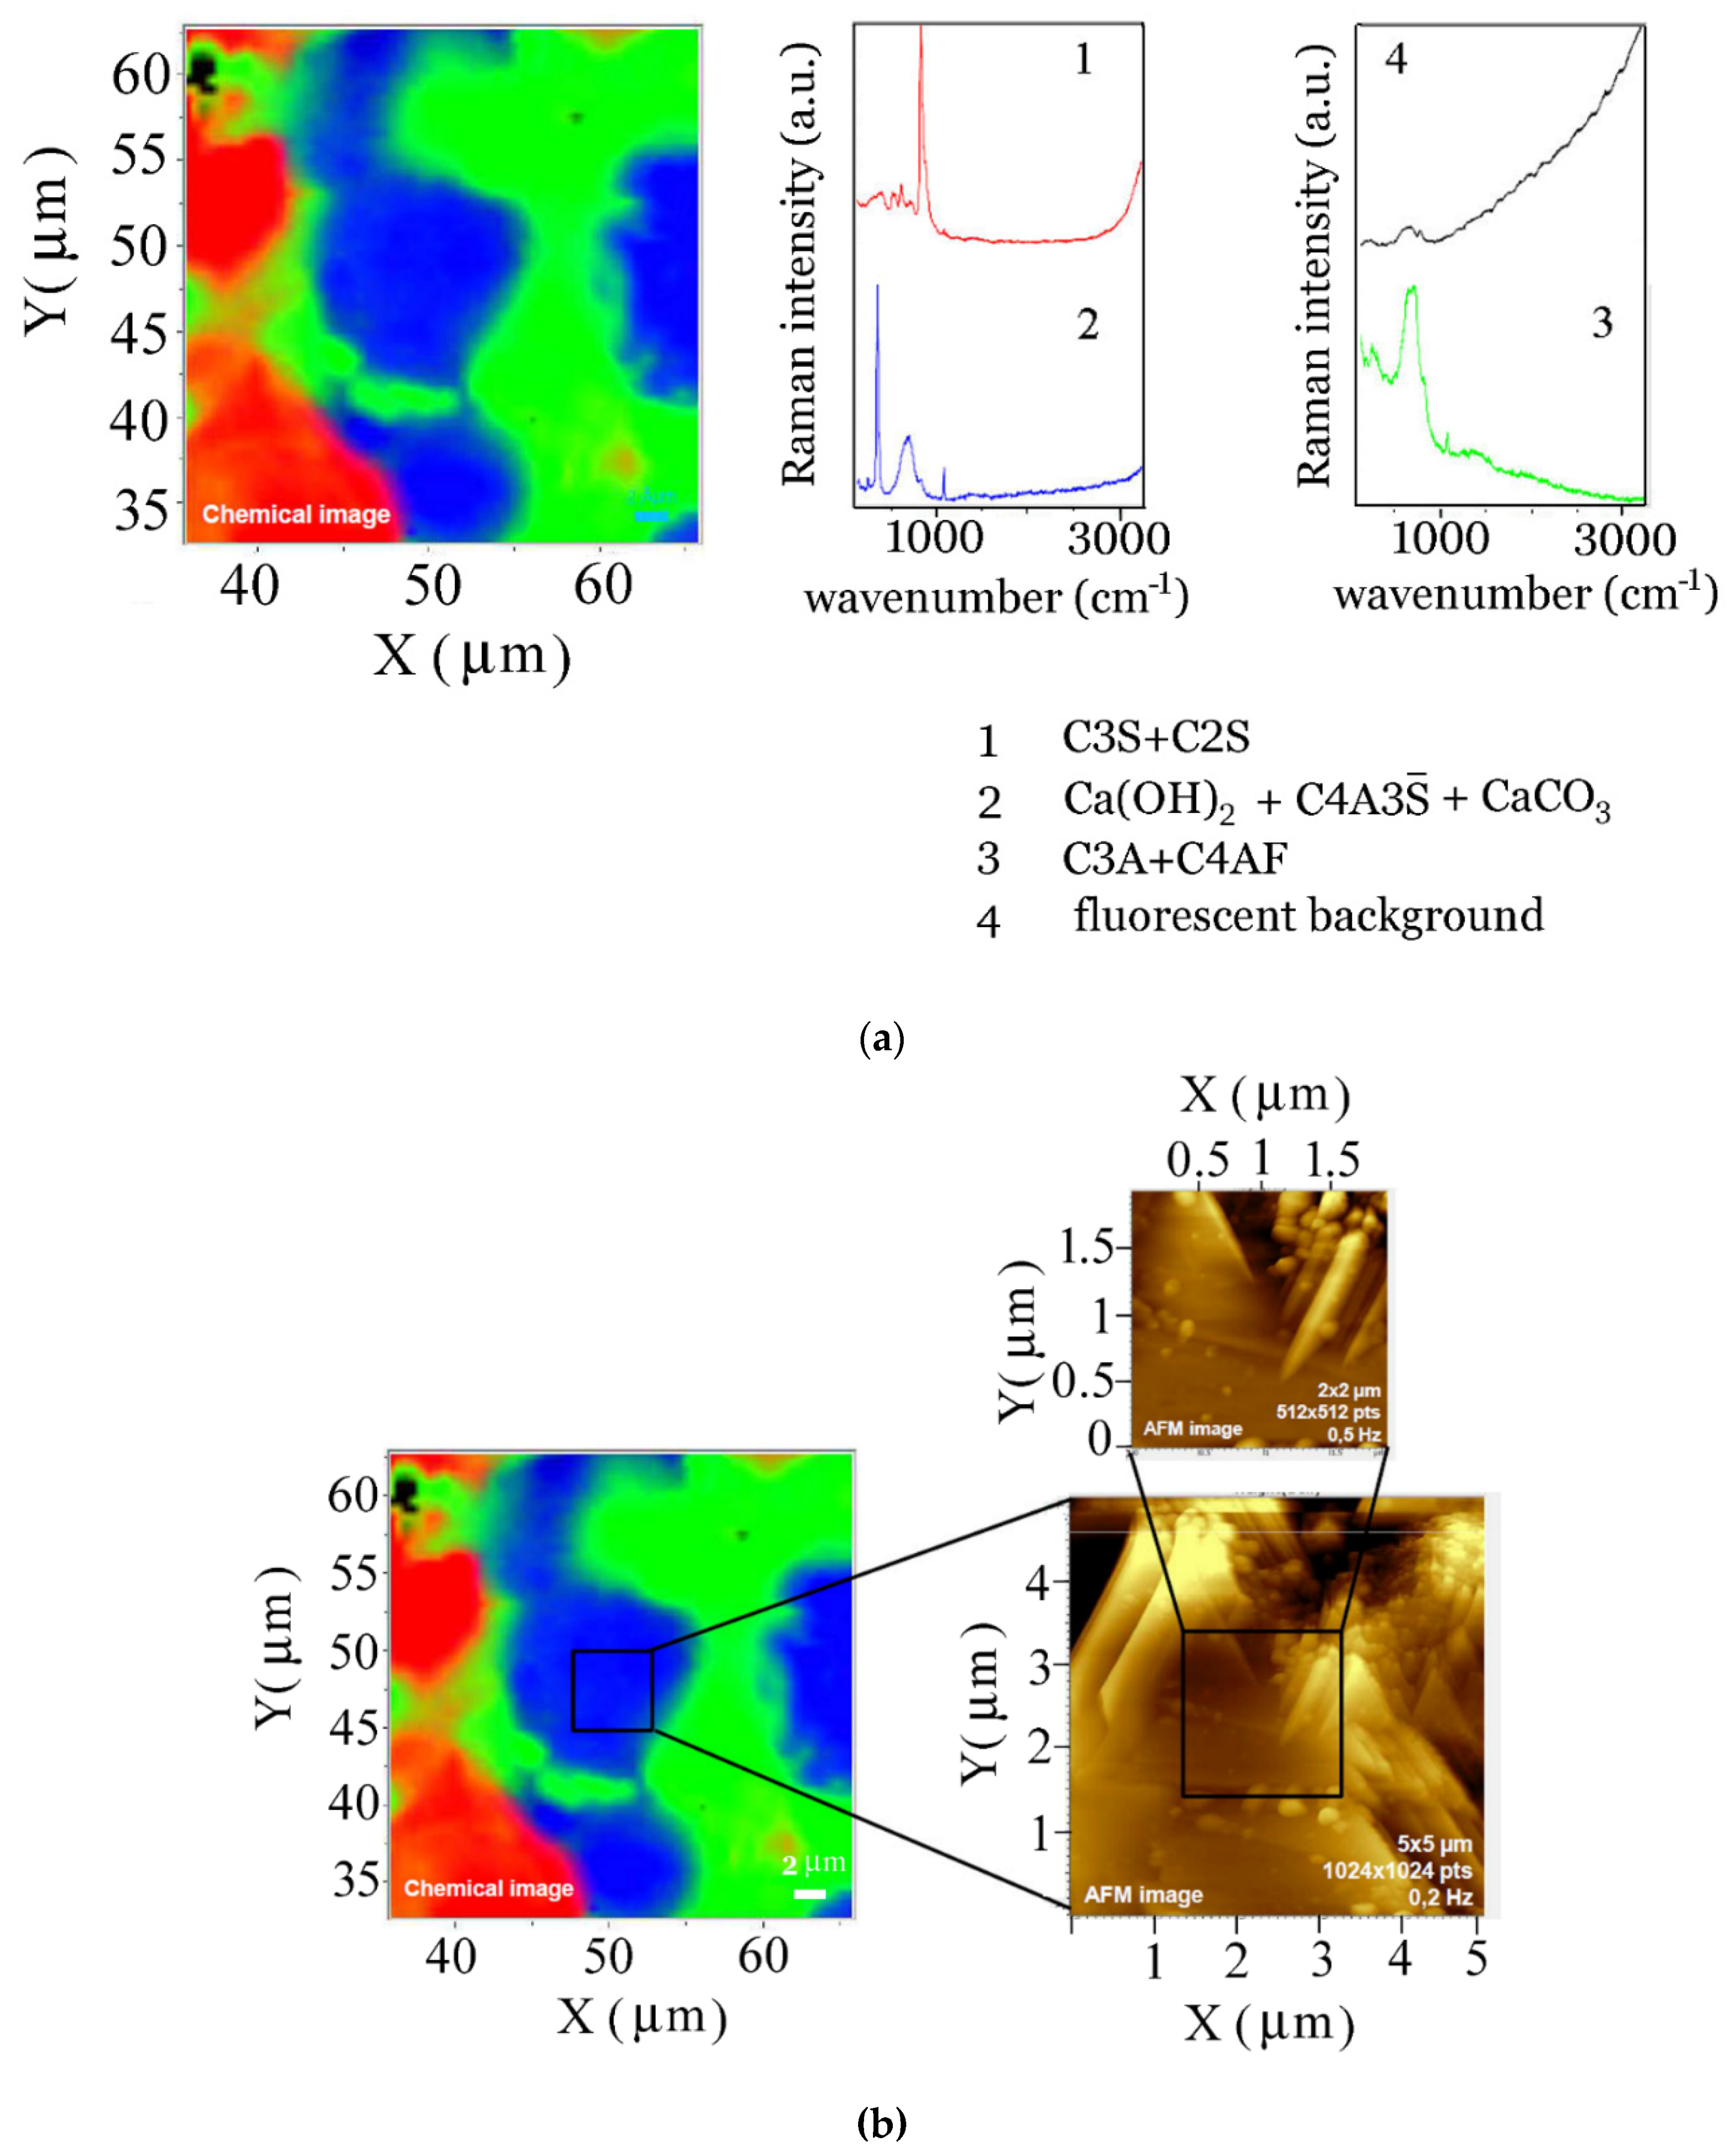
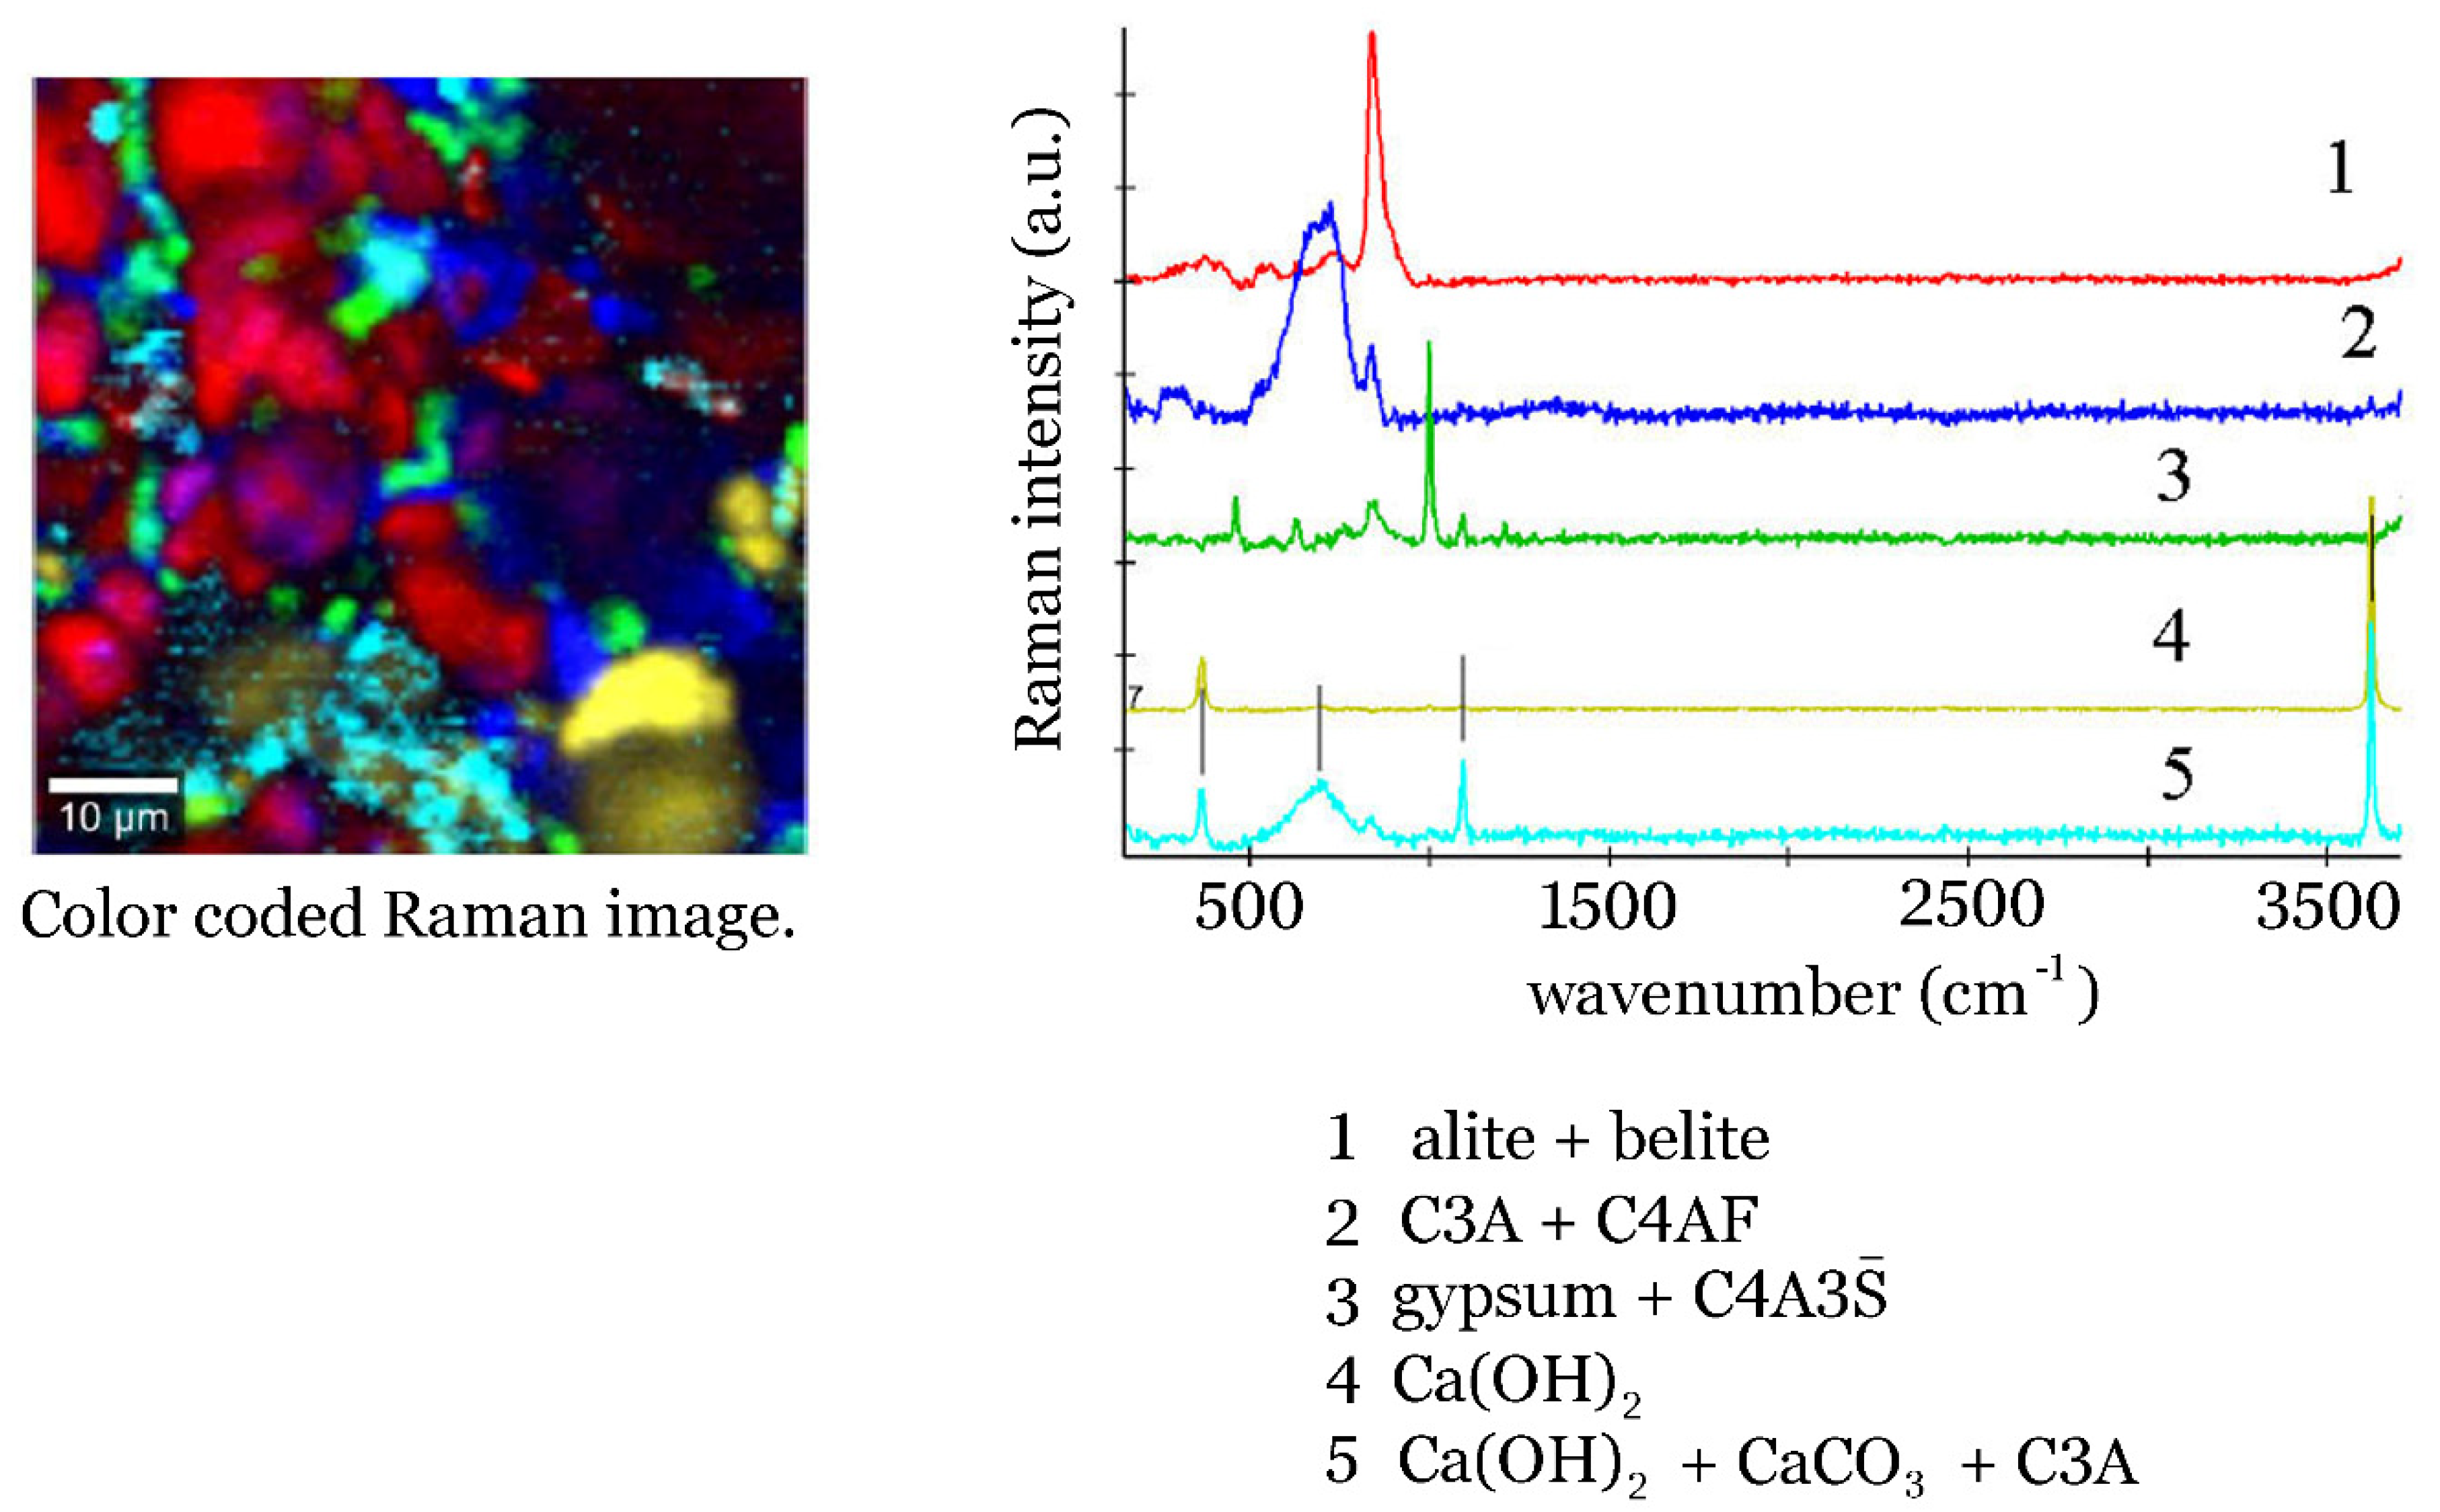
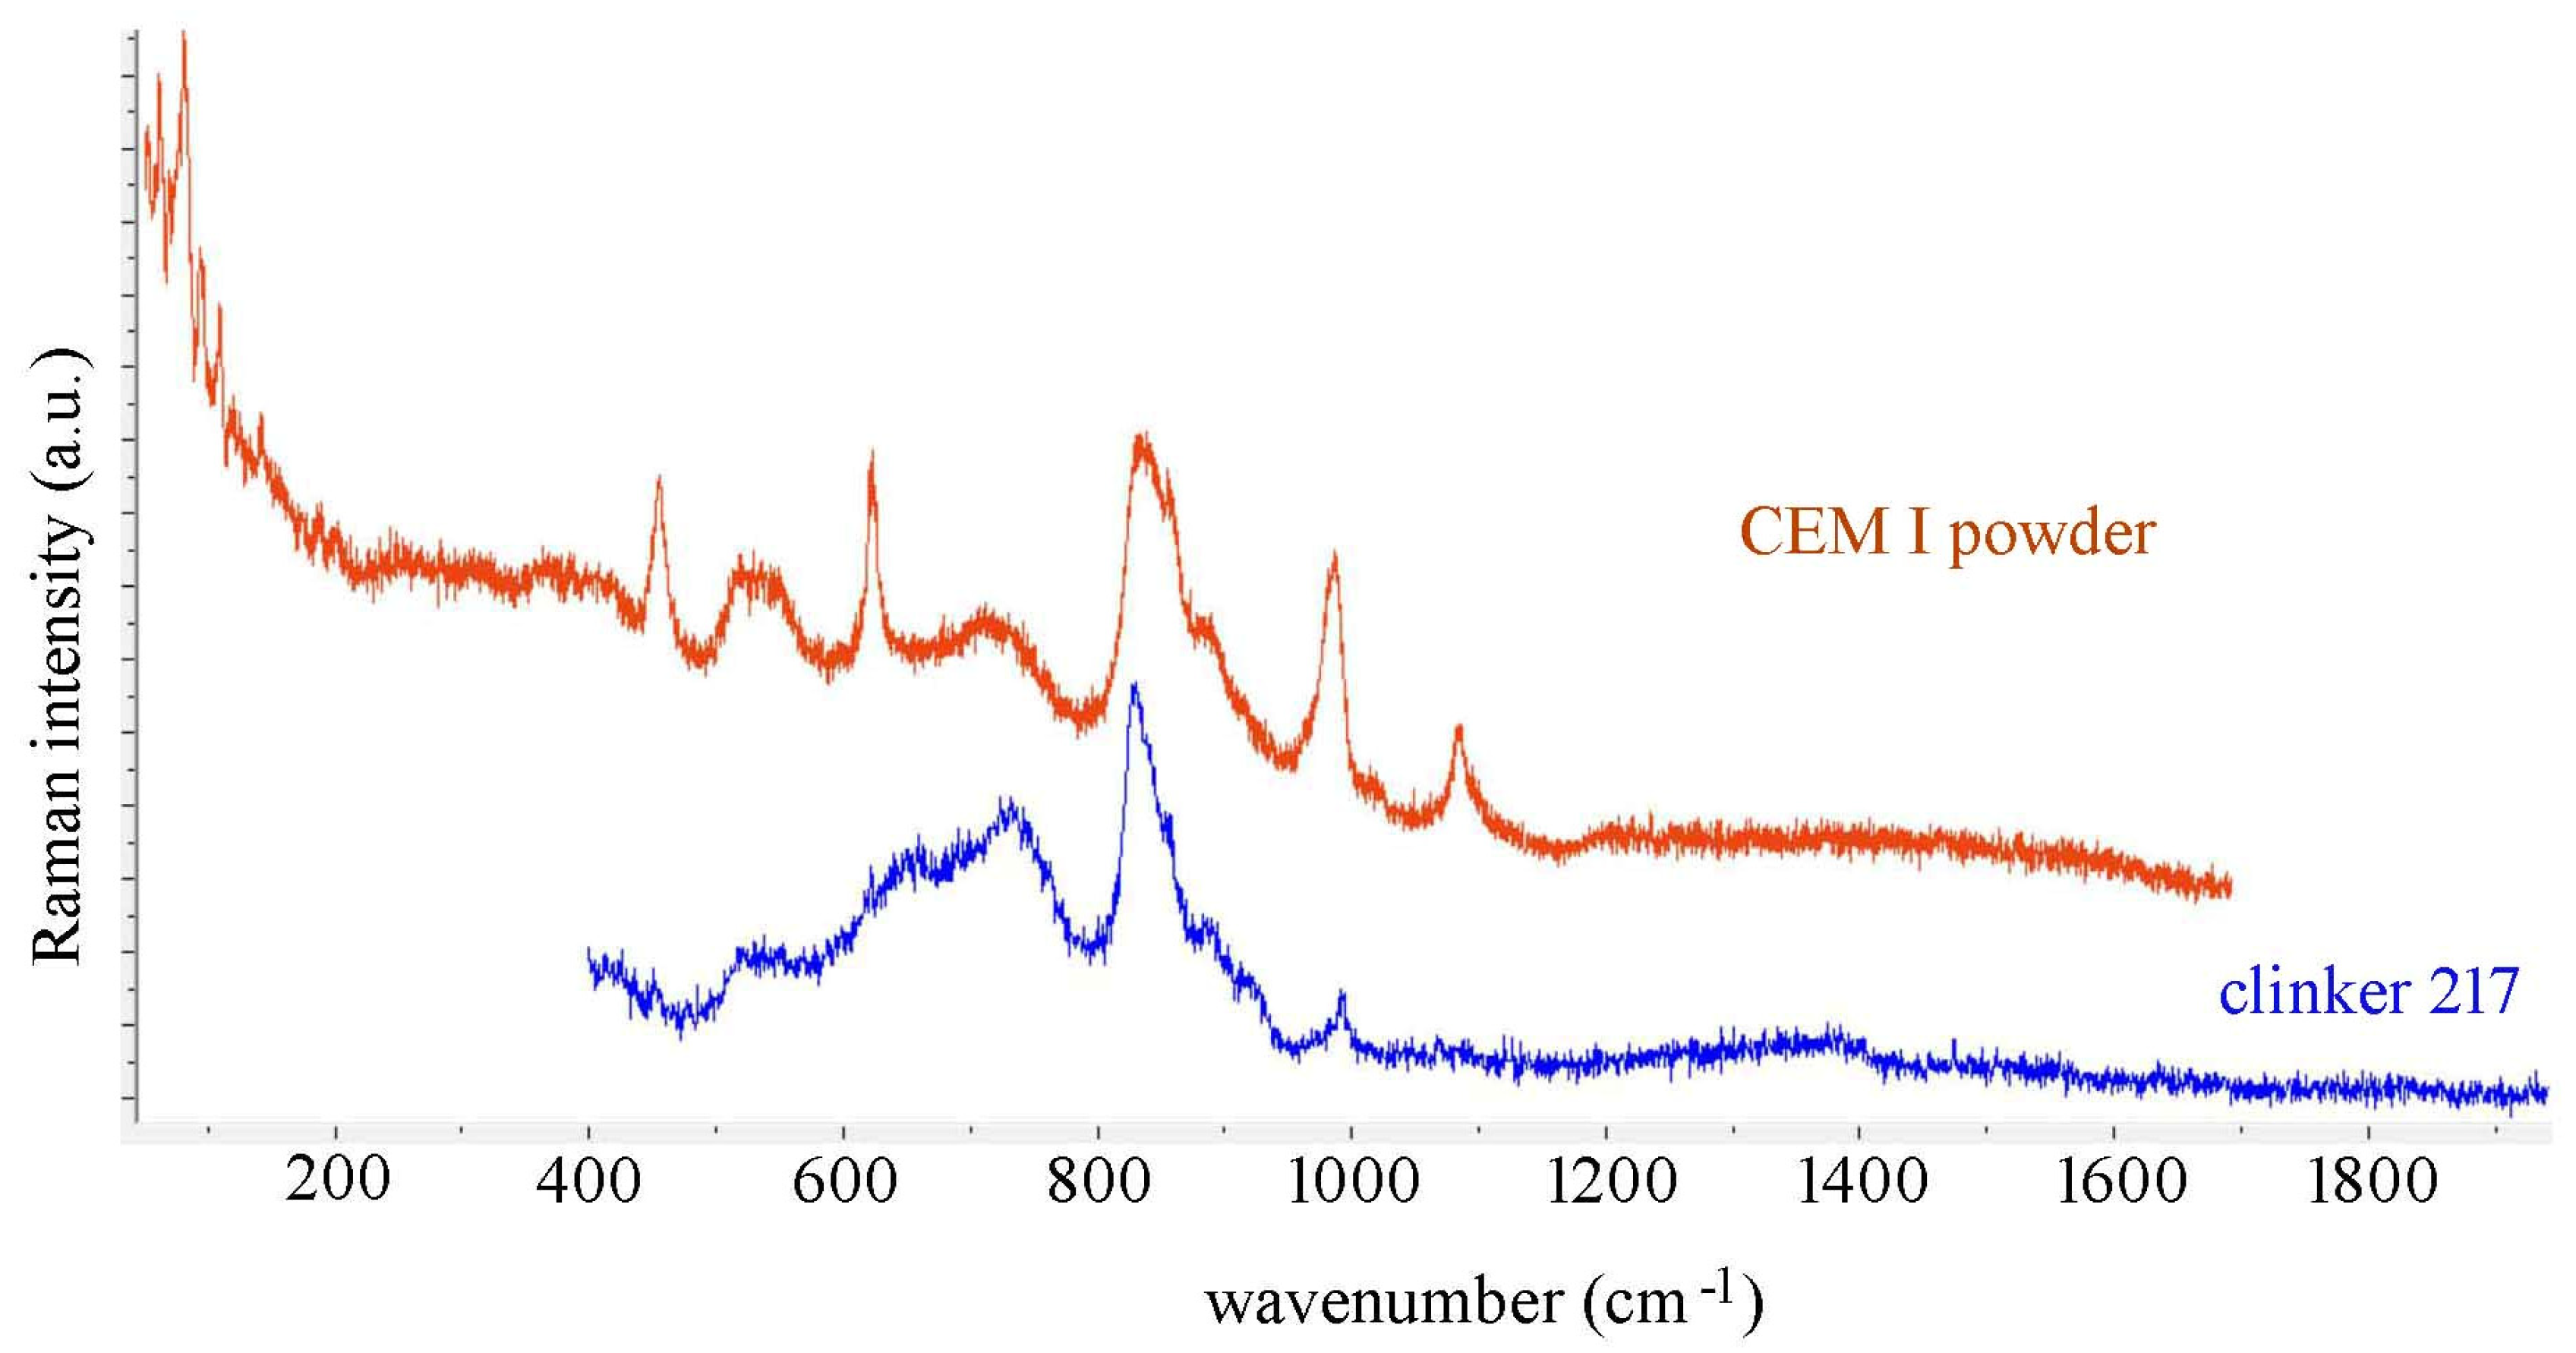
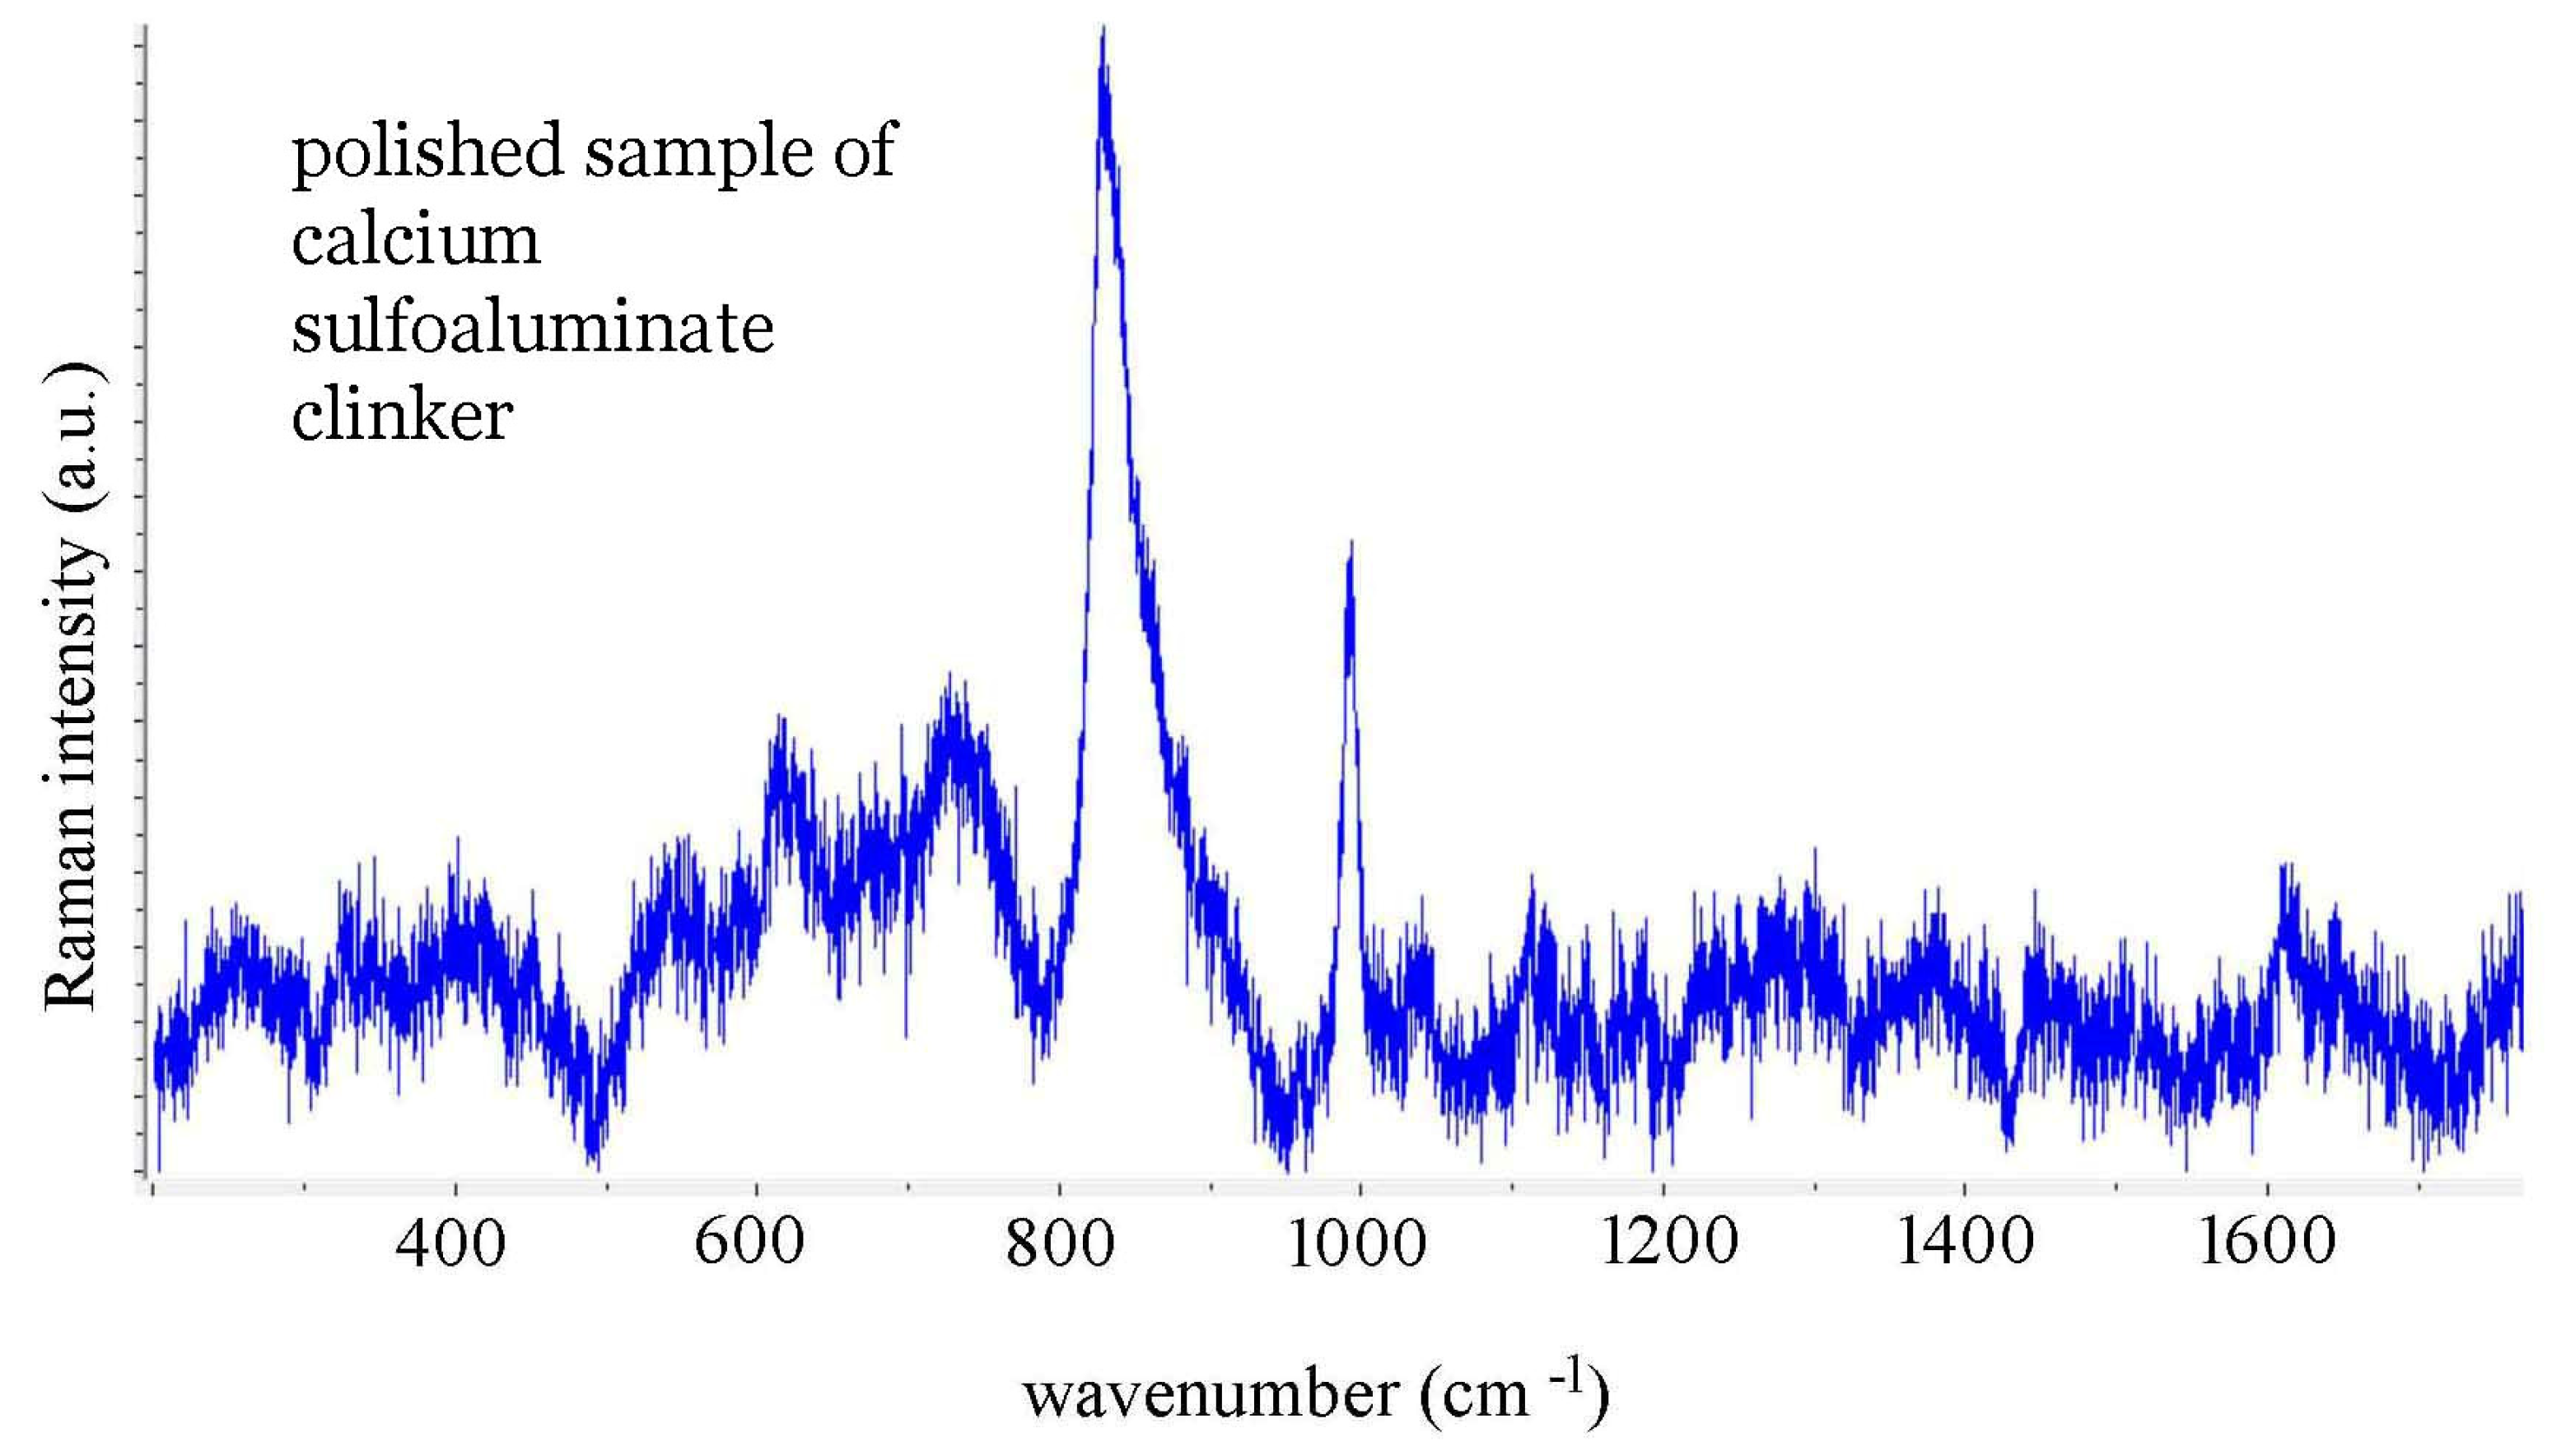
| CEM I Cement Powder (Figure 3) | Clinker 217 Grain (Figure 3) | Calcium Sulfoaluminate Clinker, Place 1 (Figure 4) | Calcium Sulfoaluminate Clinker, Place 2 (Supplementary Figure S3) | Assignment |
|---|---|---|---|---|
| 1117 | ν3 (SO42−) | |||
| 1084 | calcite CaCO3 | |||
| 1040 | ||||
| 1018 | CaSO4H2O | |||
| 994 | 993 | 993 | ν1 (SO42−) | |
| 985 | K2SO4 | |||
| 921 | 920 | C3S | ||
| 893 | 890 | C2S | ||
| 883 | C3S | |||
| 856 | 854 | 858 | C3S, C2S | |
| 836 | 830 | 832 | 833 | C3S |
| 746 | C3A, C4AF | |||
| 733 | 732 | C4AF | ||
| 718 | 716 | C3A | ||
| 658 | ? | |||
| 623 | 620 | ν4 (SO42−) | ||
| 541 | 546 | 549 | C2S, C3S | |
| 522 | C2S, C3S | |||
| 456 | ν2 (SO42−) |
Publisher’s Note: MDPI stays neutral with regard to jurisdictional claims in published maps and institutional affiliations. |
© 2021 by the authors. Licensee MDPI, Basel, Switzerland. This article is an open access article distributed under the terms and conditions of the Creative Commons Attribution (CC BY) license (https://creativecommons.org/licenses/by/4.0/).
Share and Cite
Mohaček-Grošev, V.; Đuroković, M.; Maksimović, A. Combining Raman Spectroscopy, DFT Calculations, and Atomic Force Microscopy in the Study of Clinker Materials. Materials 2021, 14, 3648. https://doi.org/10.3390/ma14133648
Mohaček-Grošev V, Đuroković M, Maksimović A. Combining Raman Spectroscopy, DFT Calculations, and Atomic Force Microscopy in the Study of Clinker Materials. Materials. 2021; 14(13):3648. https://doi.org/10.3390/ma14133648
Chicago/Turabian StyleMohaček-Grošev, Vlasta, Marija Đuroković, and Aleksandar Maksimović. 2021. "Combining Raman Spectroscopy, DFT Calculations, and Atomic Force Microscopy in the Study of Clinker Materials" Materials 14, no. 13: 3648. https://doi.org/10.3390/ma14133648
APA StyleMohaček-Grošev, V., Đuroković, M., & Maksimović, A. (2021). Combining Raman Spectroscopy, DFT Calculations, and Atomic Force Microscopy in the Study of Clinker Materials. Materials, 14(13), 3648. https://doi.org/10.3390/ma14133648