Article

Effect of Loading and Heating History on Deformation of LaCoO3

1
Institute for Problems of Materials Science, 03142 Kyiv, Ukraine
2
Department of Mechanical and Aerospace Engineering, University of Central Florida, Orlando, FL 32816, USA
3
School of Engineering and Materials Science, Queen Mary University of London, London E1 4NS, UK
4
Empa, Swiss Federal Laboratories for Materials Science and Technology, Laboratory for High Performance Ceramics, 8600 Duebendorf, Switzerland
*
Author to whom correspondence should be addressed.
Materials 2021, 14(13), 3543; https://doi.org/10.3390/ma14133543
Submission received: 14 May 2021 / Revised: 17 June 2021 / Accepted: 23 June 2021 / Published: 25 June 2021

Abstract

:
The aim of this work was to study cyclic stress–strain deformation behavior of LaCoO3 as a function of loading and heating history. The ferroelastic hysteretic deformation of LaCoO3 at different stresses and temperatures was characterized using effective Young’s modulus, hysteresis loop area and creep strain shift parameters. The deformation behavior of LaCoO3 was not significantly affected by the previous loading and heating history when tested at constant temperature. The high temperature strength and Young’s modulus of LaCoO3 were higher compared to at room temperature. A creep strain shift parameter was introduced to characterize creep strain in LaCoO3 for the first time.

1. Introduction

The deformation behavior of LaCoO3-based ceramics has been studied in great detail in the past [1,2,3,4,5,6,7,8]. The bulk modulus (~122 GPa) was extrapolated from high pressure changes in the lattice parameters of LaCoO3 [8]. While it was noticed that the reported bulk modulus of LaCoO3 has a lower value at RT as compared to PrCoO3 (~168 GPa) and NdCoO3 (~165 GPa) perovskites [8], the reported values are not consistent with Young’s modulus values of LaCoO3 reported in [9]. It is well established that unlike many other ceramics, such as B4C, Si3N4, SiC, or Al2O3, LaCoO3-based perovskites exhibit nonlinearity, ferroelasticity, and hysteresis upon mechanical loading [1,2]. Such non-linear hysteretic behavior is responsible for the appearance of permanent irreversible deformation and, thus, limits the use of LaCoO3 perovskites to applications where the applied stresses are minimal or non-existent. It was also established that pure LaCoO3 exhibits a significant stiffening during deformation at elevated temperature, such that its Young’s modulus increases from ~70 GPa upon loading at room temperature to ~120 GPa upon loading at 800 °C [7]. An attempt to explain the unusual high temperature stiffening by a possible high temperature phase transition of the LaCoO3 crystal lattice was not fruitful, as high-resolution neutron diffraction clearly showed that the crystal structure of LaCoO3 remains R 3 ¯ c rhombohedral and only a thermal expansion of the lattice was detected upon heating. It was not clear how an expanding lattice with associated increasing bond lengths upon heating could contribute to a significant increase of the Young’s modulus and stiffening of LaCoO3. However, when LaCoO3 is doped with 20 at % Ca on the La site of the perovskite lattice, the stiffening effect disappears, and La0.8Ca0.2CoO3 perovskite exhibits the expected high temperature softening behavior due to thermal expansion, and associated increased lattice parameters and unit cell volume [7,9].
The elevated temperature deformation behavior of LaCoO3 and La0.8Ca0.2CoO3 were studied on loading/unloading of the perovskite samples to different stresses in four-point bending [7,10]. It is well known that for ferroelastic ceramics, the loading history has a significant effect on their mechanical behavior [11]. Therefore, in some of the high temperature experiments [7], the LaCoO3 samples were loaded to a very small stress of 8 MPa in four-point bending in order to minimize the loading history effect on their stress–strain hysteresis loops. Even with loading at such a low stress level, the changes in loading/unloading hysteresis loops were significant during elevated temperature testing, and stiffening and decrease in hysteresis loop area were reported for pure LaCoO3 in the 700–900 °C temperature range [7]. Indeed, loading LaCoO3 to a higher stress level, such as 54 MPa [10], the deformation behavior detected upon loading to 8 MPa stress level was repeated. It was determined that loading to both 8 MPa and 54 MPa softens LaCoO3 in the 300–500 °C temperature range, where a slight decrease in Young’s modulus is observed, however, its stiffness increases significantly during cycling at 700–900 °C. The softening at 400 °C was accompanied by an increase in the hysteresis, but at 700–900 °C the hysteresis decreased significantly in comparison to the room temperature experiments. The stress–strain deformation became significantly more linear at 700 °C and especially at 800 °C, accompanied by an increase in the Young’s modulus of pure LaCoO3.
The high temperature first order phase transition in LaCoO3 was reported in [12]. However, in [13] it was reported that the first order phase transition at ~900 °C might occur because of the presence of Co3O4 secondary phase, which precipitates in Co rich regions of LaCoO3 upon heating. Co3O4 spinel has a higher Young’s modulus of 218 GPa [14] and if present might produce a detectable increase in Young’s modulus. However, to have such a significant increase as reported in [7,10], a significant amount of Co3O4 (up to 10 vol%) should precipitate upon heating and loading of LaCoO3. No evidence of such precipitation exists at the moment and in situ neutron diffraction has to be performed upon loading of LaCoO3 at 700–900 °C to verify the hypothesis.
It was determined that not only the loading history, but also the heating history, affects the deformation behavior of this perovskite. As such, experiments were performed that after loading at a high temperature, the sample was cooled down and tested again to the same stress level (54 MPa) at room temperature. As a result of these experiments, it was determined that the material that was exposed to the cyclic bending at 700 °C, 800 °C, and 900 °C becomes more and more hysteretic and compliant at room temperature as the temperature of the preceding high temperature experiments was increased. These high temperature and room temperature experiments indicate that not only the loading history, but also a previous high temperature exposure, plays an important role in the deformation behavior of LaCoO3. It was determined that after bending experiments performed at high temperature, the corresponding room temperature cyclic loading showed changes in mechanical behavior of LaCoO3 affecting its Young’s modulus, hysteresis loop area, and irreversible strain [10]. A comparison of LaCoO3 hysteretic behavior at the same temperature of mechanical testing after different heating history was not performed in the previous studies, and the objective of the current research is to fill this gap in our knowledge.
In the current research, a comparison of elevated and room temperature deformation of LaCoO3 is performed, and the stress–strain deformation curves of LaCoO3 all the way to failure at room temperature and 800 °C are presented.

2. Materials and Methods

The LaCoO3 perovskites were sintered by Praxair Surface Technologies, Specialty Ceramics, Manchester, CT, USA. Bars of 2.5 mm × 4 mm × 50 mm nominal dimensions were machined by PremaTech Ceramics, Worcester, MA, USA. Four-point bending experiments were performed on three LaCoO3 bending bars numbered as samples #1, #2, and #3 using a bending jig with 5 mm rollers, 40 mm supporting and 20 mm loading spans, and a 2 kN load cell on a universal testing machine (Zwick, Ulm, Germany) [15]. The tests were performed in load control mode with a loading/unloading rate of 1 N/s. The samples were preloaded to 10 N, which was set up as a zero point for further loading. From this zero-load set up point, the samples #1 and #2 were cyclically loaded to 10 N, 20 N, 30 N, and 40 N, equivalent to a maximum cyclic stress (σmax) of 13.5 MPa, 27 MPa, 40.5 MPa, and 54 MPa, respectively, thus four loading/unloading cycles were performed for each experiment at relevant temperatures. Sample #3 was cyclically loaded to 10 N, 20 N, 30 N, 40 N, 50 N, and 60 N load or σmax equal to 13.5 MPa, 27 MPa, 40.5 MPa, 54 MPa, 67.5 MPa, and 81 MPa, respectively. Therefore, a total of six loading/unloading cycles were performed on this sample. The description of the heating history of all three cyclically-loaded LaCoO3 samples is presented in Table 1. While sample #1 of LaCoO3 was not broken at the end of the experiment, sample #2 of LaCoO3 failed during RT cycling and sample #3 of LaCoO3 failed during cyclic loading at 800 °C cycling. The high temperature cycling experiments were performed using a high temperature furnace (Maytec, Singen, Germany) with a heating rate of 15 °C/min and dwell time of 20 min before the cyclic experiments in order to equilibrate the samples. A 3-point deflection measurement system (Maytec, Singen, Germany) was used to measure the displacement of the samples both at room and high temperatures, where the deflection of the specimens was recorded by the central rod of a deflectometer positioned at the tensile surface of the samples and two control rods were positioned below the loading rollers at a distance of 10 mm from both sides of the central rod (Figure 1). The elastic beam equation was used calculate the stress on the tensile surface under bending of the LaCoO3 bars, which gives a slightly overestimated values of true stress due to the nonlinear stress–strain behavior of LaCoO3 [8,9], however, it was shown that such overestimation is not significant. The Young’s modulus obtained from the stress–strain deformation plots were calculated from the secant modulus of a straight line approximated at zero applied stress. It was reported [7] that such calculations correlate very well with the Young’s modulus values obtained by different techniques, such as impulse excitation, uniaxial compression, or resonant ultrasound spectroscopy.

3. Results and Discussion

3.1. Loading and Heating History of LaCoO3 Cycling

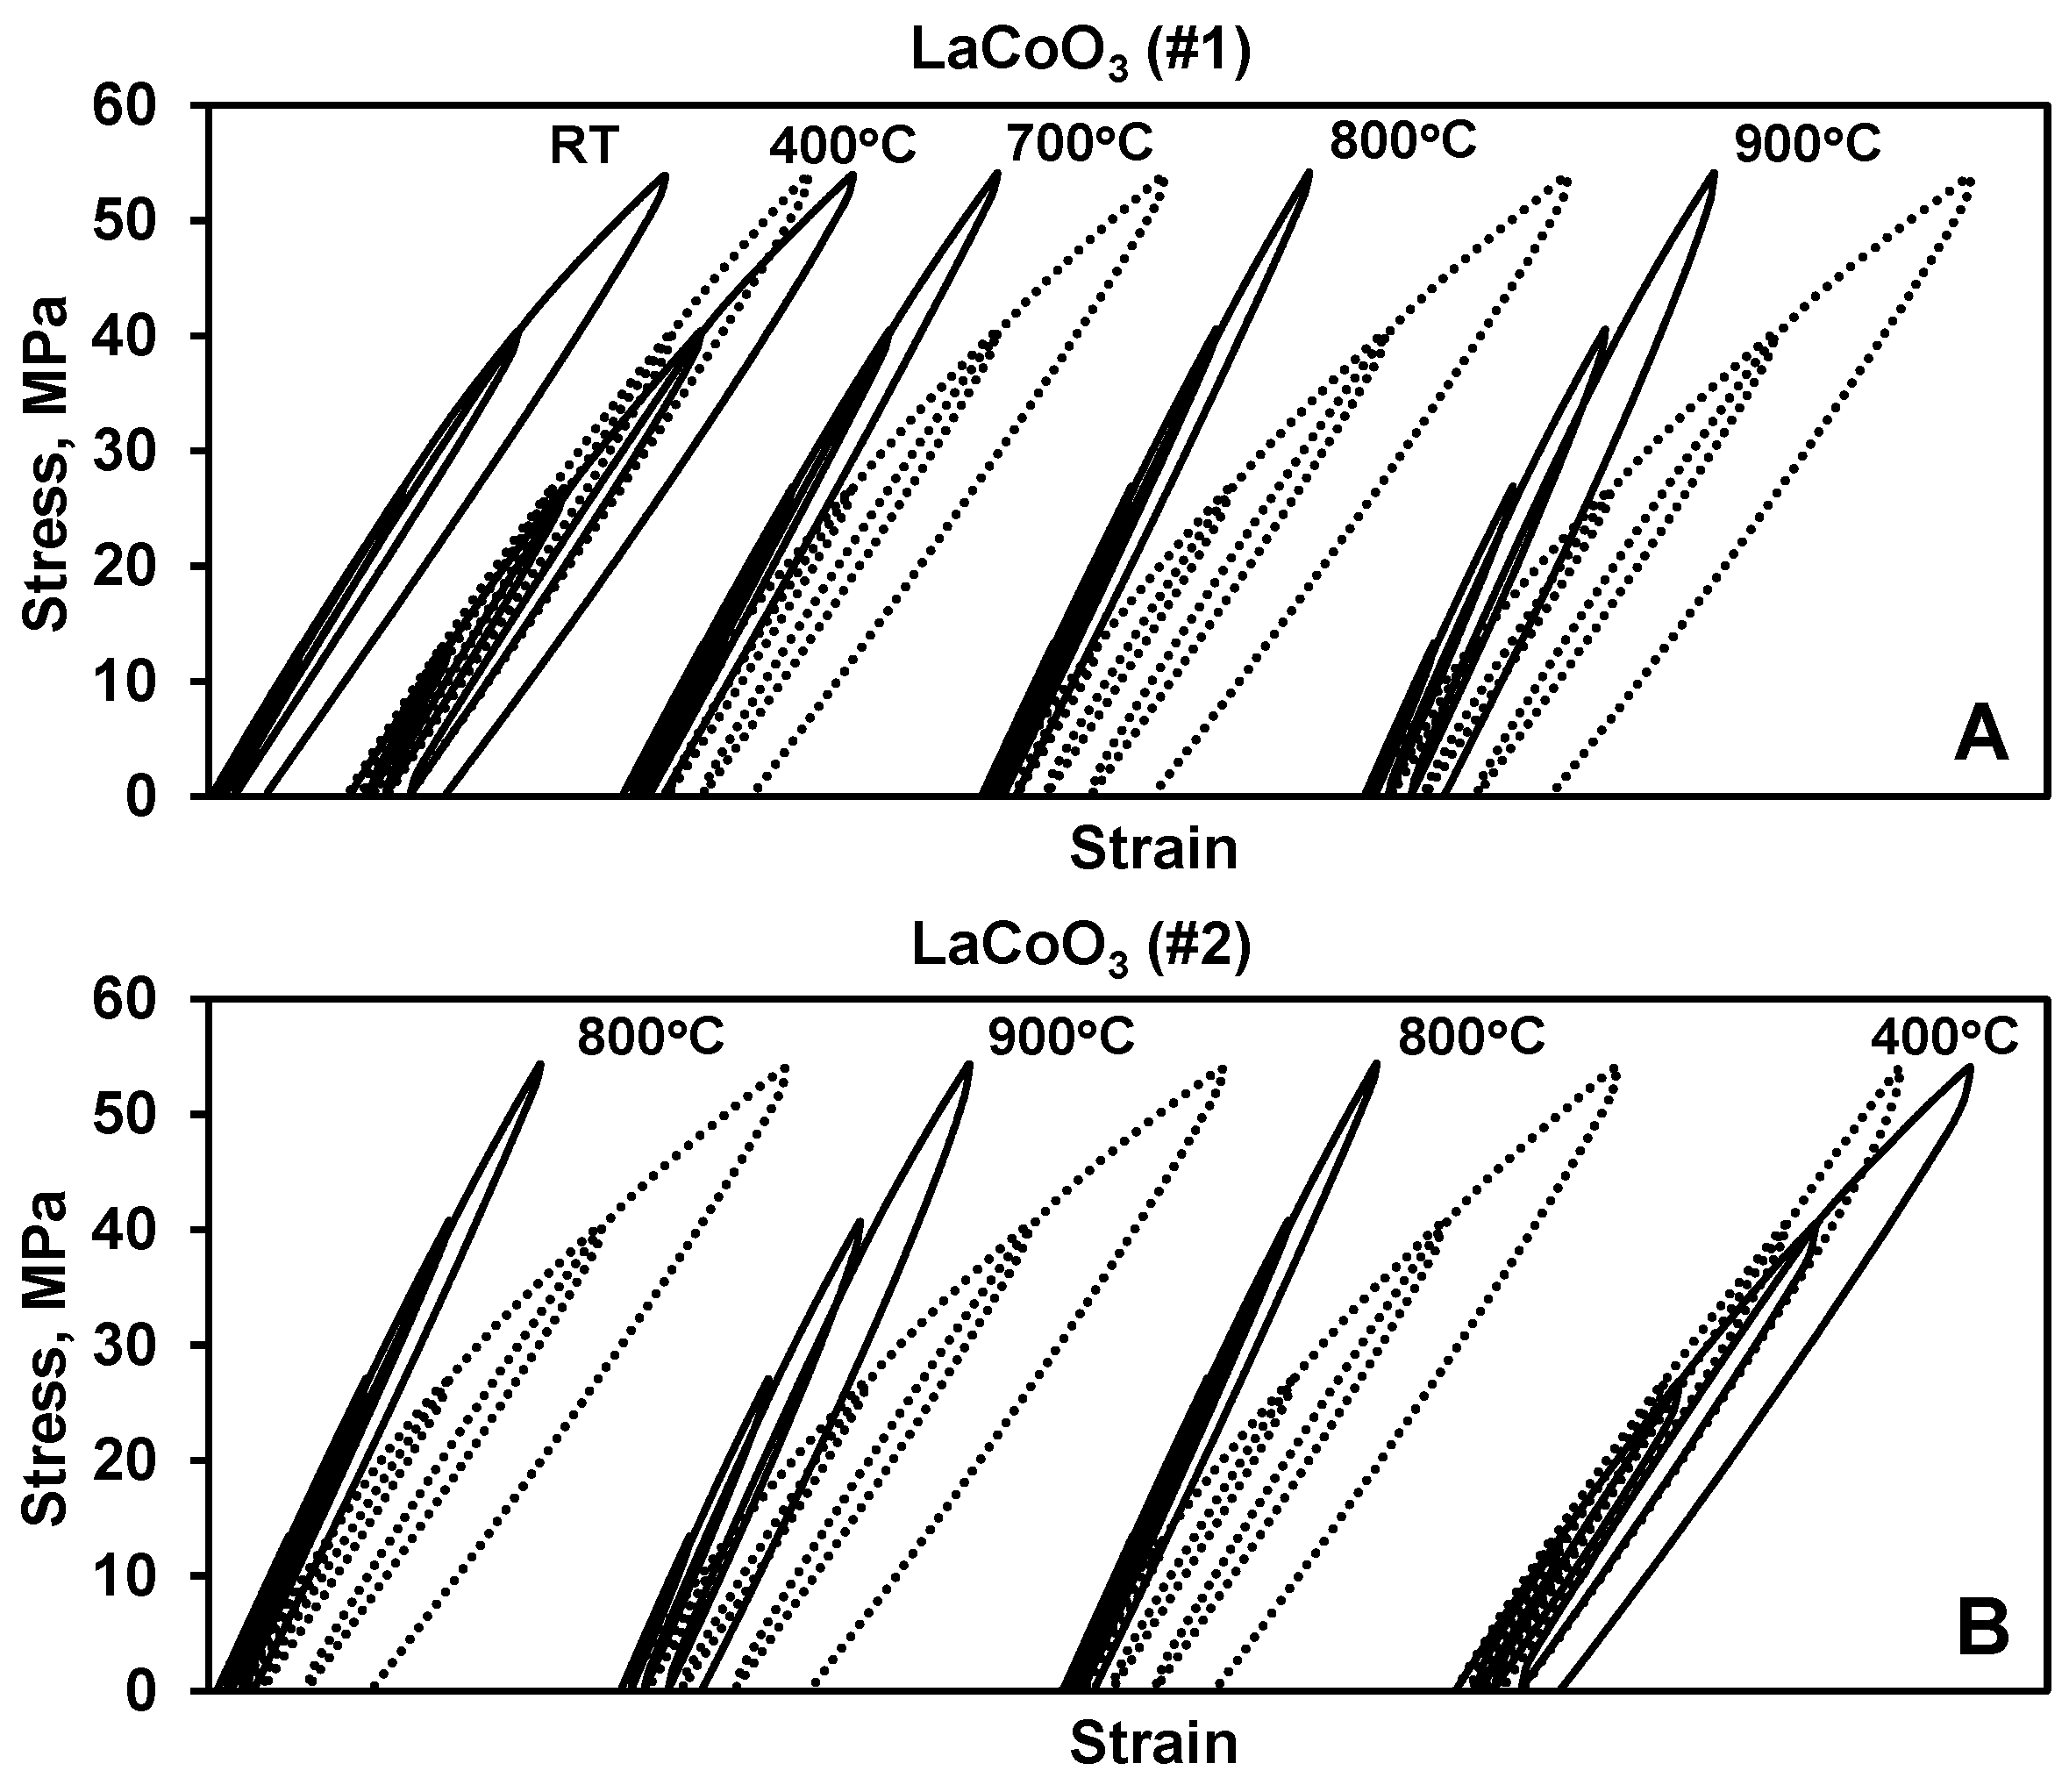
The stress–strain deformation behavior of two different LaCoO3 samples as a function of temperature and specific loading cycles is shown in Figure 2. LaCoO3 sample #1 was first cyclic loaded at RT. The Young’s moduli and hysteresis loop areas calculated using the obtained stress–strain hysteresis plots of this sample are shown in Table 2. It was determined that RT Young’s modulus and hysteresis loop area of the first cycle in this test were equal to 67 GPa and 0.26 kPa, respectively. The sample was then heated and the same four step cyclic loading was performed at 400 °C. It was determined that the LaCoO3 softened slightly and hysteresis loop areas became bigger for the test at 400 °C as compared to the original RT tests. The Young’s modulus of LaCoO3 decreased to 65 GPa as compared to 67 GPa at RT, but the hysteresis loop area almost doubled from 0.26 kPa at RT to 0.43 kPa at 400 °C in the first cycle. However, when comparing the fourth cycle, the Young’s moduli were calculated as 67 GPa at RT and 62 GPa at 400 °C, while the hysteresis loop areas remained almost the same and were equal to 6.3 kPa and 6.9 kPa for RT and 400 °C, respectively. After cycling at 400 °C, the sample was cooled down and cycled again at RT. The Young’s modulus became 66 GPa and the hysteresis loop areas decreased to 5.2 kPa as measured in the fourth cycle upon loading. As one can see from the above results, the heating and loading history did not affect the RT deformation behavior of LaCoO3 after testing at 400 °C. If LaCoO3 was a typical ceramic material, it would be expected that the softening would continue for further deformation at higher temperatures, however, since LaCoO3 is a unique perovskite, the stress–strain deformation behavior was distinctively different for this composition at 700 °C, 800 °C, and even 900 °C. In this temperature range, the hysteresis loop areas became much smaller, especially in the 800 °C test as compared to the 400 °C test. The Young’s modulus of LaCoO3 increased significantly and become equal to 73 GPa, 83 GPa, and 87 GPa at 700 °C, 800 °C, and 900 °C in the first cycle, respectively (Table 2). Despite being stiffer and less hysteretic upon deformation at 700–900 °C temperature range, after cooling down, the RT cyclic deformation cycling of LaCoO3 showed increased hysteresis loop areas and significant RT softening. For example, in the fourth cycle the hysteresis loop area increased from 3.3 kPa at 700 °C to 8.6 kPa at RT cycling, from 2.6 kPa at 800 °C to 10.2 kPa at RT, and from 5.1 kPa at 900 °C to 11.6 kPa at RT. At the same time, the Young’s modulus, calculated from the fourth stress–strain hysteresis loop, decreased from 75 GPa at 700 °C to 66 GPa at RT, from 83 GPa at 800 °C to 65 GPa at RT, and from 91 GPa at 900 °C to 64 GPa at RT (Table 2).
Unlike the first LaCoO3 sample, the second LaCoO3 sample was not tested at RT initially, but, instead, the stress–strain deformation plots were collected at 800 °C (Figure 2B). After cycling at 800 °C, the sample was cooled down and the same loading/unloading test was repeated again at RT. Similar to sample #1, LaCoO3 showed significant stiffening and decrease in hysteresis loop areas at 800 °C, such that its Young’s modulus was equal to 83 GPa at 800 °C, but softened significantly during the consequent RT test, where the Young’s modulus was measured to be equal to only 64 GPa. The hysteresis loop areas increased from 2.6 kPa at 800 °C to 10.5 kPa at RT. After cycling at 800 °C and consequent RT, the LaCoO3 sample #2 was heated again to 900 °C, cooled down and cycled again at RT. This heating and loading history was followed by heating to 800 °C one more time, where LaCoO3 exhibited the stiffening again, followed by the softening upon cooling and cycling at RT. The final elevated temperature cycling test of this LaCoO3 sample was performed at 400 °C, after which the sample was cooled down and tested at RT. The Young’s moduli and hysteresis loop areas of both LaCoO3 samples tested in these experiments are summarized in Table 2.

3.2. Stress–Strain Deformation Behavior of Different LaCoO3 Samples Tested at Identical Conditions

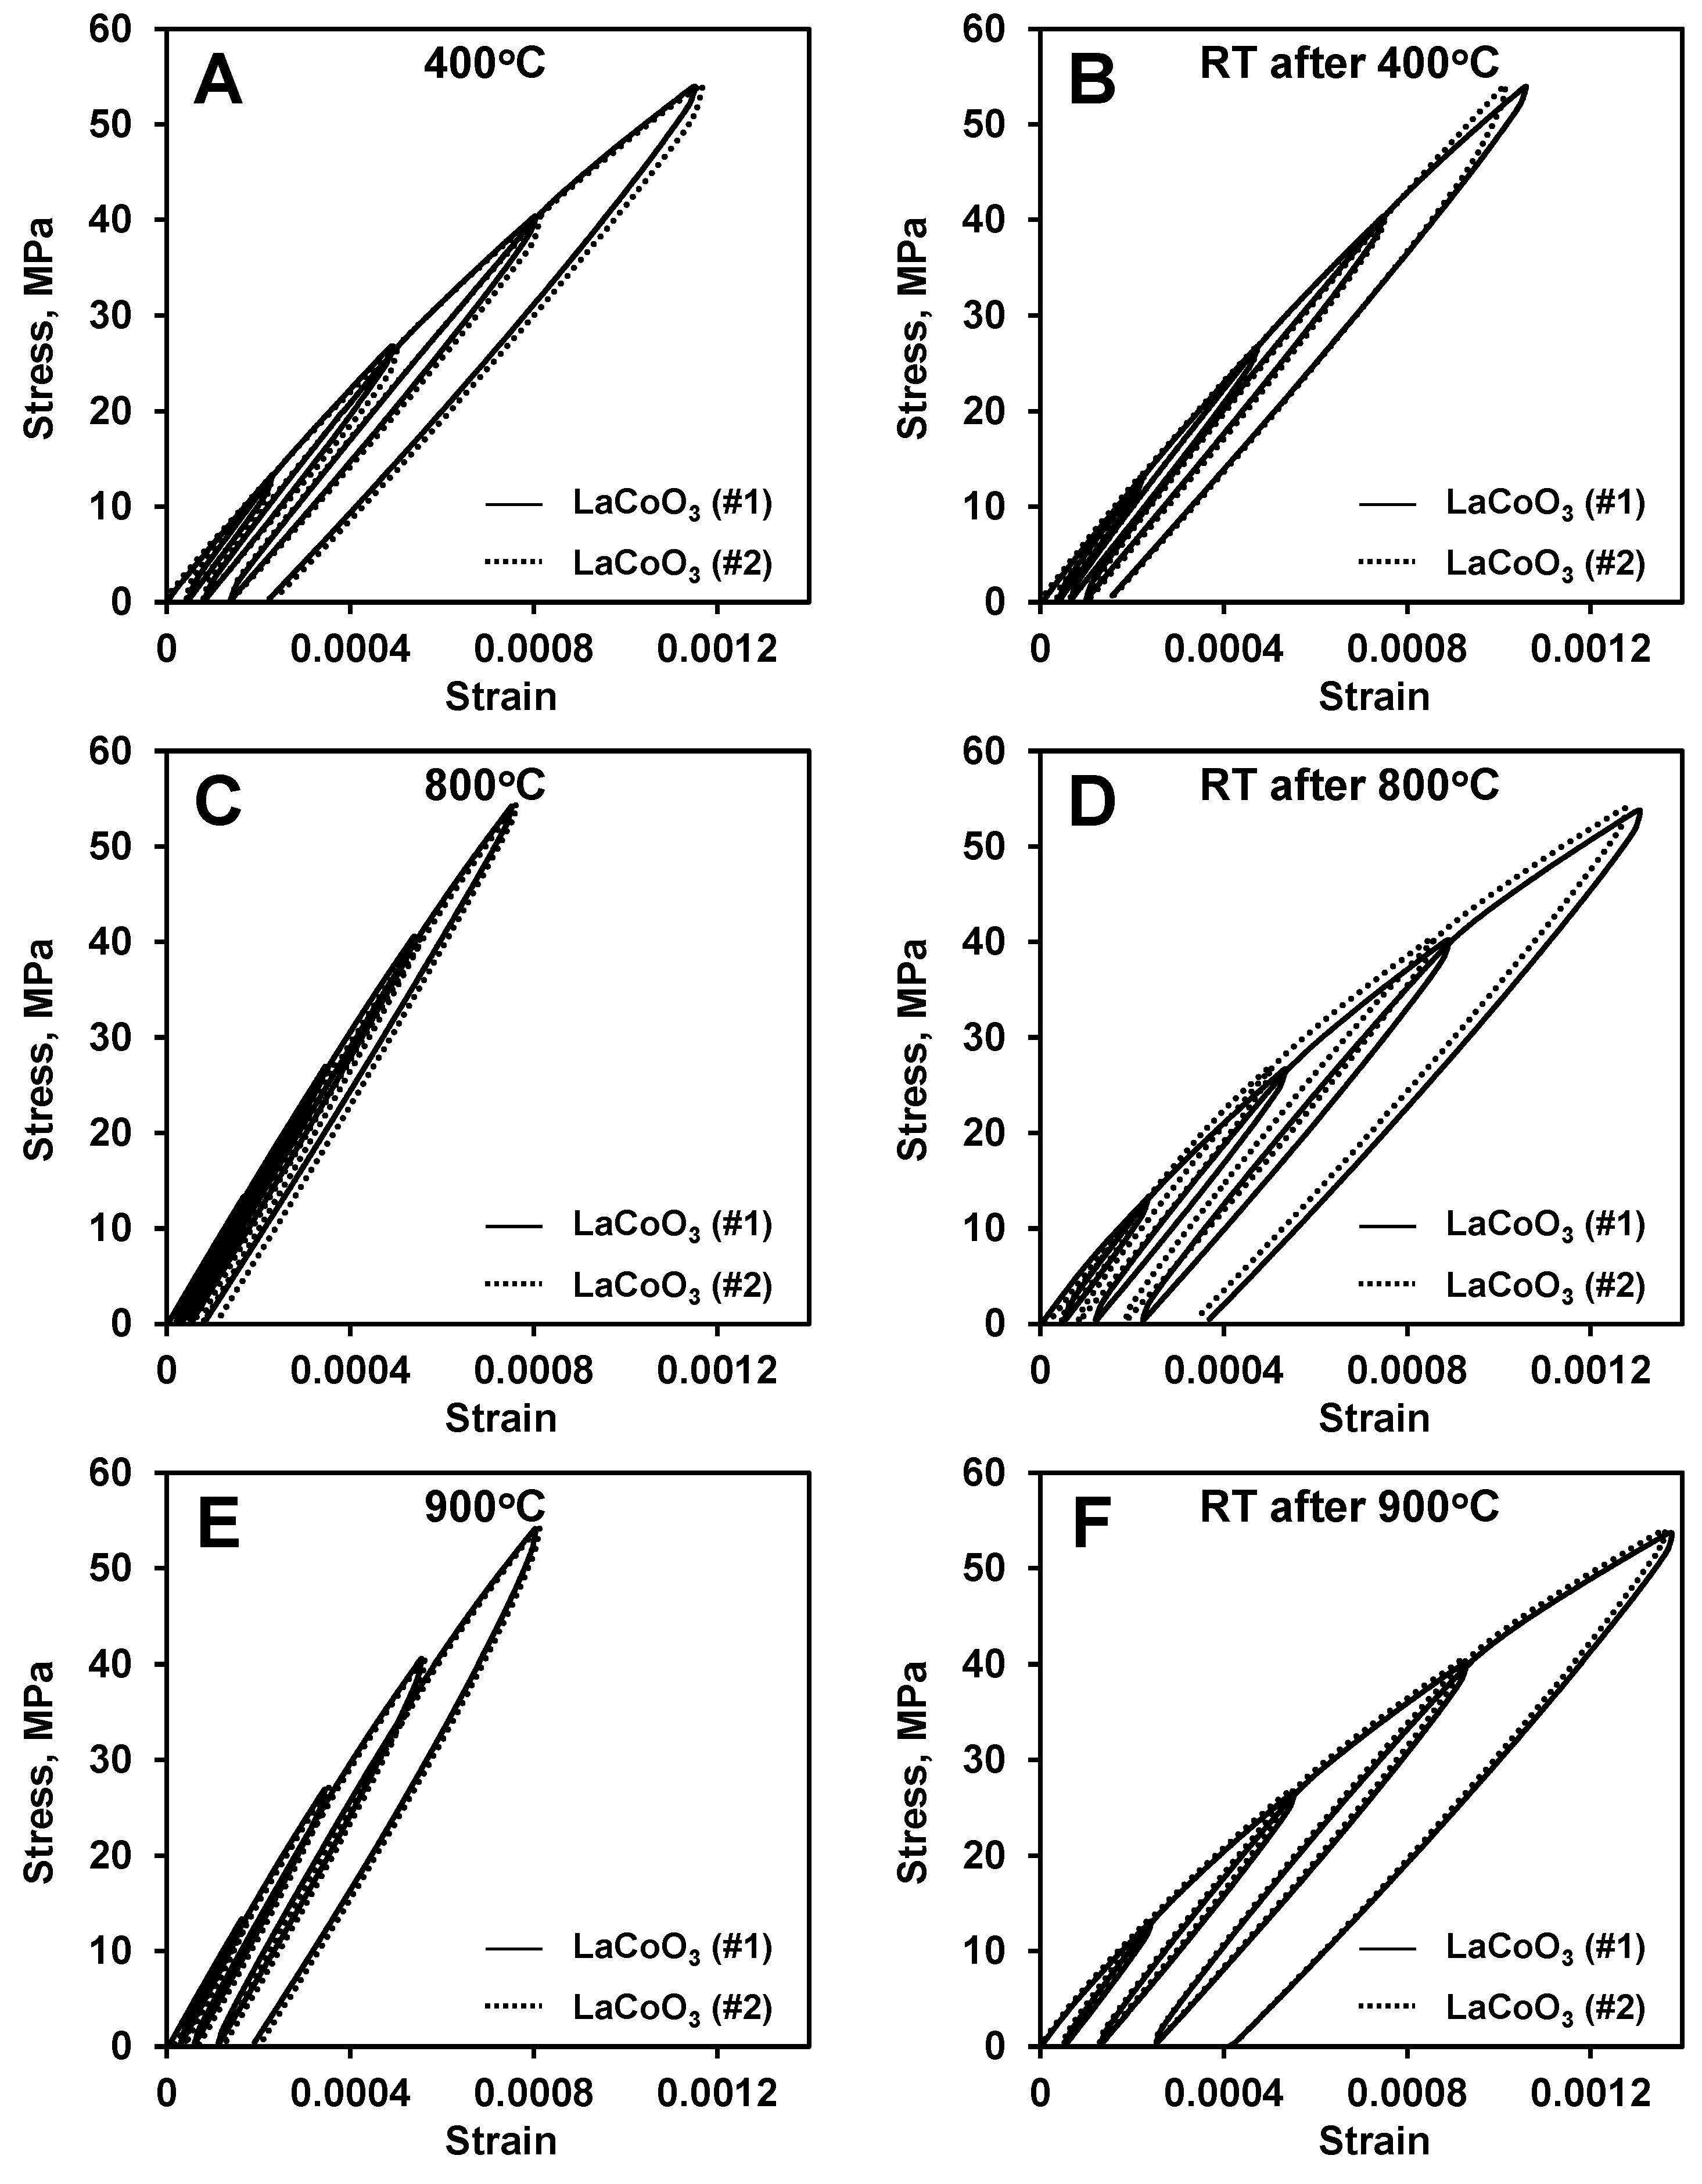
A comparison of the stress–strain diagram of two different LaCoO3 samples tested at different temperatures is shown in Figure 3. As one can see from Figure 3A, at 400 °C, the stress–strain diagrams collected from the two different samples coincide very well, despite totally different loading and heating histories preceding the cycling testing at 400 °C (Table 1). The Young’s moduli as well as hysteresis loop areas, measured from all four cycles during these tests are almost identical (Table 2). For example, the Young’s modulus measured using cycle 4 stress–strain data was equal to 62 GPa both for sample #1 and sample #2, despite the samples experiencing very different heating histories before these experiments. Upon cooling after cyclic loading at 400 °C, the stress–strain deformation behavior of these two LaCoO3 samples were also almost identical for cyclic tests performed at RT (Figure 3B), as the Young’s moduli were measured to be 66 GPa and 65 GPa and hysteresis loop areas was measured to be 5.2 kPa and 5 kPa in the 4th cycle for the first and second samples of LaCoO3, respectively.
Similar to the good reproducibility of the hysteretic behavior of LaCoO3 at 400 °C regardless of previous loading and heating histories, the very same phenomenon was observed for testing performed at 800 °C (Figure 3C) and following RT (Figure 3D) stress–strain deformations. As one can see from Figure 3C, while the hysteresis loop areas are much smaller for tests performed at 800 °C as compared to 400 °C (Figure 3A), despite the very different loading and heating history of these samples preceding the cyclic testing at 800 °C (Table 1), the Young’s moduli as well as hysteresis loop areas measured for all four cycles during these tests are almost identical (Table 2). For example, the Young’s modulus measured at 800 °C using the fourth cycle stress–strain data was equal to 83 GPa for the first sample and 83 GPa and 87 GPa for the second sample, which was cycled twice at 800 °C (Table 1). The difference in 4 GPa between first and second cycling at 800 °C for the LaCoO3 sample #2 is very small and could potentially be neglected in this study. The hysteresis loop areas measured from the fourth cycle at 800 °C were 2.6 kPa for the first LaCoO3 sample and 2.4 kPa for the second LaCoO3 sample for first cycling, which are all very similar to each other (Table 2). While, three cycling tests were performed at 800 °C on two LaCoO3 samples (Table 1 and Figure 2), for clarity only two of these stress–strain deformation plots are shown in Figure 3C. One of them was taken from testing of sample #1 and the other was taken from first cycling at 800 °C of sample #2. Upon cooling after 800 °C, the stress–strain deformation behavior of these LaCoO3 samples were also almost identical for cyclic tests performed at RT (Figure 3D), with Young’s modulus measured to be equal to 65 GPa for the first sample and 65 GPa and 64 GPa for two tests performed on the second LaCoO3 sample. Only two stress–strain deformation diagrams are also shown in Figure 3D—one is at RT after cycling at 800 °C of the first LaCoO3 sample and a second one is at RT after the first 800 °C cycling of the second LaCoO3 sample. The hysteresis loop areas measured from the fourth cycle at RT after 800 °C testing were equal to 10.2 kPa for the first LaCoO3 sample and 10.5 kPa and 10 kPa for the second LaCoO3 sample, which are almost four times larger as compared to the loop areas measured at 800 °C.
The same similarities were observed when the comparison of the hysteretic behavior of LaCoO3 perovskite was made for results performed at 900 °C (Figure 3E) and subsequent RT (Figure 3F) stress–strain deformation behavior. As one can see from Figure 3E, the hysteresis loop areas measured at 900 °C increased in comparison with the tests performed at 800 °C. However, both LaCoO3 samples exhibited very similar deformation behaviors, despite different loading and heating histories, where the measured Young’s moduli and hysteresis loop areas were almost identical for the two samples cycled at 900 °C and then RT (Table 2). Thus, the Young’s modulus measured at 900 °C for the 4th cycle was equal to 91 GPa and 92 GPa and the hysteresis loop areas were equal to 5.1 kPa and 5.2 kPa for the first and second samples, respectively. Upon cooling after 900 °C, the stress–strain deformation behavior of these LaCoO3 samples were again almost identical between each other for the cyclic tests performed at RT (Figure 3F). For these RT cycling, the Young’s moduli were equal to 64 GPa and 65 GPa for the first and second samples respectively, and the hysteresis loop areas were measured to be equal to 11.6 kPa for both samples as measured from the fourth cycle at RT after 900 °C testing.

3.3. Stress–Strain Deformation Behavior of LaCoO3 Tested at Different Conditions

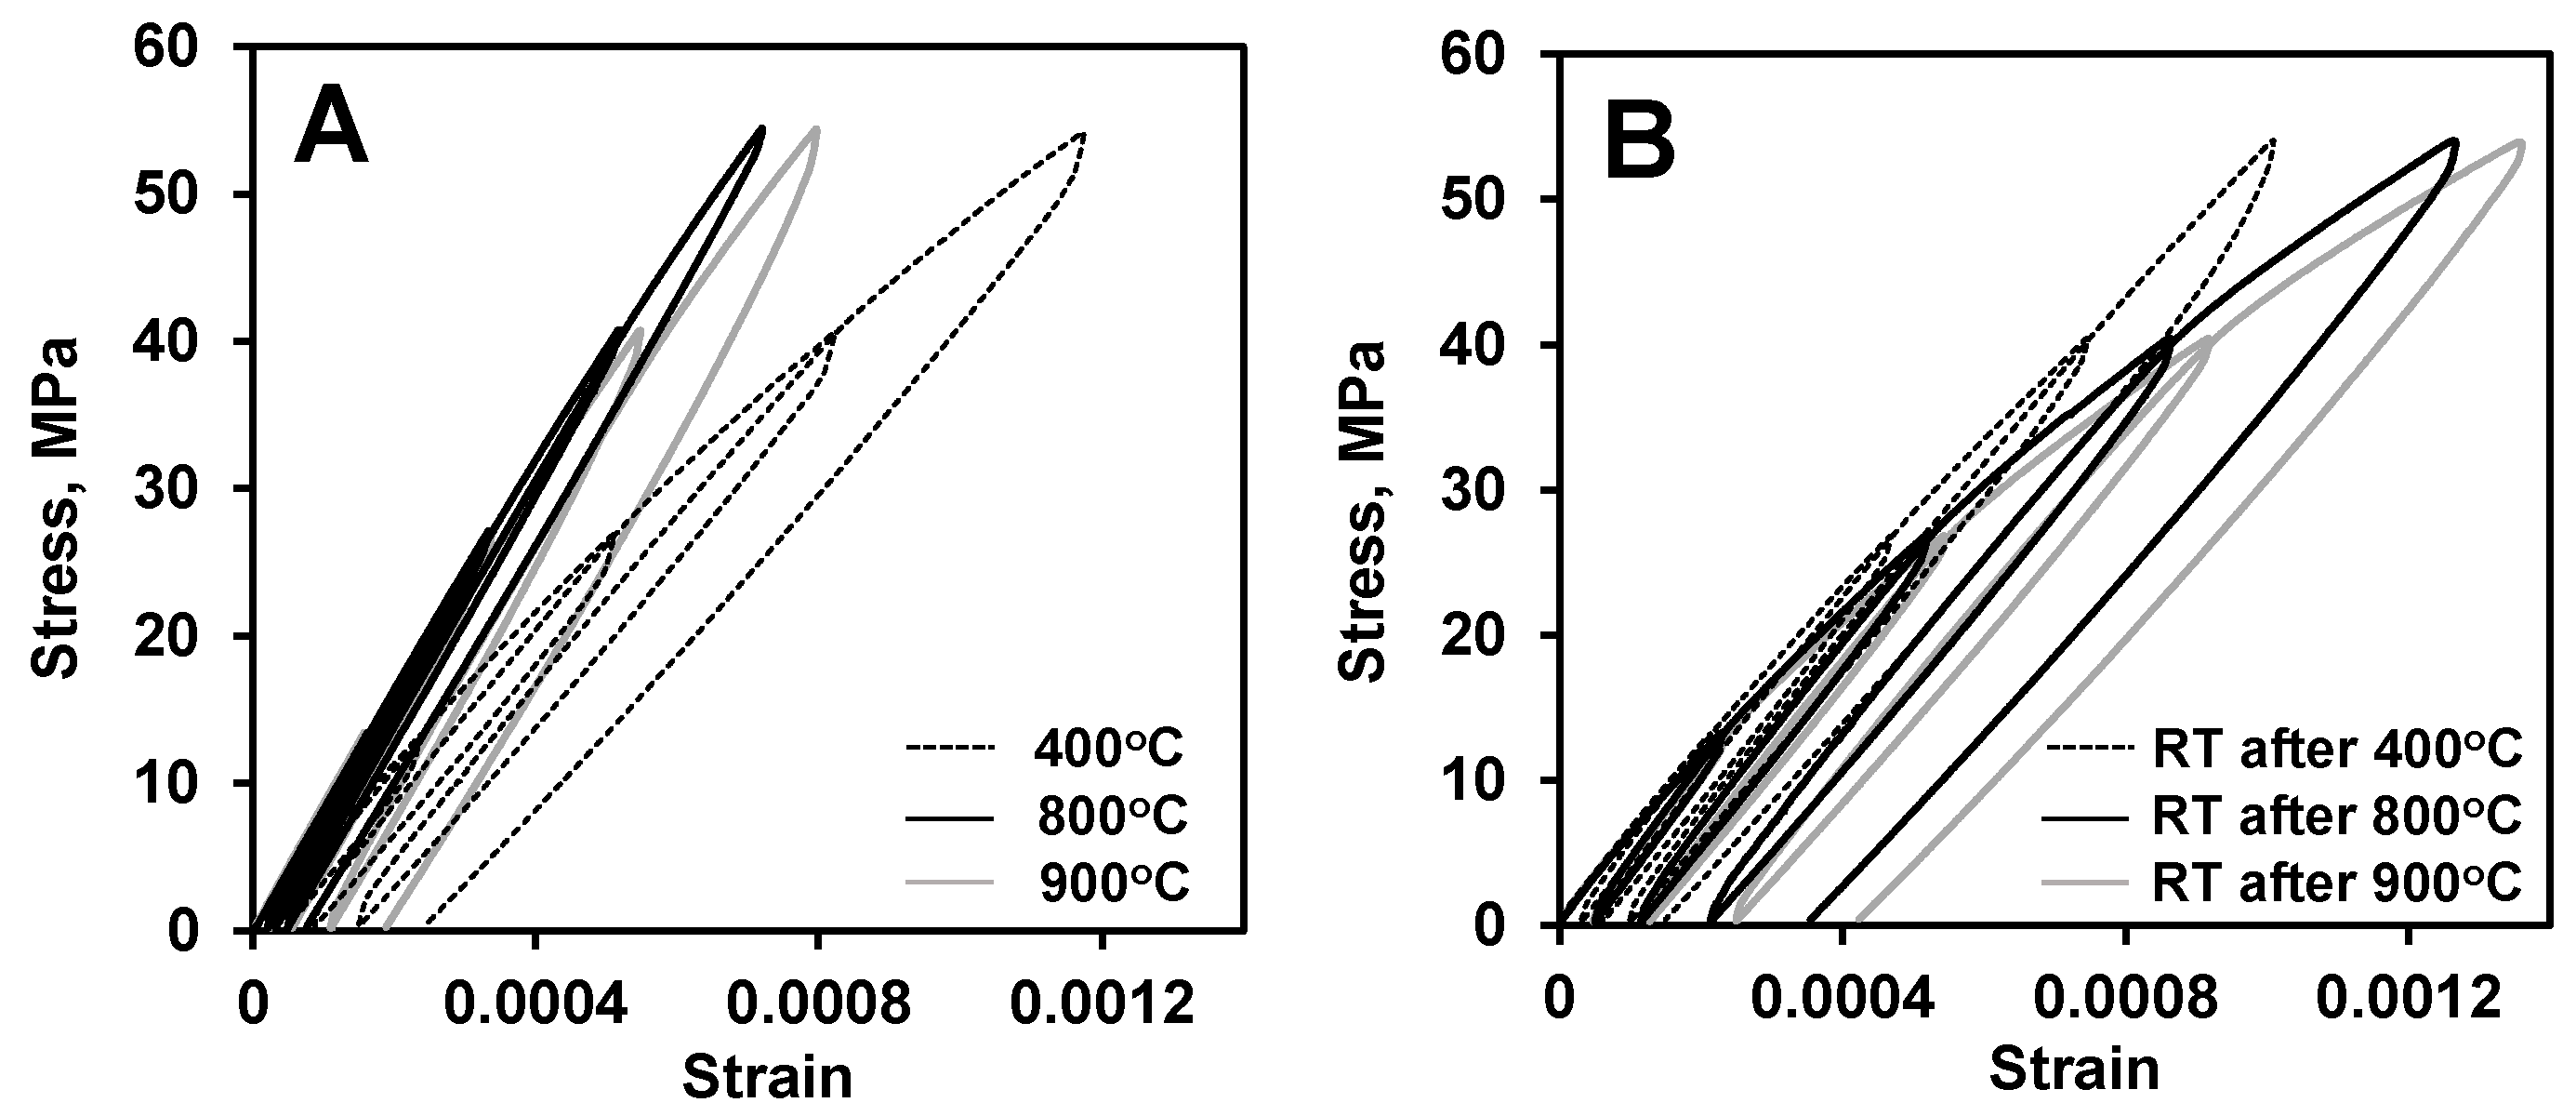
A comparison of selected stress–strain deformation curves obtained at different temperatures and heating histories of LaCoO3 sample #2 is show in Figure 4. The three stress–strain deformation plots collected at 400 °C, 800 °C, and 900 °C are shown in Figure 4A. The three corresponding stress–strain deformation plots collected at RT after cooling the sample after testing at 400 °C, 800 °C, and 900 °C are shown in Figure 4B. As one can see from Figure 4A, the most non-linear deformation upon loading of LaCoO3 occurred at 400 °C, where the Young’s modulus and hysteresis loop area were calculated from the fourth cycle to be equal to 62 GPa and 7.9 kPa, respectively. When the temperature of the test increased to 800 °C, LaCoO3 exhibited much more elastic like behavior, as compared to the stress–strain deformation exhibited at 400 °C. The material stiffened significantly, with the Young’s modulus measured from the fourth cycle to be equal to 87 GPa and corresponding hysteresis loop area decreased from 7.2 kPa at 400 °C to 2.4 kPa at 800 °C. The increase of the cycling temperature to 900 °C brings an increase in hysteresis loop areas and deviation from linearity, as compared to 800 °C, however, such an increase and more non-linear stress–strain deformation behavior occurs because of the presence of the high temperature creep (Figure 5 and Figure 6), while the Young’s modulus of LaCoO3 increased even further, as compared to 400 °C and 800 °C. The Young’s modulus of LaCoO3 at 900 °C measured from fourth cycle of stress–strain deformation curve was equal to 92 GPa and the corresponding hysteresis loop area increased from 2.4 kPa at 800 °C to 5.2 kPa at 900 °C. Thus, as one can see from Figure 4A, LaCoO3 behaves very different at 400 °C, 800 °C, and 900 °C and it exhibits a very unusual deformation behavior by showing less hysteretic and stiffer behavior at high temperature as compared to 400 °C test.
LaCoO3 sample #2 was further cycled under the same loading conditions upon cooling from each elevated temperature test, and the results of these RT cycling tests are shown in Figure 4B. As can see from Figure 4B, the RT deformation behavior of LaCoO3 is different and strongly depends on the proceeding high temperature cyclic test. Among these three selected high temperatures, the RT hysteresis loops had the smallest areas after testing at 400 °C, with a progressive increase in the hysteresis loop areas after testing at 800 °C and especially at 900 °C. For example, the RT hysteresis loop areas in the fourth cycles increased from 5 kPa measured after testing at 400 °C to 10 kPa measured after testing at 800 °C to 11.6 kPa after testing at 900 °C. However, despite such pronounced differences in hysteresis loop areas, the Young’s moduli of LaCoO3 measured for all three RT stress–strain deformation plots had very similar values and were equal to 65 GPa, 64 GPa, and 65 GPa at RT for tests performed after heating at 400 °C, 800 °C, and 900 °C, respectively.

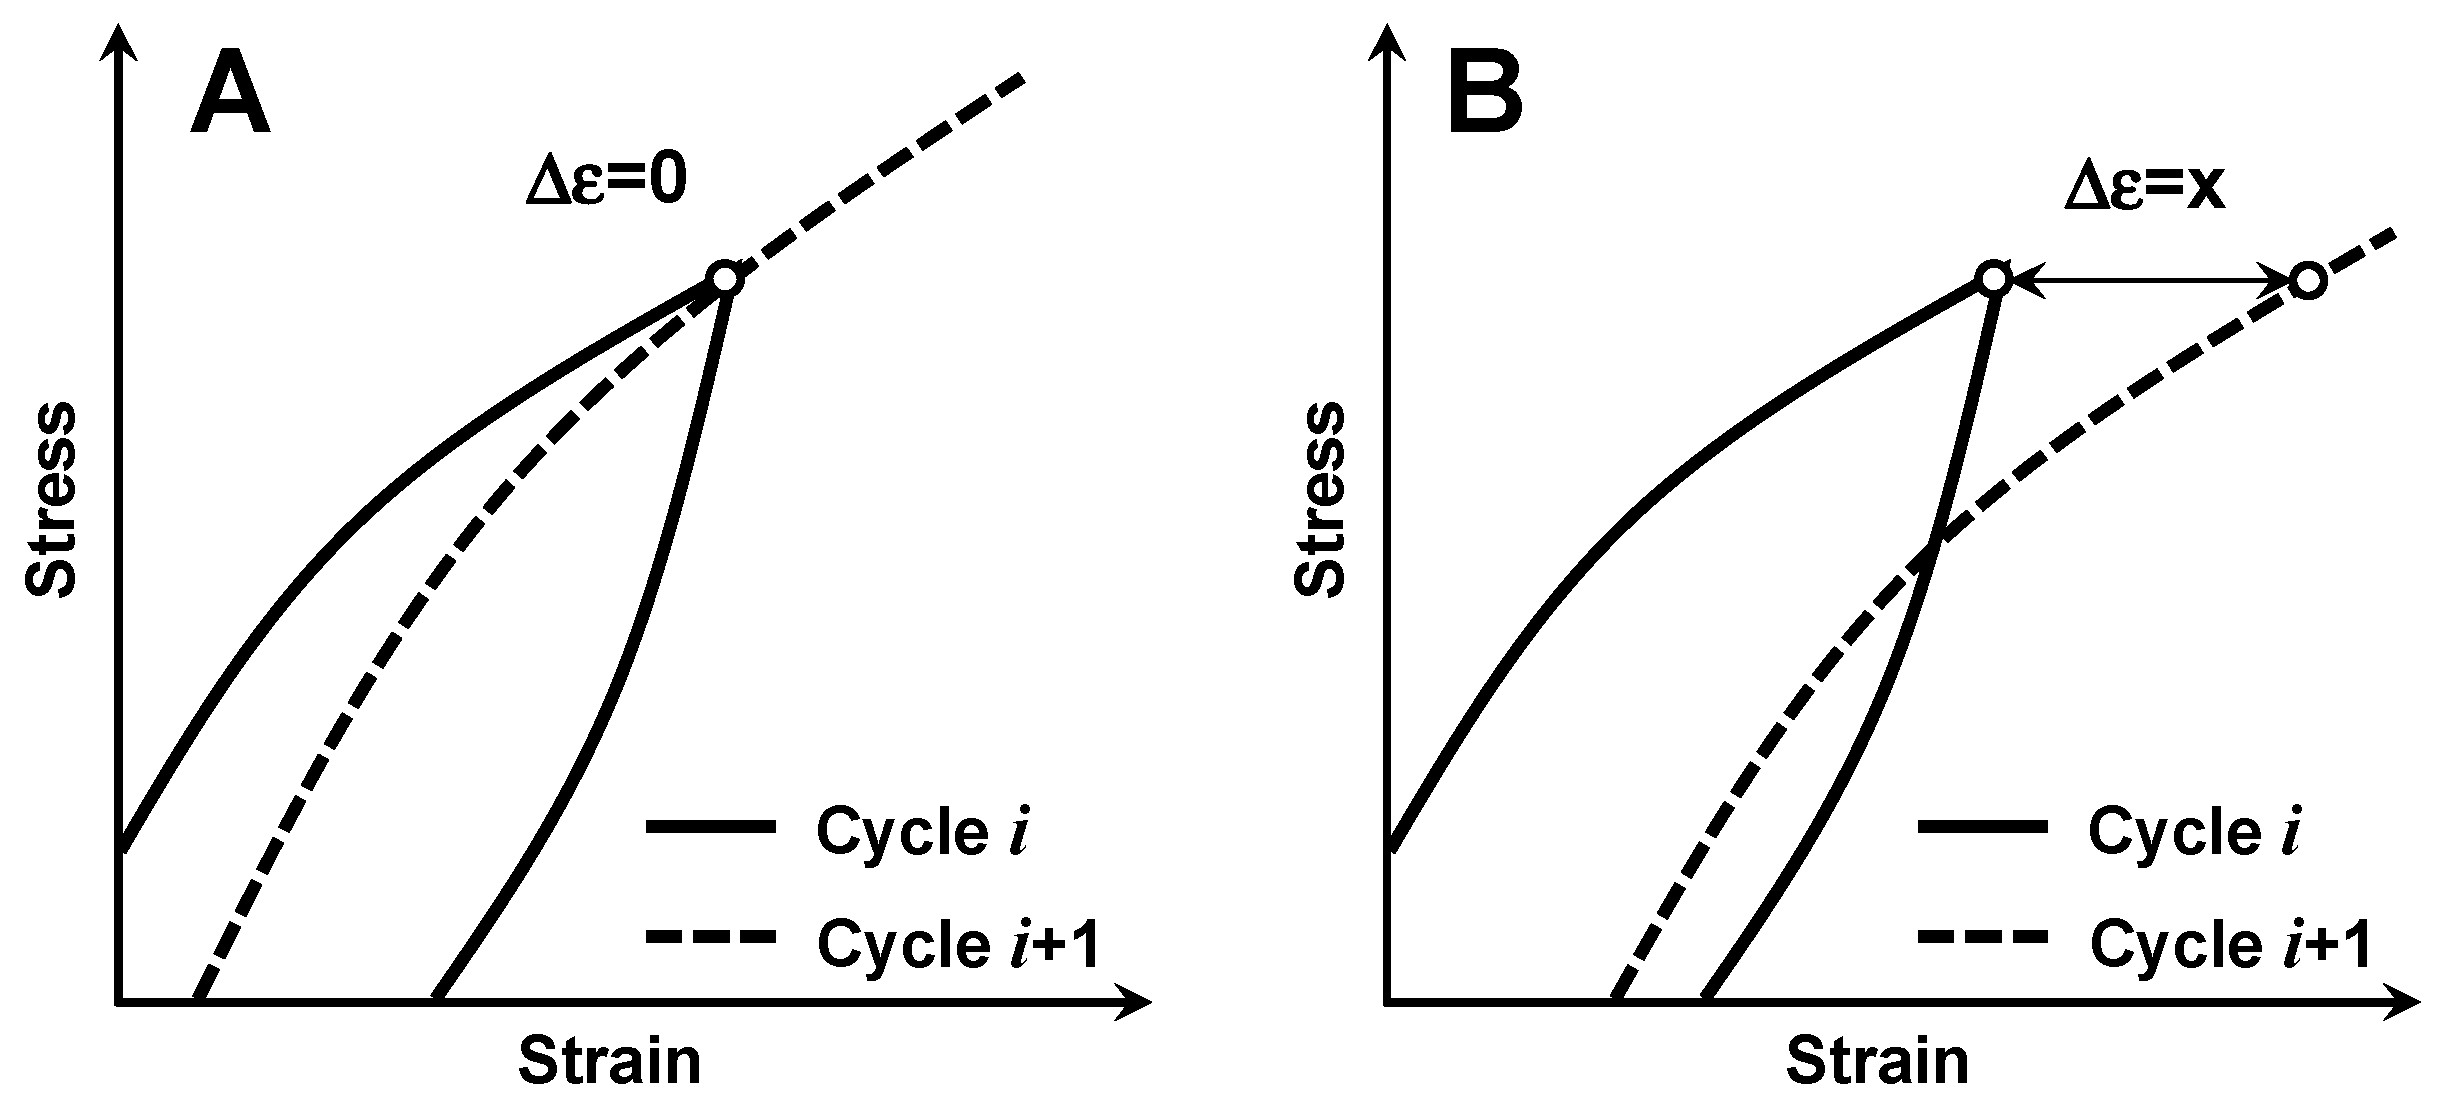
3.4. Creep Strain Shift in LaCoO3 at Different Temperatures

One interesting feature of the deformation of LaCoO3, detected both at RT and elevated temperatures, was a small amount of creep present upon cyclic testing at each temperature. The presence of this creep was pronounced in the appearance of the creep strain shift Δε between the i and i + 1 loading/unloading cycles of the ceramics, as shown in the schematics of Figure 5. For the material, where creep is absent Δε = 0 (Figure 5A), and for the material, where creep is present Δε = x (Figure 5B). While creep, as a continuous deformation of a material with time, is traditionally reported to occur at temperatures higher than 0.5 Tm, where Tm is the melting temperature of the material, it was reported that LaCoO3 experiences RT creep [16]. Such RT creep is caused by the presence of highly mobile domain walls, stacking faults, oxygen point defects and complexes, as well as other defects in LaCoO3 grains [2,17]. These defects are able to move leading to the low stiffness of the cobaltite, causing a significant measurable creep deformation upon applied stress at RT. Creep is a very complex phenomenon, and creep strain is a function of stress, loading rate, time, temperature, grain size and morphology, presence of defects and their mobility, and other material parameters [18]. It was found that RT creep in LaCoO3 and high temperature creep in metals need to be described by a different set of equations. Ferroelastic creep in LaCoO3 results in an equilibrium saturation strain and zero strain rate at a given stress, which is attributed to ferroelastic domain switching [16]. However, high temperature primary creep in metals is followed by a constant nonzero strain rate—secondary creep, and further by tertiary creep with failure at the end. Because of such behavior, a different phenomenological approach has to be used to describe RT ferroelastic creep in LaCoO3 as compared to high temperature creep in metals [16].
While high temperature creep of La0.5Sr0.5Fe1-xCoxO3-δ ceramics was studied in the 900–1050 °C temperature range in compression [17], no results for high temperature behavior of LaCoO3 have been reported. In this work, it was not originally intended to study high temperature creep deformation behavior, however, it was very easy to measure creep strain shift Δε during loading/unloading cycling of LaCoO3 at different temperatures, and therefore we would like to report our findings on Δε of LaCoO3.
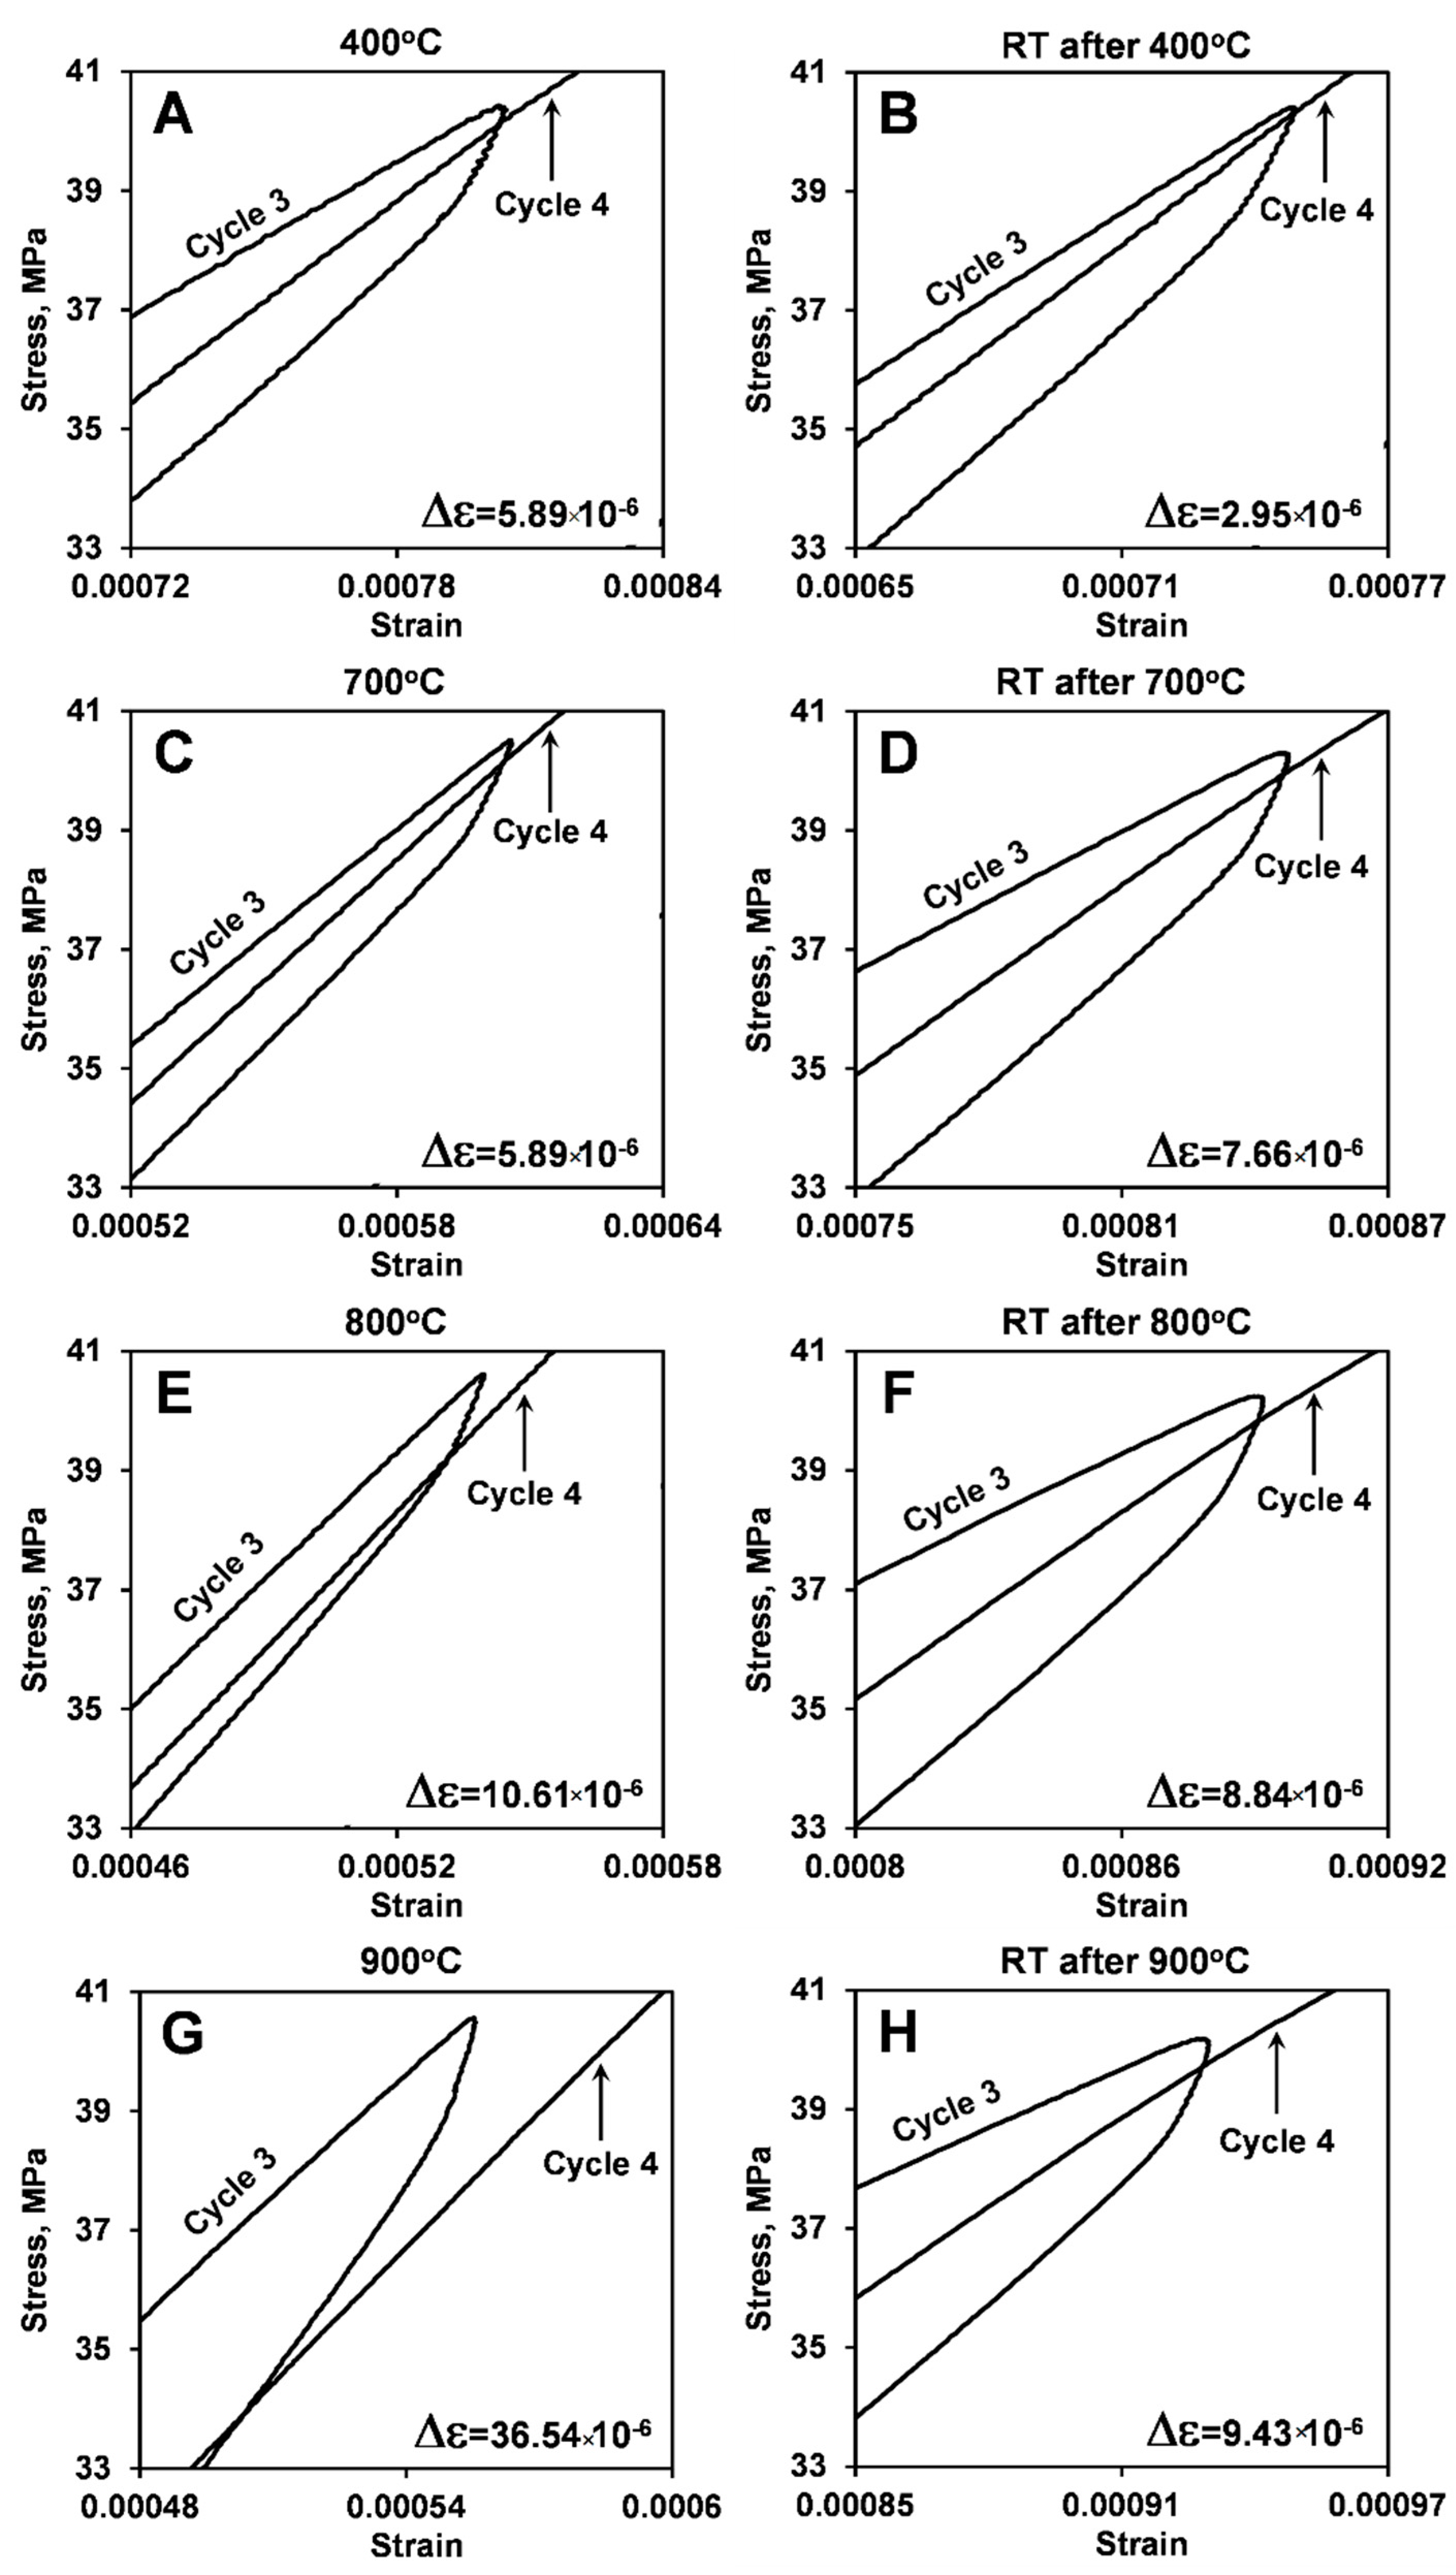
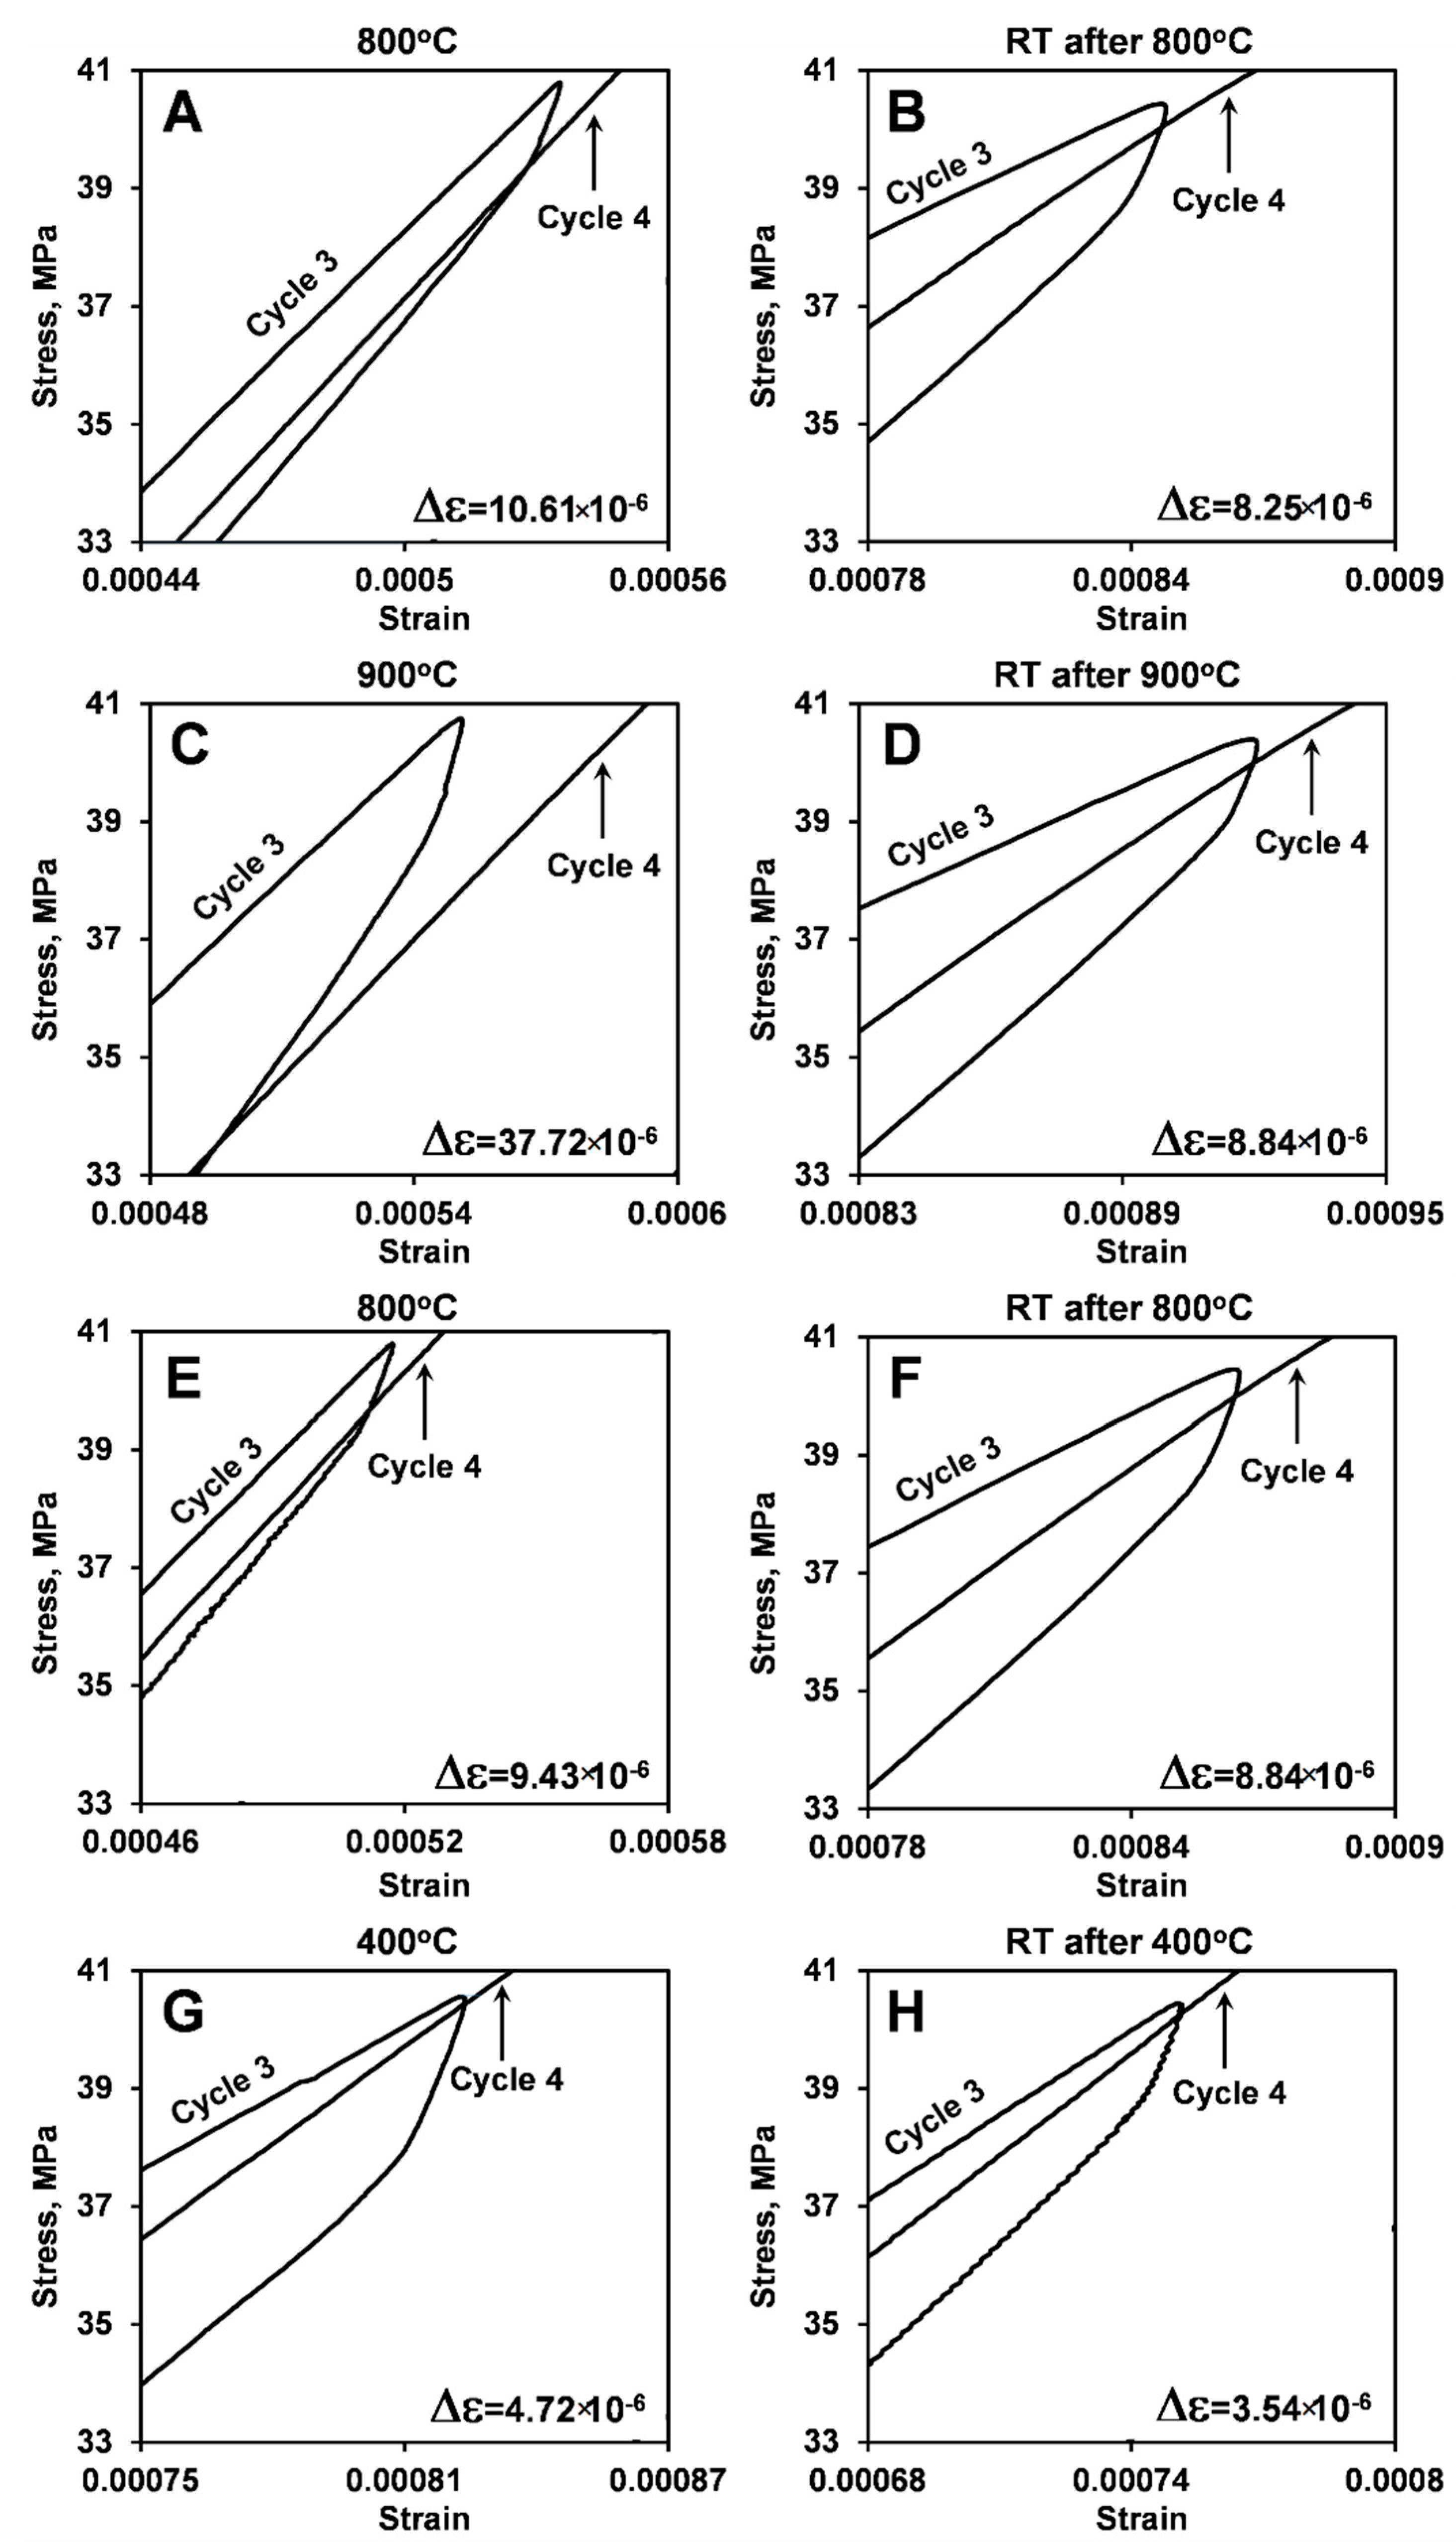
The highlights of the stress–strain deformation plots between third loading/unloading and fourth loading cycles of the two different LaCoO3 samples at different temperatures are shown in Figure 6 and Figure 7. The corresponding Δε creep strain shifts are also presented in Figure 6 and Figure 7, and are summarized in Table 3. As one can see from Figure 6 and Figure 7, the creep strain shift in LaCoO3 increased from 2.95 × 10⁻⁶ at RT to 5.89 ×10⁻⁶ at 400 °C to 10.61 ×10⁻⁶ at 800 °C to 36.54 ×10⁻⁶ at 900 °C, which is a very significant and almost exponential increase with temperature. It is important to mention that Δε showed similar values for cycling both at 400 °C and 700 °C.
By comparing Δε measured from LaCoO3 samples #1 and #2, one can see that heating history does not significantly affect the creep strain shift at high temperatures, as the values of Δε are very similar for all three tests performed at 800 °C or two tests performed at 900 °C on two different samples. A very similar Δε = 10.73 ×10⁻⁶ was also found to occur between third and fourth cycles during testing of LaCoO3 samples #3.
The preceding high temperature cycling does have a significant effect on the room temperature deformation of LaCoO3. As one can see from Figure 6 and Figure 7, it is not only that the hysteresis loop areas increase but also the RT creep strain shift Δε also increased after high temperature cycling. Comparable Δε values were found for RT cycling of LaCoO3 after tests at 400 °C, 800 °C, and 900 °C (Table 3). Therefore, the measurements of creep strain shift Δε show that LaCoO3 experiences both RT and high temperature creep deformation, and it would be of interest to study temperature effect on creep of LaCoO3 in the future.

3.5. Four-Point Bending Strength of LaCoO3

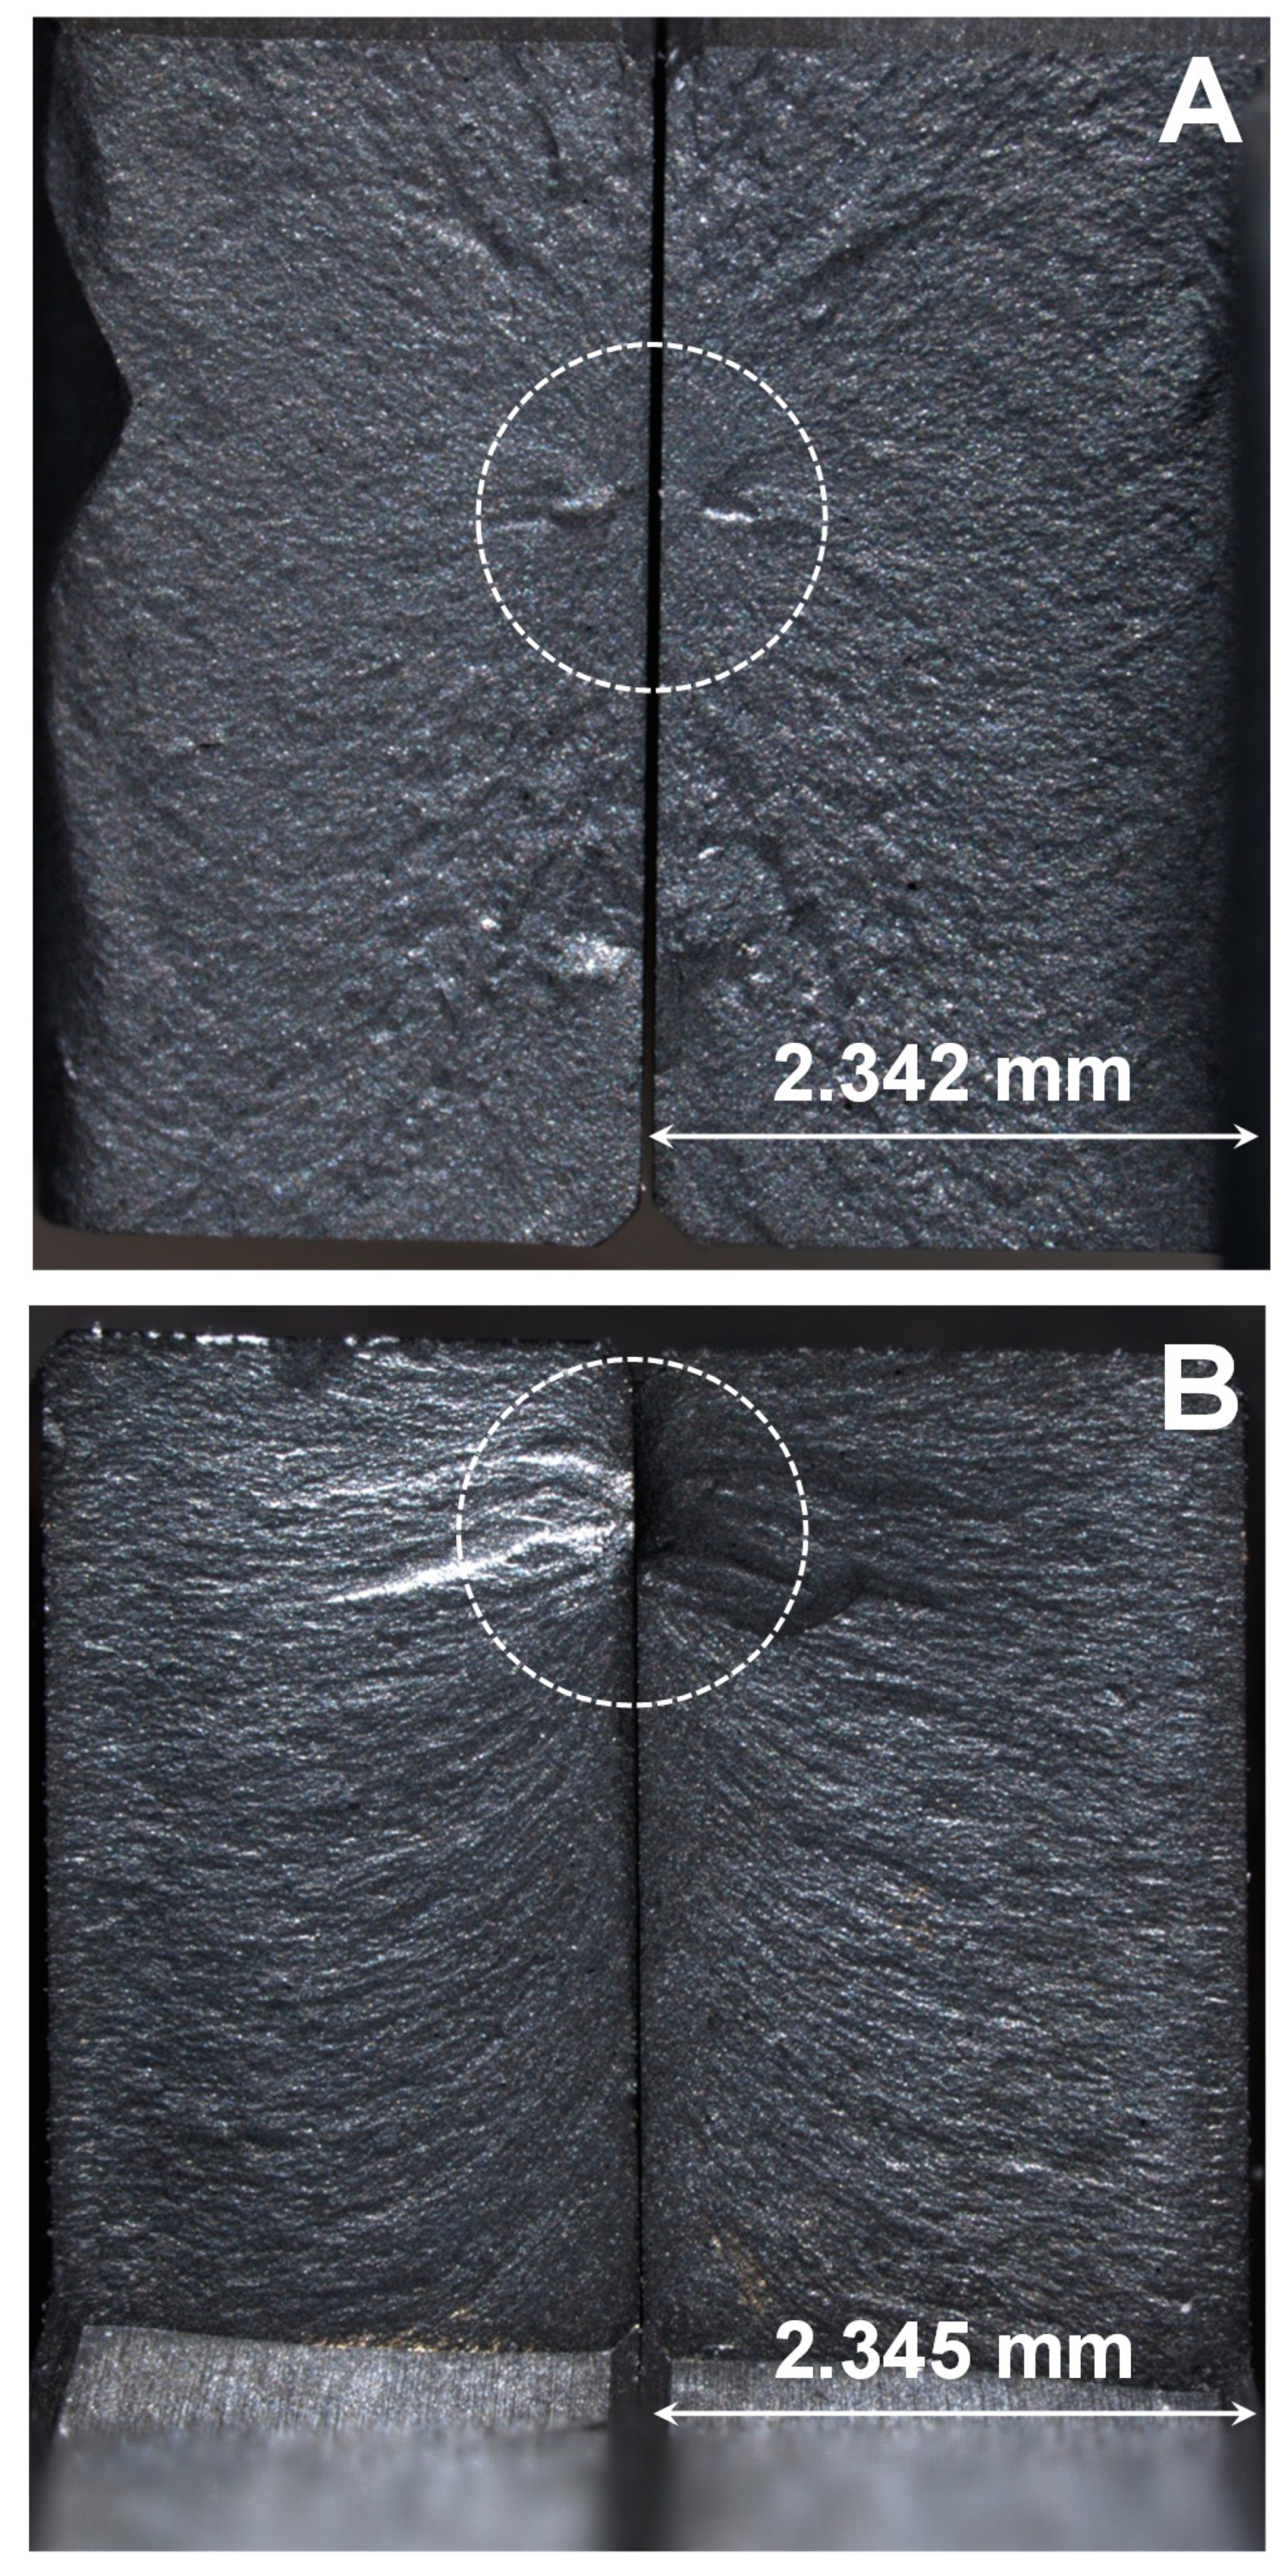
Two LaCoO3 samples (#2 and 3) were loaded at RT and 800 °C all the way to failure in order to measure their strength (Figure 8). The strength of the LaCoO3 sample tested at RT was measured to be lower, as compared to the strength of the LaCoO3 sample tested at 800 °C. One of the explanations for this difference might be that the sample tested at RT had experienced a significant loading and heating history (Figure 2B) before this final test was performed. However, it was reported in the previous work [9,11,19] that the high temperature strength of LaCoO3 was indeed either on par or even higher as compared to strength measured at RT. For example, the RT strength of LaCoO3 was reported to be equal to 53 ± 2 MPa but at 850 °C it was measured to be 50 ± 5 MPa in [15]. In [8,10] the RT strength of LaCoO3 was reported to be 86 MPa and 72 ± 10 MPa, respectively, but at 800 °C, the strength of LaCoO3 was reported to be 109 ± 19 MPa in both papers. The LaCoO3 sample #2 failed after four RT loading/unloading cycles, the LaCoO3 sample #3 tested at 800 °C was able to withstand six loading/unloading cycles. Remarkably, all of the hysteresis parameters of the stress–strain deformation curves of the LaCoO3 sample #3 tested at 800 °C (Table 4) are in complete correspondence with results obtained after testing LaCoO3 samples #1 and #2 (Table 2). The optical micrographs of the fracture surfaces of the tested LaCoO3 sample #2 at RT and LaCoO3 sample #3 tested at 800 °C are shown in Figure 9A,B, respectively. The fracture origins, which are defects responsible for the initiation of failure, are highlighted with dashed circles in Figure 9. As one can see from Figure 9, both of the samples failed in a brittle manner, characteristic of the failure of most ceramic materials.

4. Conclusions

An attempt was made to understand the effect of loading and heating history on the ferroelastic hysteretic behavior of LaCoO3 perovskite. It was established that elevated temperatures have a significant effect on stress–strain deformation, hysteresis, and creep of LaCoO3 upon cycling, which is consistent with previously reported results. However, it was determined that the stress–strain deformation plots obtained at the same elevated temperature on different samples or with different cycling histories are almost identical, regardless of previous loading and heating histories. The parameters that describe the deformation behavior of LaCoO3, such as Young’s modulus, hysteresis loop area, and creep strain shift, were all confirmed to be very similar for the samples with different loading and heating histories tested at the same elevated temperature. Therefore, it was established that the previous history of loading and heating has no or very little effect on deformation behavior of LaCoO3 tested at the same elevated temperature.
The same congruence of the results has been determined to occur for the tests performed at RT after cycling at predetermined elevated temperature. It was found that the previous history of the LaCoO3 deformation did not affect the RT stress–strain behavior, however, the elevated temperature, which directly preceded the RT test, plays a tremendous role. The increase in the temperature of the mechanical test from 400 to 900 °C resulted in a significant increase in the hysteresis loop areas and creep strain shift of the stress–strain deformation curves. However, the RT Young’s modulus of LaCoO3 remains the same, regardless of the history of the previous elevated temperature tests.
According to the results obtained in this work, it is clear that at elevated temperatures the Young’s modulus increases and LaCoO3 became more linear-elastic as compared to its RT deformation behavior. However, as shown in the current work, LaCoO3 can withstand a higher number of loading/unloading cycles before complete failure at high temperature as compared to the RT cycling. The 4-point bending strength of LaCoO3 was determined to be higher in comparison with RT strength, similar to the increase in Young’s modulus.

Author Contributions

Investigation, M.L., D.V., N.O. and J.K.; Supervision, T.G. and J.K.; Writing—original draft, M.L., D.V., M.R., G.B. and N.O.; Writing—review & editing, T.G., M.R. and G.B. All authors have read and agreed to the published version of the manuscript.

Funding

This research was funded by the Swiss National Science Foundation via the International Short Visit fellowship (Decision IZK0Z2_173502/1) and via the Scientific Exchanges grants (proposal MENDEL).

Institutional Review Board Statement

Not applicable.

Informed Consent Statement

Not applicable.

Data Availability Statement

The data presented in this study are available on request from the corresponding authors.

Conflicts of Interest

The authors declare no conflict of interest. The funders had no role in the design of the study; in the collection, analyses, or interpretation of data; in the writing of the manuscript, or in the decision to publish the results.

References

  1. Kleveland, K.; Orlovskaya, N.; Grande, T.; Mardal Moe, A.M.; Einarsrud, M.-A.; Breder, K.; Gogotsi, G. Ferroelastic Behavior of LaCoO3-Based Ceramics. J. Am. Ceram. Soc. 2001, 84, 2029–2033. [Google Scholar] [CrossRef]
  2. Orlovskaya, N.; Gogotsi, Y.; Reece, M.; Cheng, B.; Gibson, I. Ferroelasticity and hysteresis in LaCoO3 based perovskites. Acta Mater. 2002, 50, 715–723. [Google Scholar] [CrossRef]
  3. Faaland, S.; Grande, T.; Einarsrud, M.A.; Vullum, P.E.; Holmestad, R. Stress-strain behavior during compression of polycrystalline La1-xCaxCoO3 ceramics. J. Am. Ceram. Soc. 2005, 88, 726–730. [Google Scholar] [CrossRef]
  4. Vullum, P.E.; Mastin, J.; Wright, J.; Einarsrud, M.A.; Holmestad, R.; Grande, T. In situ synchrotron X-ray diffraction of ferroelastic La0.8Ca0.2CoO3 ceramics during uniaxial compression. Acta Mater. 2006, 54, 2615–2624. [Google Scholar] [CrossRef]
  5. Aman, A.; Chen, Y.; Lugovy, M.; Orlovskaya, N.; Reece, M.J.; Ma, D.; Stoica, A.D.; An, A. In-situ neutron diffraction of LaCoO3 perovskite under uniaxial compression. I. Crystal structure analysis and texture development. J. Appl. Phys. 2014, 116, 013503. [Google Scholar] [CrossRef]
  6. Lugovy, M.; Aman, A.; Chen, Y.; Orlovskaya, N.; Kuebler, J.; Graule, T.; Reece, M.J.; Ma, D.; Stoica, A.D.; An, K. In-situ neutron diffraction of LaCoO3 perovskite under uniaxial compression. II. Elastic properties. J. Appl. Phys. 2014, 116, 013504. [Google Scholar] [CrossRef]
  7. Aman, A.; Jordan, R.; Chen, Y.; Stadelmann, R.; Lugovy, M.; Orlovskaya, N.; Payzant, E.A.; Cruz, C.D.; Reece, M.J.; Graule, T.; et al. Non-congruence of high-temperature mechanical and structural behaviors of LaCoO3 based perovskites. J. Eur. Ceram. Soc. 2017, 37, 1563–1576. [Google Scholar] [CrossRef] [Green Version]
  8. Zhou, J.-S.; Yan, J.-Q.; Goodenough, J.B. Bulk modulus anomaly in RCoO3 (R = La, Pr, and Nd). Phys. Rev. B 2005, 71, 220103(R). [Google Scholar] [CrossRef]
  9. Orlovskaya, N.; Lugovy, M.; Pathak, S.; Steinmetz, D.; Lloyd, J.; Fegely, L.; Radovic, M.; Payzant, A.; Lara-Curzio, E.; Allard, L.; et al. Thermal and mechanical properties of LaCoO3 and La0.8Ca0.2CoO3 perovskites. J. Power Sources 2008, 182, 230–239. [Google Scholar] [CrossRef]
  10. Orlovskaya, N.; Lugovy, M.; Verbylo, D.; Reece, M.J.; Graule, T.; Kuebler, J. High temperature stiffening of ferroelastic LaCoO3. J. Eur. Ceram. Soc. 2019, 39, 3338–3343. [Google Scholar] [CrossRef]
  11. Pathak, S.; Kuebler, J.; Payzant, A.; Orlovskaya, N. Mechanical behavior and electrical conductivity of La1−xCaxCoO3 (x = 0, 0.2, 0.4, 0.55) perovskites. J. Power Sources 2010, 195, 3612–3620. [Google Scholar] [CrossRef]
  12. Raccah, P.M.; Goodenough, J.B. First-Order Localized-Electron ⇆ Collective-Electron Transition in LaCoO3. Phys. Rev. 1967, 155, 932–943. [Google Scholar] [CrossRef]
  13. Señarís-Rodríguez, M.A.; Goodenough, J.B. LaCoO3 revisited. J. Solid State Chem. 1995, 116, 224–231. [Google Scholar] [CrossRef]
  14. Meena, P.L.; Kumar, R.; Sreenivas, K. Structural, elastic and magnetic properties of spinel Co3O4. Indian J. Pure Appl. Phys. (IJPAP) 2018, 56, 890–895. [Google Scholar]
  15. European Committee for Standardization, Advanced Technical Ceramics—Mechanical Properties of Monolithic Ceramics at Room Temperature—Part 1: Determination of Flexural Strength; EN 843-1; CEN: Brussels, Belgium, 2006.
  16. Lugovy, M.; Slyunyayev, V.; Orlovskaya, N.; Verbylo, D.; Reece, M.J. Room-temperature creep of LaCoO3-based perovskites: Equilibrium strain under compression. Phys. Rev. B 2008, 78, 024107. [Google Scholar] [CrossRef]
  17. Lein, H.L.; Wiik, K.; Einarsrud, M.-A.; Grande, T. High-temperature creep behavior of mixed conducting La0.5Sr0.5Fe1-x Cox O3-d materials. J. Am. Ceram. Soc. 2006, 89, 2895–2898. [Google Scholar] [CrossRef]
  18. Barsoum, M.W. Fundamentals of Ceramics; Institute of Physics: Bristol, UK, 2003. [Google Scholar]
  19. Orlovskaya, N.; Kleveland, K.; Grande, T.; Einarsrud, M.-A. Mechanical proprties of LaCoO3 based ceramics. J. Eur. Ceram. Soc. 2000, 20, 51–56. [Google Scholar] [CrossRef]
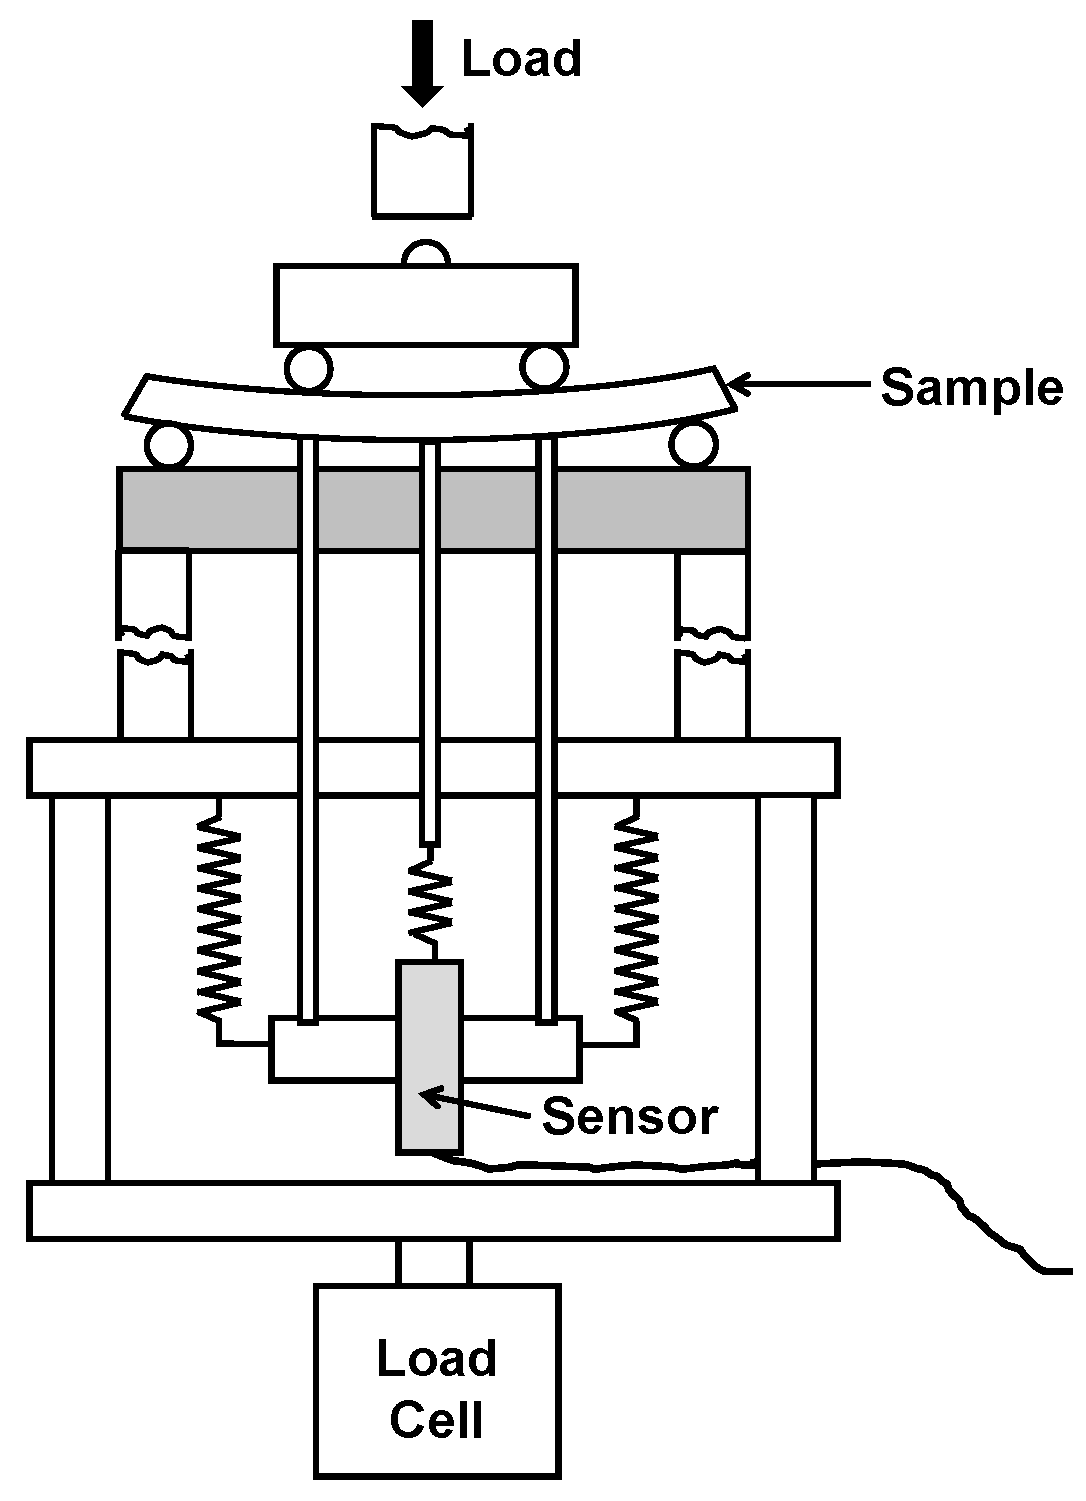
Figure 1. A schematic presentation of a 4-point bending set up. The load is applied by a 2 kN load cell and the deflection is measured by a 3-rod measurement system, where a sensor collects deflection data directly from the sample’s surface under tension.
Materials 14 03543 g001
Figure 2. Stress–strain deformation plots of LaCoO3 sample #1 (A) and sample #2 (B) showing the corresponding heating history of the cyclic loading. The stress–strain plots performed at elevated temperatures are shown using a solid line, while room temperature stress–strain deformation plots collected after corresponding high temperature experiments are shown with a dotted line.
Materials 14 03543 g002
Figure 3. A comparison of different heating history stress–strain deformation plots of LaCoO3 sample #1 and sample #2 at: (A) 400 °C; (B) RT after 400 °C; (C) 800 °C; (D) RT after 800 °C; (E) 900 °C; (F) RT after 900 °C.
Materials 14 03543 g003
Figure 4. A comparison of stress–strain plots of LaCoO3 sample #2 tested (A) at elevated and (B) at room temperature. LaCoO3 sample tested at 900 °C (A) experienced the previous loading at 800 °C and RT, at 800 °C (A) experienced the previous loading at 800 °C, RT, 900 °C, and RT, and at 400 °C (A) experienced the previous loading at 800 °C, RT, 900 °C, RT, 800 °C, and RT. The same LaCoO3 sample tested at RT (B) experienced the 800 °C and RT previous loading when tested at RT after 900 °C; 800 °C, RT, 900 °C, and RT previous loading when tested at RT after 800 °C; and 800 °C, RT, 900 °C, RT, 800 °C and RT previous loading when tested at RT after 400 °C.
Materials 14 03543 g004
Figure 5. A schematic presentation of cyclic stress–strain deformation behavior indicating absence of creep strain shift Δε = 0 (A) and presence of creep strain shift Δε = x (B).
Materials 14 03543 g005
Figure 6. Portions of cycle 3 loading/unloading and cycle 4 loading stress-strain deformation plots of LaCoO3 sample #1 showing the presence of creep strain shift Δε at testing performed at different temperatures: (A) 400 °C; (B) RT after 400 °C; (C) 700 °C; (D) RT after 700 °C; (E) 800 °C; (F) RT after 800 °C; (G) 900 °C; (H) RT after 900 °C. The corresponding values of Δε are shown in Table 3.
Materials 14 03543 g006
Figure 7. Portions of cycle 3 loading/unloading and cycle 4 loading stress-strain deformation plots of LaCoO3 sample #2 showing the presence of creep strain shift Δε at testing performed at different temperatures: (A) 800 °C; (B) RT after 800 °C; (C) 900 °C; (D) RT after 900 °C; (E) 800 °C; (F) RT after 800 °C; (G) 400 °C; (H) RT after 400 °C. The corresponding values of Δε are shown in Table 3.
Materials 14 03543 g007
Figure 8. Four-point bending stress–strain deformation plots of LaCoO3 sample #2 at RT and sample #3 at 800 °C. The cross sign (×) indicates a moment of fracture of the samples.
Materials 14 03543 g008
Figure 9. Optical micrographs of fracture surfaces of sample #2 failed at RT (A) and sample #3 failed at 800 °C (B).
Materials 14 03543 g009
Table 1. Heating histories of three LaCoO3 samples.
Sample #Temperatures of Cycling Loading
1RT–400 °C–RT–700 °C–RT–800 °C–RT–900 °C–RT
2800 °C–RT–900 °C–RT–800 °C–RT–400 °C–RT
3800 °C
Table 2. Young’s moduli and hysteresis loop areas of two LaCoO3 samples calculated at four different loading/unloading cycles at different temperatures.
Sample #T, °CE, GPaHysteresis Loop Area, kPa
CycleCycle
12341234
1RT676968670.260.712.156.30
400656764620.431.433.456.90
RT656967660.341.132.545.20
700737576750.220.701.613.30
RT666967660.461.824.328.60
800838484830.180.541.272.60
RT656867650.492.165.2310.20
900879090910.240.942.455.10
RT646767640.522.305.7911.60
2800838484830.180.541.272.60
RT646867650.321.535.2410.50
900889192920.240.942.525.20
RT656867650.512.315.8511.60
800858787870.180.521.172.40
RT667168640.502.085.1210.00
400606763620.511.723.967.90
RT656767650.371.272.855.00
Table 3. The creep strain shift Δε of two LaCoO3 samples calculated at loading/unloading cycle 3 and loading cycle 4 at different temperatures.
LaCoO3 Sample #1LaCoO3 Sample #2
T, °CΔε at TΔε at RT after TT, °CΔε at TΔε at RT after T
RT2.95 ×10−6----
4005.89 ×10−62.95 ×10−680010.61 ×10−68.25 ×10⁻⁶
7005.89 ×10−67.66 ×10−690037.72 ×10−68.84 ×10⁻⁶
80010.61 ×10−68.84 ×10−68009.43 ×10−68.84 ×10⁻⁶
90036.54 ×10−69.43 ×10−64004.72 ×10−63.54 ×10⁻⁶
Table 4. Young’s moduli, hysteresis loop areas and creep strain shift parameters characterizing stress–strain deformation behavior of LaCoO3 sample #3.
LaCoO3 Sample #3, 800 °C
# Cycleσmax, MPaE, GPaHysteresis Loop Area, kPaCreep Strain Shift Δε
113.50840.183.54 ×10−6
227.00850.565.89 ×10−6
340.50841.3310.73 ×10−6
454.00832.7415.32 ×10−6
567.50825.0122.40 ×10−6
681.00818.2631.83 ×10−6
Publisher’s Note: MDPI stays neutral with regard to jurisdictional claims in published maps and institutional affiliations.