
Effects of PCE on the Dispersion of Cement Particles and Initial Hydration


Abstract
1. Introduction
2. Materials and Methods
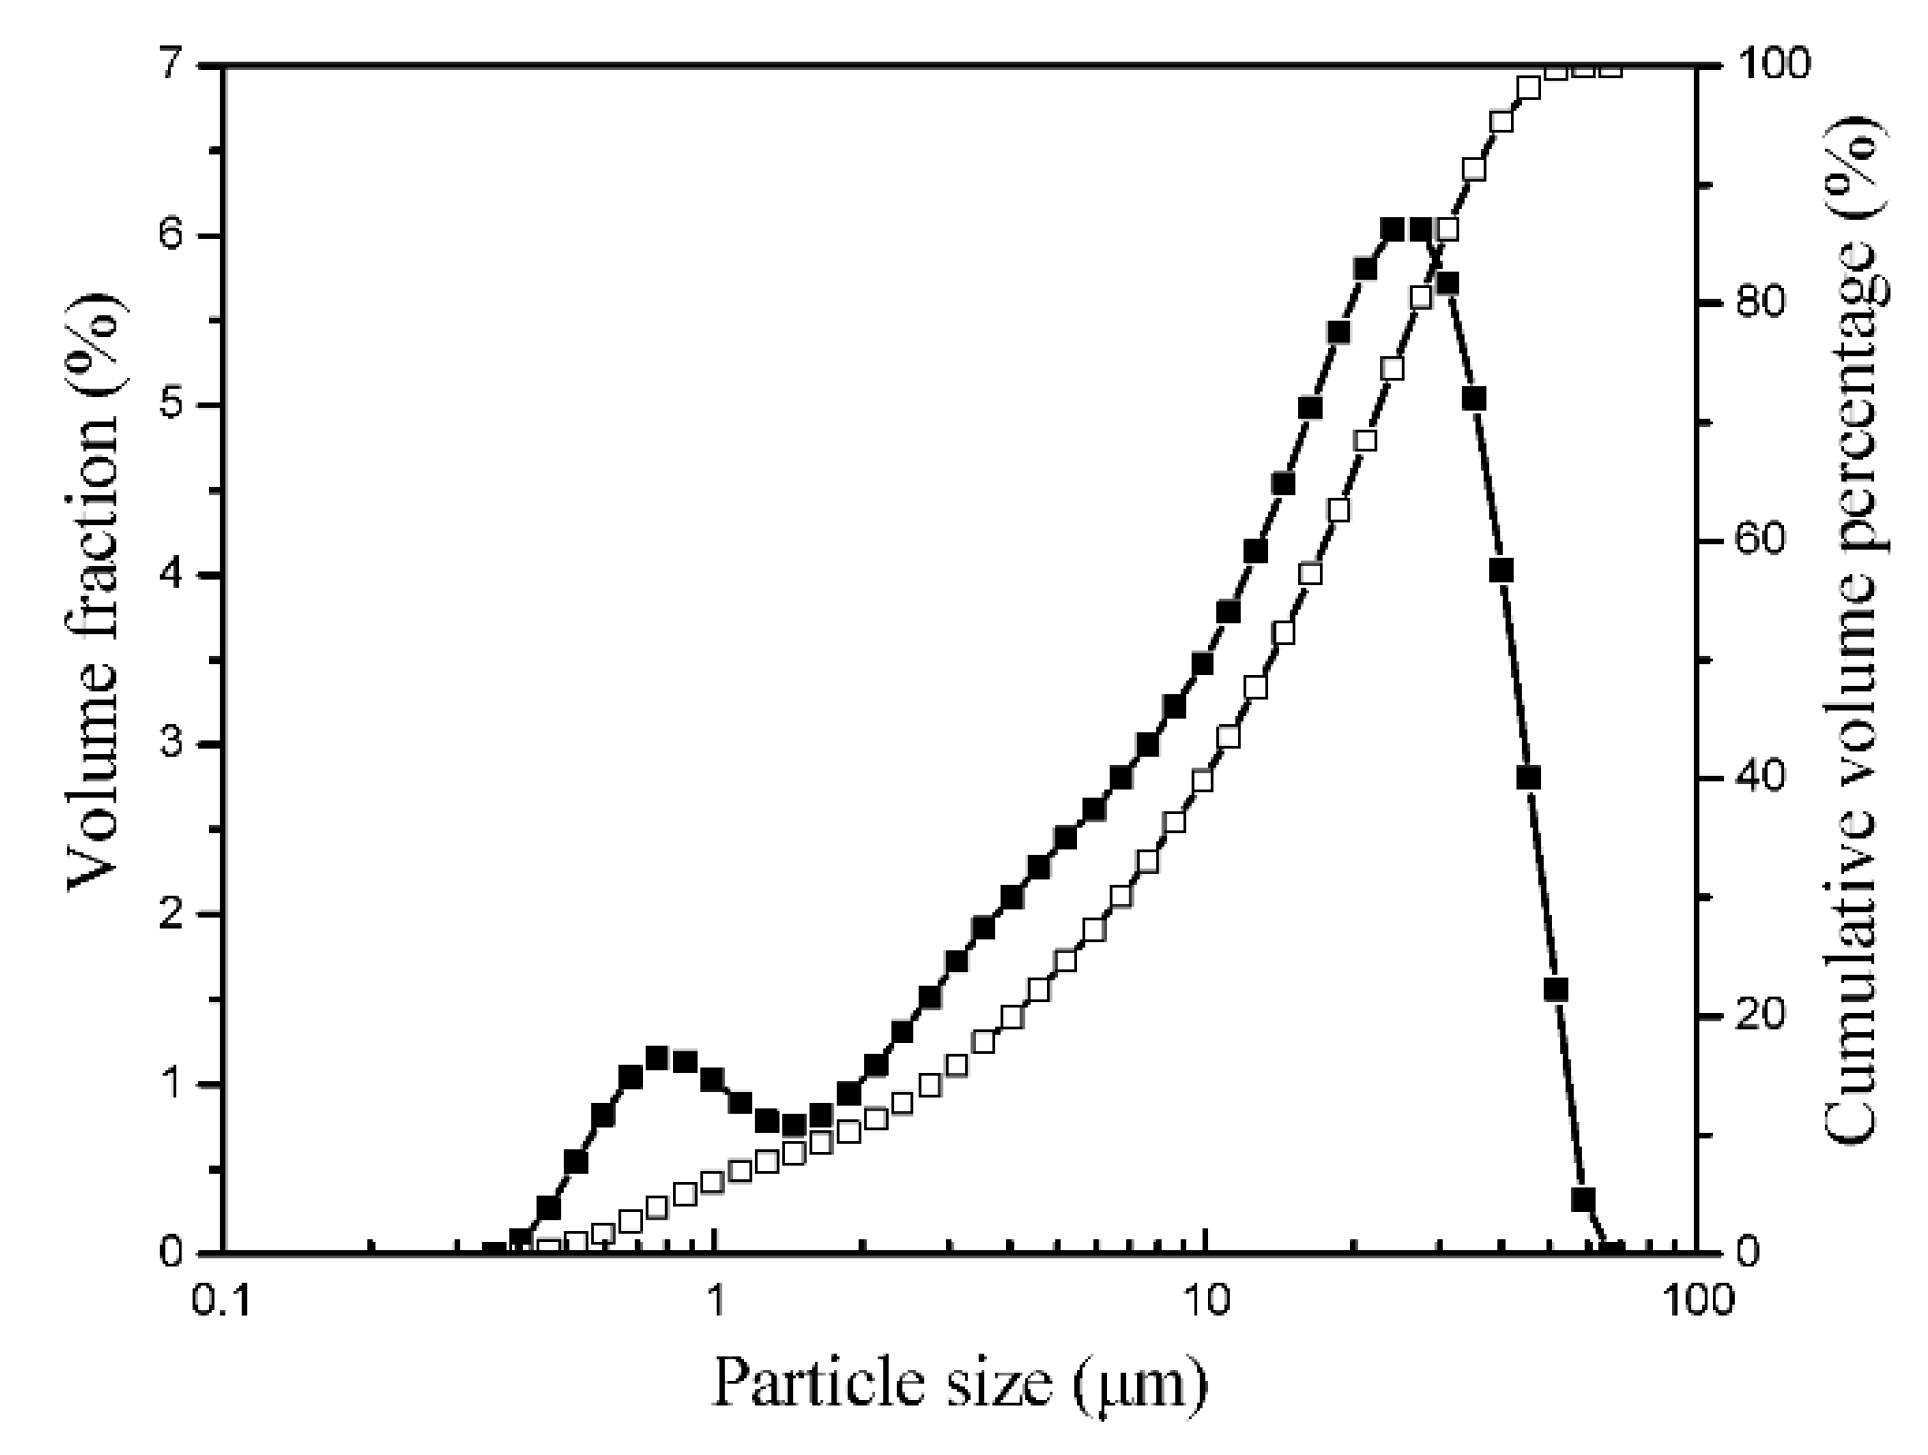
2.1. Materials
2.2. Mix Design
2.3. Testing Methods
2.3.1. Determination of the Packing Density and WFT
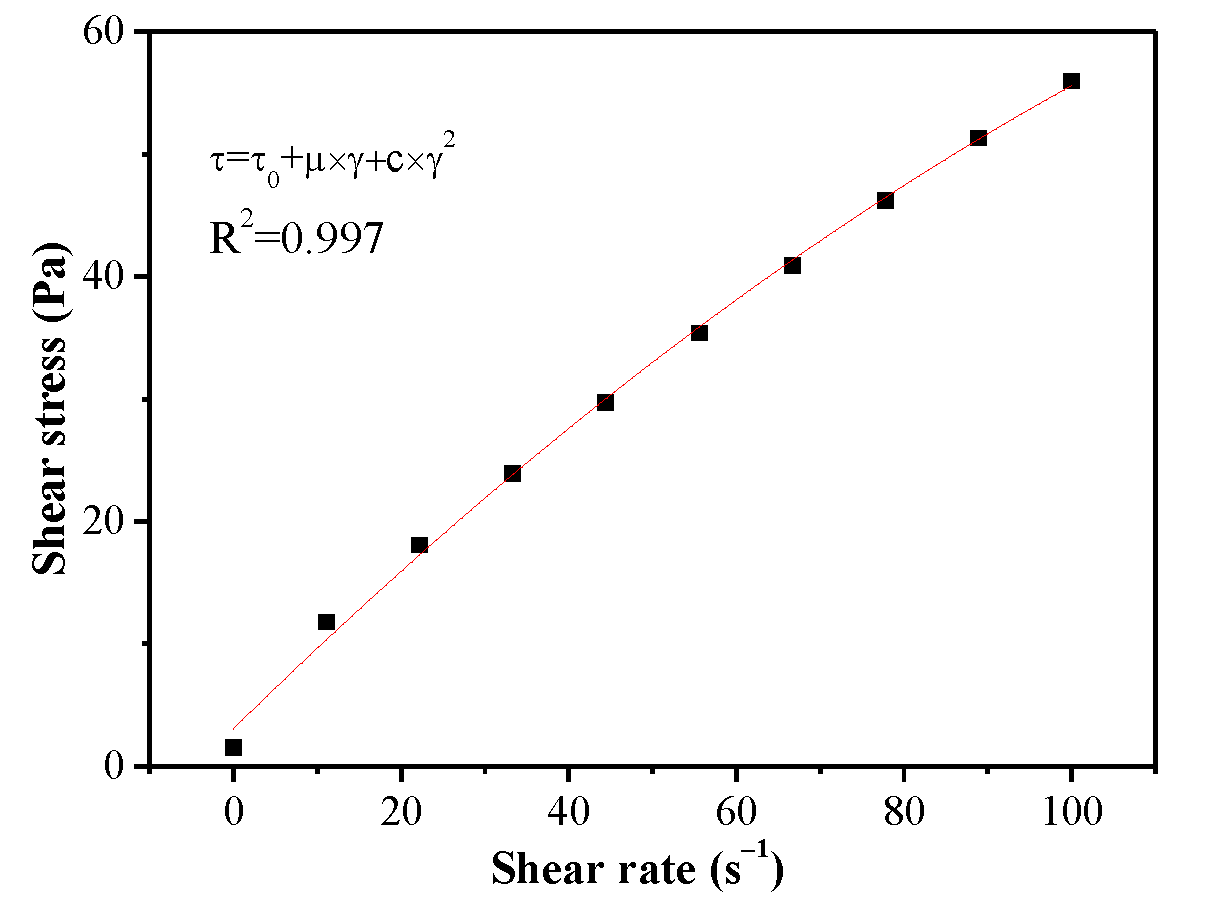
2.3.2. Yield Stress and Plastic Viscosity
2.3.3. Fluidity of Fresh Cement Pastes
2.3.4. Adsorption Amount
2.3.5. Zeta Potential
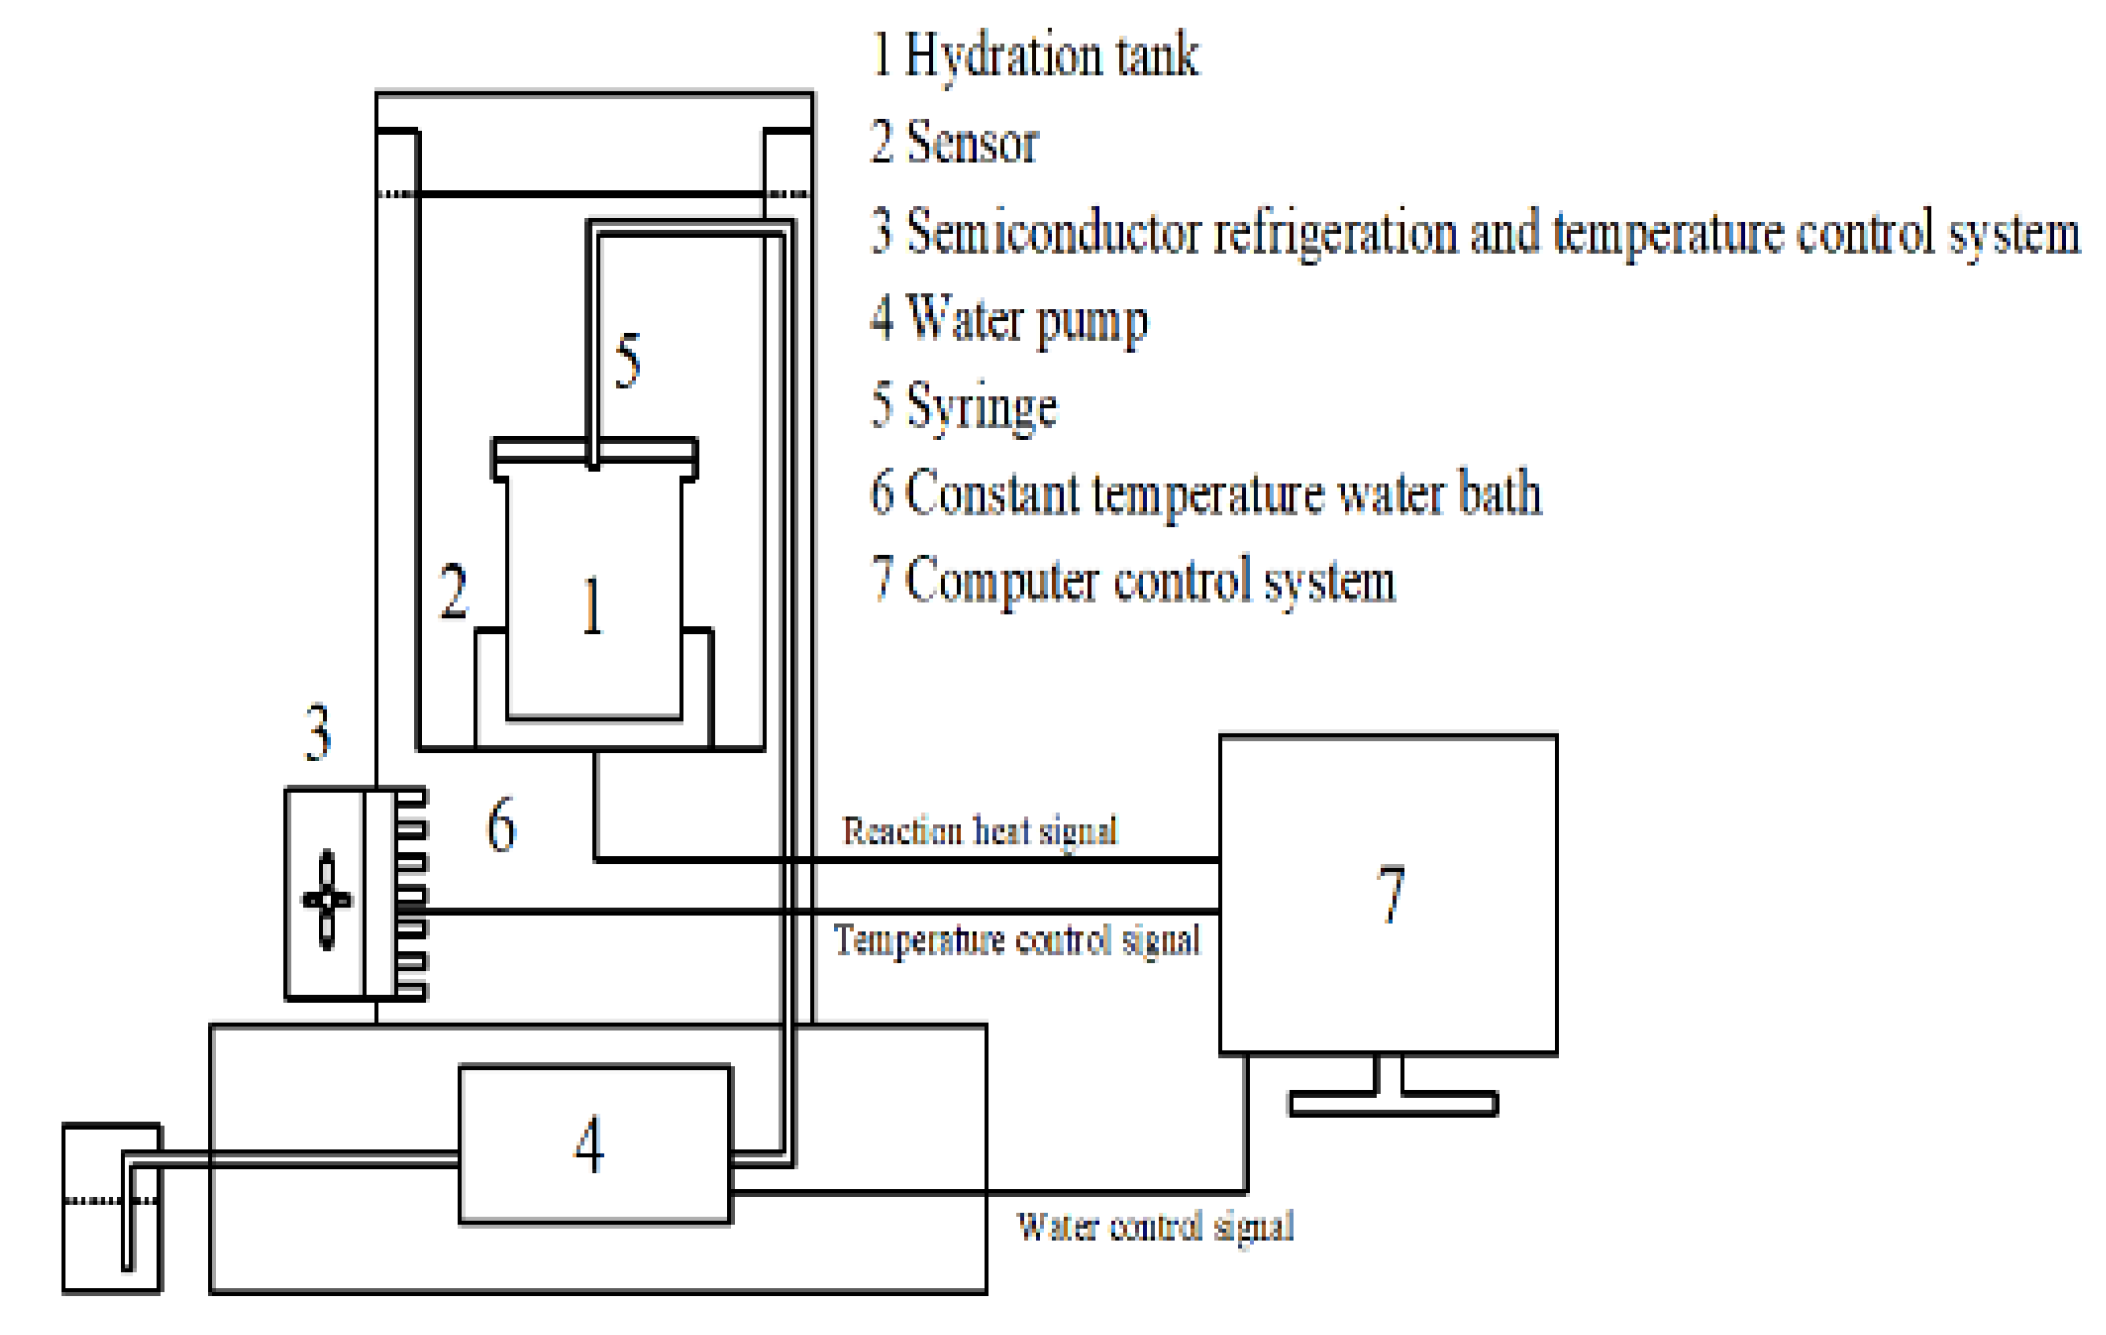
2.3.6. Isothermal Calorimeter
2.3.7. Hydration Termination of the Hydrating Cement Pastes
2.3.8. Chemically Bound Water
2.3.9. XRD
2.3.10. TG Analysis
3. Results and Discussion
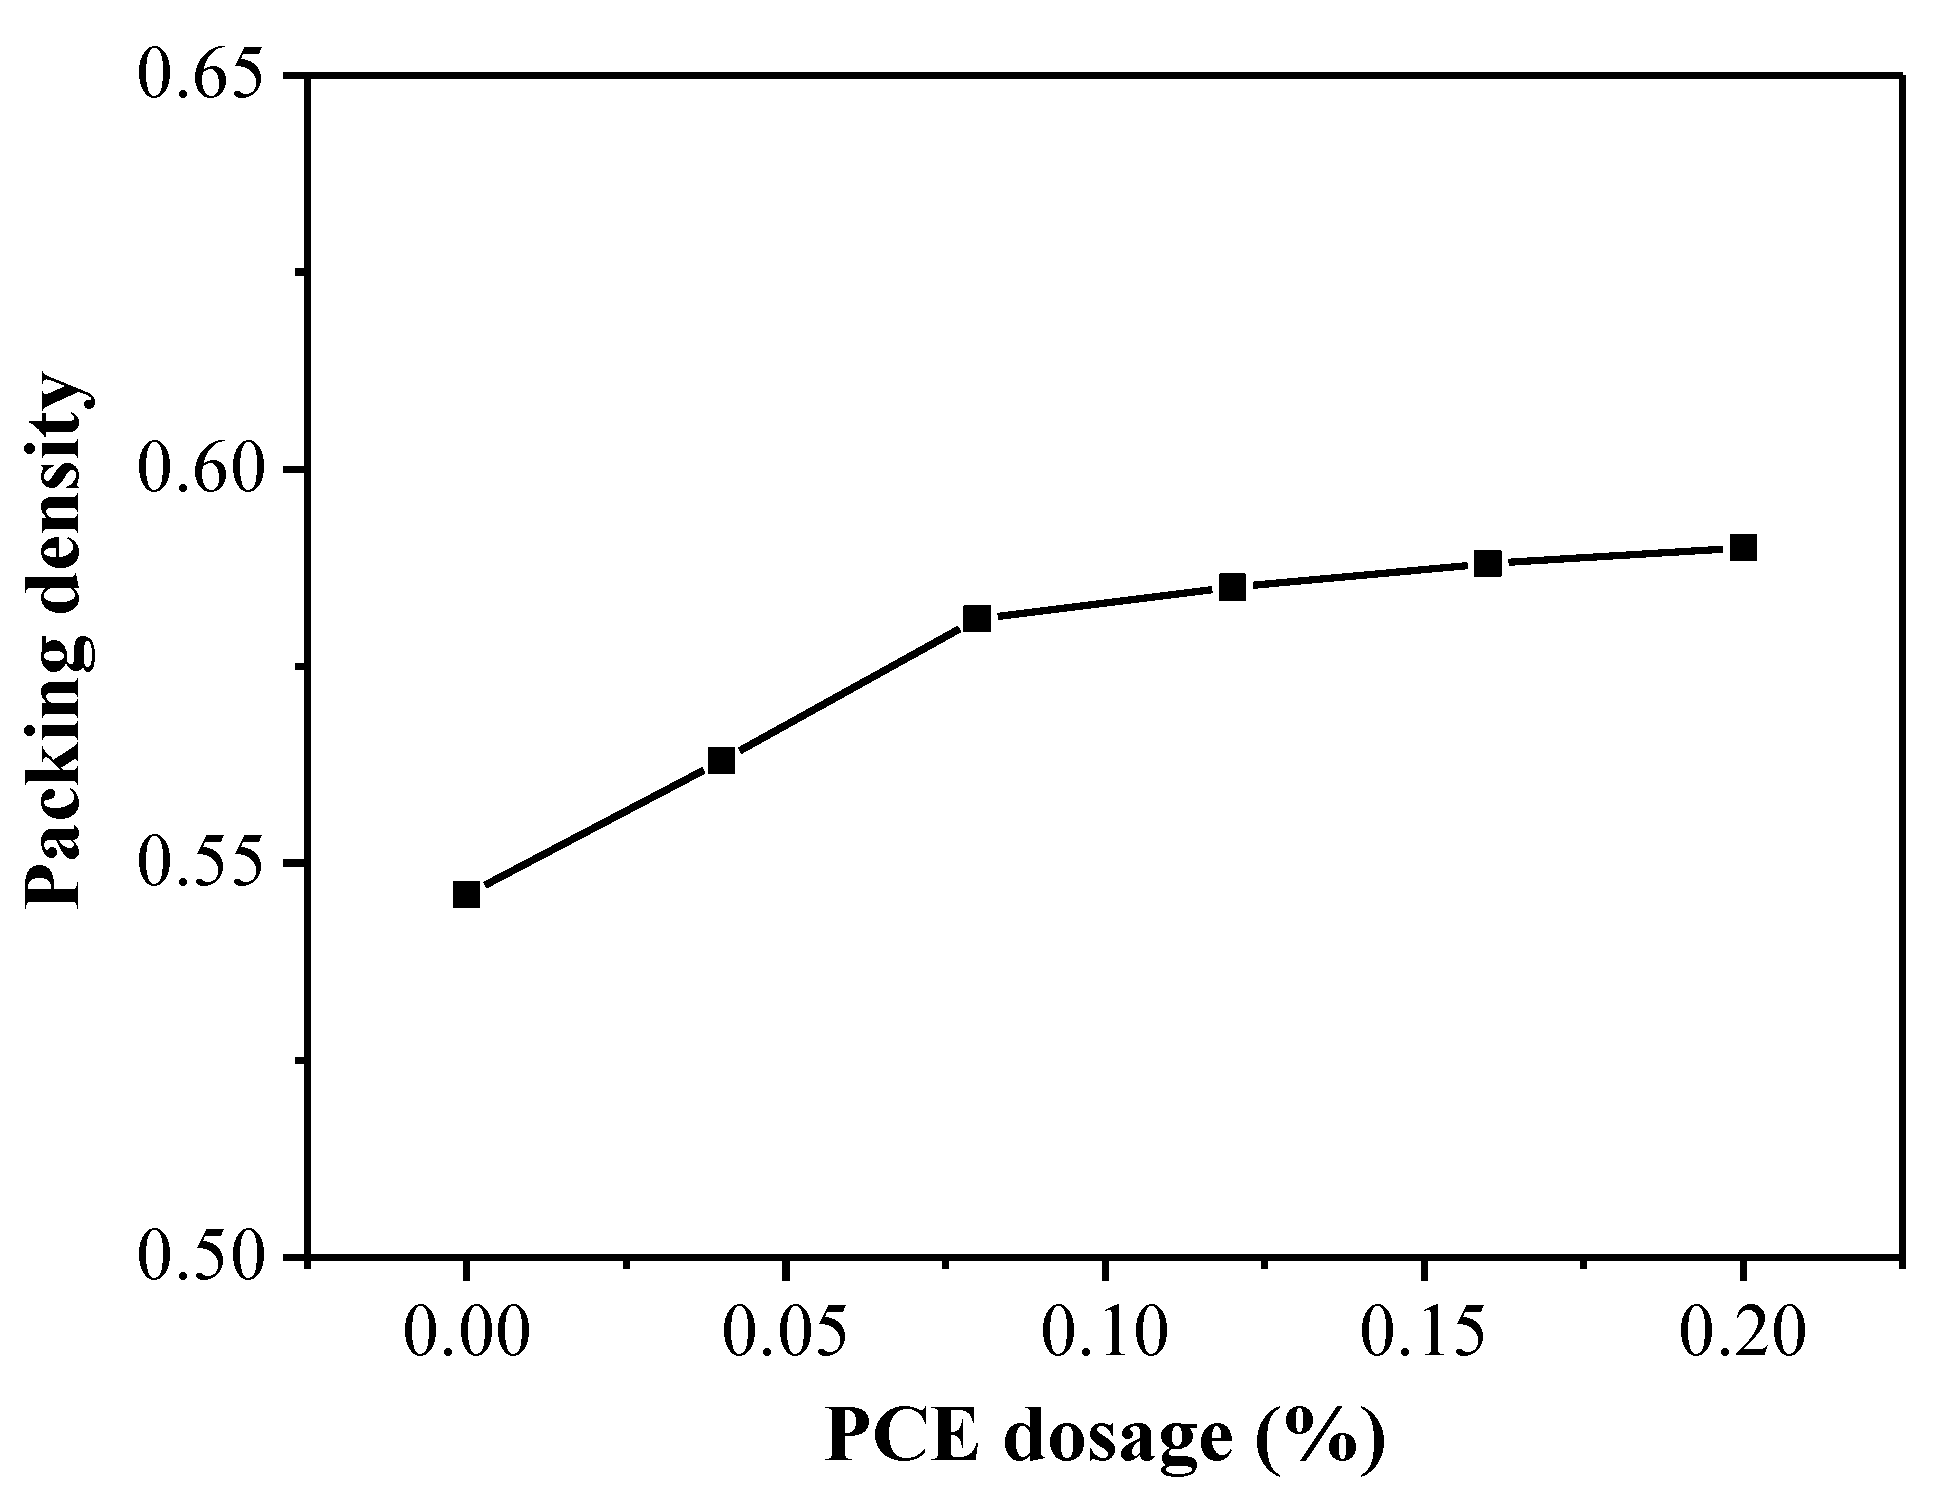
3.1. Packing Density
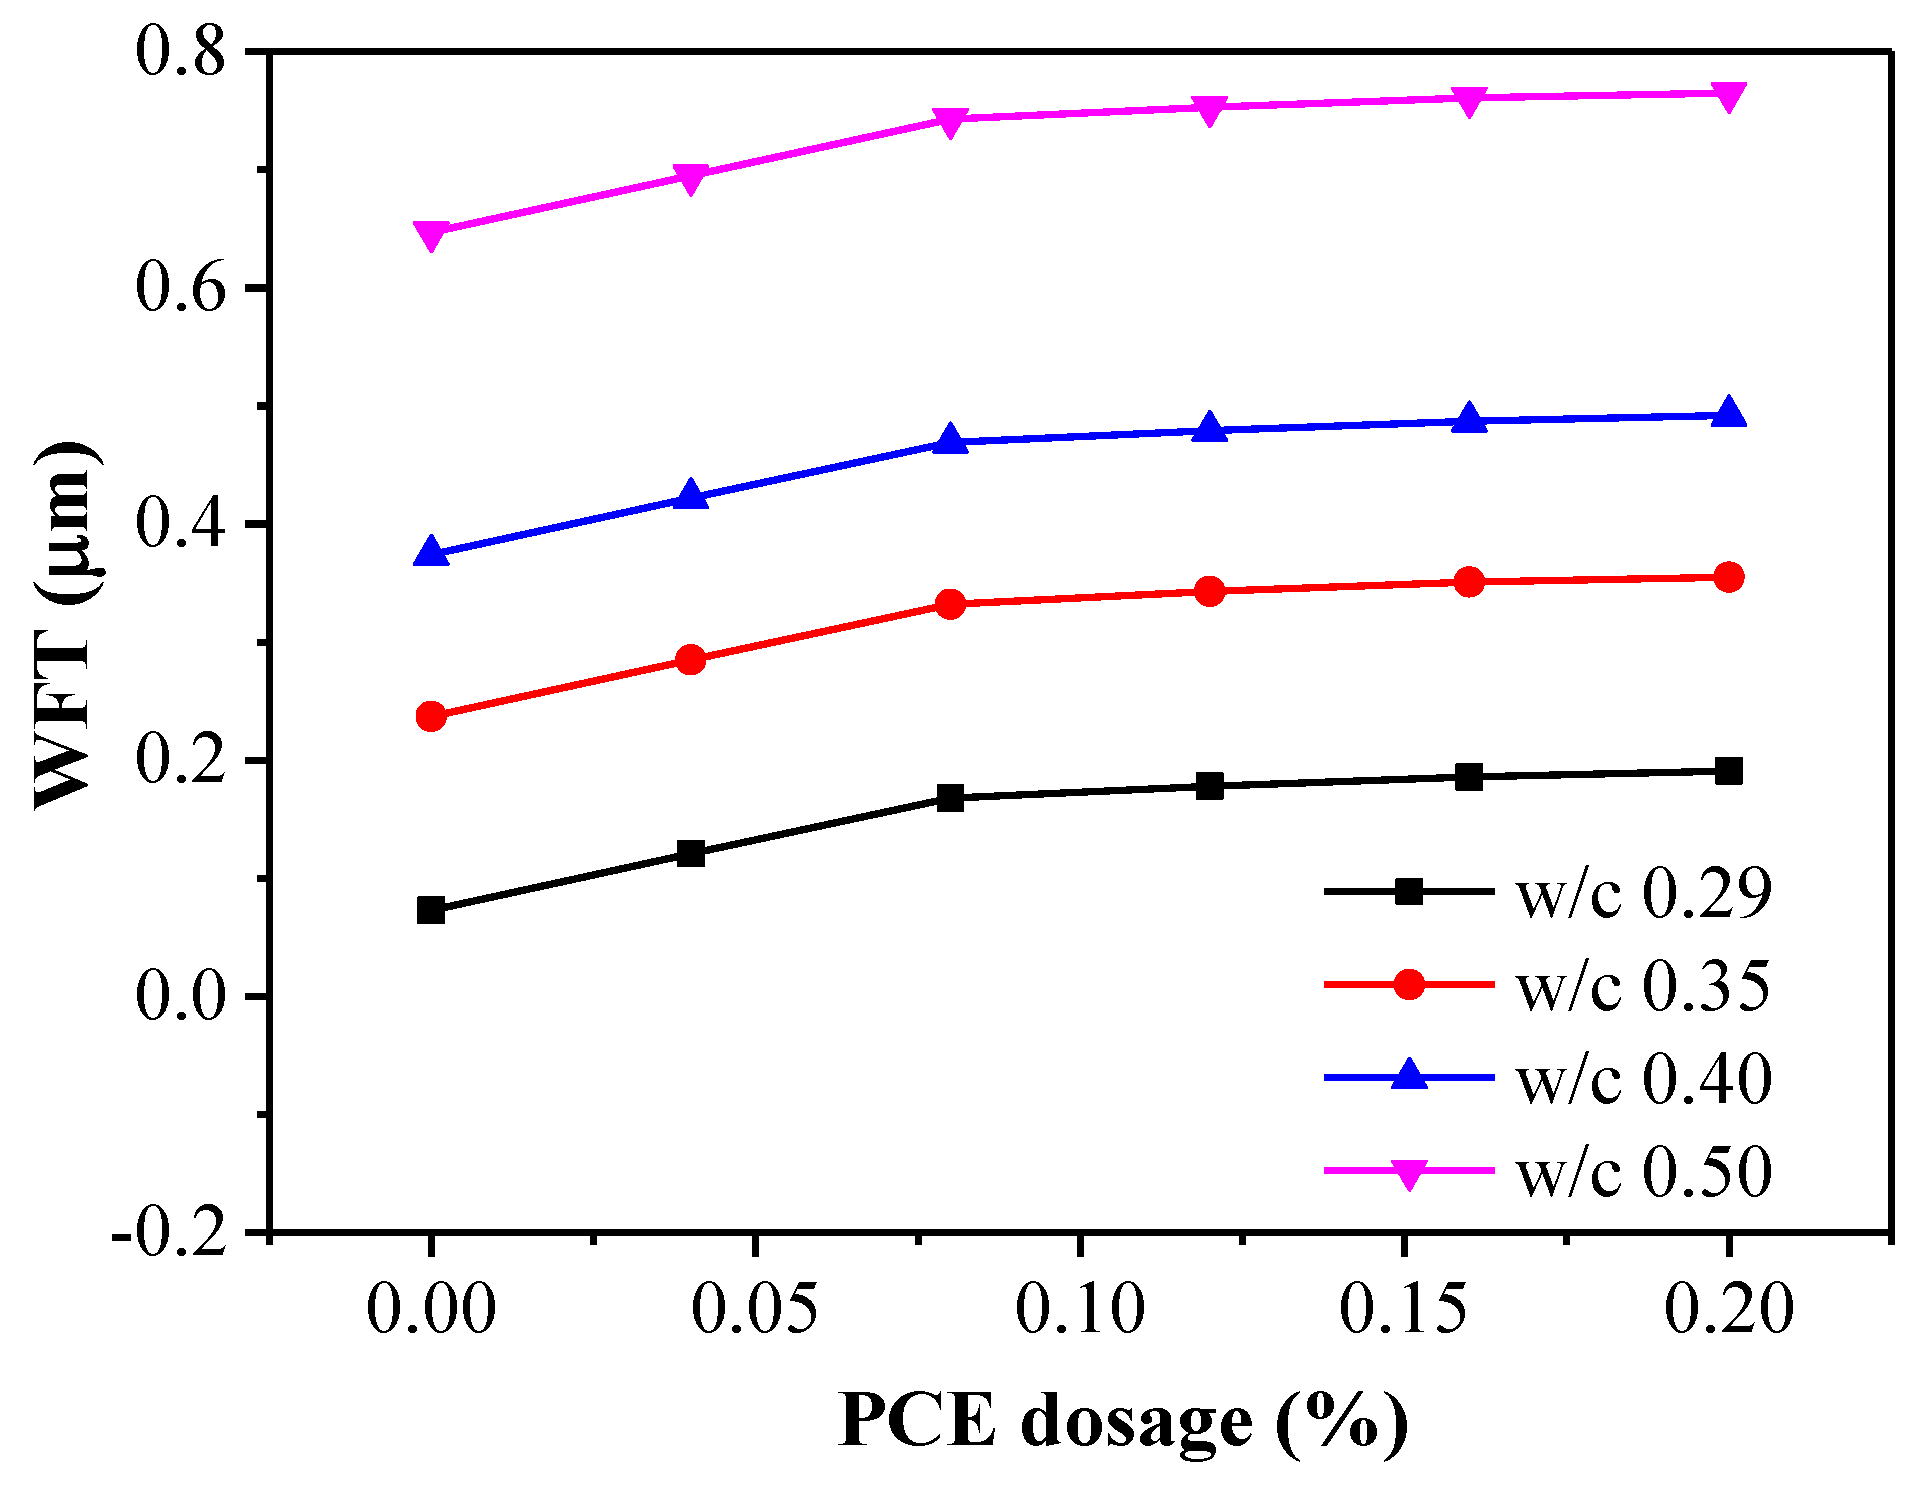
3.2. WFT Results
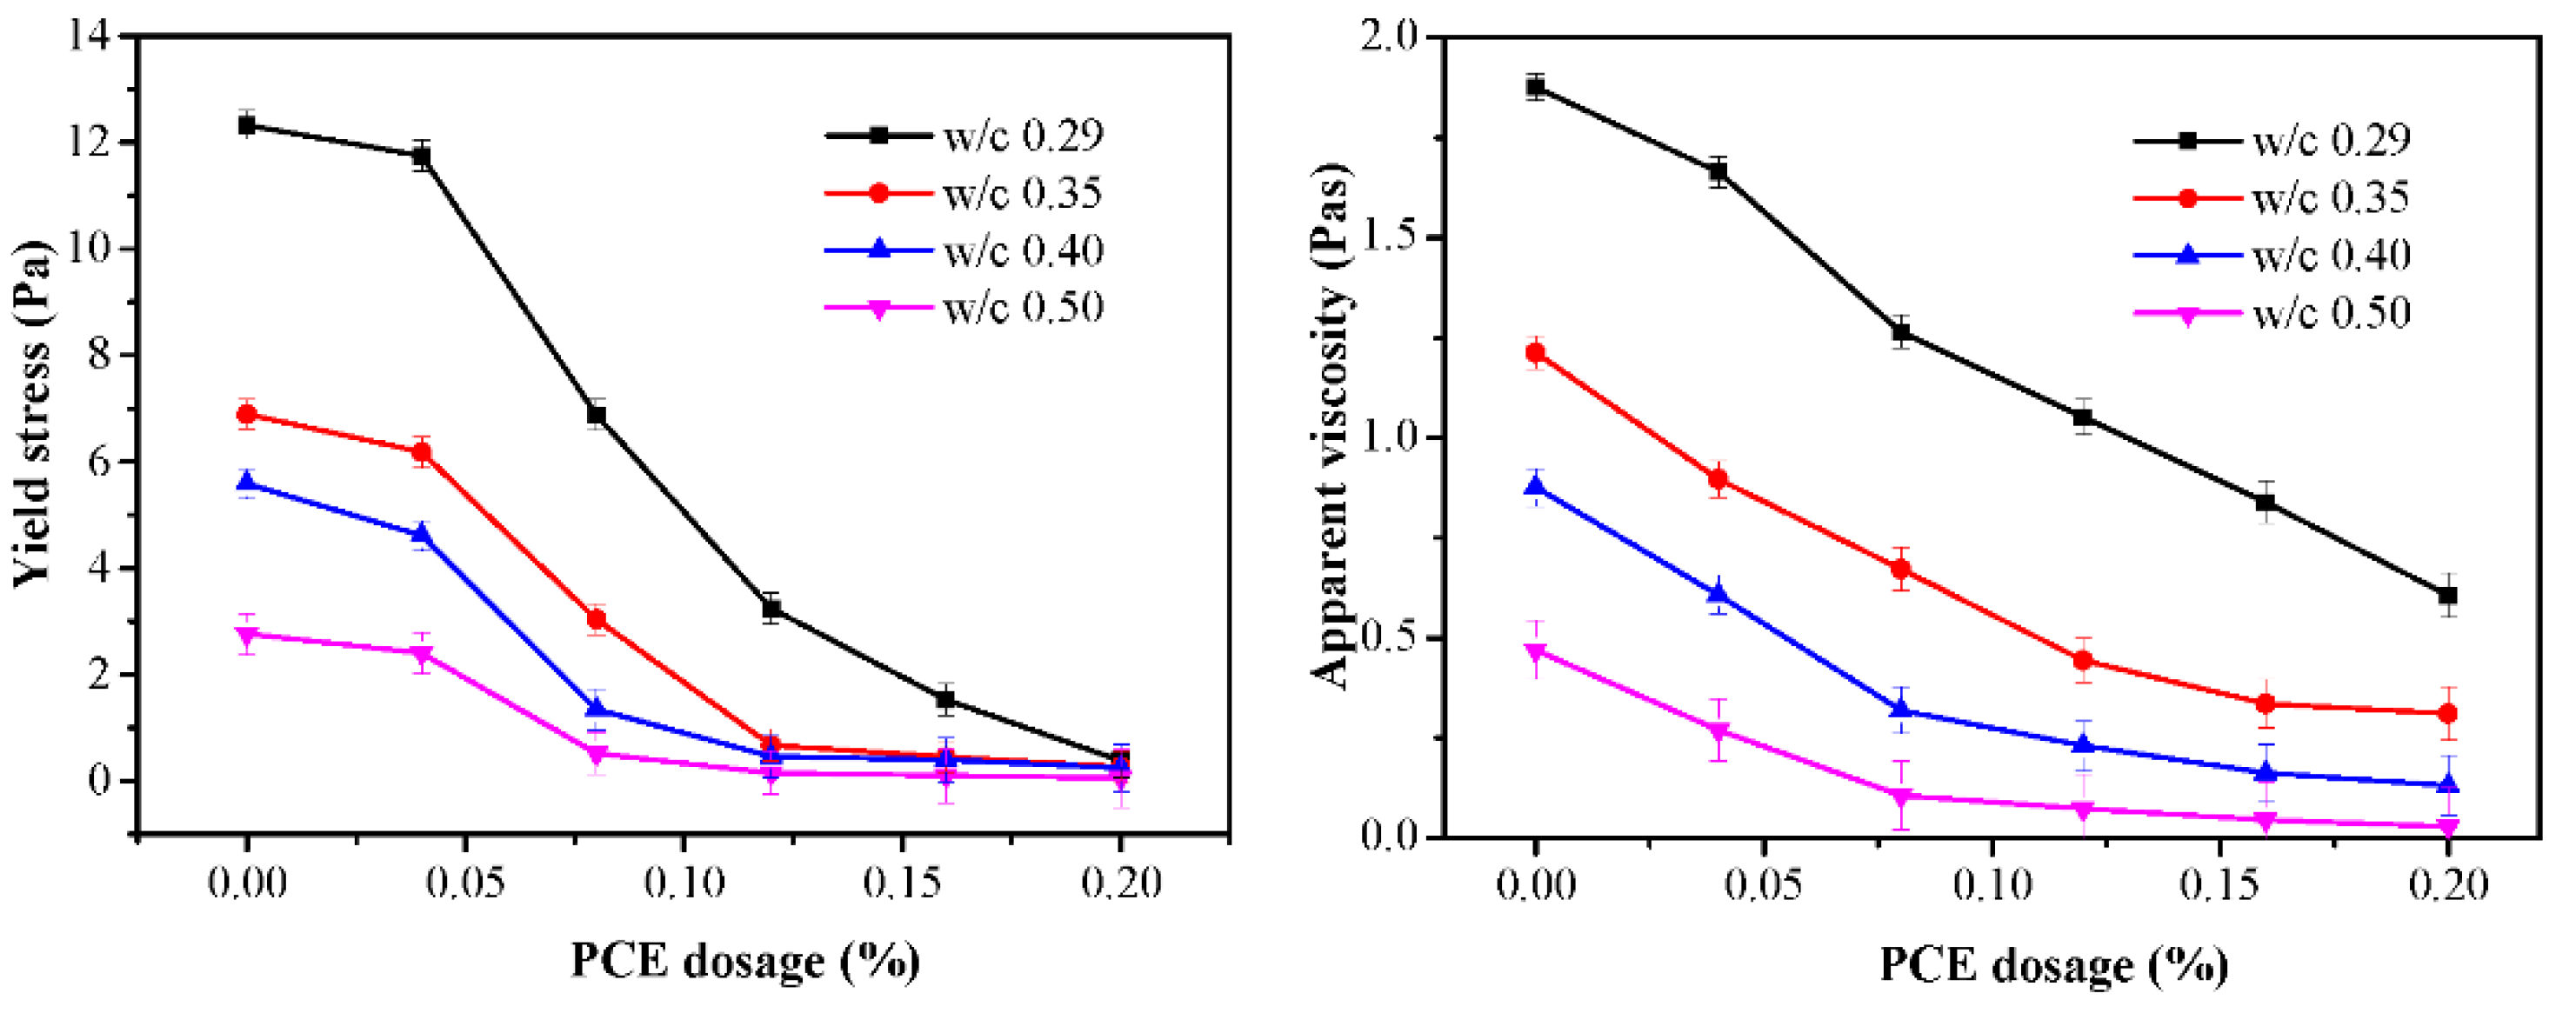
3.3. Rheology
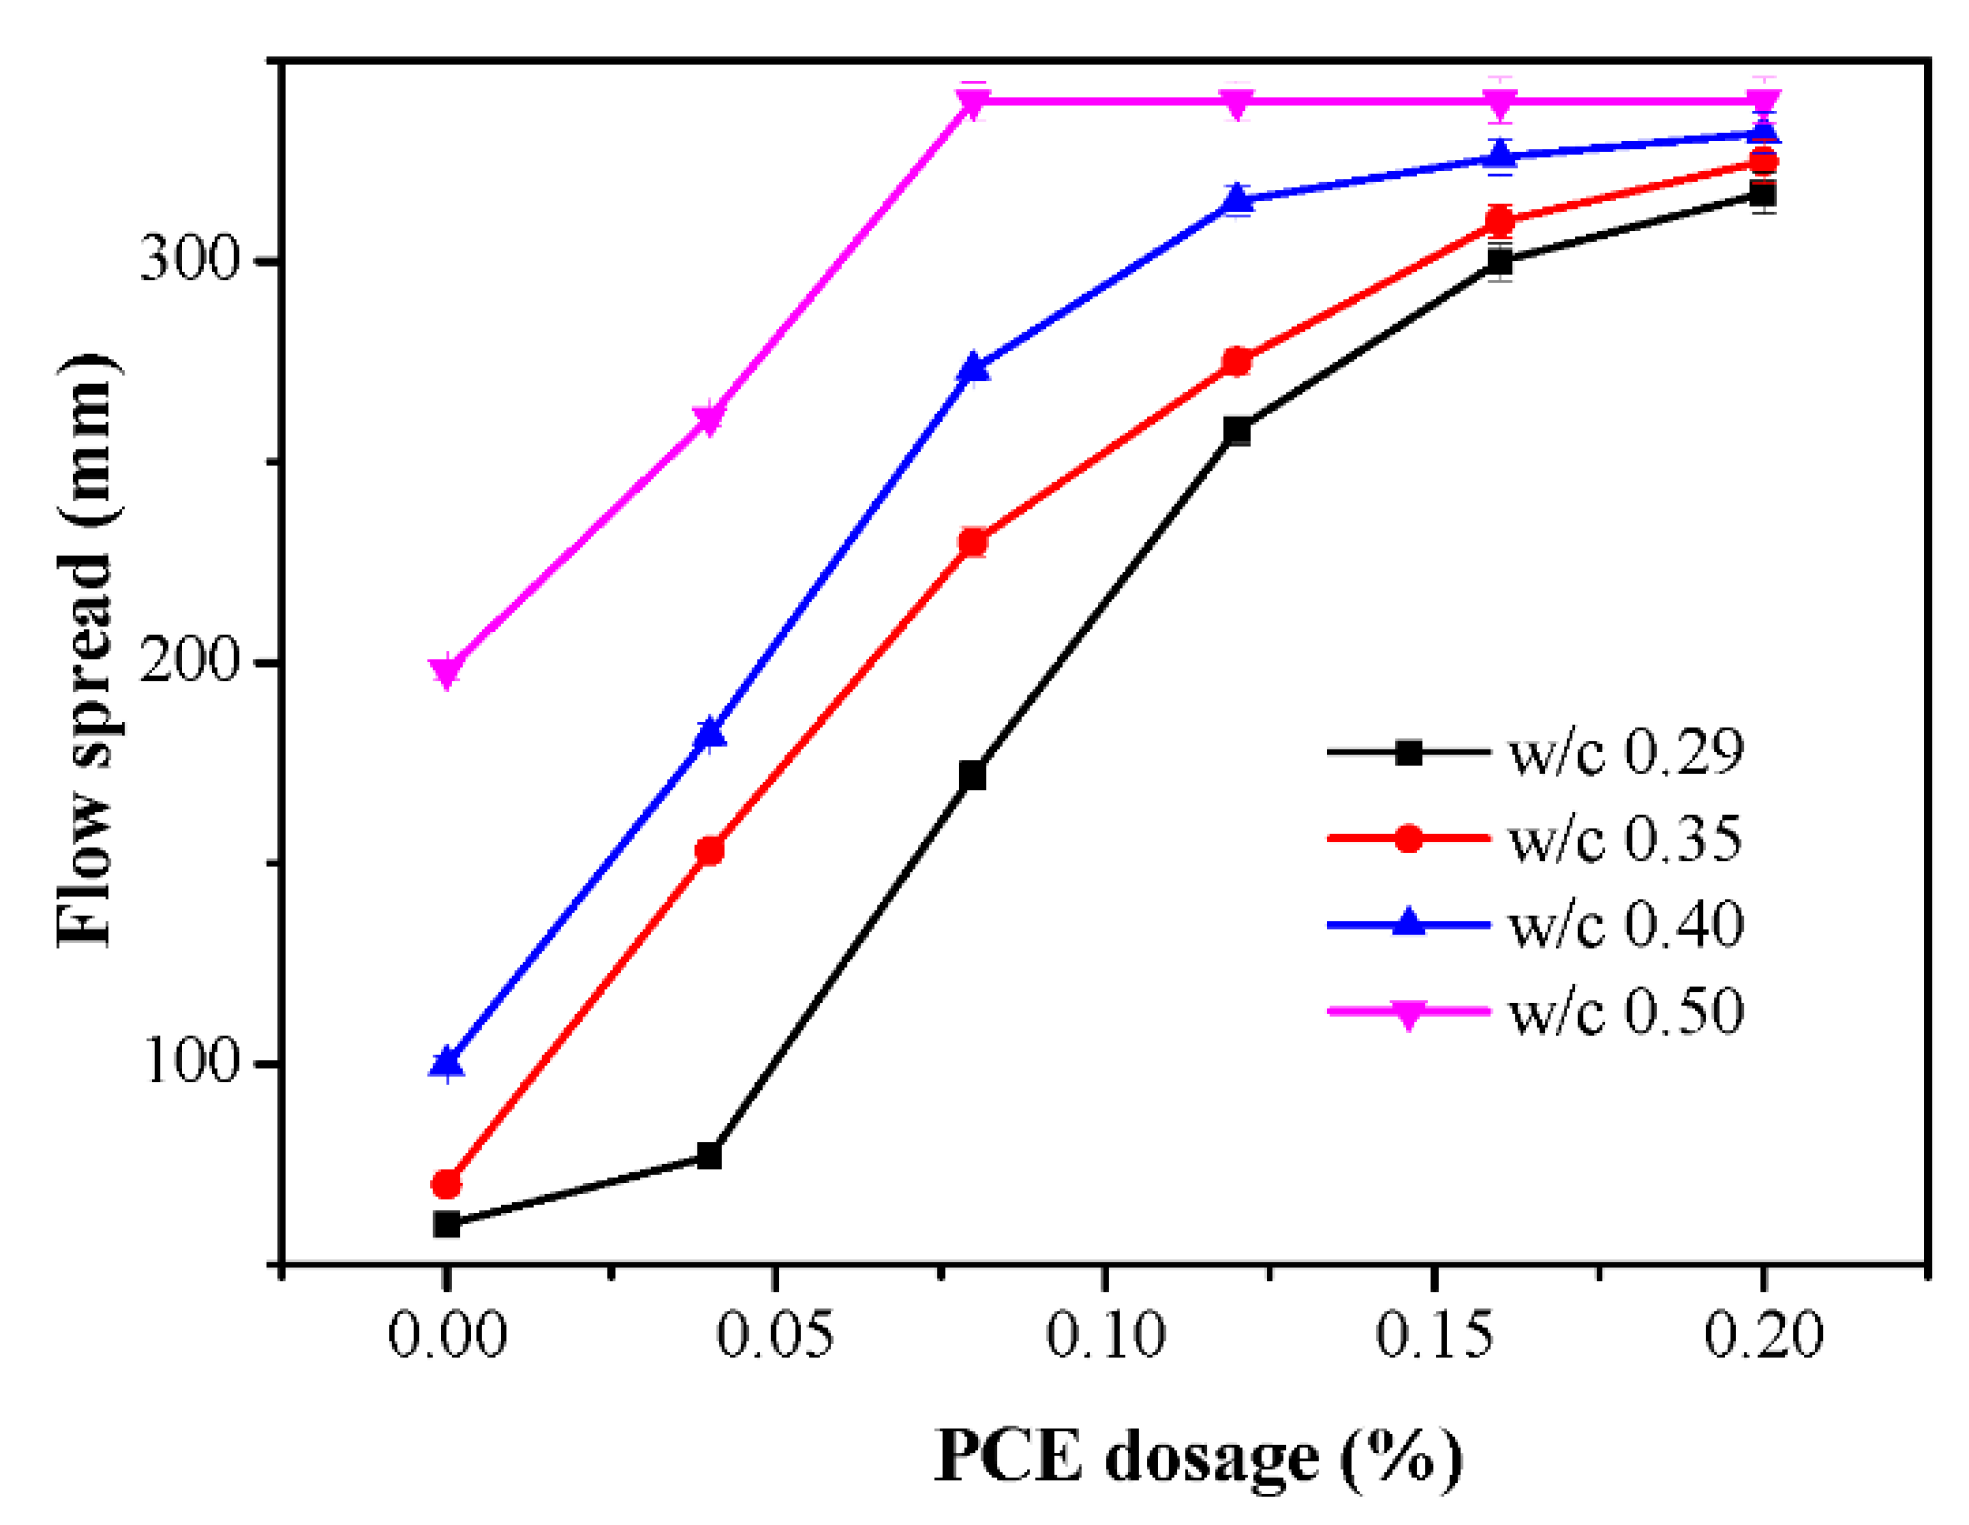
3.4. Flow Spread
3.5. Water Film Thickness Effects
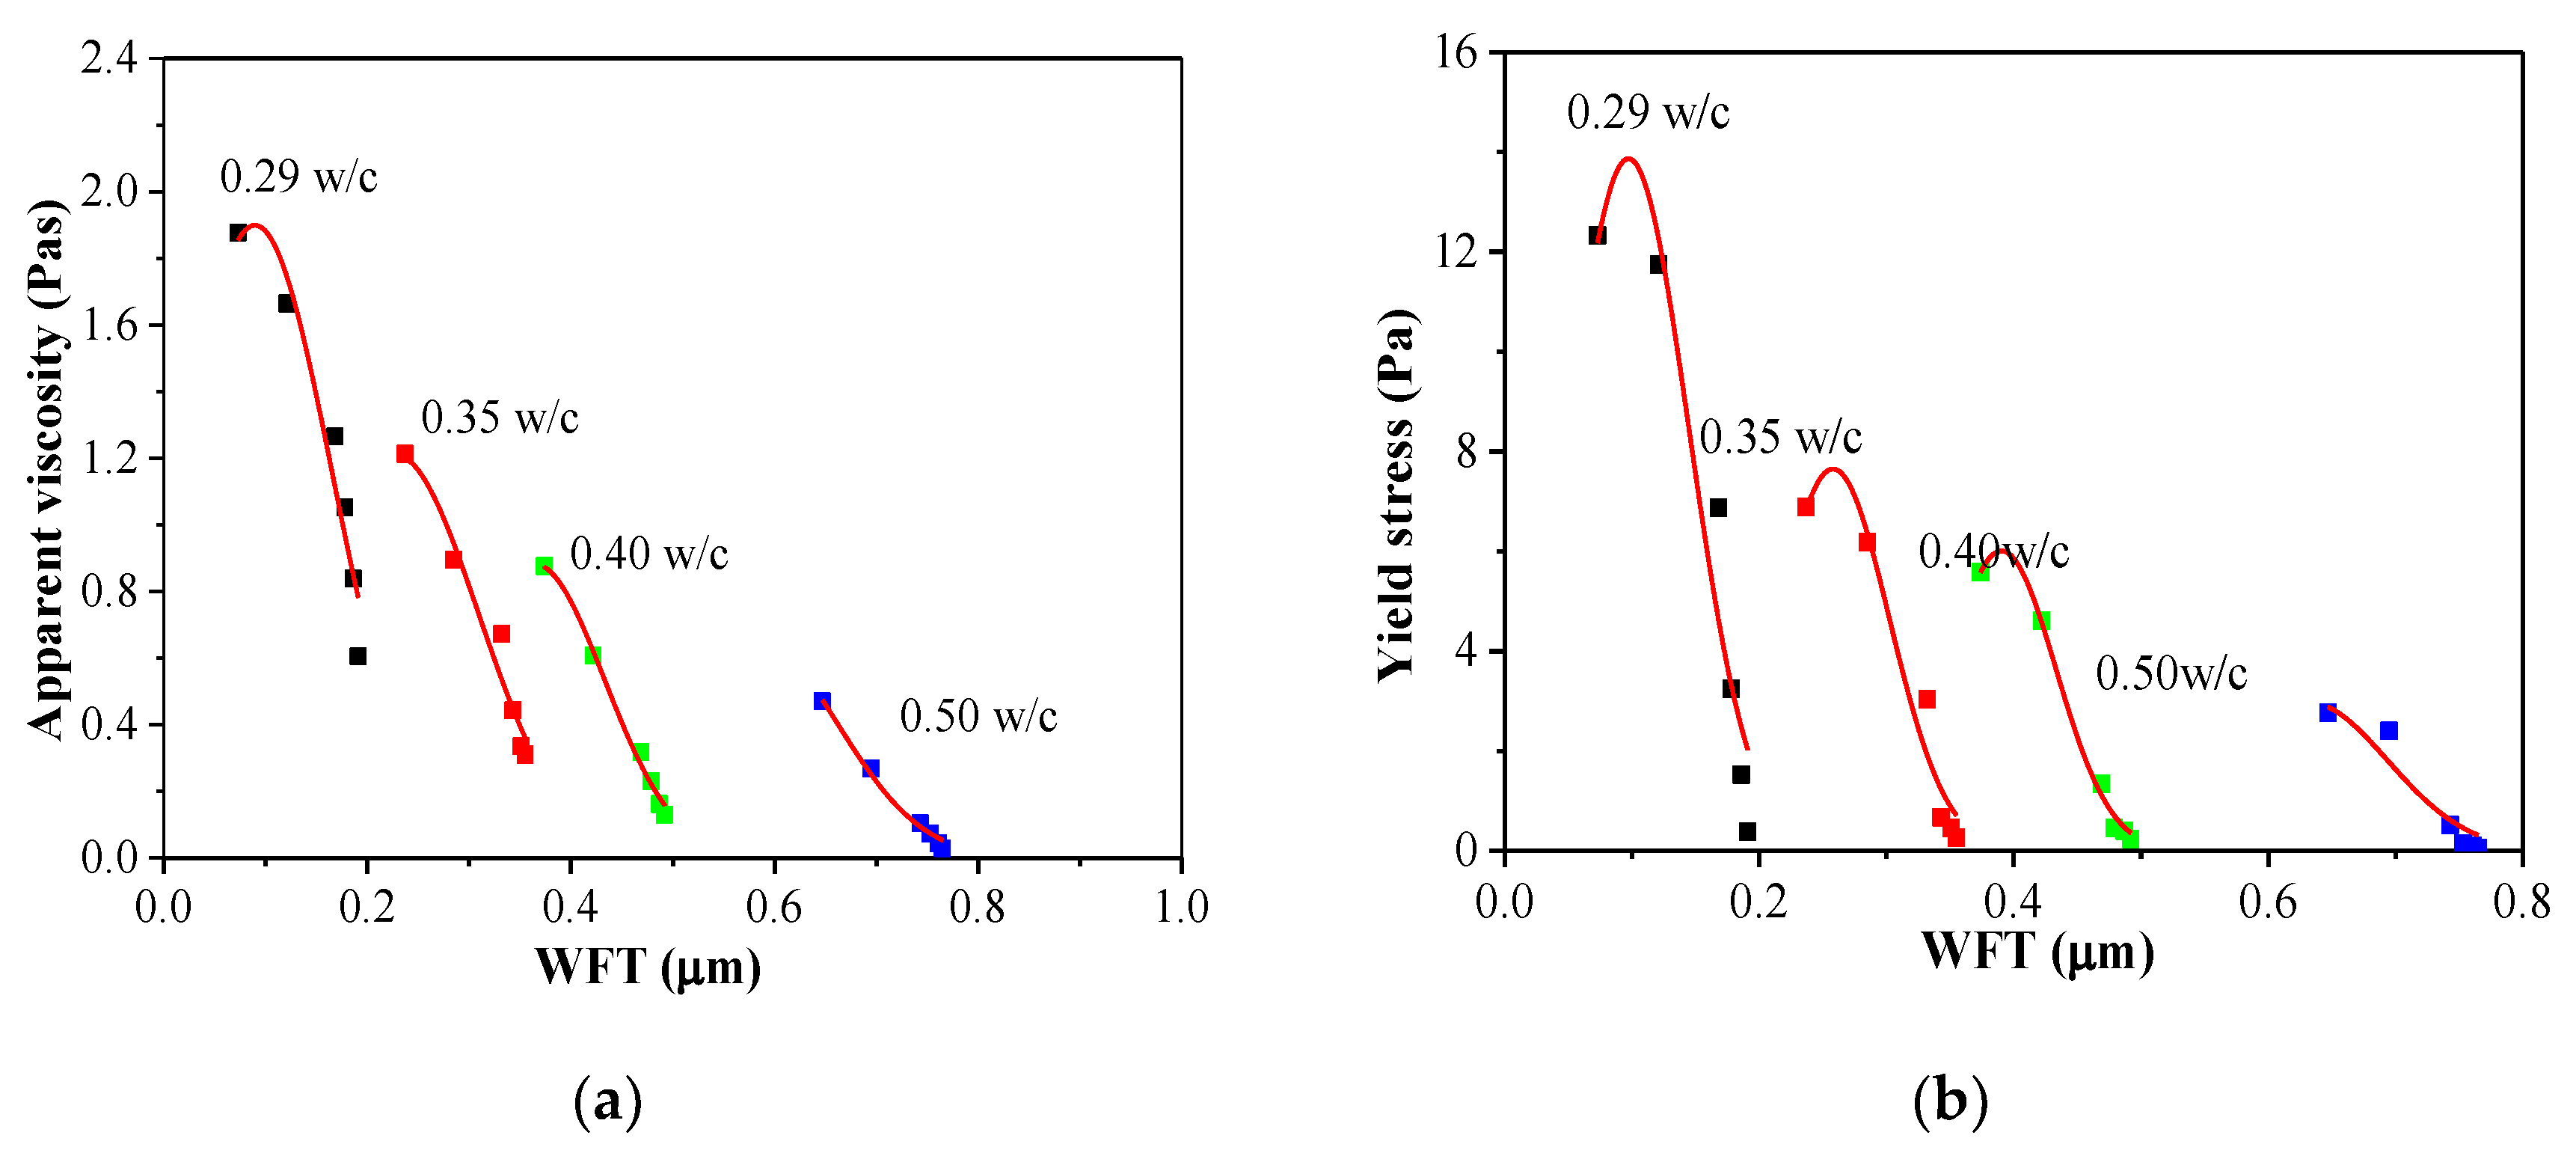
3.5.1. Yield Stress and Apparent Viscosity versus WFT
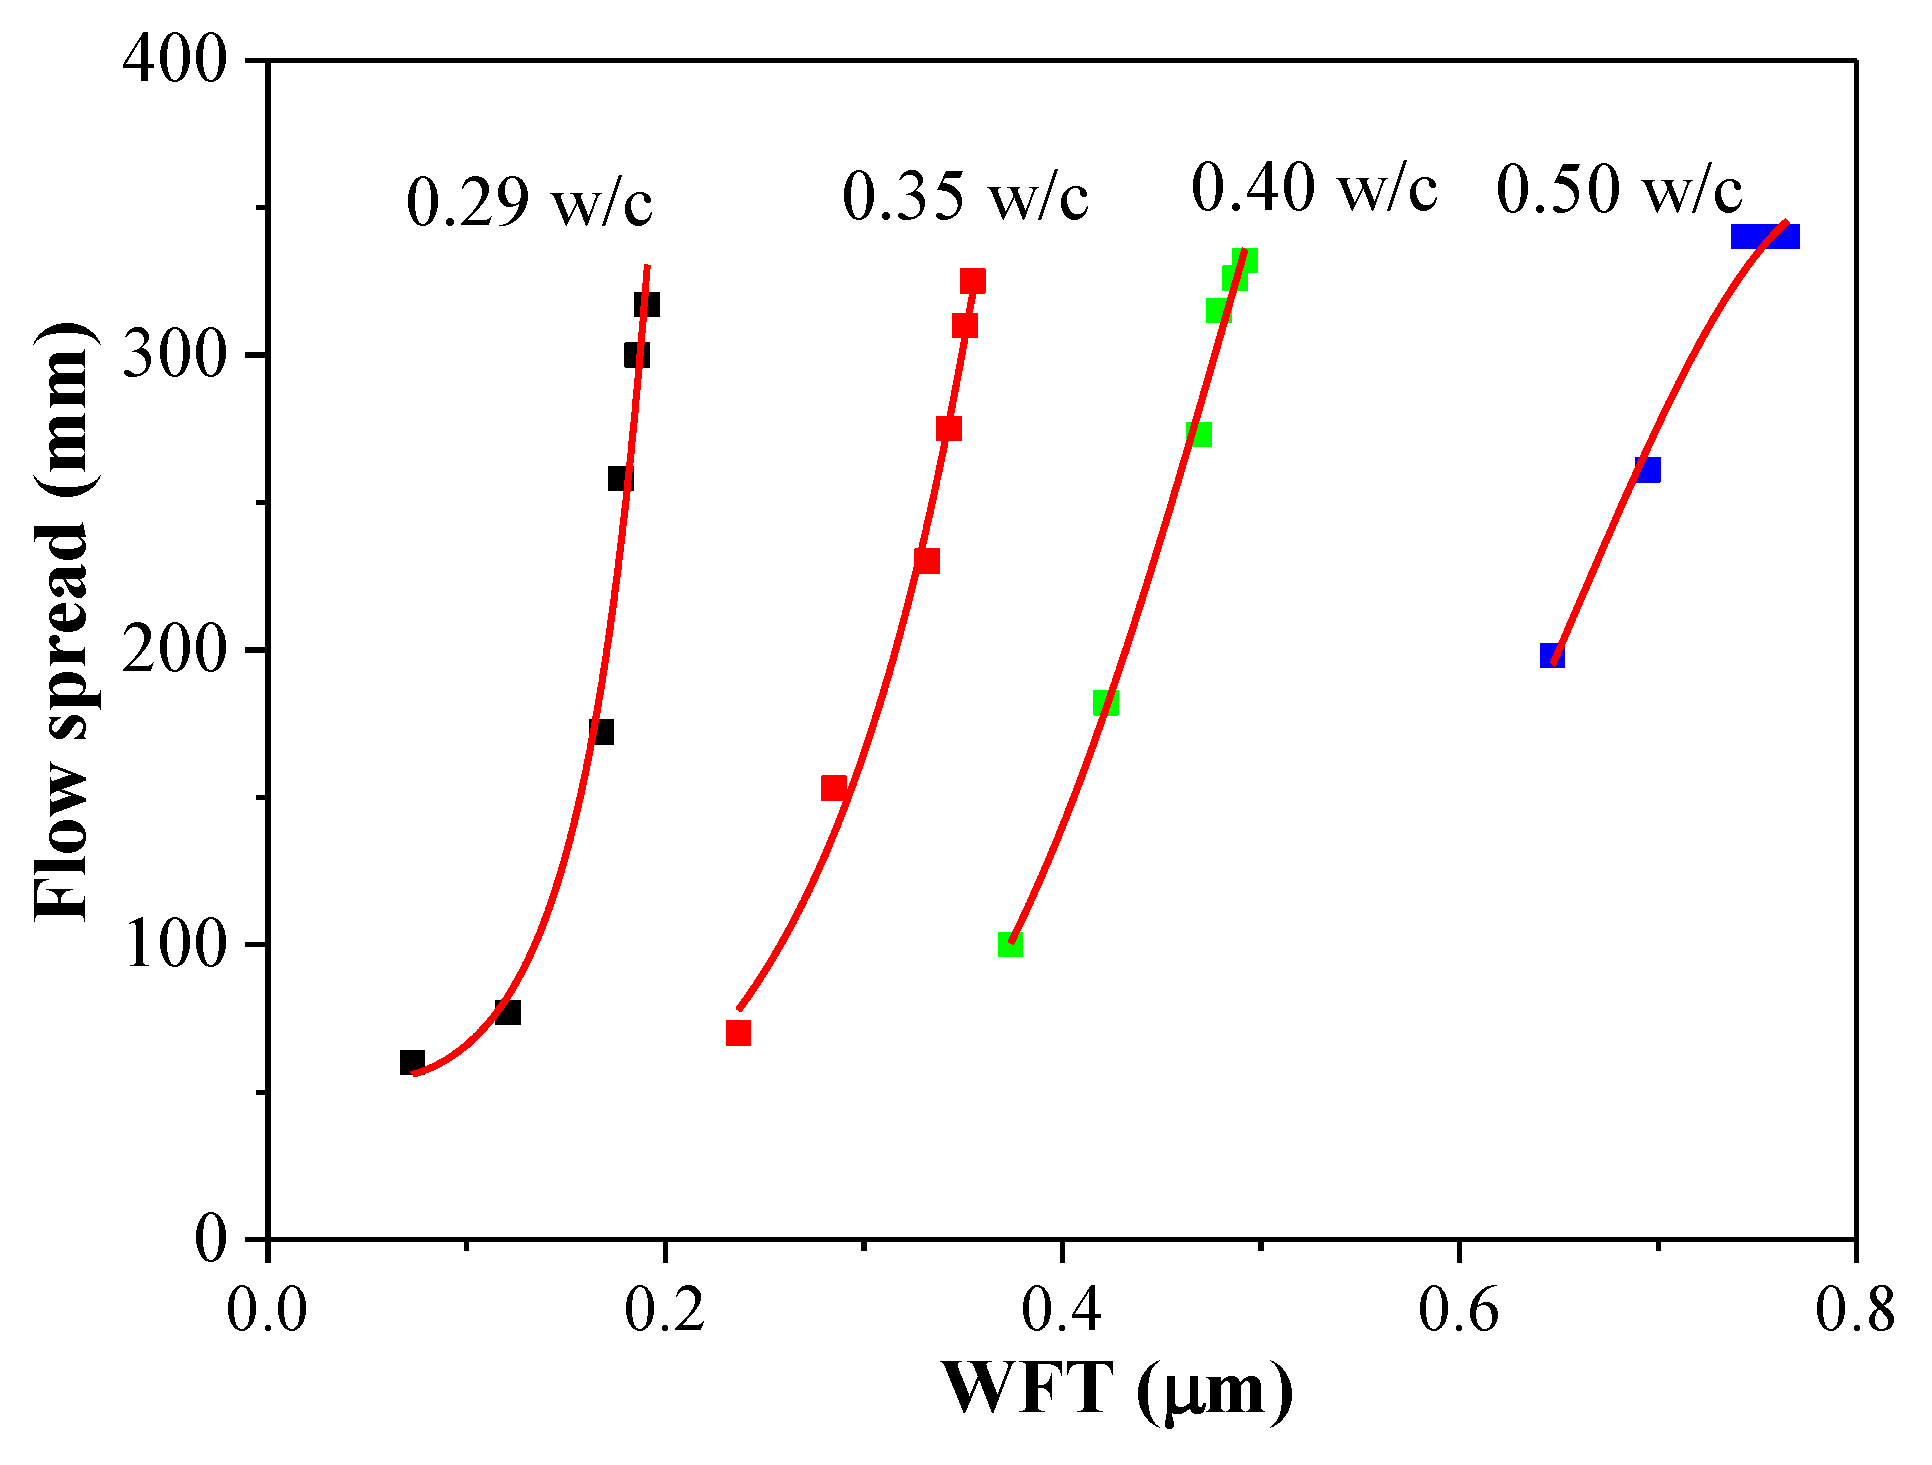
3.5.2. Flow Spread versus WFT
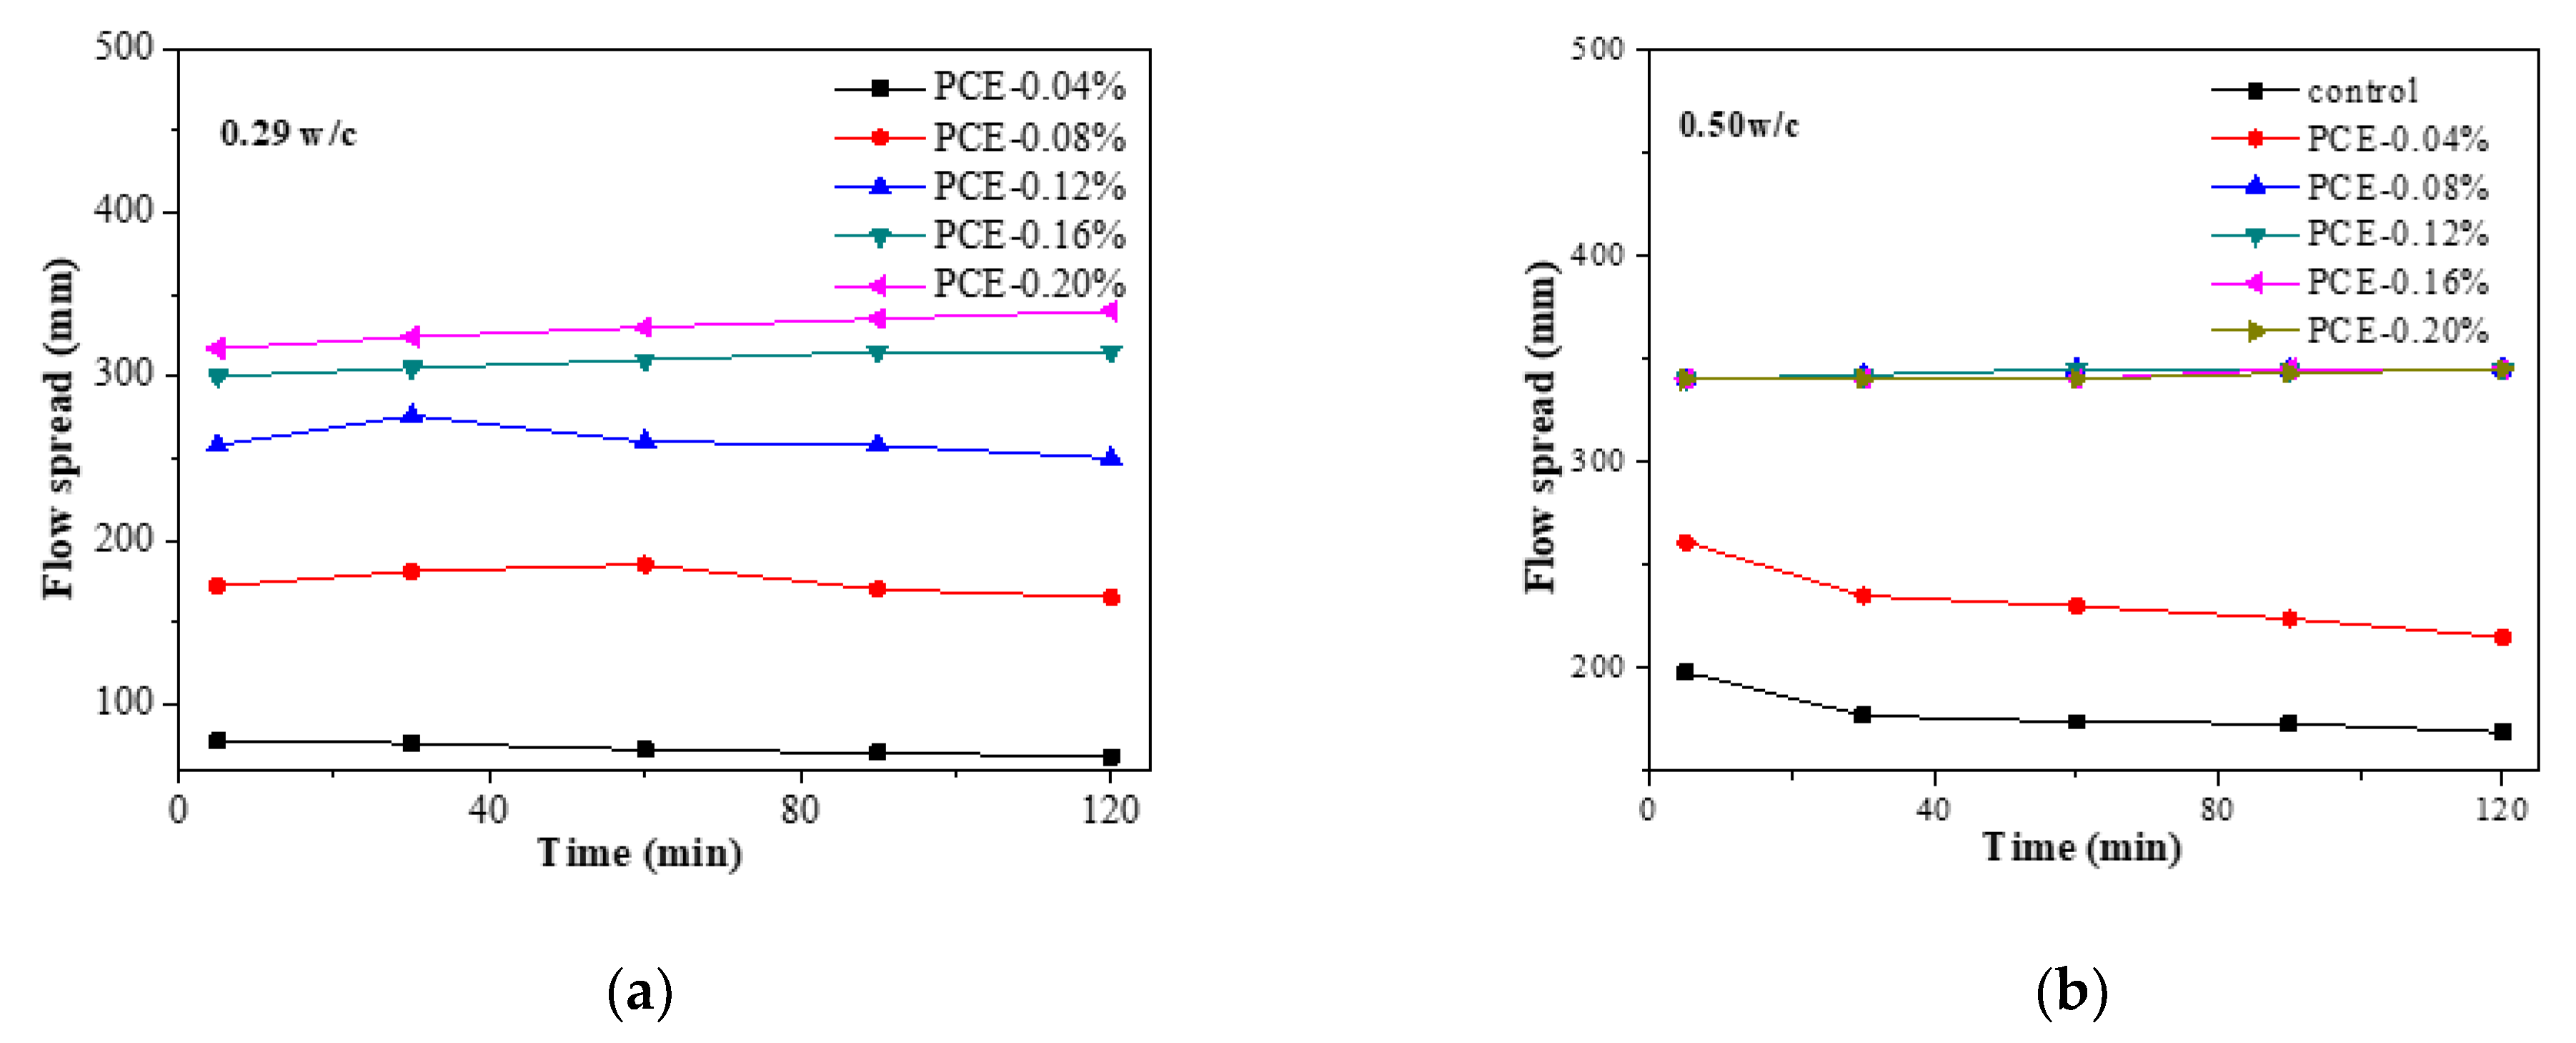
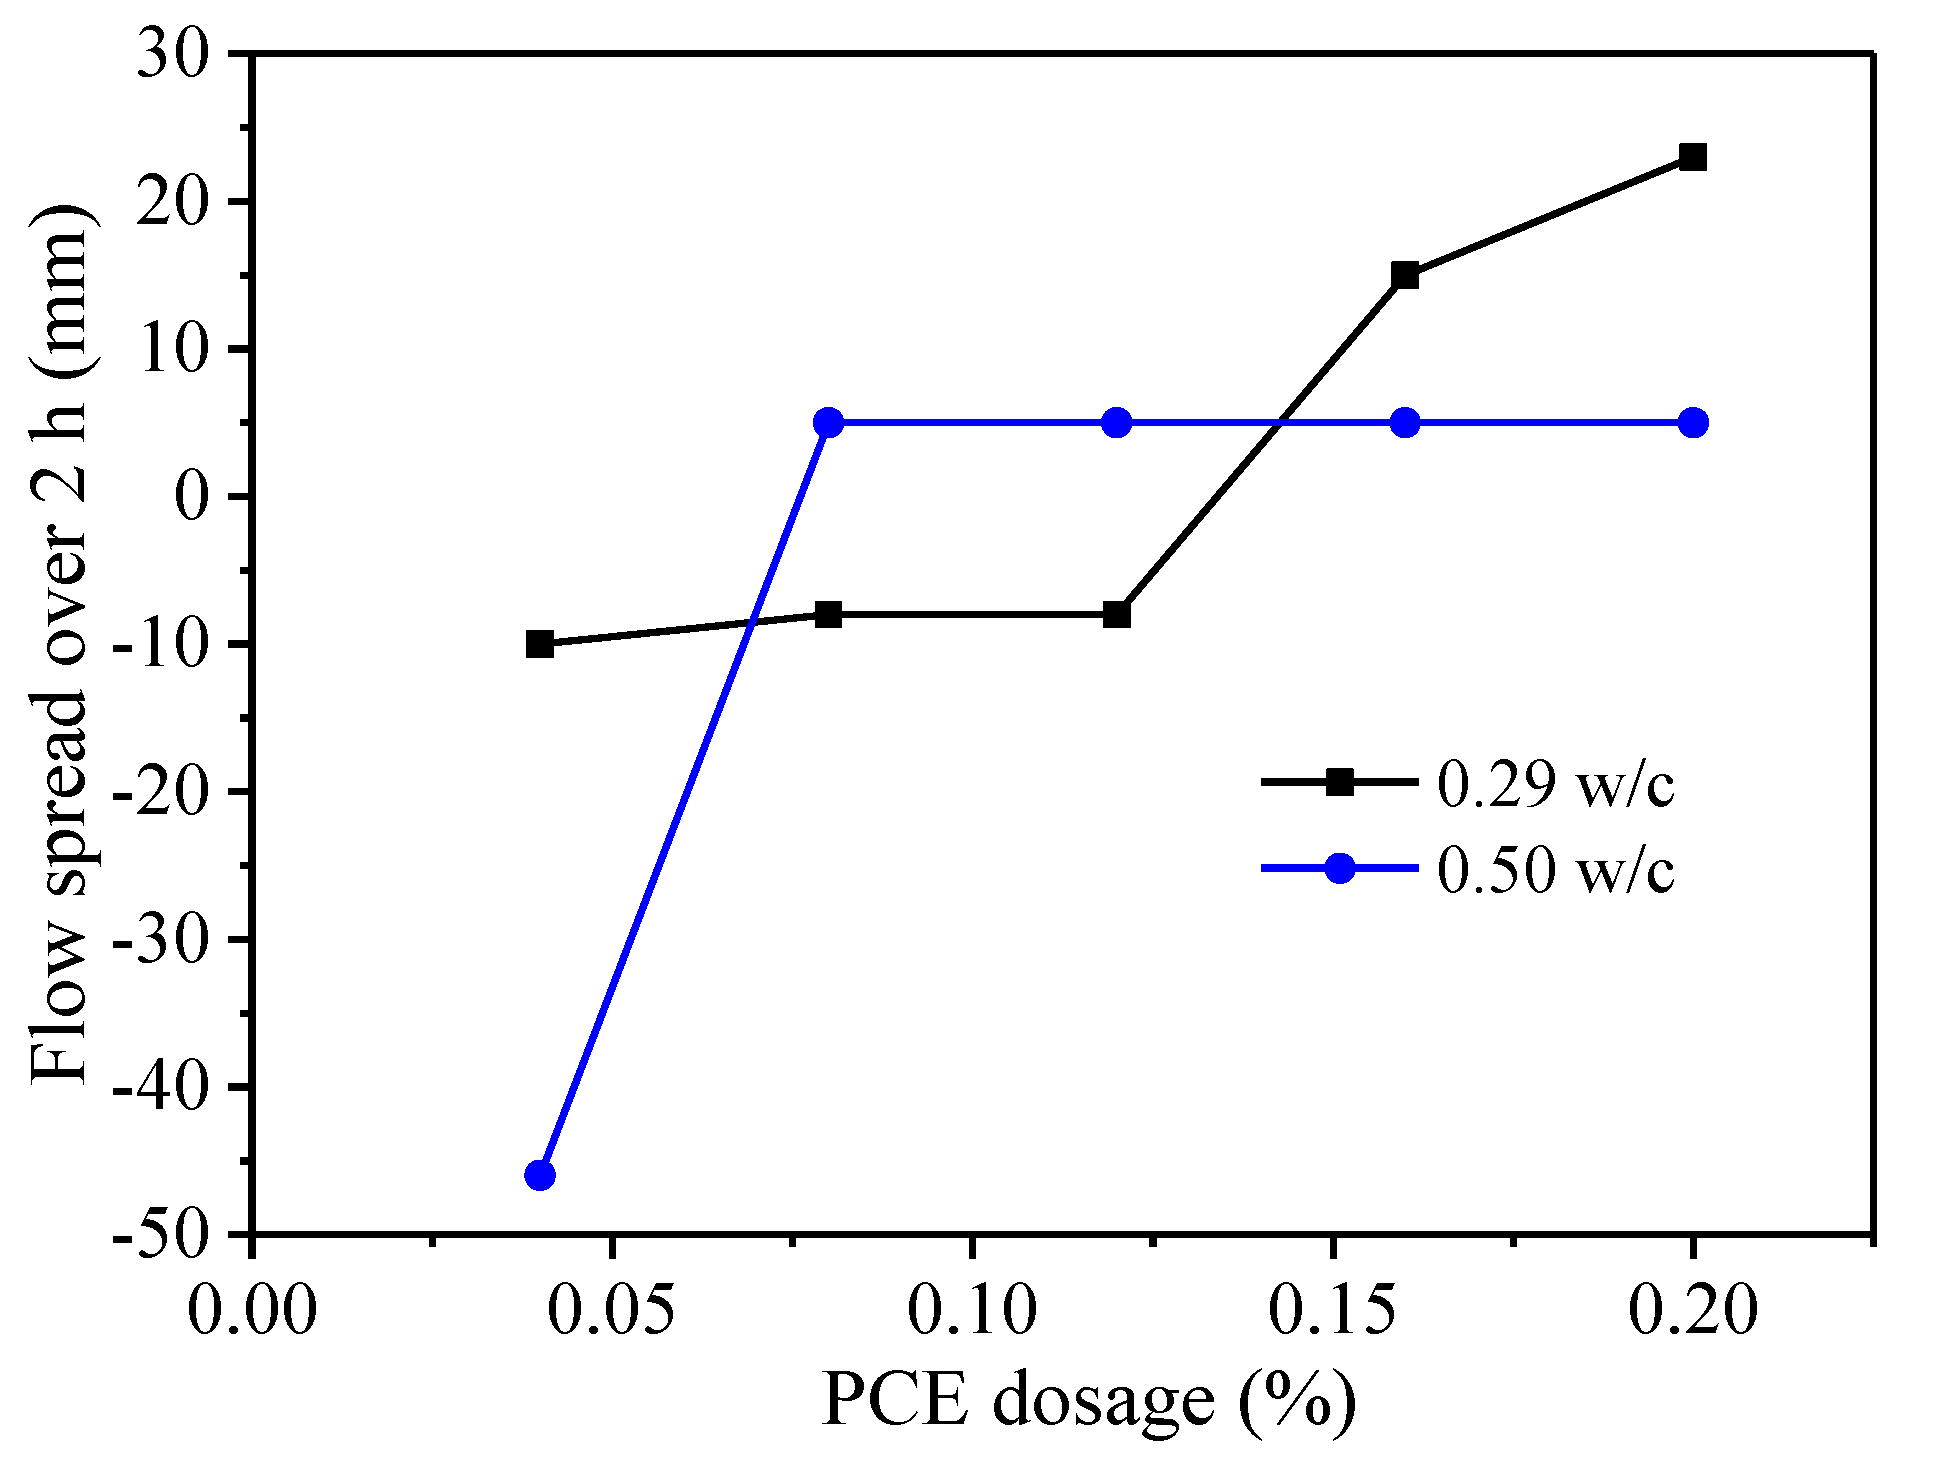
3.6. Impacts of PCE on the Fluidity Loss
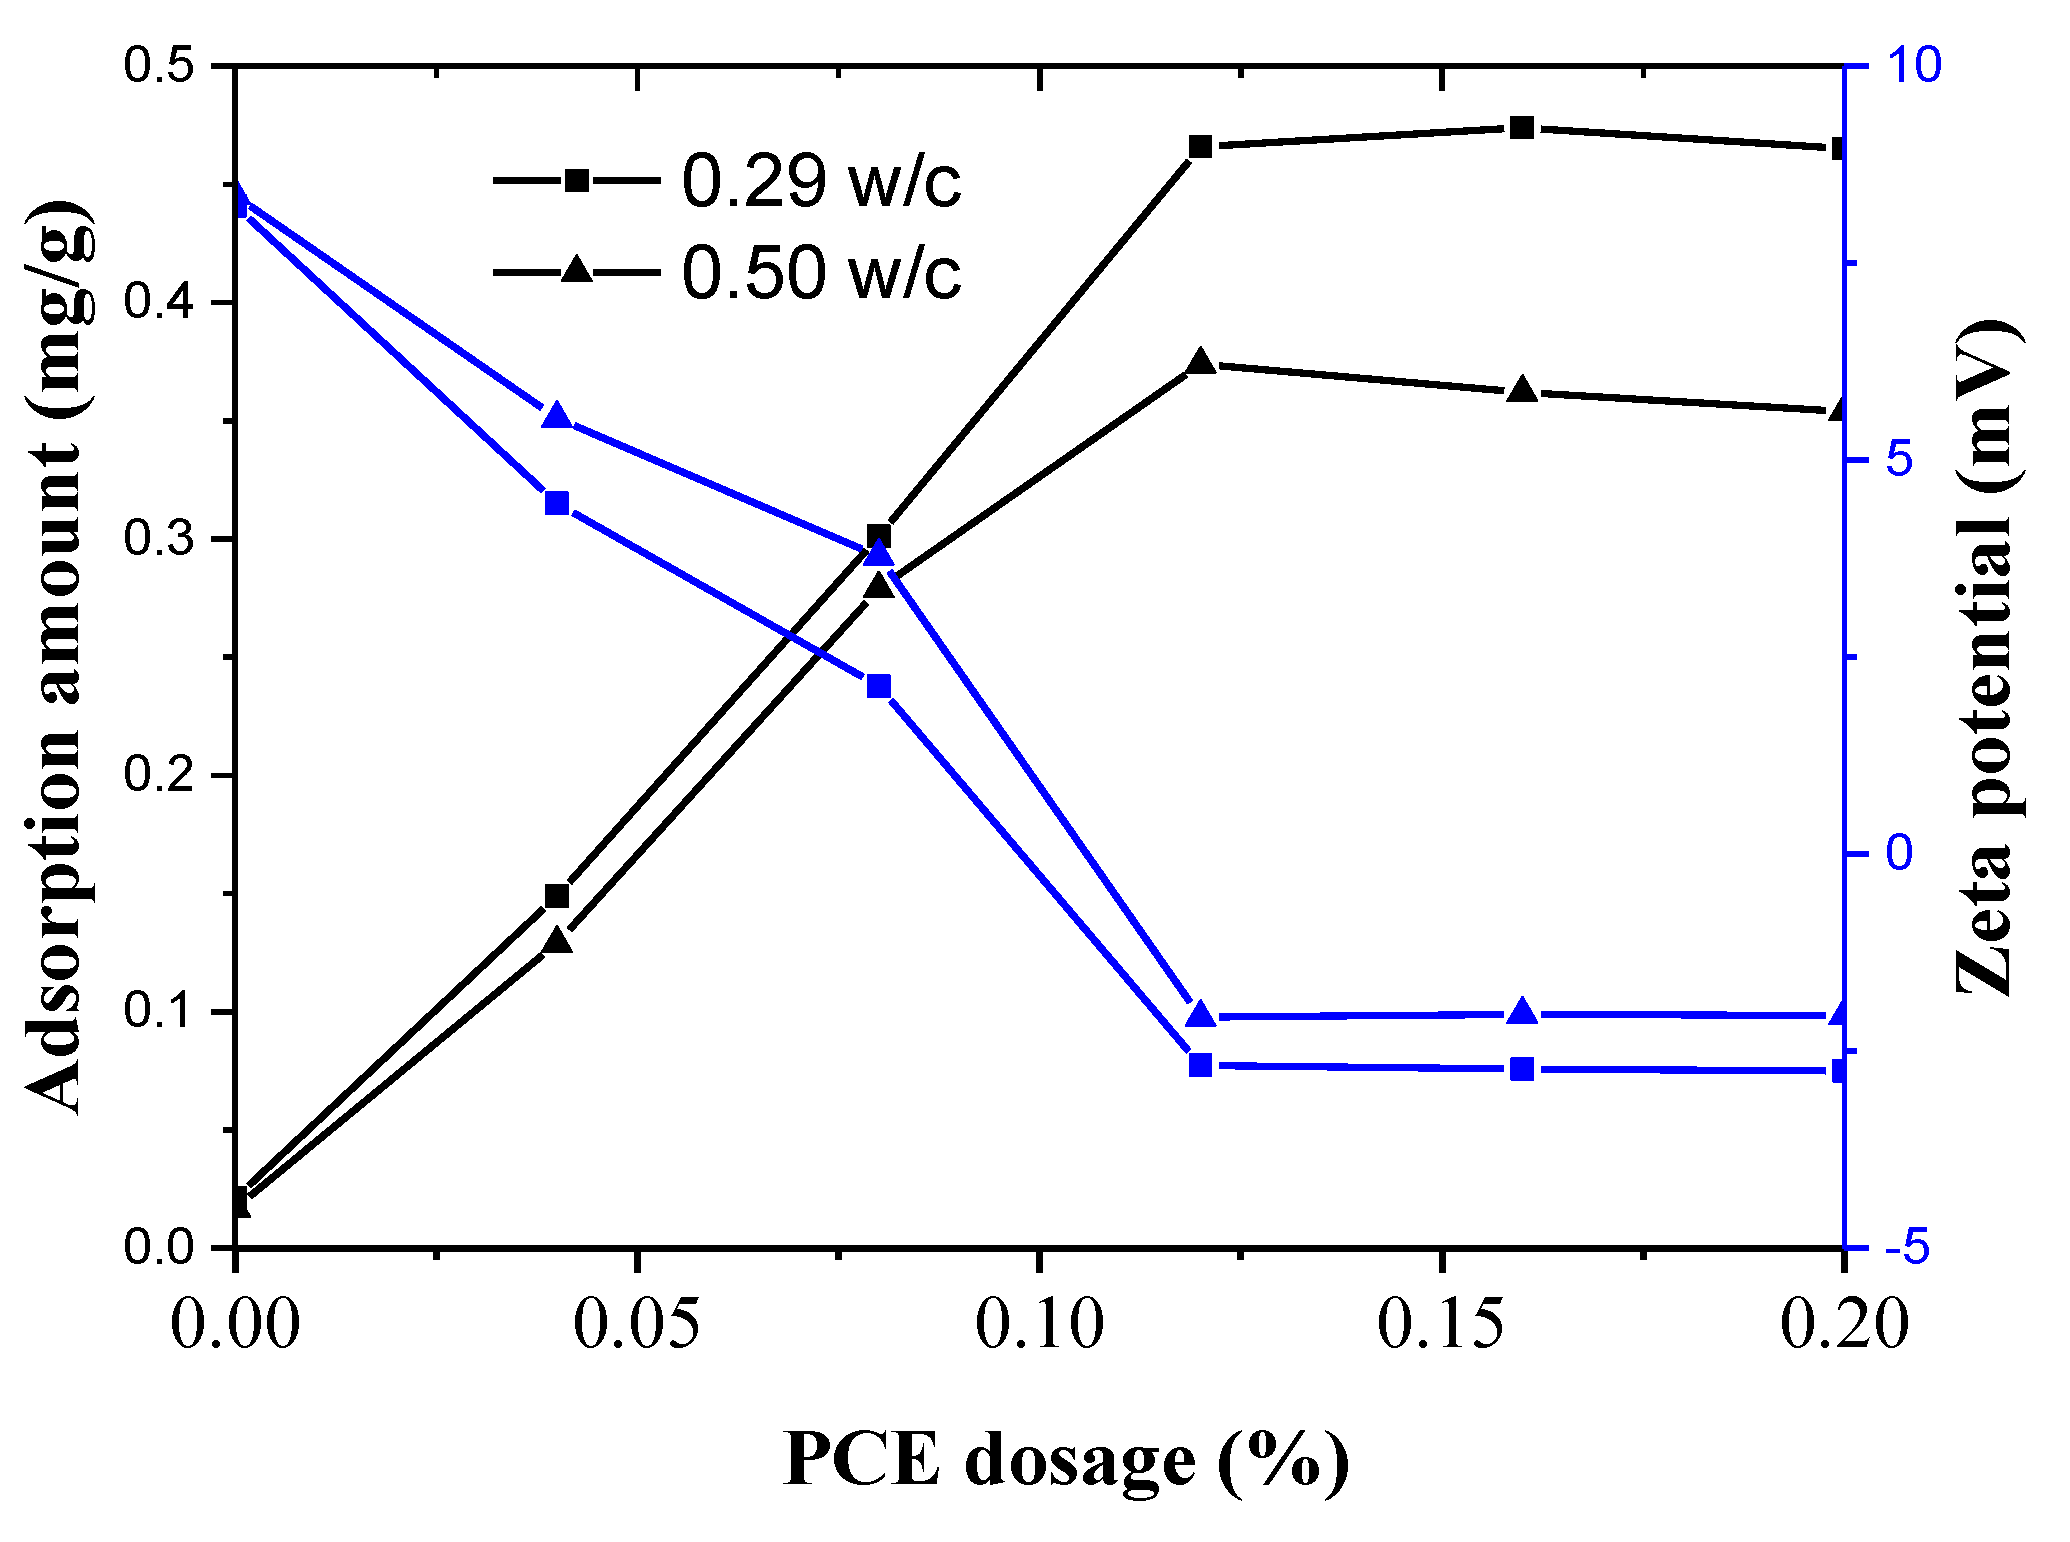
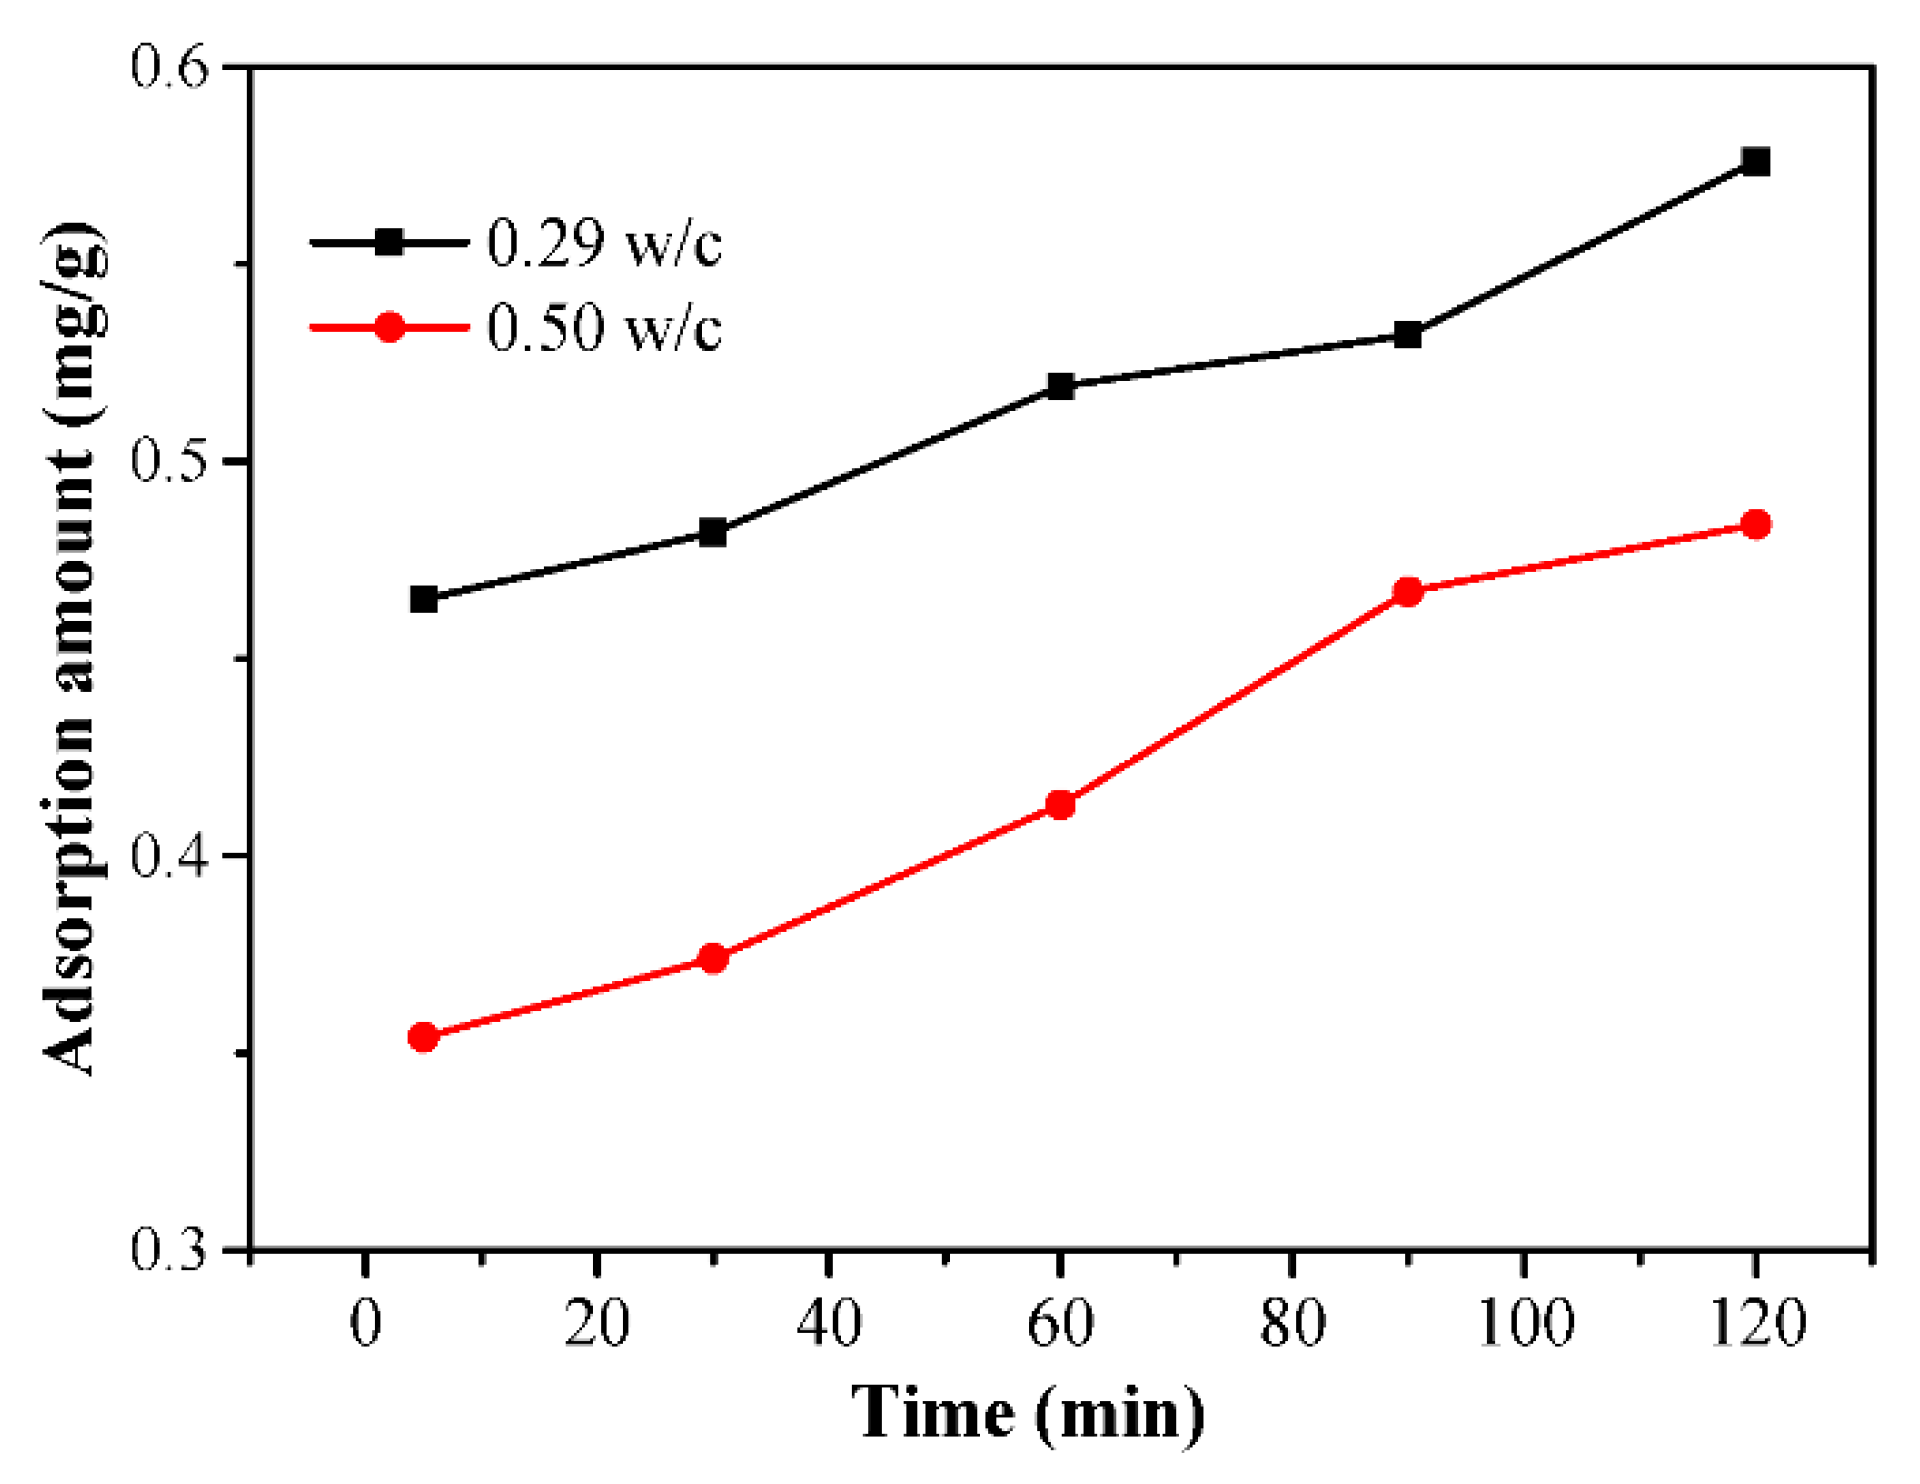
3.7. Adsorption Behavior of the PCEs and the Dispersing Power per Adsorption Amount on Cement
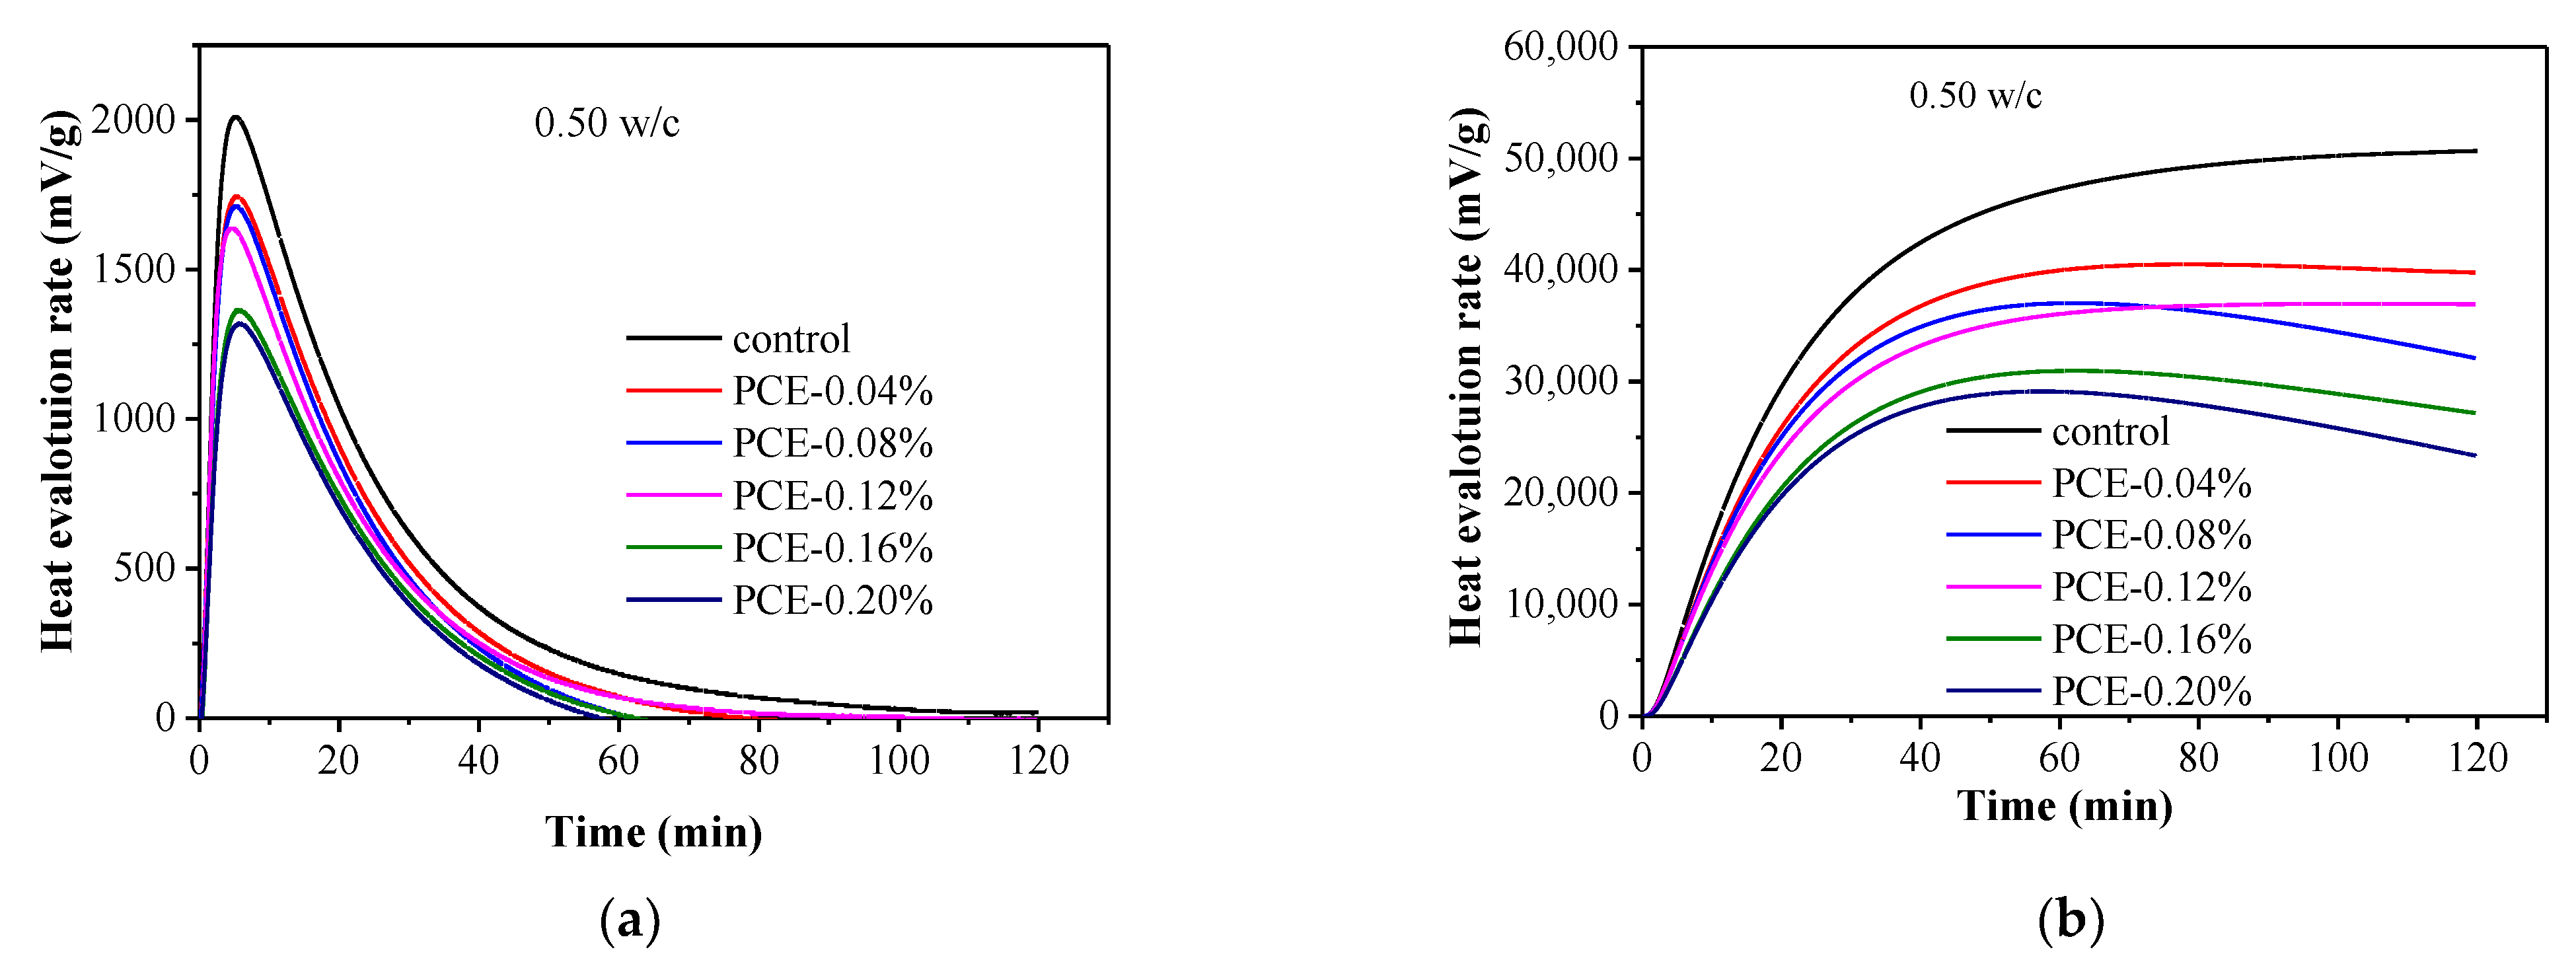
3.8. Hydration Kinetics Measurement by Calorimetry
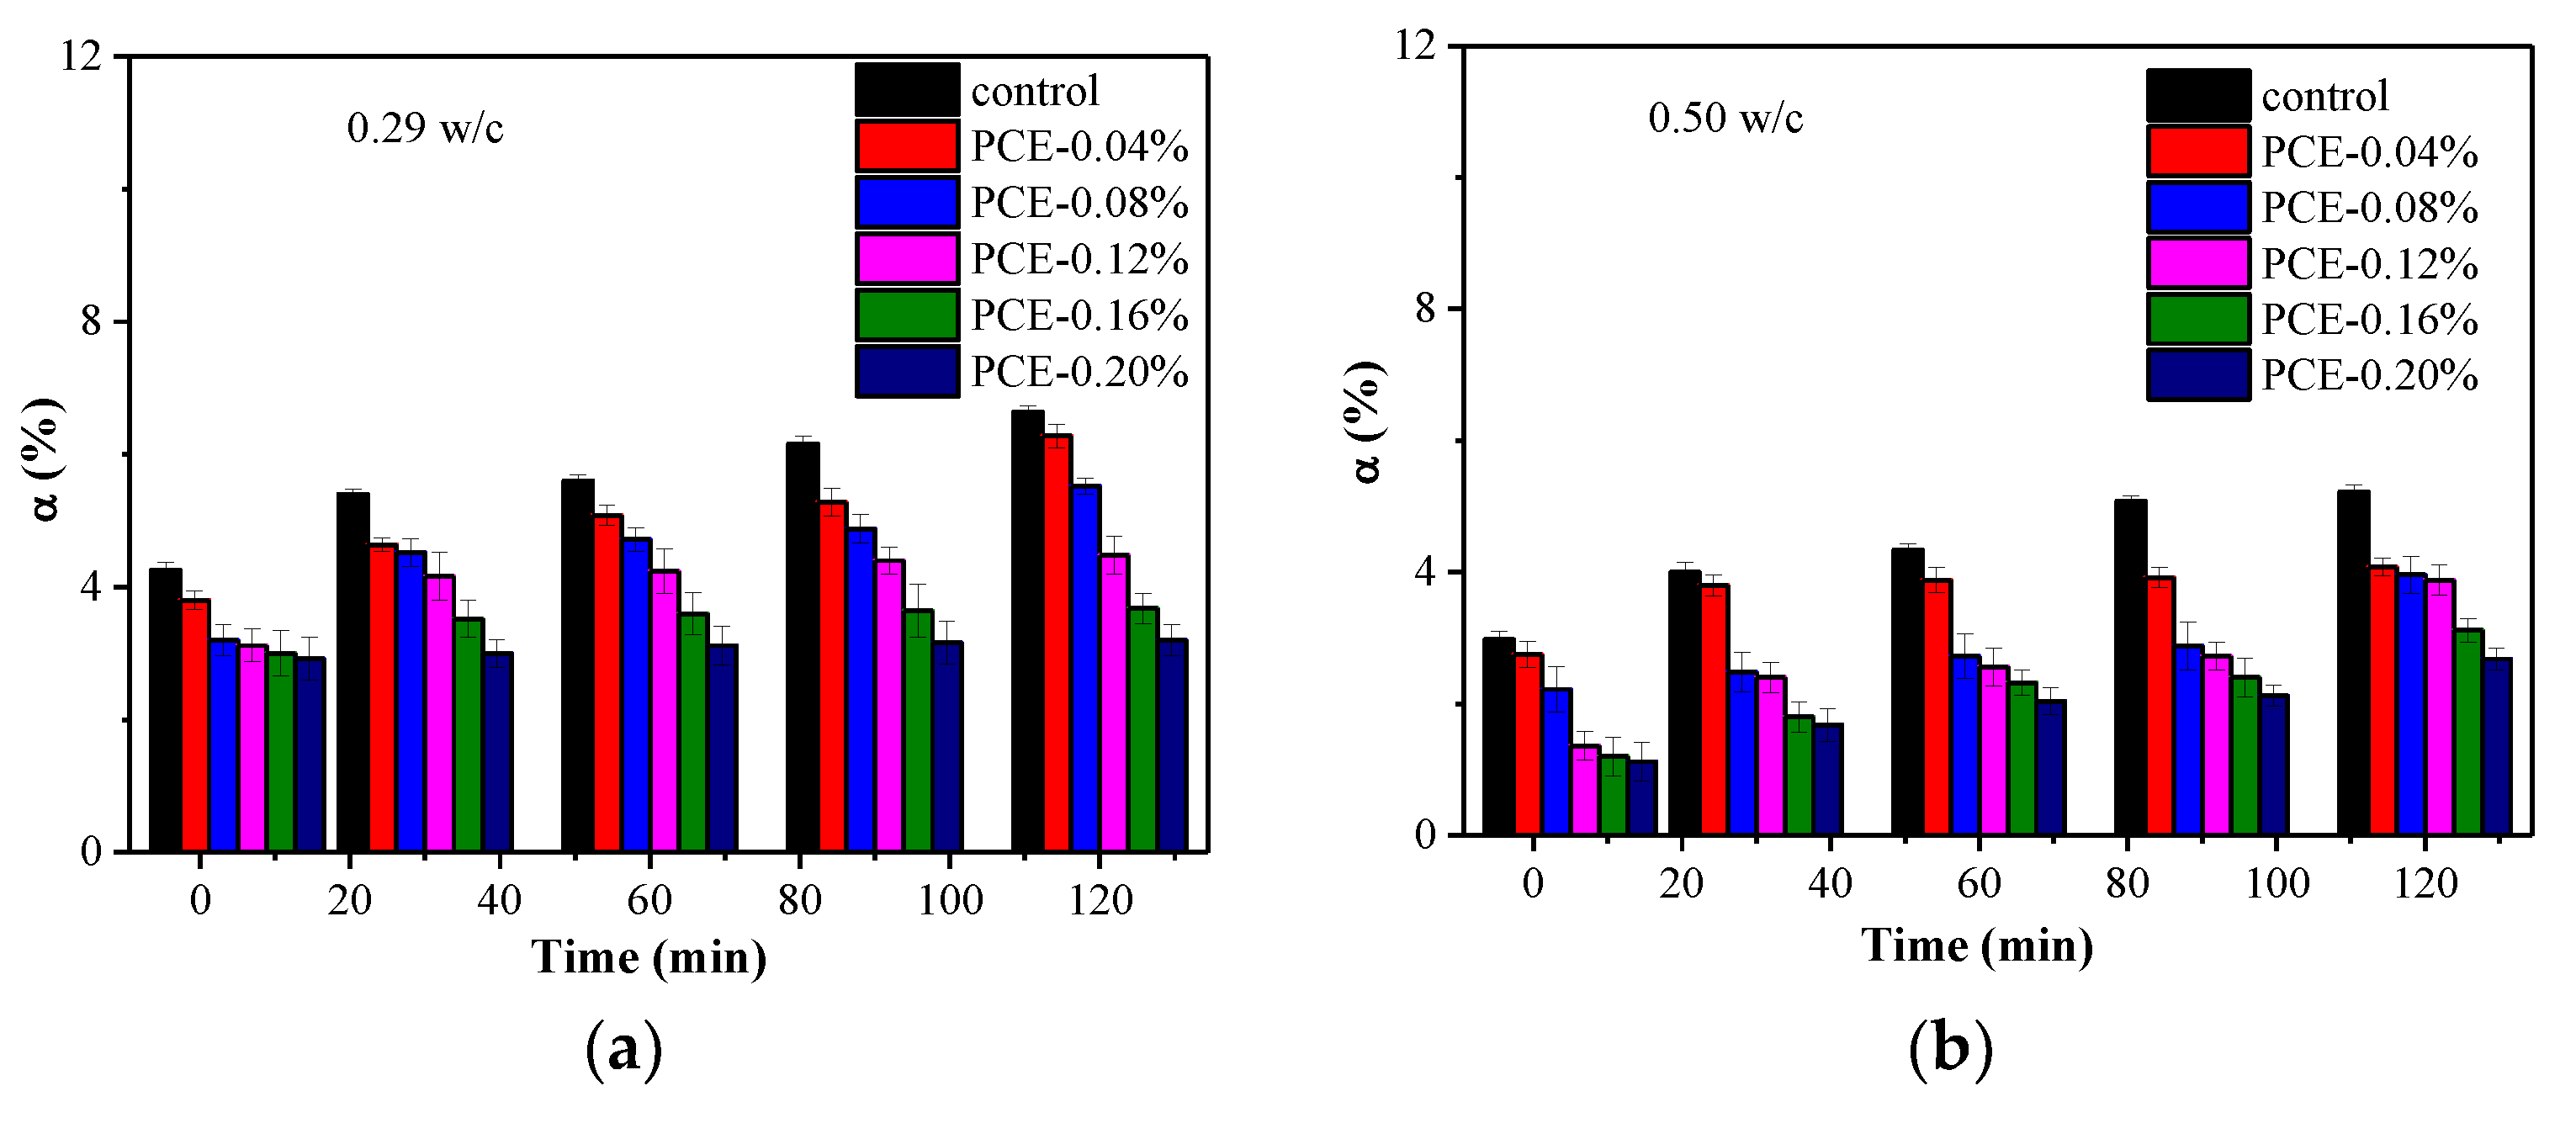
3.9. Chemically Bound Water
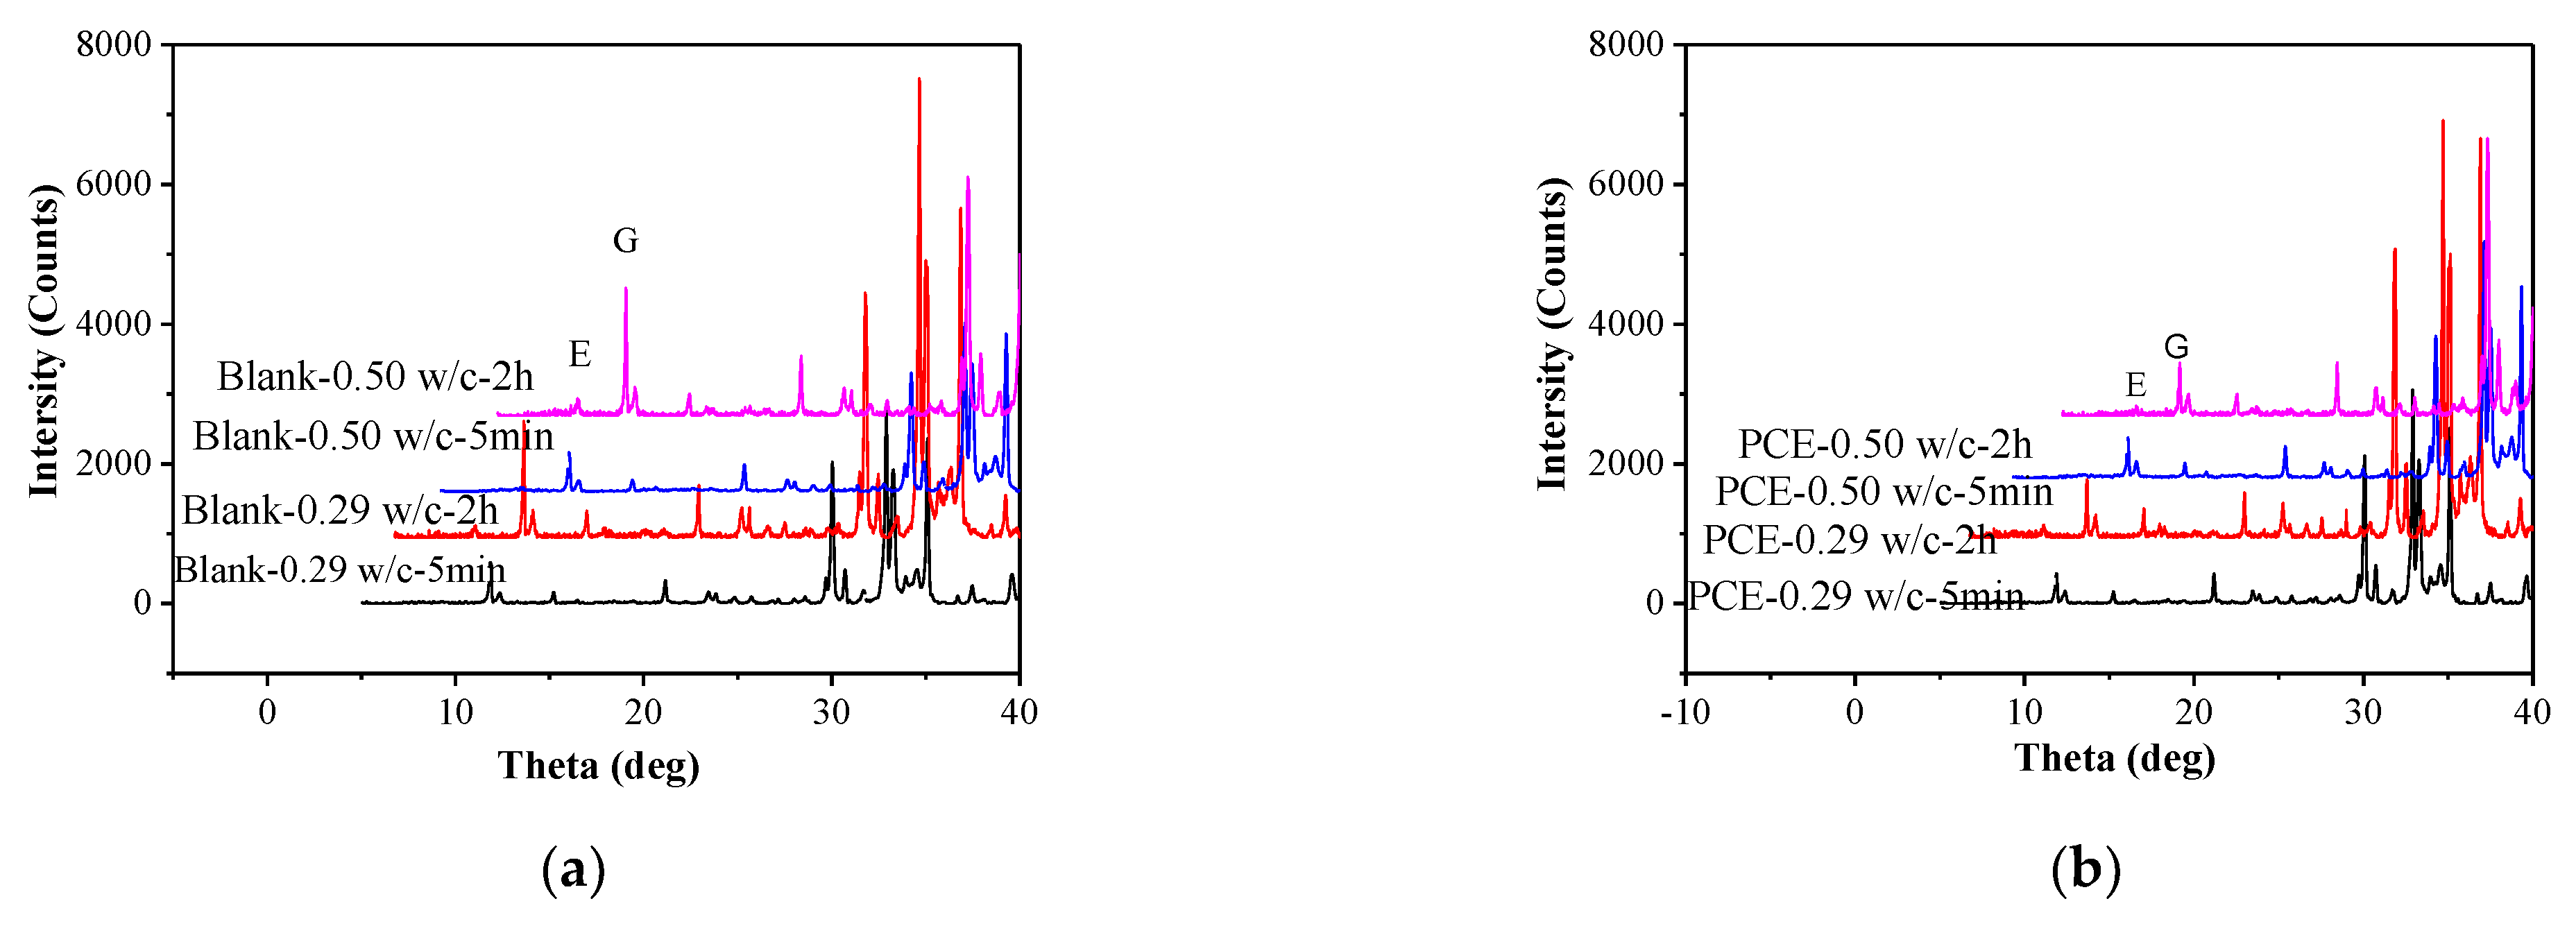
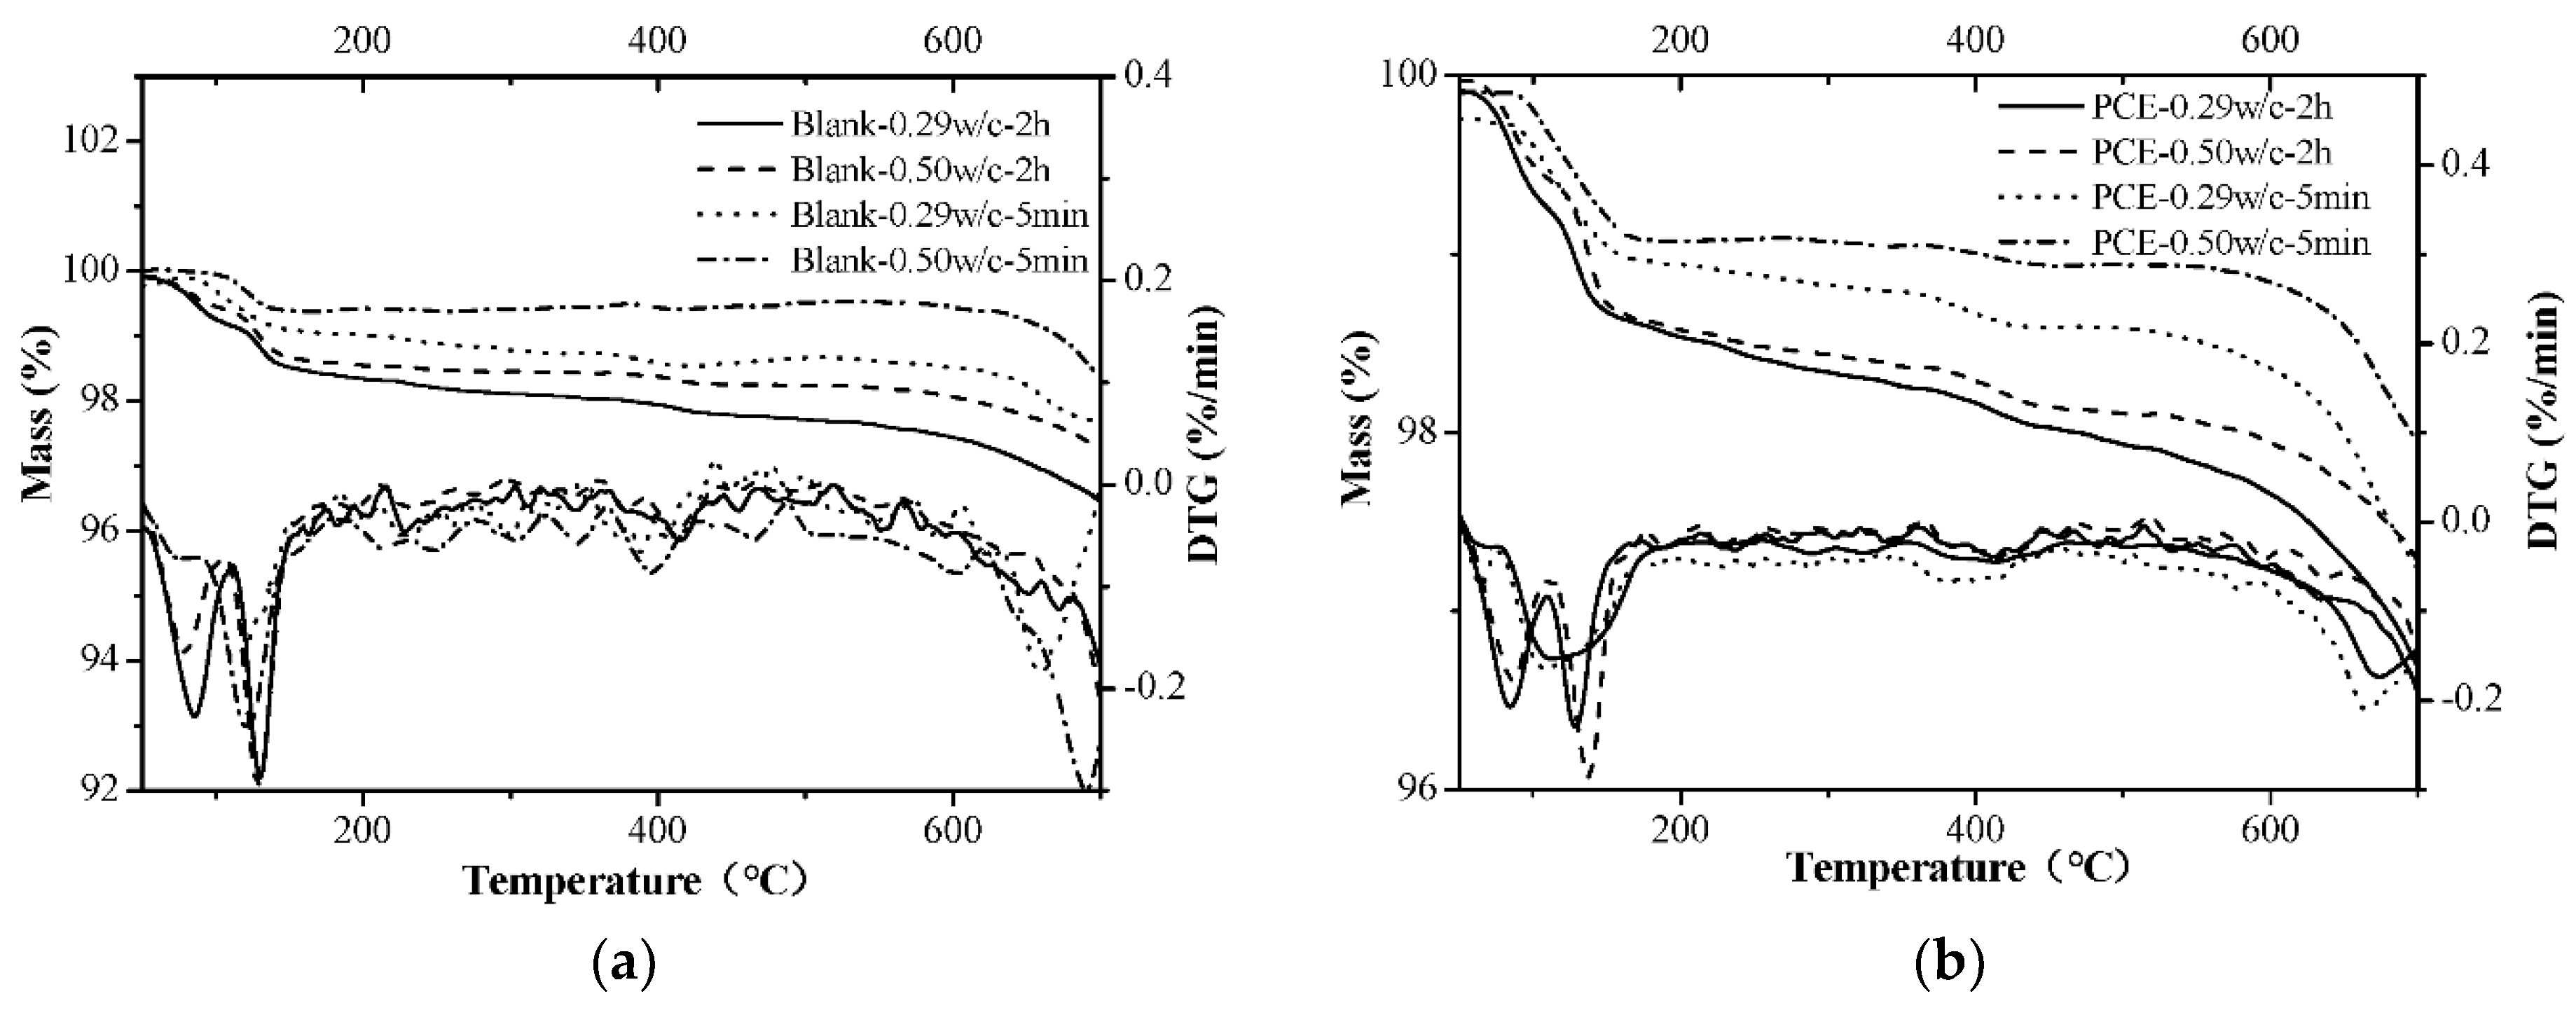
3.10. XRD and TG Analyses
4. Conclusions
- The rheological parameters decreased, and the flow parameters increased while the PCE dosages and WFT increased. However, the effects of the PCE on the rheological and flow properties of fcps differed for various w/c values. Especially for a lower w/c, the incorporation of the PCE had huge influence on rheology, flow parameters, WFT and zeta potential. This might be attributed to the more adsorption amount of the PCE on cement particles at a lower w/c than that at a higher w/c. Furthermore, the adsorption amount of the PCE mainly affects the workability of the paste and a certain increase in water exhibits a negligible influence on it.
- From the results of calorimetry, chemically bound water, XRD and TG analysis, the early hydration degree of fcps at different w/c ratios is broadly similar and the cement paste has a slightly higher hydration rate at a lower w/c than at a higher w/c. This can be attributed to the higher ion concentration at a lower w/c than that at a higher w/c.
- The early formation of the AFt crystals was largely changed by the PCE and this is the most important factor in the fluidity retention of fcps. Chemically bound water, XRD and TG measurements show that during the first 2 h the incorporation of the PCE significantly slows down the early formation of Aft crystals, particularly in a lower w/c paste due to a larger adsorption amount of the PCE at a lower w/c. Furthermore, at the same dosage of the PCEs, the cement paste has a higher hydration rate at a lower w/c than at a higher w/c, although larger adsorption amounts of the PCEs at a lower w/c correspond to stronger inhibition of hydration. Therefore, if the PCE dosage is the same at various w/c ratios, the fluidity loss of the cement paste is much more dramatic at a higher w/c than at a lower w/c.
Author Contributions
Funding
Institutional Review Board Statement
Informed Consent Statement
Data Availability Statement
Conflicts of Interest
References
- Yoshioka, K. Role of steric hindrance in the performance of superplasticizers for concrete. J. Am. Ceram. Soc. 1997, 80, 2667–2671. [Google Scholar] [CrossRef]
- Zhao, M.; Zhang, X.; Zhang, Y.J. Effect of free water on the flowability of cement paste with chemical or mineral admixtures. Constr. Build. Mater. 2016, 111, 571–579. [Google Scholar] [CrossRef]
- Tian, H.W.; Kong, X.M.; Cui, Y.; Wang, Q.B.; Wang, D.M. Effects of polycarboxylate superplasticizers on fluidity and early hydration in suloaluminate cement system. Constr. Build. Mater. 2019, 228, 116711. [Google Scholar] [CrossRef]
- Zhang, Y.R.; Cai, X.P.; Kong, X.M.; Gao, L. Effect of comb–shaped superplasticizers with different charge characteristics on the microstructure and properties of fresh cement pastes. Constr. Build. Mater. 2017, 155, 441–450. [Google Scholar] [CrossRef]
- Zingg, A.; Winnefeld, F.; Holzer, L.; Pakusch, J.; Becker, S.; Gauckler, L. Adsorption of polyelectrolytes and its influence on the rheology, zeta potential and microstructure of various cement and hydrate phases. J. Colloid Interface Sci. 2008, 323, 301–312. [Google Scholar] [CrossRef] [PubMed]
- Plank, J.; Sakai, E.; Miao, C.W.; Yu, C.; Hong, J.X. Chemical admixtures–Chemistry, applications and their impact on concrete microstructure and durability. Cem. Concr. Res. 2015, 78, 81–99. [Google Scholar] [CrossRef]
- Scrivener, K.L.; Juilland, P.; Monteiro, P.J.M. Advances in understanding hydration of portland cement. Cem. Concr. Res. 2015, 78, 38–56. [Google Scholar] [CrossRef]
- Sha, S.N.; Wang, M.; Shi, C.J.; Xiao, Y.C. Influence of the structures of polycarboxylate superplasticizer on its performance in cement–based materials—A review. Constr. Build. Mater. 2020, 233, 117257. [Google Scholar] [CrossRef]
- Shu, X.; Ran, Q.P.; Liu, J.P.; Zhao, H.X.; Zhang, Q.; Wang, X.M.; Yang, Y.; Liu, J.Z. Tailoring the solution conformation of polycarboxylate superplasticizer toward the improvement of dispersing performance in cement paste. Constr. Build. Mater. 2016, 116, 289–298. [Google Scholar] [CrossRef]
- Wu, B.; Chun, B.W.; Gu, L.; Kuhl, T.L. Effect of Ca2+ ion concentration on adsorption of poly(carboxylate ether)—Based (PCE) superplasticizer on mica. J. Colloid Interface Sci. 2018, 527, 195–201. [Google Scholar] [CrossRef]
- Cheung, J.; Jeknavorian, A.; Roberts, L.; Silva, D. Impact of admixtures on the hydration kinetics of portland cement. Cem. Concr. Res. 2011, 41, 1289–1309. [Google Scholar] [CrossRef]
- Kwan, A.K.H.; Fung, W.W.S.; Wong, H.H.C. Water film thickness, flowablility and rheology of cement–sand mortar. Adv. Cem. Res. 2010, 22, 3–14. [Google Scholar] [CrossRef]
- Li, L.G.; Chen, X.Q.; Chu, S.H.; Ouyang, Y.; Kwan, A.K.H. Seawater cement paste: Effects of seawater and roles of water film thickness and superplasticizer dosage. Constr. Build. Mater. 2019, 229, 116862. [Google Scholar] [CrossRef]
- Wong, H.H.C.; Kwan, A.K.H. Rheology of cement paste: Role of excess water to solid surface area ratio. J. Mater. Civ. Eng. 2018, 201, 89–197. [Google Scholar] [CrossRef]
- Wu, Q.; An, X.H.; Liu, C.N. Effect of polycarboxylate–type superplasticizer on the paste fluidity based on the water film thickness of flocs. Sci. China Technol. Sci. 2014, 57, 1522–1531. [Google Scholar] [CrossRef]
- Kismi, M.; Saint-Arroman, J.C.; Mounanga, P. Minimizing water dosage of superplasticized mortars and concretes for a given consistency. Constr. Build. Mater. 2012, 28, 747–758. [Google Scholar] [CrossRef]
- Li, L.G.; Kwan, A.K.H. Role of superplasticizer dosage, water film thickness and slurry film thickness in flowability of cementitious paste. Adv. Cem. Res. 2017, 29, 287–301. [Google Scholar] [CrossRef]
- Li, L.G.; Kwan, A.K.H. Effect of superplasticizer type on packing density, water film thickness and flowability of cementitious paste. Constr. Build. Mater. 2015, 86, 113–119. [Google Scholar] [CrossRef]
- Yamada, K.; Takahashi, T.; Hanehara, S.; Matsuhisa, M. Effects of the chemical structure on the properties of polycarboxylate–type superplastivizer. Cem. Concr. Res. 2000, 30, 197–207. [Google Scholar] [CrossRef]
- Zingg, A.; Holzer, L.; Kaech, A.; Winnefeld, F.; Pakusch, J.; Becker, S.; Gauckler, L. The microstructure of dispersed and non-dispersed fresh cement pastes—New insight by cro-microscopy. Cem. Concr. Res. 2008, 38, 522–529. [Google Scholar] [CrossRef]
- Puertas, F.; Santos, H.; Palacios, M.; Martínez-Ramírez, S. Polycarboxylate superplasticizer admixtures: Effect on hydration, microstructure and rheological behavior in cement pastes. Adv. Cem. Res. 2005, 17, 77–89. [Google Scholar] [CrossRef]
- Roncero, J.; Valls, S.; Gettu, R. Study of the influence of superplasticizers on the hydration of cement paste using nuclear magnetic resonance and X–ray diffraction techniques. Cem. Concr. Res. 2002, 30, 103–108. [Google Scholar] [CrossRef]
- Jansen, D.; Neubauer, J.; Goetz–Neunhoeffer, F.; Haerzschel, R.; Hergeth, W.D. Change in reaction kinetics of a portland cement caused by a superplasticizer–calculation of heat flow curves from XRD data. Cem. Concr. Res. 2012, 42, 327–332. [Google Scholar] [CrossRef]
- Tian, H.W.; Kong, X.M.; Su, T.; Wang, D.M. Comparative study of two PCE superplasticizers with varied charge density in portland cement and sulfoaluminate cement systems. Cem. Concr. Res. 2019, 115, 43–58. [Google Scholar] [CrossRef]
- Kreppelt, F.; Weibel, M.; Zampini, D.; Rorner, M. Influence of solution chemistry on the hydration of polished clinker surfaces-a study of different types of polycarboxylic acid-based admixtures. Cem. Concr. Res. 2002, 32, 187–198. [Google Scholar] [CrossRef]
- Hu, J.; Ge, Z.; Wang, K. Influence of cement fineness and water–to–cement ratio on motar early–age heat of hydration and set times. Constr. Build. Mater. 2014, 50, 657–663. [Google Scholar] [CrossRef]
- Ley–Hernandez, A.M.; Lapeyre, J.; Cook, R.; Kumar, A.; Feys, D. Elucidating the effect of water–to–cement ratio on the hydration mechanisms of cement. Am. Chem. Soc. 2018, 3, 5092–5105. [Google Scholar] [CrossRef] [PubMed]
- Kirby, D.M.; Biernacki, J.J. The effect of water–to–cement ratio on the hydration kinetics of tricalcium silicate cements: Testing the two–step hydration hypothesis. Cem. Concr. Res. 2012, 42, 1147–1156. [Google Scholar] [CrossRef]
- Wong, H.H.S.; Kwan, A.K.H. Packing density of cementitious materials: Part 1–measurement using a wet packing method. Mater. Struct. 2008, 41, 689–701. [Google Scholar] [CrossRef]
- Li, L.G.; Zhuo, H.X.; Zhu, J.; Kwan, A.K.H. Packing density of mortar containing polypropylene carbon or basalt fibres under dry and wet conditions. Powder Technol. 2019, 342, 433–440. [Google Scholar] [CrossRef]
- Feng, Q.G.; Li, H.X.; Yang, Y.; Song, B.L.; Huang, X.Q.; Wang, X.Y.; Wang, D.B. Test Equipment and Test Method for Isothermal Measurement of Initial Hydration Characteristic of Cement. China Patent ZL 2014 1 0592395. 9, 29 May 2017. [Google Scholar]
- Mouret, M.; Bascoul, A.; Escadeillas, G. Study of the degree of hydration of concrete by means of image analysis and chemically bound water. Adv. Cem. Based Mater. 1997, 6, 109–115. [Google Scholar] [CrossRef]
- Shui, L.L.; Sun, Z.P.; Yang, H.J.; Yang, X.; Ji, Y.L.; Luo, Q. Experimental evidence for a possible dispersion mechanism of polycarboxylate–type superplasticisers. Adv. Cem. Res. 2016, 28, 287–297. [Google Scholar] [CrossRef]
- Liu, H.R.; Sun, X.; Du, H.; Lu, H.; Ma, Y.S.; Shen, W.K. Effects and threshold of water film thickness on multi–mineral cement paste. Cem. Concr. Compos. 2020, 112, 103677. [Google Scholar] [CrossRef]
- Wang, A.; Zhang, C.; Sun, W. Fly ash effects: I. The morphological effect of fly ash. Cem. Concr. Res. 2003, 33, 2023–2029. [Google Scholar] [CrossRef]
- Kwan, A.K.H.; Fung, W.W.S. Roles of water film thickness and SP dosage in rheology and cohesiveness of mortar. Cem. Concr. Compos. 2020, 34, 121–130. [Google Scholar] [CrossRef]
- Rößler, C.; Eberhardt, A.; Kučerová, H.; Möser, B. Influence of hydration on the fluidity of normal Portland cement pastes. Cem. Concr. Compos. 2008, 38, 897–906. [Google Scholar] [CrossRef]
- Zhang, L.; Miao, X.; Kong, X.M.; Zhou, S. Retardation effect of PCE superplasticizers with different architectures and their impacts on early strength of cement mortar. Cem. Concr. Compos. 2019, 104, 103369. [Google Scholar] [CrossRef]
- Kong, X.M.; Pakusch, J.; Jansen, D.; Emmerling, S.; Neubauer, J.; Goetz-Neuhoeffer, F. Effect of polymer latexes with cleaned serum on the phase development of hydrating cement pastes. Cem. Concr. Res. 2016, 84, 30–40. [Google Scholar] [CrossRef]
- Šiler, P.; Kolářová, I.; Krátký, J.; Havlica, J.; Brandštetr, J. Influence of superplasticizers on the course of portland cement hydration. Chem. Pap. 2014, 68, 90–97. [Google Scholar] [CrossRef]


| Chemical Composition (Mass %) | Mineral Composition (Mass %) | |||||||||||
|---|---|---|---|---|---|---|---|---|---|---|---|---|
| SiO2 | Al2O3 | Fe2O3 | CaO | MgO | SO3 | Na2Oeq | f-CaO | Cl− | C3S | C2S | C3A | C4AF |
| 22.01 | 4.47 | 3.45 | 64.31 | 2.45 | 2.45 | 0.512 | 0.90 | 0.01 | 56.26 | 19.99 | 6.13 | 11.00 |
| Mix No. | Packing Density | Water Ratio | Excess Water Ratio | Specific Surface Area (m2/m3) | Water Film Thickness (μm) |
|---|---|---|---|---|---|
| C–0.00–0.29 | 0.546 | 0.916 | 0.084 | 1,156,000 | 0.073 |
| C–0.04–0.29 | 0.563 | 0.916 | 0.146 | 1,156,000 | 0.121 |
| C–0.08–0.29 | 0.581 | 0.916 | 0.194 | 1,156,000 | 0.168 |
| C–0.12–0.29 | 0.585 | 0.916 | 0.206 | 1,156,000 | 0.178 |
| C–0.16–0.29 | 0.588 | 0.916 | 0.240 | 1,156,000 | 0.186 |
| C–0.20–0.29 | 0.590 | 0.916 | 0.249 | 1,156,000 | 0.191 |
| C–0.00–0.35 | 0.546 | 1.106 | 0.274 | 1,156,000 | 0.237 |
| C–0.04–0.35 | 0.563 | 1.106 | 0.336 | 1,156,000 | 0.285 |
| C–0.08–0.35 | 0.581 | 1.106 | 0.384 | 1,156,000 | 0.332 |
| C–0.12–0.35 | 0.585 | 1.106 | 0.396 | 1,156,000 | 0.343 |
| C–0.16–0.35 | 0.588 | 1.106 | 0.431 | 1,156,000 | 0.351 |
| C–0.20–0.35 | 0.590 | 1.106 | 0.439 | 1,156,000 | 0.355 |
| C–0.00–0.40 | 0.546 | 1.264 | 0.432 | 1,156,000 | 0.374 |
| C–0.04–0.40 | 0.563 | 1.264 | 0.494 | 1,156,000 | 0.422 |
| C–0.08–0.40 | 0.581 | 1.264 | 0.543 | 1,156,000 | 0.469 |
| C–0.12–0.40 | 0.585 | 1.264 | 0.555 | 1,156,000 | 0.479 |
| C–0.16–0.40 | 0.588 | 1.264 | 0.589 | 1,156,000 | 0.487 |
| C–0.20–0.40 | 0.590 | 1.264 | 0.597 | 1,156,000 | 0.492 |
| C–0.00–0.50 | 0.546 | 1.580 | 0.748 | 1,156,000 | 0.647 |
| C–0.04–0.50 | 0.563 | 1.580 | 0.990 | 1,156,000 | 0.695 |
| C–0.08–0.50 | 0.581 | 1.580 | 1.075 | 1,156,000 | 0.743 |
| C–0.12–0.50 | 0.585 | 1.580 | 1.116 | 1,156,000 | 0.753 |
| C–0.16–0.50 | 0.588 | 1.580 | 1.124 | 1,156,000 | 0.761 |
| C–0.20–0.50 | 0.590 | 1.580 | 1.130 | 1,156,000 | 0.765 |
| w/c Ratios | Yield Stress Versus WFT | Viscosity Versus WFT | ||
|---|---|---|---|---|
| Fitting Equations | R2 | Fitting Equations | R2 | |
| 0.29 | τ = e(0.55 + 42.68 × WFT − 219.32 × (WFT)2) | 0.888 | τ = e(−0.05 + 15.44 × WFT − 86.22 × (WFT)2) | 0.905 |
| 0.35 | τ = e(−14.79 + 130.45 × WFT − 253.84 × (WFT)2) | 0.926 | τ = e(−3.55 + 33.132× WFT − 73.16 × (WFT)2) | 0.931 |
| 0.40 | τ = e(−39.72 + 212.73 × WFT − 272.49 × (WFT)2) | 0.991 | τ = e(−13.87 + 75.64 × WFT −104.01 × (WFT)2) | 0.988 |
| 0.50 | τ = e(−48.58 + 157.54 × WFT − 124.91 × (WFT)2) | 0.860 | τ = e(−24.86 + 84.3 × WFT − 72.73 × (WFT)2) | 0.984 |
| w/c Ratios | Flow Spread Versus WFT | |
|---|---|---|
| Fitting Equations | R2 | |
| 0.29 | τ = e(−10.87 + 41.97 × WFT − 26.30 × (WFT)2) | 0.976 |
| 0.35 | τ = e(−4.25 + 33.94 × WFT − 27.39 × (WFT)2) | 0.992 |
| 0.40 | τ = e(1.71 + 10.63 × WFT + 2.34 × (WFT)2) | 0.983 |
| 0.50 | τ = e(4.30 − 11.09 × WFT + 98.99 × (WFT)2) | 0.927 |
| Sample | 5 min | 2 h | ||
|---|---|---|---|---|
| 50–120 °C | 50–550 °C | 50–120 °C | 50–550 °C | |
| Blank-0.29 w/c | 0.41 | 1.16 | 0.86 | 2.35 |
| Blank-0.50 w/c | 0.31 | 0.97 | 0.66 | 1.76 |
| PCE0.2%-0.29 w/c | 0.39 | 1.03 | 0.76 | 2.12 |
| PCE0.2%-0.50 w/c | 0.28 | 0.92 | 0.62 | 1.65 |
Publisher’s Note: MDPI stays neutral with regard to jurisdictional claims in published maps and institutional affiliations. |
© 2021 by the authors. Licensee MDPI, Basel, Switzerland. This article is an open access article distributed under the terms and conditions of the Creative Commons Attribution (CC BY) license (https://creativecommons.org/licenses/by/4.0/).
Share and Cite
Zhu, W.; Feng, Q.; Luo, Q.; Bai, X.; Lin, X.; Zhang, Z. Effects of PCE on the Dispersion of Cement Particles and Initial Hydration. Materials 2021, 14, 3195. https://doi.org/10.3390/ma14123195
Zhu W, Feng Q, Luo Q, Bai X, Lin X, Zhang Z. Effects of PCE on the Dispersion of Cement Particles and Initial Hydration. Materials. 2021; 14(12):3195. https://doi.org/10.3390/ma14123195
Chicago/Turabian StyleZhu, Weiwei, Qingge Feng, Qi Luo, Xiukui Bai, Xianhao Lin, and Zhao Zhang. 2021. "Effects of PCE on the Dispersion of Cement Particles and Initial Hydration" Materials 14, no. 12: 3195. https://doi.org/10.3390/ma14123195
APA StyleZhu, W., Feng, Q., Luo, Q., Bai, X., Lin, X., & Zhang, Z. (2021). Effects of PCE on the Dispersion of Cement Particles and Initial Hydration. Materials, 14(12), 3195. https://doi.org/10.3390/ma14123195