
Time-Dependent Response of a Recycled C&D Material-Geotextile Interface under Direct Shear Mode


Abstract
1. Introduction
2. Materials and Methods
2.1. Materials
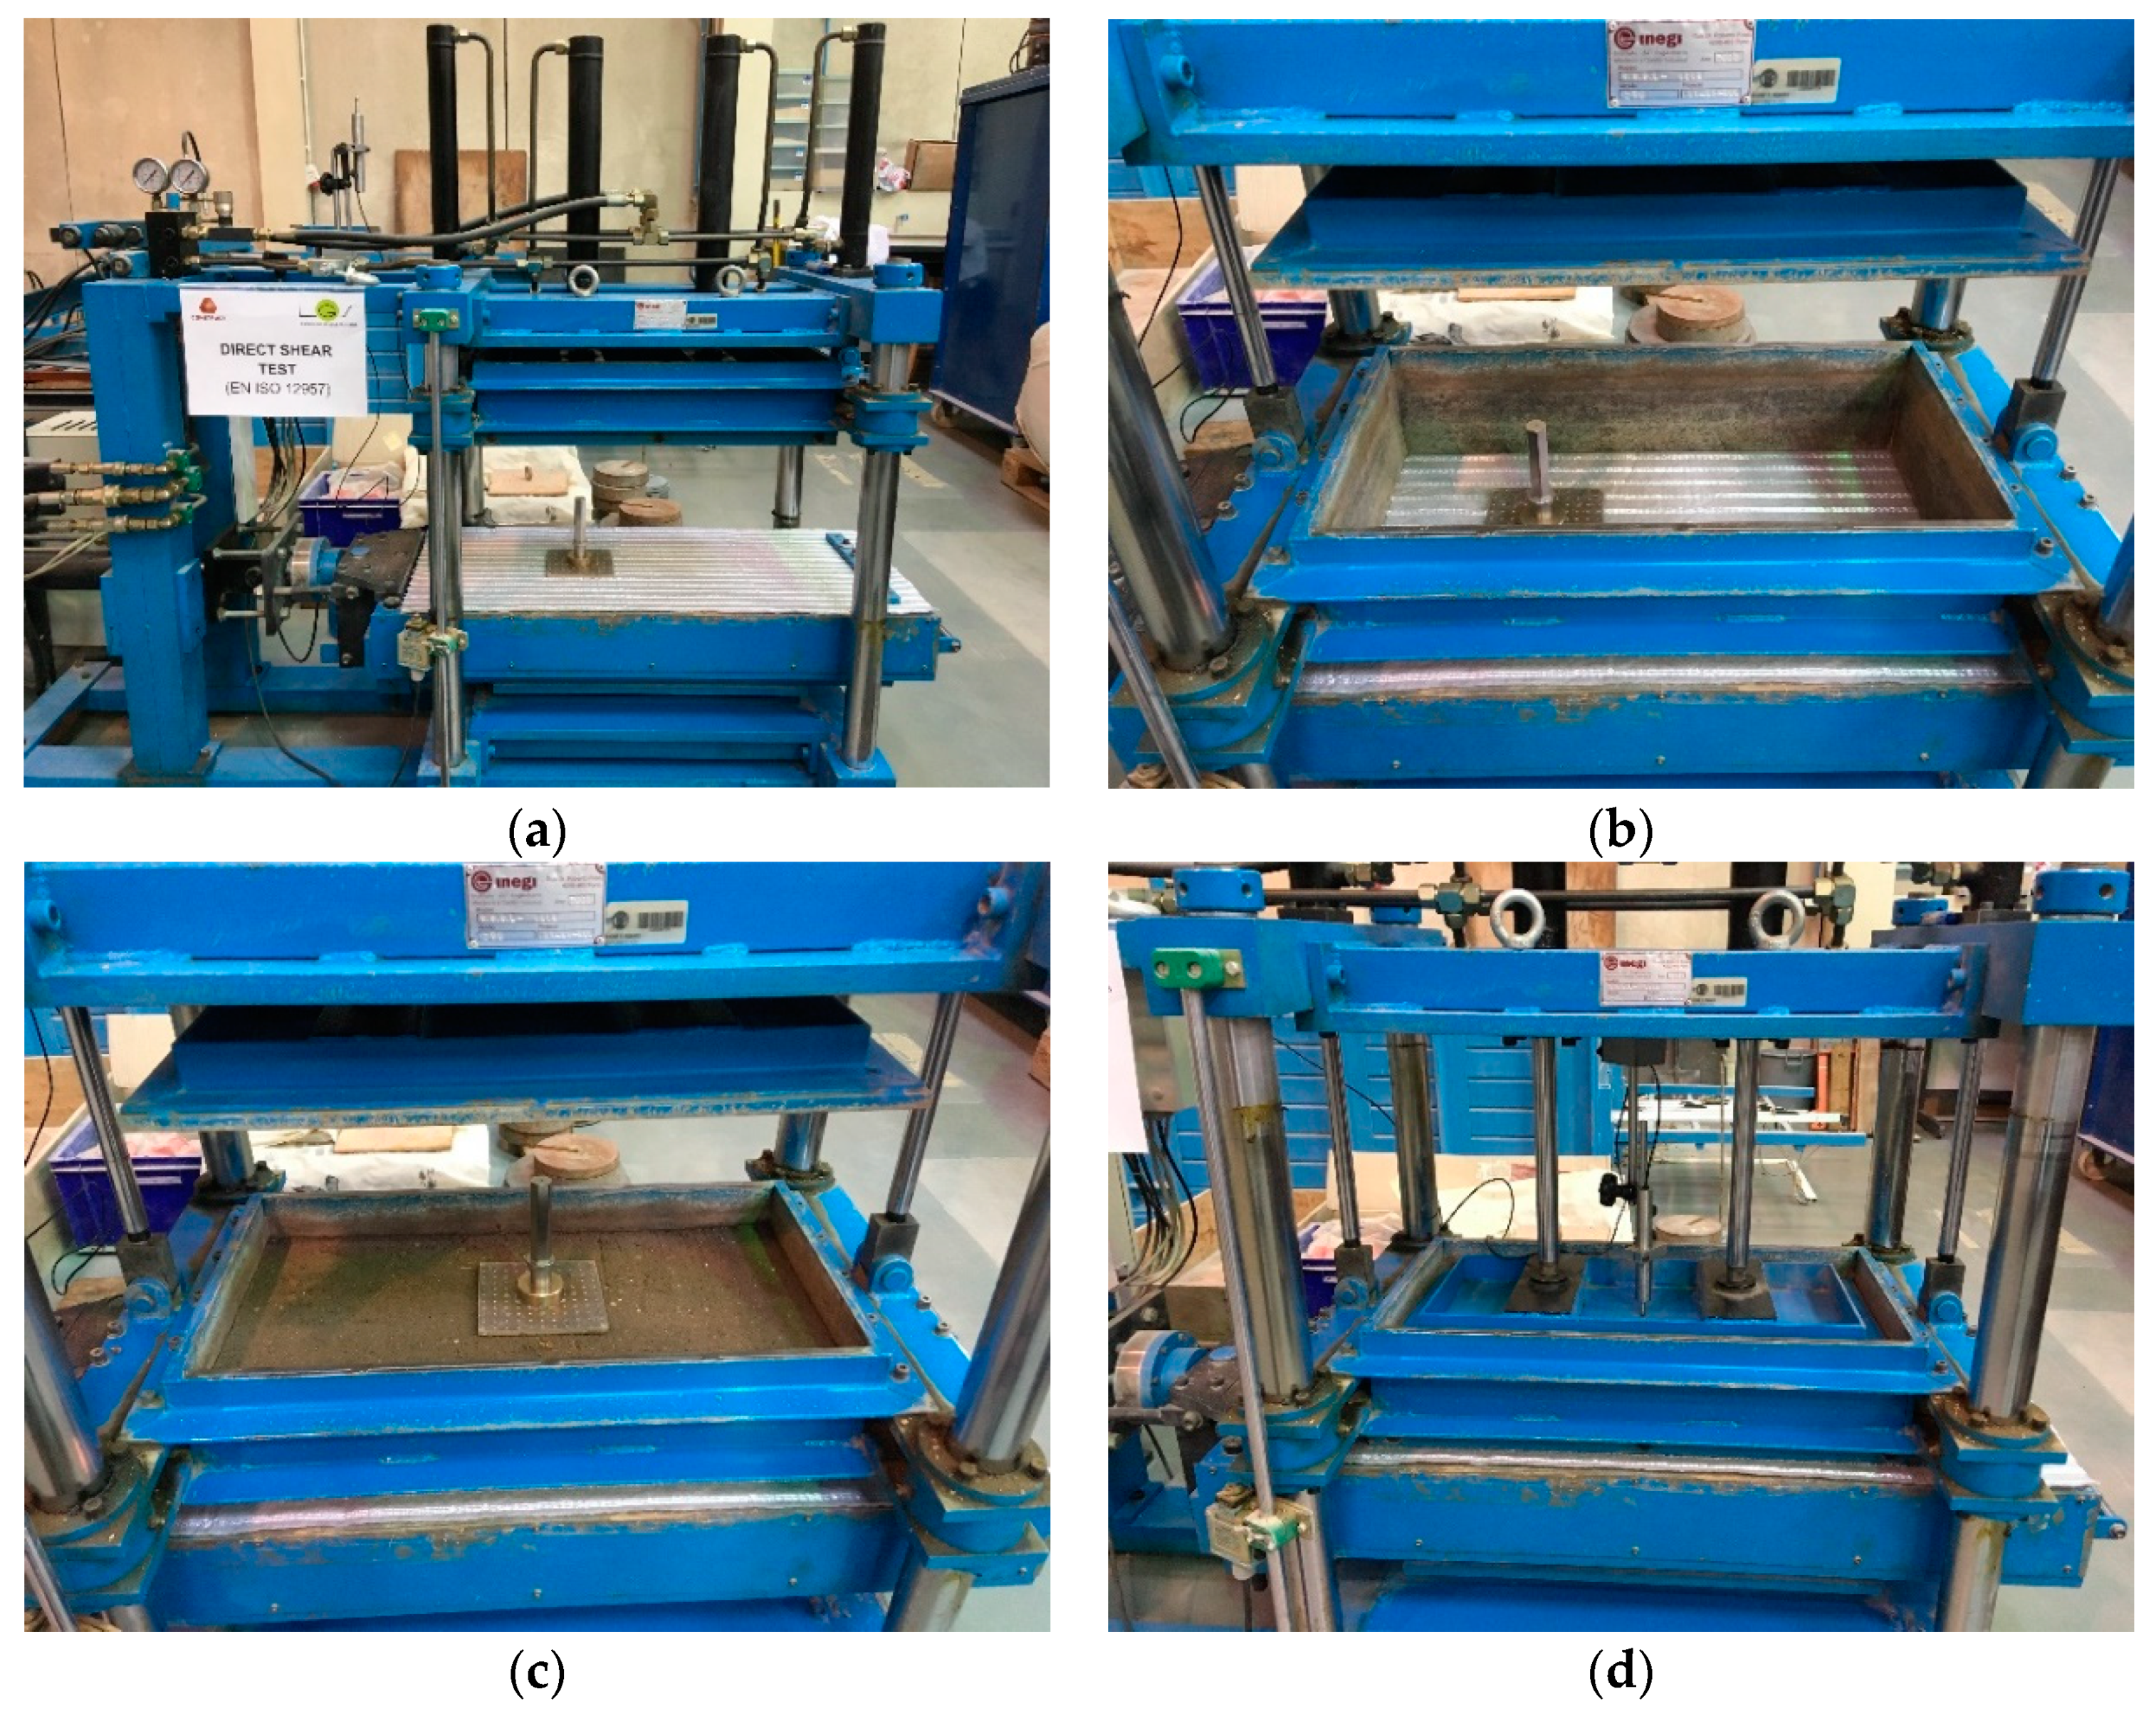
2.2. Large-Scale Direct Shear Apparatus and Test Procedures
2.3. Test Programme
3. Results and Discussion
3.1. Direct Shear Behaviour under Constant Displacement Rate
3.2. Time-Dependent Interface Behaviour
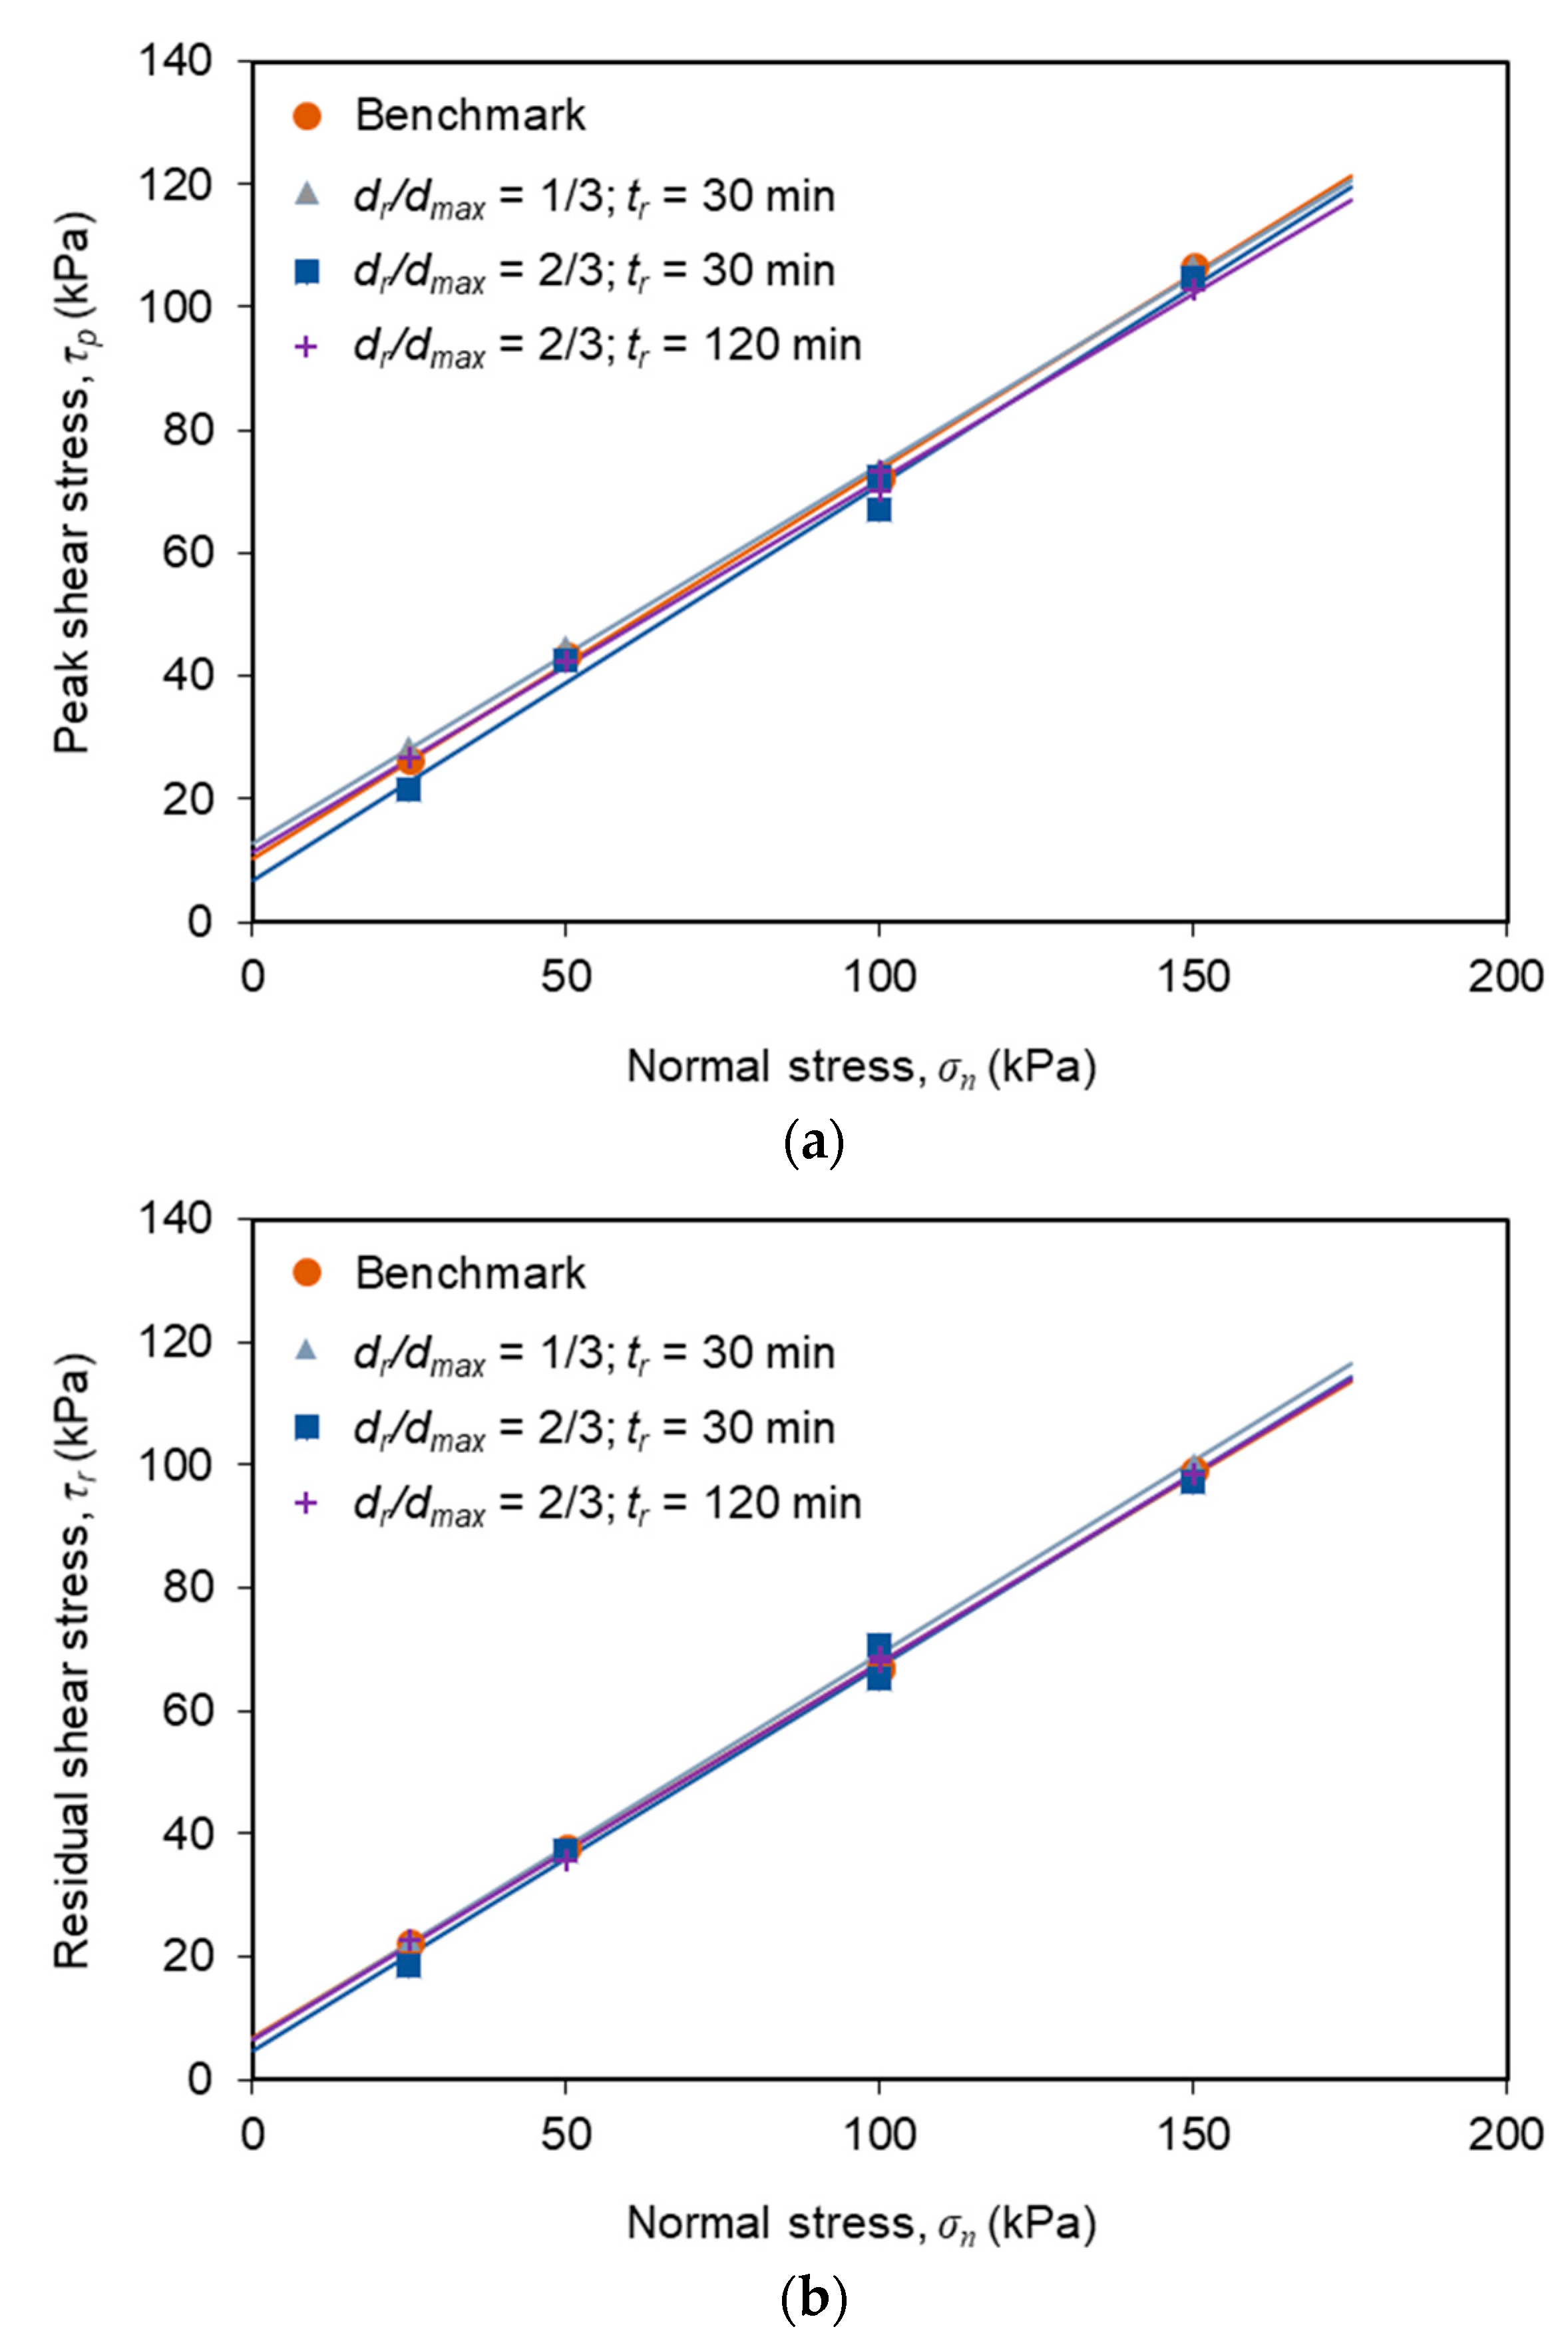
3.3. Comparison of Interface Shear Strength Envelopes
4. Conclusions
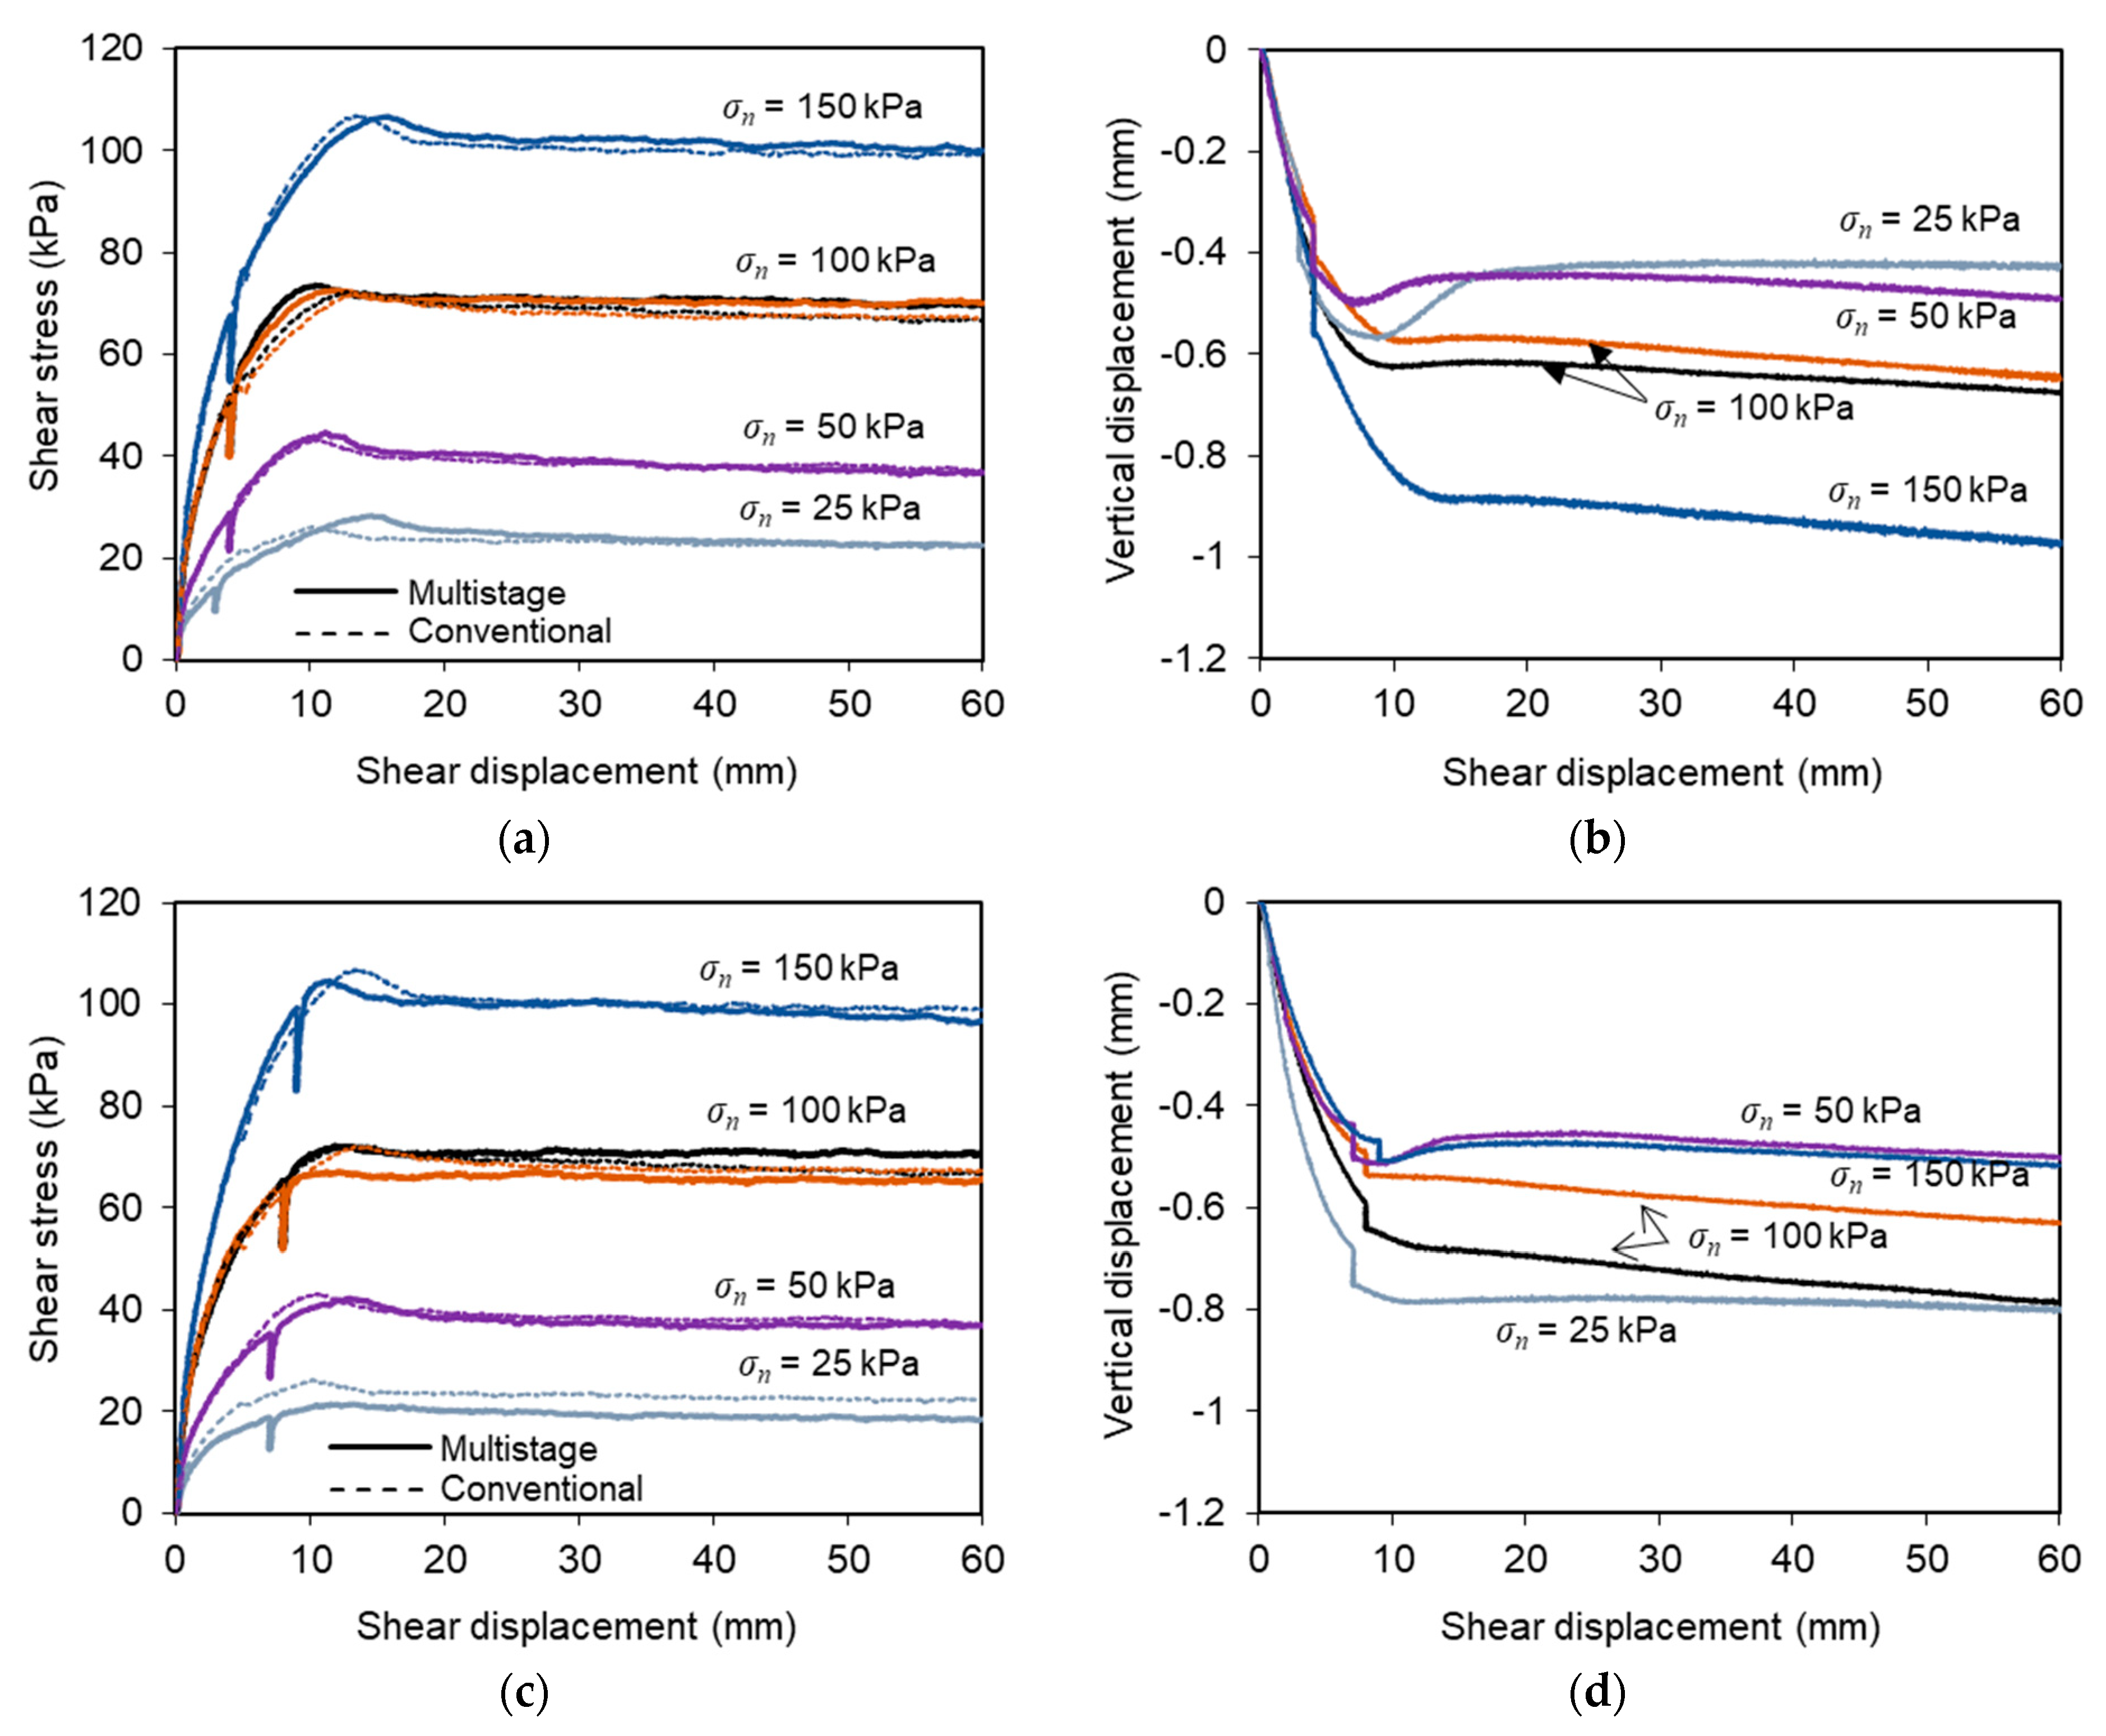
- The evolution of shear stress with shear displacement during the first and third phases of the multistage tests followed similar trends to those observed in the corresponding benchmark tests. During the period in which the shear box was restrained from any movement (tr = 30 or 120 min), the shear stress decreased progressively with time, which can be attributed to stress relaxation.
- In both the conventional and multistage direct shear tests, the specimens exhibited mainly a contractive behaviour during shearing. Throughout the stress relaxation stage, some additional vertical settlement was mobilised, albeit at a relatively slow rate. The cumulative vertical deformation at the end of the tests ranged from 0.27 to 0.97 mm in the conventional tests, and from 0.07 to 1.23 mm in the multistage tests.
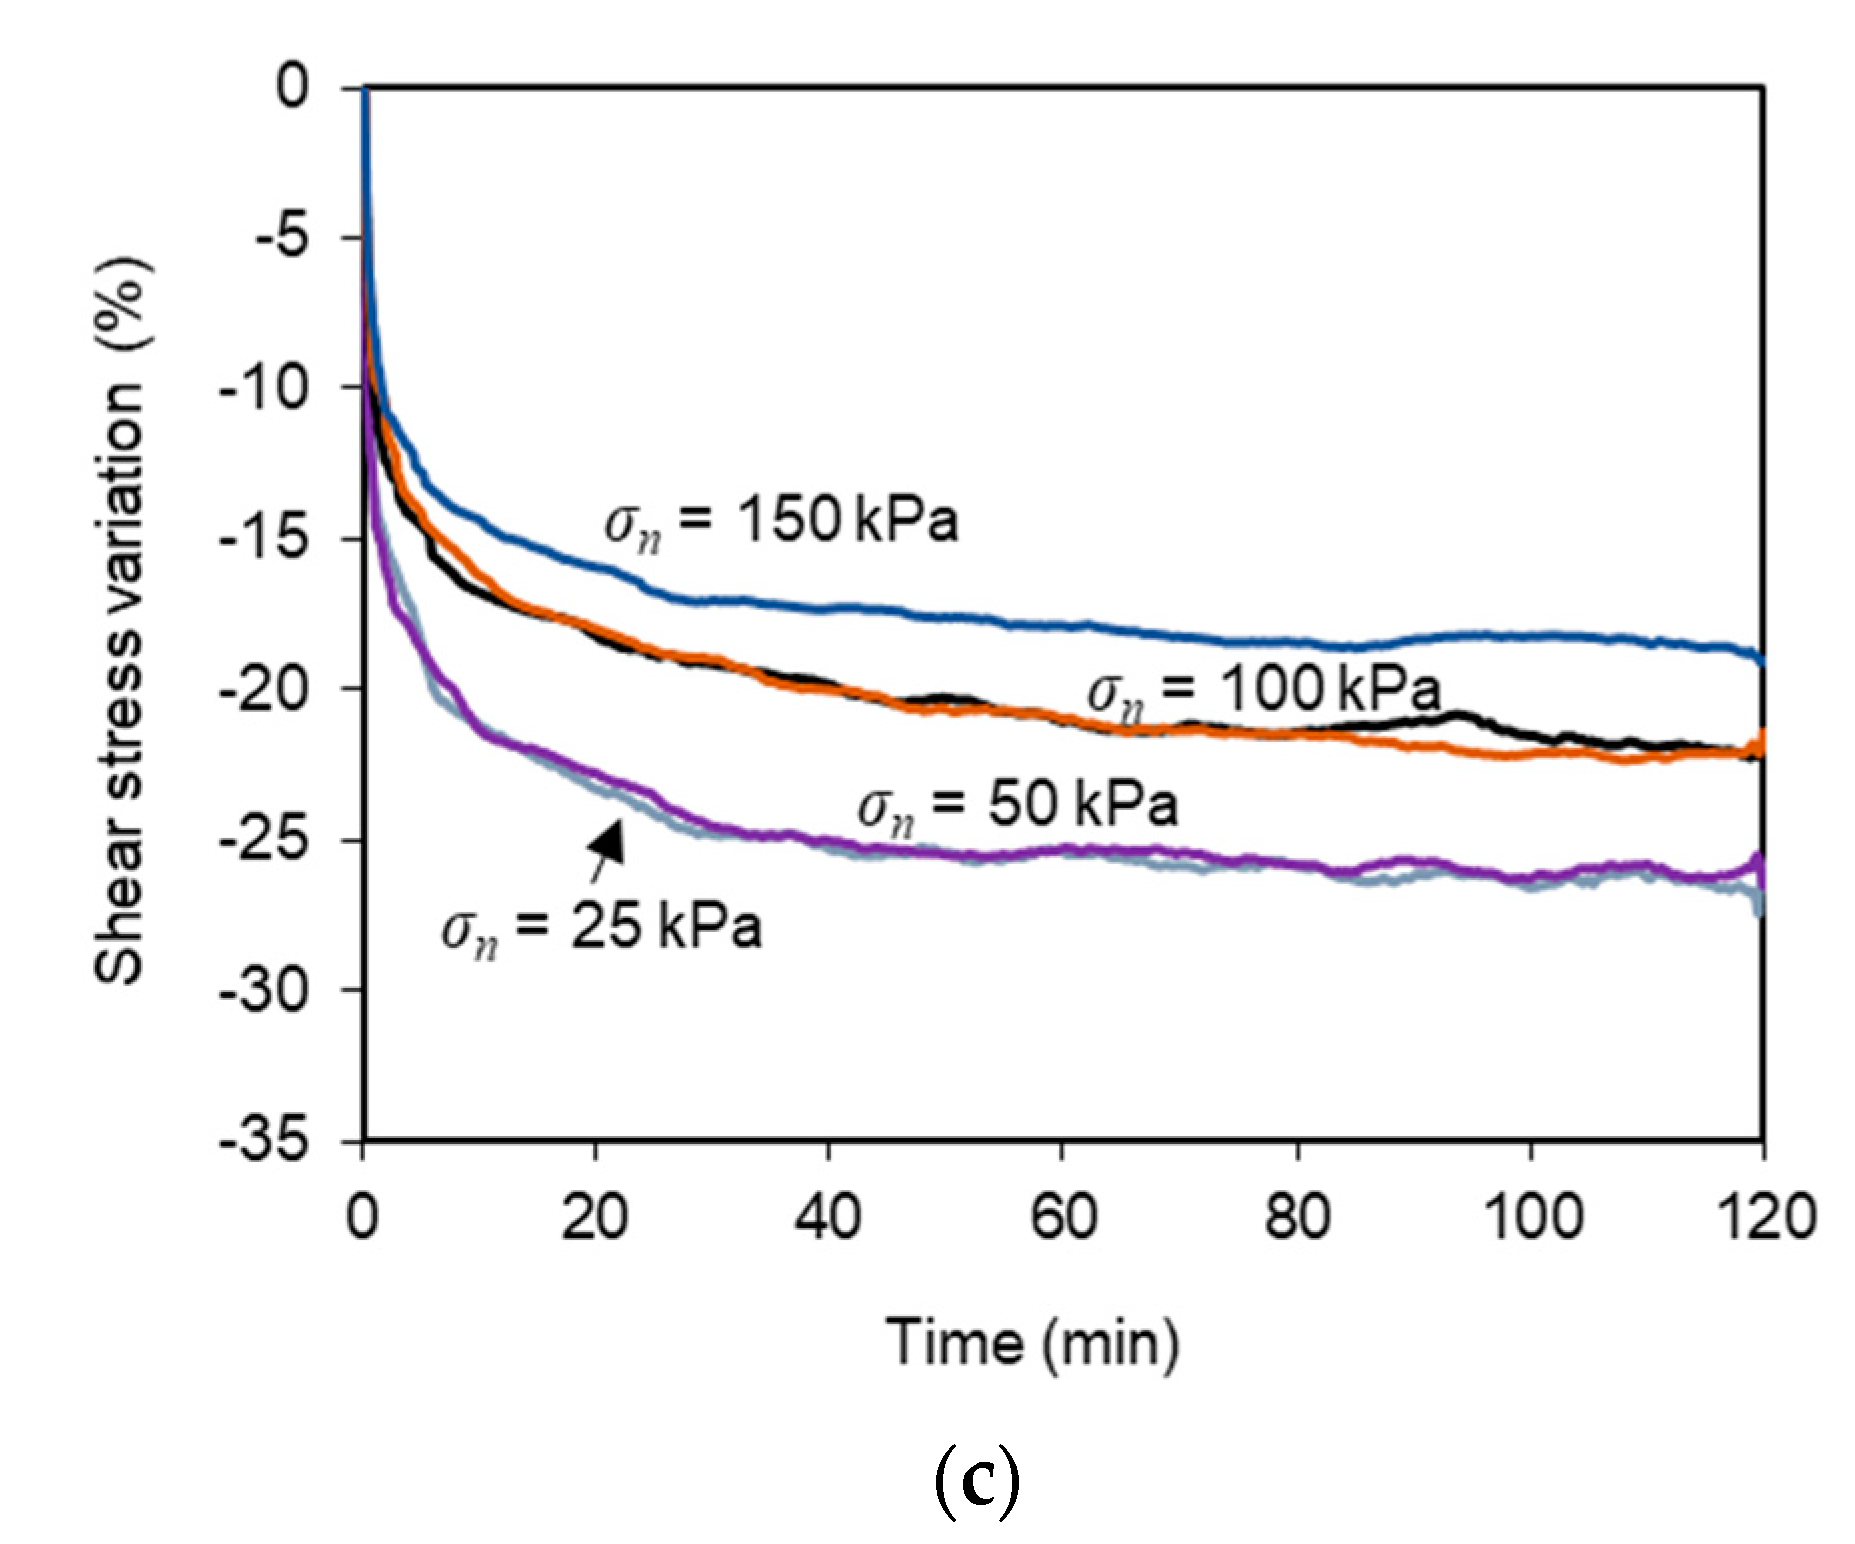
- Regardless of the test conditions (i.e., normal stress, σn, horizontal displacement, dr and duration, tr of the stress relaxation stage), the shear stress decreased at a faster rate at the beginning of the stress relaxation stage, after which the decreasing rate reduced progressively with time. Beyond the initial 30 min, the stress reduction became marginal.
- The shear stress decay, observed in the multistage tests, tended to increase with decreasing normal stress. The highest (32%) and lowest (16%) percent reductions of shear stress, at the end of the stress relaxation stage, were attained in tests conducted under the normal stresses of 25 and 150 kPa, respectively. The shear displacement at which the stress relaxation stage occurred (dr) did not significantly affect the respective percent reduction in shear stress.
- After the period of immobilization of the shear box, and once the shear displacement was restarted, the shear stress-shear displacement curves exhibited high stiffness, with the shear stress values rapidly reaching those mobilised immediately before the start of the stress relaxation stage.
- Based on the results from the conventional tests, the interface peak shear strength can be characterised by a friction angle of 32.4° and adhesion of 10.3 kPa, whereas the residual shear strength can be characterised by a friction angle of 31.4° and adhesion of 6.9 kPa. For the test conditions examined in this study, the effect of stress relaxation on the interface peak and residual shear strength was almost negligible, implying that the conventional large-scale direct shear tests can be considered suitable to evaluate the long-term interface strength properties under direct shear mode.
Author Contributions
Funding

Institutional Review Board Statement
Informed Consent Statement
Data Availability Statement
Acknowledgments
Conflicts of Interest
References
- Palmeira, E.M. Soil–geosynthetic interaction: Modelling and analysis. Geotext. Geomembr. 2009, 27, 368–390. [Google Scholar] [CrossRef]
- Lopes, M.L. Soil-geosynthetic interaction. In Handbook of Geosynthetic Engineering; Ice Publishing, Thomas Telford Ltd.: London, UK, 2012; pp. 45–66. [Google Scholar]
- Moraci, N.; Cardile, G.; Gioffrè, D.; Mandaglio, M.C.; Calvarano, L.S.; Carbone, L. Soil Geosynthetic Interaction: Design Parameters from Experimental and Theoretical Analysis. Transp. Infrastruct. Geotechnol. 2014, 1, 165–227. [Google Scholar] [CrossRef]
- Mendes, M.J.A.; Palmeira, E.M.; Matheus, E. Some factors affecting the in-soil load–strain behaviour of virgin and damaged nonwoven geotextiles. Geosynth. Int. 2007, 14, 39–50. [Google Scholar] [CrossRef]
- Liu, C.-N.; Ho, Y.-H.; Huang, J.-W. Large scale direct shear tests of soil/PET-yarn geogrid interfaces. Geotext. Geomembr. 2009, 27, 19–30. [Google Scholar] [CrossRef]
- Ezzein, F.M.; Bathurst, R.J. A new approach to evaluate soil-geosynthetic interaction using a novel pullout test apparatus and transparent granular soil. Geotext. Geomembr. 2014, 42, 246–255. [Google Scholar] [CrossRef]
- Ferreira, F.; Vieira, C.; Lopes, M.; Carlos, D. Experimental investigation on the pullout behaviour of geosynthetics embedded in a granite residual soil. Eur. J. Environ. Civ. Eng. 2015, 20, 1147–1180. [Google Scholar] [CrossRef]
- Ferreira, F.B.; Vieira, C.S.; Lopes, M.L. Soil-geosynthetic interface strength properties from inclined plane and direct shear tests—A comparative analysis. In Proceedings of the 6th Asian Regional Conference on Geosynthetics, New Delhi, India, 8–11 November 2016; pp. 925–937. [Google Scholar]
- Shaykhi, P.; Briançon, L.; Lajevardi, S.H. Experimental evaluation of geosynthetics interface friction with a new procedure by using inclined plane. Innov. Infrastruct. Solut. 2020, 5, 1–12. [Google Scholar] [CrossRef]
- Ferreira, F.B.; Vieira, C.S.; Lopes, M.D.L. Pullout Behavior of Different Geosynthetics—Influence of Soil Density and Moisture Content. Front. Built Environ. 2020, 6, 1–13. [Google Scholar] [CrossRef]
- Chen, J.-F.; Gu, Z.-A.; Rajesh, S.; Yu, S.-B. Pullout Behavior of Triaxial Geogrid Embedded in a Transparent Soil. Int. J. Géoméch. 2021, 21, 04021003. [Google Scholar] [CrossRef]
- Ferreira, F.B.; Vieira, C.S.; Lopes, M.L. Direct shear behaviour of residual soil–geosynthetic interfaces–influence of soil moisture content, soil density and geosynthetic type. Geosynth. Int. 2015, 22, 257–272. [Google Scholar] [CrossRef]
- Santos, E.C.; Palmeira, E.M.; Bathurst, R.J. Behaviour of a geogrid reinforced wall built with recycled construction and demolition waste backfill on a collapsible foundation. Geotext. Geomembr. 2013, 39, 9–19. [Google Scholar] [CrossRef]
- Vieira, C.S.; Pereira, P.M.; Lopes, M.D.L. Recycled Construction and Demolition Wastes as filling material for geosynthetic reinforced structures. Interface properties. J. Clean. Prod. 2016, 124, 299–311. [Google Scholar] [CrossRef]
- Vieira, C.S.; Ferreira, F.B.; Pereira, P.M.; Lopes, M.D.L. Pullout behaviour of geosynthetics in a recycled construction and demolition material–Effects of cyclic loading. Transp. Geotech. 2020, 23, 100346. [Google Scholar] [CrossRef]
- Maghool, F.; Senanayake, M.; Arulrajah, A.; Horpibulsuk, S. Permanent deformation and rutting resistance of demolition waste triple blends in unbound pavement applications. Materials 2021, 14, 798. [Google Scholar] [CrossRef]
- Pourkhorshidi, S.; Sangiorgi, C.; Torreggiani, D.; Tassinari, P. Using Recycled Aggregates from Construction and Demolition Waste in Unbound Layers of Pavements. Sustainability 2021, 280, 122499. [Google Scholar] [CrossRef]
- Vieira, C.S.; Pereira, P.; Ferreira, F.; Lopes, M.D.L. Pullout Behaviour of Geogrids Embedded in a Recycled Construction and Demolition Material. Effects of Specimen Size and Displacement Rate. Sustainability 2020, 12, 3825. [Google Scholar] [CrossRef]
- Jiménez, J.R.; Ayuso, J.; Agrela, F.; López, M.; Galvín, A.P. Utilisation of unbound recycled aggregates from selected CDW in unpaved rural roads. Resour. Conserv. Recycl. 2012, 58, 88–97. [Google Scholar] [CrossRef]
- European Commission. EU Circular Economy Action Plan. 2020. Available online: https://ec.europa.eu/environment/circular-economy/ (accessed on 20 February 2021).
- European Commission. EU Construction & Demolition Waste Management Protocol. 2018. Available online: https://ec.europa.eu/growth/content/eu-construction-and-demolition-waste-protocol-0_en (accessed on 20 February 2021).
- Costa, C.M.L.; Zornberg, J.G. Novel experimental techniques to assess the time-dependent deformations of geosynthetics under soil confinement. J. Rock Mech. Geotech. Eng. 2021, 13, 410–419. [Google Scholar] [CrossRef]
- Sawicki, A.; Świdziński, W. Unconfined Versus Confined Testing of Geosynthetics. Geosynth. Int. 1999, 6, 157–169. [Google Scholar] [CrossRef]
- Becker, L.D.B.; Nunes, A.L.L.D.S. Influence of soil confinement on the creep behavior of geotextiles. Geotext. Geomembr. 2015, 43, 351–358. [Google Scholar] [CrossRef]
- Leshchinsky, D.; Dechasakulsom, M.; Kaliakin, V.N.; Ling, H.I. Creep and stress relaxation of geogrids. Geosynth. Int. 1997, 4, 463–479. [Google Scholar] [CrossRef]
- Bathurst, R.J.; Huang, B.Q.; Allen, T.M. Interpretation of laboratory creep testing for reliability-based analysis and load and resistance factor design (LRFD) calibration. Geosynth. Int. 1997, 4, 463–479. [Google Scholar] [CrossRef]
- Li, A.; Rowe, R. Influence of Creep and Stress-Relaxation of Geosynthetic Reinforcement on Embankment Behaviour. Geosynth. Int. 2001, 8, 233–270. [Google Scholar] [CrossRef]
- Kongkitkul, W.; Tatsuoka, F.; Hirakawa, D. Creep rupture curve for simultaneous creep deformation and degradation of geosynthetic reinforcement. Geosynth. Int. 2007, 14, 189–200. [Google Scholar] [CrossRef]
- Miyata, Y.; Bathurst, R.J.; Allen, T.M. Reliability analysis of geogrid creep data in Japan. Soils Found. 2014, 54, 608–620. [Google Scholar] [CrossRef]
- Kongkitkul, W.; Chantachot, T.; Tatsuoka, F. Simulation of geosynthetic load–strain–time behaviour by the non-linear three-component model. Geosynth. Int. 2014, 21, 244–255. [Google Scholar] [CrossRef]
- Pinho-Lopes, M.; Paula, A.M.; Lopes, M.L. Long-term response and design of two geosynthetics: Effect of field installation damage. Geosynth. Int. 2018, 25, 98–117. [Google Scholar] [CrossRef]
- Nuntapanich, N.; Kongkitkul, W.; Tatsuoka, F.; Jongpradist, P. Prediction of creep behaviour from load relaxation behaviour of polymer geogrids. Geosynth. Int. 2018, 25, 334–349. [Google Scholar] [CrossRef]
- Dias Filho, J.L.E.D.; Maia, P.; Xavier, G.D.C. A short-term model for extrapolating unconfined creep deformation data for woven geotextiles. Geotext. Geomembr. 2019, 47, 792–797. [Google Scholar] [CrossRef]
- Allen, T.; Bathurst, R. Observed Long-Term Performance of Geosynthetic Walls and Implications for Design. Geosynth. Int. 2002, 9, 567–606. [Google Scholar] [CrossRef]
- CEN. Tests for Geometrical Properties of Aggregates—Part 11: Classification Test for the Constituents of Coarse Recycled Aggregate; EN 933-11; CEN: Brussels, Belgium, 2009. [Google Scholar]
- CEN. Tests for Geometrical Properties of Aggregates—Part 1: Determination of Particle Size Distribution–Sieving Method; EN 933-1; CEN: Brussels, Belgium, 2012. [Google Scholar]
- CEN. Geotechnical Investigation and Testing–Laboratory Testing of Soil—Part 4: Determination of Particle Size Distribution; ISO/TS 17892-4; CEN: Brussels, Belgium, 2016. [Google Scholar]
- CEN. Unbound and Hydraulically Bound Mixtures—Part 2: Test Methods for Laboratory Reference Density and Water Content–Proctor Compaction; EN 13286-2; CEN: Brussels, Belgium, 2010. [Google Scholar]
- CEN. Characterisation of Waste–Leaching–Compliance Test for Leaching of Granular Waste Material and Sludges—Part 4; EN 12457-4; CEN: Brussels, Belgium, 2002. [Google Scholar]
- European Commission, Council Decision 2003/33/EC. Establishing Criteria and Procedures for the Acceptance of Waste at Landfills Pursuant to Article 16 of and Annex II to Directive; 1999/31/EC.; L11/27; Official Journal of the European Union: Luxembourg, 2003. [Google Scholar]
- Jang, Y.-C.; Townsend, T. Sulfate leaching from recovered construction and demolition debris fines. Adv. Environ. Res. 2001, 5, 203–217. [Google Scholar] [CrossRef]
- Vieira, C.S.; Lopes, M.L.; Caldeira, L. Sand-geotextile interface characterisation through monotonic and cyclic direct shear tests. Geosynth. Int. 2013, 20, 26–38. [Google Scholar] [CrossRef]
- CEN. Geosynthetics–Determination of Friction Characteristics—Part 1: Direct Shear Test; EN ISO 12957-1; CEN: Brussels, Belgium, 2018. [Google Scholar]
- Ferreira, F.B.; Vieira, C.S.; Lopes, M.L. Analysis of soil-geosynthetic interfaces shear strength through direct shear tests. In Proceedings of the International Symposium on Design and Practice of Geosynthetic-Reinforced Soil Structures, Bologna, Italy, 14–16 October 2013. [Google Scholar]
- Vieira, C.S.; Pereira, P.M. Use of Mixed Construction and Demolition Recycled Materials in Geosynthetic Reinforced Embankments. Indian Geotech. J. 2017, 48, 279–292. [Google Scholar] [CrossRef]
- Arulrajah, A.; Rahman, M.A.; Piratheepan, J.; Bo, M.W.; Imteaz, M.A. Evaluation of Interface Shear Strength Properties of Geogrid-Reinforced Construction and Demolition Materials Using a Modified Large-Scale Direct Shear Testing Apparatus. J. Mater. Civ. Eng. 2014, 26, 974–982. [Google Scholar] [CrossRef]
- Vieira, C.S.; Pereira, P.M. Interface shear properties of geosynthetics and construction and demolition waste from large-scale direct shear tests. Geosynth. Int. 2015, 23, 1–9. [Google Scholar] [CrossRef]


| Constituents | According to [35] * | Global Value |
|---|---|---|
| Concrete, concrete products, mortar, concrete masonry units, Rc (%) | 16.0 | 1.6 |
| Unbound aggregate, natural stone, hydraulically bound aggregate, Ru (%) | 45.7 | 4.6 |
| Clay masonry units, calcium silicate masonry units, aerated non-floating concrete, Rb (%) | 3.7 | 0.4 |
| Bituminous materials, Ra (%) | 2.2 | 0.2 |
| Glass, Rg (%) | 0.3 | 0.0 |
| Other materials, X ** (%) | 32.1 | 3.2 |
| Unsorted particles (%) | - | 90 |
| Floating particles, FL (cm3/kg) | 3.8 | - |
| Property | Value |
|---|---|
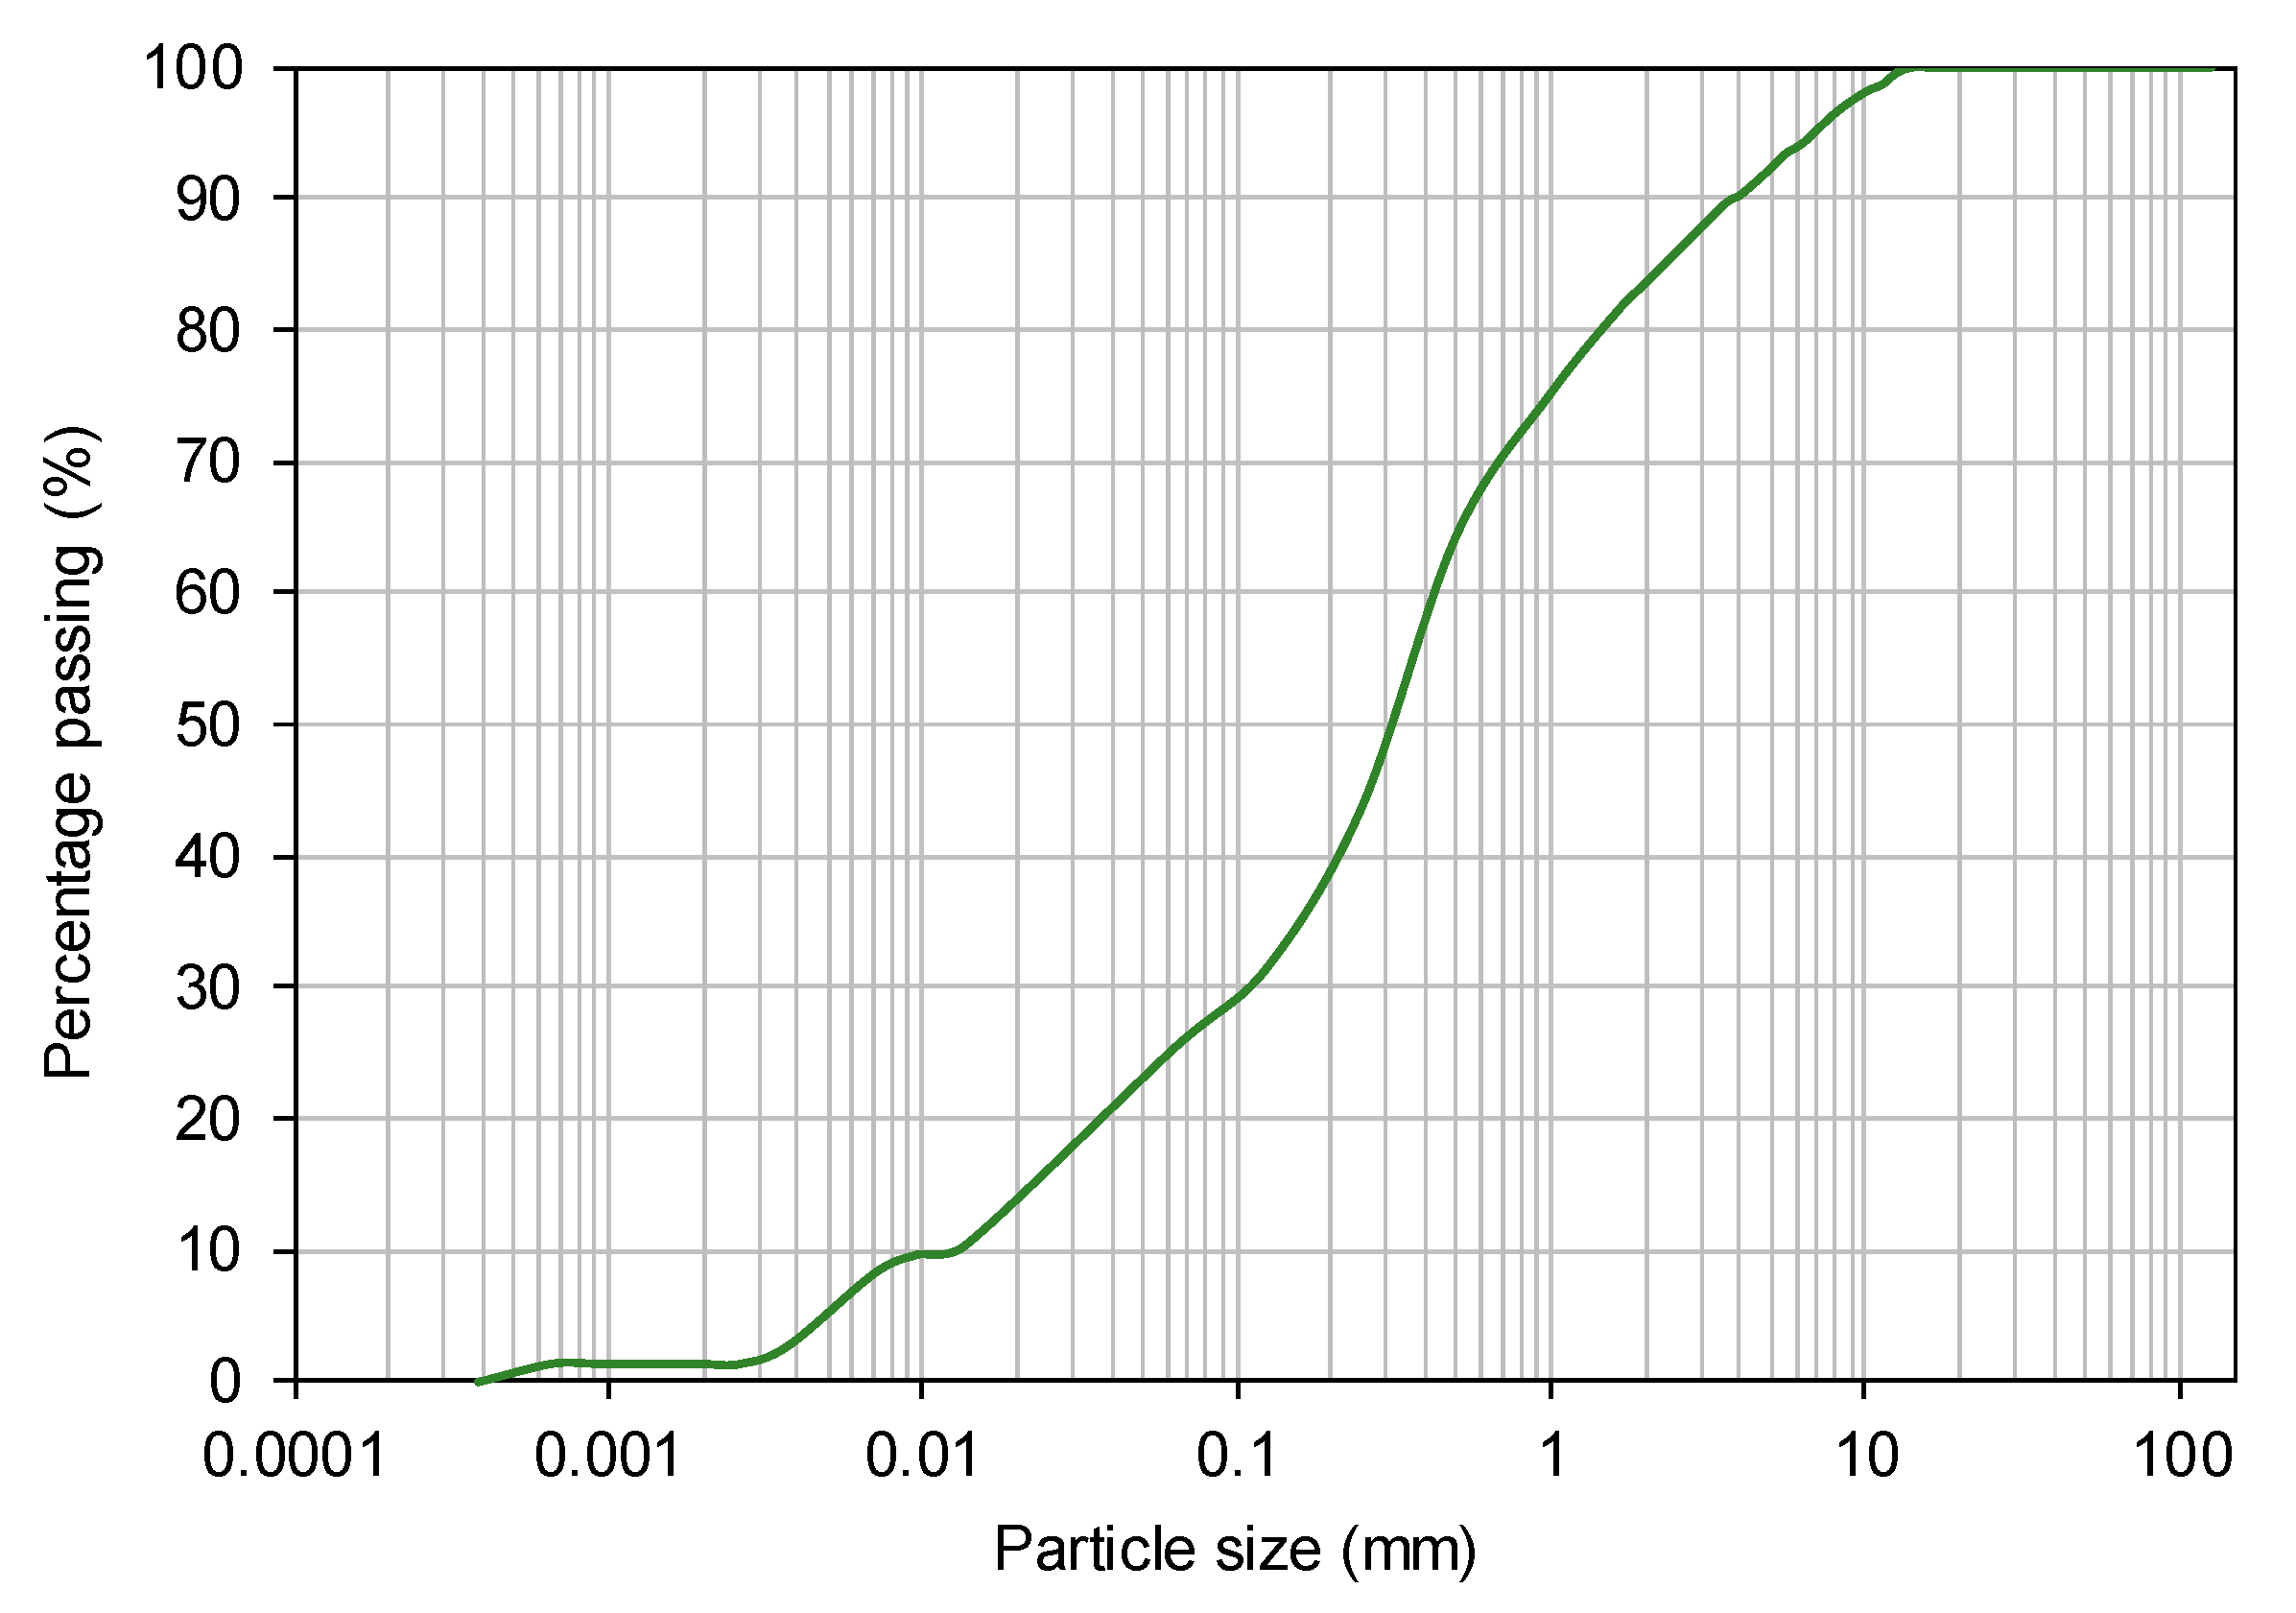
| D10 (mm) | 0.01 |
| D50 (mm) | 0.33 |
| D60 (mm) | 0.45 |
| Fines content (%) | 26.5 |
| CU | 39.3 |
| CC | 2.4 |
| γdmax (kN/m3) a | 19.0 |
| wopt (%) a | 11.3 |
| Parameter | Value (mg/kg) | Acceptance Criteria—Inert landfill (mg/kg) |
|---|---|---|
| Arsenic, As | 0.03 | 0.5 |
| Lead, Pb | <0.3 | 0.5 |
| Cadmium, Cd | <0.04 | 0.04 |
| Chromium, Cr | <0.5 | 0.5 |
| Copper, Cu | <0.25 | 2 |
| Nickel, Ni | <0.3 | 0.4 |
| Mercury, Hg | <0.01 | 0.01 |
| Zinc, Zn | 0.52 | 4 |
| Barium, Ba | 0.16 | 20 |
| Molybdenum, Mo | 0.03 | 0.5 |
| Antimony, Sb | <0.01 | 0.06 |
| Selenium, Se | 0.02 | 0.1 |
| Chloride, Cl | 56 | 800 |
| Fluoride, F | <2 | 10 |
| Sulphate, SO4 | 1200 | 1000 |
| Phenol index | <0.05 | 1 |
| Dissolved Organic Carbon, DOC | <200 | 500 |
| pH | 8.6 | - |
| Test Number | Test Method | Normal Stress, σn (kPa) | Displacement, dr/dmax | Time, tr (min) |
|---|---|---|---|---|
| T-1 | Conventional | 25 | N/A | N/A |
| T-2 | Conventional | 50 | N/A | N/A |
| T-3 | Conventional | 100 | N/A | N/A |
| T-4 | Conventional | 100 | N/A | N/A |
| T-5 | Conventional | 150 | N/A | N/A |
| T-6 | Multistage | 25 | 1/3 | 30 |
| T-7 | Multistage | 50 | 1/3 | 30 |
| T-8 | Multistage | 100 | 1/3 | 30 |
| T-9 | Multistage | 100 | 1/3 | 30 |
| T-10 | Multistage | 150 | 1/3 | 30 |
| T-11 | Multistage | 25 | 2/3 | 30 |
| T-12 | Multistage | 50 | 2/3 | 30 |
| T-13 | Multistage | 100 | 2/3 | 30 |
| T-14 | Multistage | 100 | 2/3 | 30 |
| T-15 | Multistage | 150 | 2/3 | 30 |
| T-16 | Multistage | 25 | 2/3 | 120 |
| T-17 | Multistage | 50 | 2/3 | 120 |
| T-18 | Multistage | 100 | 2/3 | 120 |
| T-19 | Multistage | 100 | 2/3 | 120 |
| T-20 | Multistage | 150 | 2/3 | 120 |
| Test Method | dr/dmax | tr (min) | Peak | Residual | ||
|---|---|---|---|---|---|---|
| δ (°) | ca (kPa) | δ (°) | ca (kPa) | |||
| Conventional | N/A | N/A | 32.4 | 10.3 | 31.4 | 6.9 |
| Multistage | 1/3 | 30 | 31.7 | 12.9 | 32.2 | 6.6 |
| Multistage | 2/3 | 30 | 32.8 | 6.9 | 32.1 | 4.6 |
| Multistage | 2/3 | 120 | 31.2 | 11.5 | 31.6 | 6.5 |
Publisher’s Note: MDPI stays neutral with regard to jurisdictional claims in published maps and institutional affiliations. |
© 2021 by the authors. Licensee MDPI, Basel, Switzerland. This article is an open access article distributed under the terms and conditions of the Creative Commons Attribution (CC BY) license (https://creativecommons.org/licenses/by/4.0/).
Share and Cite
Ferreira, F.B.; Pereira, P.M.; Vieira, C.S.; Lopes, M.d.L. Time-Dependent Response of a Recycled C&D Material-Geotextile Interface under Direct Shear Mode. Materials 2021, 14, 3070. https://doi.org/10.3390/ma14113070
Ferreira FB, Pereira PM, Vieira CS, Lopes MdL. Time-Dependent Response of a Recycled C&D Material-Geotextile Interface under Direct Shear Mode. Materials. 2021; 14(11):3070. https://doi.org/10.3390/ma14113070
Chicago/Turabian StyleFerreira, Fernanda Bessa, Paulo M. Pereira, Castorina Silva Vieira, and Maria de Lurdes Lopes. 2021. "Time-Dependent Response of a Recycled C&D Material-Geotextile Interface under Direct Shear Mode" Materials 14, no. 11: 3070. https://doi.org/10.3390/ma14113070
APA StyleFerreira, F. B., Pereira, P. M., Vieira, C. S., & Lopes, M. d. L. (2021). Time-Dependent Response of a Recycled C&D Material-Geotextile Interface under Direct Shear Mode. Materials, 14(11), 3070. https://doi.org/10.3390/ma14113070