Article

Solvent-Free Synthesized Monolithic Ultraporous Aluminas for Highly Efficient Removal of Remazol Brilliant Blue R: Equilibrium, Kinetic, and Thermodynamic Studies

1
Laboratoire des Sciences des Procédés et des Matériaux, CNRS, Université Sorbonne Paris Nord, F-93430 Villetaneuse, France
2
EBInnov, École de Biologie Industrielle, F-95000 Cergy, France
3
CAS Key Laboratory of Photovoltaic and Energy Conservation Materials, Institute of Plasma Physics, Chinese Academy of Sciences, P.O. Box 1126, Hefei 230031, China
*
Authors to whom correspondence should be addressed.
Materials 2021, 14(11), 3054; https://doi.org/10.3390/ma14113054
Submission received: 20 April 2021 / Revised: 25 May 2021 / Accepted: 31 May 2021 / Published: 3 June 2021

Abstract

:
In this study, ultraporous aluminas (UPA) were synthesized as new effective adsorbents for Remazol Brilliant Blue R (RBBR) removal from aqueous solutions. The UPA monoliths were grown via facile oxidation process, followed by isochronous annealing treatment in air at different temperatures, through which γ, θ, and α phase polycrystalline fibrous grains of UPA can be accordingly obtained. The experimental factors that affect the material adsorption performances including initial pH, contact time, and temperature were comprehensively studied by batch experiments. The RBBR adsorption isotherms of UPA(γ) and UPA(θ) powders were found almost identical, while UPA(α) powders showed low effectiveness. To obtain the desirable mechanical stability of the UPA monolith with considerable RBBR adsorption capacity, UPA(θ) powders were further studied. The UPA(θ) powders exhibited maximum RBBR adsorption at pH 2 due to the positively charged surface under acidic conditions. Compared with the Lagergren pseudo-first-order model, the pseudo-second-order model was found to explain the adsorption kinetics better. Despite the film diffusion dominating the adsorption process, the contributions of the intraparticle diffusion and chemical reactions were also found significant. The adsorption equilibrium data at different temperatures were fitted by the Langmuir, Freundlich, Temkin, and Dubinin–Radushkevich (D–R) isotherm models. The Langmuir model was found the most effective in the description of equilibrium data, and the maximum RBBR adsorption capacity retained by UPA(θ) powders was 122.55 mg·g−1 at 295 K. Thermodynamic parameters (ΔG0, ΔH0, and ΔS0) indicated the adsorption process was spontaneous and exothermic in nature.

1. Introduction

Throughout history, textile dyeing can be dated back to the Neolithic period (also known as the New Stone Age), followed by the serendipitous discovery of the first synthetic dye, mauveine (aniline purple) by William Perkin in 1856 [1]. Since then, the practice of employing synthetic dyes in the printing and dyeing process of fabrics has been extensively developed worldwide. At present, >7 × 10⁵ tons of dyes are produced annually, and nearly 10–15% of the total dyes are discharged in the surrounding environment with or without partial treatments, making the dyestuff-related industries responsible for up to 20% of industrial water pollution [2,3]. In addition to the textile industry, other kinds of dye-relevant industries (e.g., paper and pulp, plastic, leather, cosmetics, pharmaceutics, and photography) are also recognized as the most polluting industries. Accompanying the great conveniences brought by dye-based industrial applications, some serious problems are also caused owing to their carcinogenicity, genotoxicity, and/or mutagenicity in nature, which poses numerous threats to the ecological system and living organisms [3,4,5,6,7]. Therefore, proper treatments regarding purifications and remediations of industrial textile effluents are urgent and necessary.
The majority of dyes industrially used nowadays are organic compounds with complex and reinforced structures, which normally consist of two major components, i.e., chromophore and auxochrome groups [2,6,7]. The persistent structure and poor biodegradability of these refractory organics make the choice of an appropriate dye treatment method challenging [2]. Generally, the most known and extensively applied methods for the treatment of dyehouse effluents can be classified into physical (adsorption, membrane filtration, and reverse osmosis), chemical/electrochemical (adsorption, coagulation, flocculation, and advanced oxidation processes), biological (intracellular, and isolated enzymes) methods, and/or emerging combination of several above-mentioned techniques with the purpose of synergistic effects [4,5,6,7]. Among the available conventional methods for dye treatment, chemisorption involving chemical reactions between solutes and the functional groups on adsorbent surfaces in aqueous solutions has been confirmed and extensively studied as the most effective process for the treatment of industrial textile effluents [4,6,7].
Mesoporous materials of 2–50 nm pore diameter, owing to their numerous advantages including ordered, homogenous pore distributions, regular and tunable pore sizes, high specific surface areas, framework/wall substitutions with various metal oxides, favorable biocompatibility, and low toxicity, have been widely applied in the research field of wastewater treatment, catalyst support, drug delivery, and energy-related aspects, etc. [8,9,10]. Besides the size of pores inside the building framework, the compositions of material can vary, including pure organics (e.g., porous polymers), organic/inorganic (e.g., metal–organic frameworks, MOFs), and pure inorganics (e.g., silica, alumina, and titania). The great advantage of inorganic materials, in comparison with other materials, is that they can be synthesized relatively cheaply and usually by simple synthesis procedures [4,6,7,11,12,13]. For example, Khoshhesab et al. synthesized NiO nanoparticles by chemical precipitation method and studied its adsorption capacity for Remazol Brilliant Blue R (RBBR, also called RB19) with commercial NiO powders as a comparison [13]. Moussavi et al. synthesized porous MgO nanoparticle (nano-MgO) by sol–gel method and applied it for both azo and anthraquinone (AQ) dye removal from industrial wastewaters [7]. In particular, Madrakian et al. successfully synthesized magnetite-modified multiwalled carbon nanotubes (MMMCNTs) for the removal of four anionic dyes including RB19, Methylthymol blue, Congo red, and Mordant Blue 29 [4]. Recently, Beauvy et al. developed a new method for the synthesis of ultraporous alumina (UPA) monolith, which was followed by isochronous annealing treatment in air at different temperatures, anhydrous monolithic UPA with different crystallizations can be accordingly obtained [11,12,14,15]. The versatile applications of UPA materials with regard to photocatalytic, optical, electronic, and arsenic wastewater treatment performances have been extensively studied [16,17,18,19,20].
In the present study, RBBR was chosen as a representative AQ dye, which widely exists in industrial textile effluents. The UPA powders with different polycrystalline phases (i.e., γ, θ, and α) were synthesized for RBBR removal, and the experimental factors that affect the material adsorption performances were comprehensively studied by batch experiments. The adsorption kinetic models including the Lagergren pseudo-first-order, pseudo-second-order, film diffusion (Boyd plot), and intraparticle diffusion (Weber and Morris plot) models were applied to fit the kinetic data. Additionally, the adsorption equilibrium data at different temperatures were fitted by using the Langmuir, Freundlich, Temkin, and Dubinin–Radushkevich (D–R) isotherm models. The present study provides an improved understanding of the UPA potentials in wastewater treatment, which can explore its applications in the environmental field.

2. Materials and Methods

2.1. Chemicals and UPA Monolith Synthesis

Figure S1a,b showed the physicochemical characteristics of RBBR and its molecular compositions (wt%) including C (42.17%), H (2.57%), N (4.47%), Na (7.34%), O (28.09%), and S (15.35%) [21]. The chemicals including acetone, Hg(NO3)2, AgNO3, sodium acetate, CH3COOH, and NaOH were purchased from Sigma-Aldrich, Inc. (St. Louis, MO, USA). The raw laminated metallic aluminum plate (100 × 100 mm, 1.0 mm of thickness, 99.99% of purity) was supplied by Goodfellow Cambridge Ltd. (Huntingdon, UK). All the chemicals used in this study were of analytical grade and used as received directly without further purification. Milli-Q water (Figure S2, Millipore Corp., Burlington, MA, USA) with a specific resistivity of 18.2 MΩ·cm−1 at 25 °C was used to prepare solutions throughout the experiments.
The UPA monolith samples were synthesized via a facile oxidation process according to the previous studies (Figure S3) [11,12,16,17,22]. Briefly, high purity but fragile UPA monolith samples were obtained with a growth rate of ~1 cm·h−1 at room temperature in a humid atmosphere (70–80% RH) by the oxidation of metallic aluminum plates through a liquid layer of mercury–silver amalgam (Figure S4) [11]. Anhydrous monolithic UPA can be obtained from fragile UPA, converting to amorphous UPA, polycrystalline UPA(γ), UPA(θ), and UPA(α) monolith under 4 h of an isochronous annealing treatment in air at <870, 950, 1150, and 1350 °C, respectively (Figure S5) [11,12,17,18,22]. The mechanical stability of the UPA materials increased with the increasing calcination temperature at the expense of the specific surface area, which decreased from 300 m2·g−1 (raw fragile UPA) to 202 m2·g−1 of UPA(γ), 93 m2·g−1 of UPA(θ), and 6 m2·g−1 of UPA(α) (Figure S6). Figure S7a,b showed the adsorption isotherm profiles regarding RBBR adsorption capacity with units as mg·g−1 and mg·m−2 retained by UPA(γ), UPA(θ), and UPA(α) powders, respectively. These results showed that the RBBR adsorption capacity was proportional to the UPA specific surface area and attained approximately 1.1 mg·m−2 regardless of its polycrystalline phase. Therefore, to obtain the desirable mechanical stability of UPA monolith with considerable RBBR adsorption capacity, in the following studies, UPA(θ) monolith was employed to achieve more homogeneous adsorbent dispersion after a rigorous grinding process.

2.2. Characterization

The obtained samples were characterized by using scanning electron microscopy (SEM, Zeiss Supra 40 VP, Carl Zeiss, Jena, Germany) and transmission electron microscopy (TEM, JEOL 2011, JEOL Ltd., Tokyo, Japan) techniques. The material compositions before and after RBBR adsorption were analyzed by elemental mapping with energy-dispersive X-ray (EDX) spectroscopy (SEM S440, LEICA, Germany). The Fourier transform infrared (FTIR) spectra of the obtained samples were recorded by using a PerkinElmer Spectrum 100 system spectrometer (PerkinElmer, Waltham, MA, USA) in pressed KBr pellets (Sigma-Aldrich, St. Louis, MO, USA, 99%, analytical reagent) and in the 400–4000 cm−1 region. The powder X-ray diffraction (XRD) pattern of the obtained samples was carried out by using an Inel Equinox 1000 X-ray diffractometer (Inel, Celje, Slovenia) with Co Kα radiation source (λ = 1.7902 Å), and the analysis was performed at 2θ diffraction angles from 25° to 85° at a speed of 2°/min. The Brunauer–Emmett–Teller (BET) specific surface area and pore size distribution of the obtained samples were studied by nitrogen adsorption–desorption measurement (Belsorp-max, MicrotracBEL, Japan; data analysis: MicroActive for ASAP 2460) with outgassing at 200 °C for 12 h. The mass of UPA(γ), UPA(θ), and UPA(α) powders and the corresponding range of points (P/P0) used for the BET measurements were 0.0602 (0.0052–0.9888), 0.0586 (0.0100–0.9898), and 0.4335 g (0.0063–0.9948 pressure), respectively. The zeta potential values of the obtained samples as a function of pH were measured by a Nano ZS90 Zetasizer (Malvern Instruments Ltd., Malvern, UK). The desired pH values of suspensions between 2 and 12 were adjusted by adding negligible volumes of 0.1–0.01 mol·L−1 HCl (2.0–3.5), CH3COOH (3.5–7.0), or NaOH solution.

2.3. Batch Adsorption Studies

The complete experimental details can be found in the Supplementary Materials. The RBBR concentration in the supernatant (Ct, mg·L−1) was determined by spectrophotometry method at the wavelength of 590 nm (Figure S1c,d, UviLine 9400 UV–Visible spectrophotometer, Secomam, France). The adsorption percentage (%), the adsorption capacity at equilibrium (qe, mg·g−1), and the distribution coefficient (Kd) were obtained from the following equations, respectively:
Adsorption   ( % ) = C 0 C e C 0 × 100
q e = C 0 C e m × V
K d = C 0 C e C e × V m = q e C e
where C0 (mg·L−1) is the initial adsorbate concentration in suspension, Ce (mg·L−1) is the adsorbate concentration in the supernatant at equilibrium, V (L) is the volume of suspension, and m (g) is the mass of adsorbent. All of the experimental data are the averages of triplicate determinations.

2.4. Data Analysis

2.4.1. Adsorption Kinetic Study

The kinetic data were fitted by the Lagergren pseudo-first-order and pseudo-second-order models by using the following linearized equations, respectively [23,24]:
Lagergren pseudo-first-order model:
ln ( Q m Q t ) = ln Q m k t
pseudo-second-order model:
t Q t = 1 k Q m 2 + t Q m
where Qt and Qm (mg·g−1) refer to the adsorption capacity at time t (h) and at equilibrium obtained from the kinetic models. k′ (h−1) and k″ (g·mg−1·h−1) are the adsorption rate constants obtained from the kinetic models.

2.4.2. Rate-Limiting Step Determination Study

In order to identify the bottleneck (slowest) step of the adsorption process, both the first-curved and second-linear adsorption parts of the kinetic data were fitted by the film diffusion (Boyd plot) and intraparticle diffusion models (Weber and Morris plot) by using the following linearized equations, respectively [25,26,27]:
Film diffusion model [25,26]:
ln ( 1 Q t Q m ) = k FD t
Intraparticle diffusion model [27]:
Q t = k IPD t 0.5 + C IPD
where Qt/Qm is the fractional attainment of equilibrium. kFD (min−1) and kIPD (mg·g−1·min−0.5) are the rate constants obtained from the diffusion models. CIPD is proportional to the boundary layer, which provides information about boundary layer thickness, i.e., the larger value of CIPD, the greater of boundary layer effect on the adsorption process [27,28].

2.4.3. Adsorption Equilibrium Study

To obtain a better understanding of the adsorption mechanisms, the adsorption equilibrium data were fitted by Langmuir, Freundlich, Temkin, and D–R isotherm models [29].
The linearized equation of the Langmuir isotherm model is listed as follows [30,31,32]:
Langmuir isotherm model:
C e q e = 1 K L q e , max + C e q e , max
where qe,max (mg·g−1) is the maximum adsorption capacity obtained from the isotherm models, and KL (L·mg−1) is the constant of the Langmuir isotherm model related to the adsorption energy. The essential characteristics of the Langmuir model can be expressed in terms of a dimensionless constant, commonly known as separation factor or equilibrium parameter (RL), which is defined by the following equation [33,34]:
R L = 1 1 + K L C 0
According to Hall et al. [33], the magnitude of RL indicates the adsorption process in nature to be either unfavorable (RL > 1), linear (RL = 1), favorable (0 < RL < 1) or irreversible (RL = 0).
The linearized equation of the Freundlich isotherm model is listed as follows [35]:
Freundlich isotherm model:
log   q e = log   K F + 1 n log   C e
where KF (mg(1−1/n)·L1/n·g−1) and 1/n are the Freundlich constants indicating the adsorption capacity and adsorption intensity, respectively. The magnitude of 1/n ranges between 0 and 1, indicating the surface heterogeneity, which becomes more heterogeneous as its value approaches zero [5,29,36]. Meanwhile, 1/n > 1 indicates a cooperative adsorption [29].
The linearized equation of the Temkin isotherm model is listed as follows [37]:
Temkin isotherm model:
q e = B ln K T + B ln C e
where B = RT/bT (J·mol−1) and KT (L·g−1) are the constant and equilibrium binding constant of the Temkin isotherm model, respectively.
The linearized equation of the D–R isotherm model is listed as follows [38]:
D–R isotherm model:
ln q e = ln q e , max β ε 2
ε = R T   ln ( 1 + 1 C e )
where β (mol2·kJ−2) is the constant of the D–R isotherm model, ε is the constant of the D–R isotherm model related to the Polanyi potential, R (8.3145 J·mol−1·K−1) is the universal gas constant, and T (K) is the absolute temperature in Kelvin. E (kJ·mol−1) is defined as the free energy change required to transfer 1 mol of adsorbate from infinity in solution to the solid surface [28]. This relationship can be described as follows [39]:
E = 1 2 β
The magnitude of E is useful to estimate the mechanism of the adsorption reaction. If the value of E is in the range of 8–16 kJ·mol−1, the adsorption process is governed by an ion-exchange mechanism, while in the case of E < 8 kJ·mol−1, the adsorption process may be affected by physical forces. On the other hand, the adsorption process may be dominated by particle diffusion if the value of E is greater than 16 kJ·mol−1 [40,41].

2.4.4. Adsorption Thermodynamic Study

The thermodynamic parameters including standard Gibbs free energy (ΔG0, kJ·mol−1), standard enthalpy change (ΔH0, kJ·mol−1), and standard entropy change (ΔS0, J·mol−1·K−1) were obtained from the following equations, respectively:
Δ G 0 = R T ln K 0
ln K 0 = Δ S 0 R Δ H 0 R T
where lnK0 (K0, the standard distribution coefficient) can be obtained by plotting lnKd versus Ce and extrapolating Ce to zero. The slope and intercept of the plot of lnK0 versus 1000/T correspond to –ΔH0/1000R and ΔS0/R, respectively.

3. Results and Discussions

3.1. Characterization

Figure 1a,b showed the SEM and TEM images of UPA(θ) powders, which evidenced the ultraporous morphology of obtained samples. The EDX spectra of UPA(θ) powders showed that there were no residual mercury or silver element retained on the surface of obtained samples (Figure S8). As shown in Figure S9, the UPA(θ) border became smoother after RBBR adsorption, and the corresponding TEM elemental mappings in Figure 1c,d clearly confirmed the uniform distribution of RBBR retained on UPA(θ) surfaces.
In Figure 2a, the absorption band in the range of 3400–3500 cm−1 was assigned to the –OH stretching vibration of UPA(θ) powders, and the broader absorption band in this range indicated the presence of carboxyl and amino groups distributed on the UPA(θ) surface after RBBR adsorption (Figure S1a). Based on the calculation from Bragg equation (2 dsinθ = nλ, n = 1, 2, 3, etc.) (Figure 2b), the typical XRD patterns at 2θ = 36.64° (d = 0.28 nm), 38.46° (d = 0.27 nm), and 80.32° (d = 0.14 nm) correspond to the (111), (−204), and (403) planes of theta alumina, respectively, (JCPDS 35–0121, 11–0517, and 23–1009) [42]. The nitrogen adsorption–desorption isotherm curve of UPA(θ) powders followed the typical characteristics of type IV isotherm and H3 hysteresis (IUPAC), indicating the mesoporous property of UPA(θ) powders (Figure 2c) [43,44]. Moreover, the specific surface area of UPA(θ) powders was 93 m2·g−1 with an average pore diameter of 35 nm (Gaussian curve from 0–150 nm), and most data of pore size distribution located in the mesoporous range (Figure 2c). The ultraporous nature of UPA(θ) powders is expected to favor the diffusion-controlled surface reactions, which will be discussed in the following studies.

3.2. Initial pH Effect and Adsorption Kinetics

As shown in Figure 3a, the RBBR adsorption retained by UPA(θ) powders strongly decreased with increasing pH (up to pH = 6) and then slowly decreased in the following pH range. According to Figure 2d, the pHzpc value of UPA(θ) powders approximately equaled to 9.0, and the increasing solution pH values after RBBR adsorption equilibrium indicated the significant consumption of hydrogen ions under acidic conditions (Figure S10). At low pH values, the electrostatic attraction between the protonated (positively charged) functional groups on UPA(θ) surfaces and RBBR species resulted in the high adsorption percentage of RBBR [7,45,46]. As the pH value increased, these gradually deprotonated (negatively charged) functional groups became less favorable for the adsorption process, and consequently, the affinity of UPA(θ) powders toward the negatively charged RBBR species (e.g., −SO3, sulfonate groups) decreased (Figure 2d). Moreover, at high pH values, the formation of excessed OH ions under alkaline conditions and subsequent competition with the RBBR species for the finite reaction sites on UPA(θ) surfaces may also lead to the low RBBR adsorption percentage [7]. According to the previous studies, similar results have also been reported by applying other kinds of adsorbents for RBBR removal [6,45,46,47,48]. For example, Gök et al. found that the adsorption of RBBR onto 1,6-diamino hexane modified bentonite (DAH–bentonite) was strongly pH dependent, with the optimum pH = 1.5 [6]. Therefore, the low adsorption percentage of RBBR under alkaline conditions can be attributed to the electrostatic repulsion between the negatively charged UPA(θ) surfaces and the anionic RBBR species, which became the essential factor in controlling the adsorption process.
The kinetic data regarding the adsorption percentage (%) and adsorption capacity (Qt, mg·g−1) of RBBR retained by UPA(θ) powders were shown in Figure 3b,c, respectively. The RBBR adsorption increased rapidly in the first 4 h and then maintained a high level until the adsorption process achieved equilibrium. Figure 3b,c also showed that in the initial step, the adsorption process achieved equilibrium much more rapidly at high adsorbent dosage. In Figure 3c, the decrease of Qt value of RBBR adsorption may result from the increasing UPA(θ) dosage on which more vacant reaction sites became available. In general, the RBBR adsorption process was rapid, and 4 h was enough to achieve the entire adsorption equilibrium. Based on the profiles of kinetic data (Figure 3b), the effect of UPA(θ) dosage on RBBR adsorption kinetics was shown in Figure 3d (XZ side, i.e., “UPA(θ) dosage (g·L−1)–Adsorption (%)” side). As discussed above, the increasing UPA(θ) dosage may result in more vacant reaction sites available on the adsorbent surfaces for RBBR adsorption. This positive relationship explained the Г line type of kinetic data on the XZ side of Figure 3d at 24 h of equilibrium time (black line highlighted). The RBBR adsorption increased with increasing UPA(θ) dosage and exceeded 96% when UPA(θ) dosage attained more than 10 g·L−1. As long as sufficient reaction sites were provided, the RBBR adsorption was independent of UPA(θ) dosage. All the above discussions indicated that the UPA(θ) dosage played an important role in the adsorption process; however, the economic issues usually should be taken into consideration in the actual adsorbent applications. Therefore, in order to obtain suitable dye treatment, one should determine the appropriate UPA(θ) dosage according to the initial concentration of dye effluents [6,7,49,50].

3.3. Adsorption Kinetic and Rate-Limiting Step Determination Studies

The fitting results of the Lagergren pseudo-first-order and pseudo-second-order models were shown in Figure 4a,b, respectively, and the fitting parameters were listed in Table 1.
As shown in Table 1, the low determination coefficients (R2) obtained from the Lagergren pseudo-first-order model (Equation (4)) showed that between the kinetic data and this model, there was no significant correlation. On the other hand, the pseudo-second-order model (Equation (5)) fitted the kinetic data better, and the calculated adsorption capacities at equilibrium (Qmc) were closer to the experimental ones (Qme). Therefore, the adsorption process followed the pseudo-second-order model based on the assumption that the rate-limiting step may be chemical adsorption or chemisorption involving valence forces through sharing or exchanging electrons between the adsorbent and adsorbate, which provides the best correlation of the kinetic data [24,51].
Generally, the adsorption kinetics of solutes retained by porous materials is controlled by different steps [50,51]: (i) solutes transfer from the aqueous phase to the more external adsorbent surface, crossing the boundary film bordering the solid adsorbent particles (film diffusion step), (ii) internal diffusion of solutes transferring from the adsorbent surface to the intraparticle active sites (particle diffusion step), and (iii) sequestration on the active sites via adsorption, complexation, or intraparticle precipitation phenomena. One or more of the above-mentioned steps may affect the mechanisms governing the adsorption process. The fitting results of the film diffusion and intraparticle diffusion models were shown in Figure 4c,d, respectively, and the fitting parameters were listed in Table 2.
The nonlinear distribution of points with two distinct regions observed in Figure 4d indicated that intraparticle/pore diffusion may participate in the adsorption process but was not the single rate-limiting step [51]. Furthermore, the deviation of intercepts of Weber and Morris plot (CIPD, Figure 4d) may be due to the difference in the rate of mass transfer in the initial and final stages of the adsorption process [28,52]. For the RBBR adsorption retained by UPA(θ) powders, the initial curved region of the plot was attributed to the film diffusion, and the subsequent linear region was attributed to the intraparticle diffusion and chemical reactions [48,51].

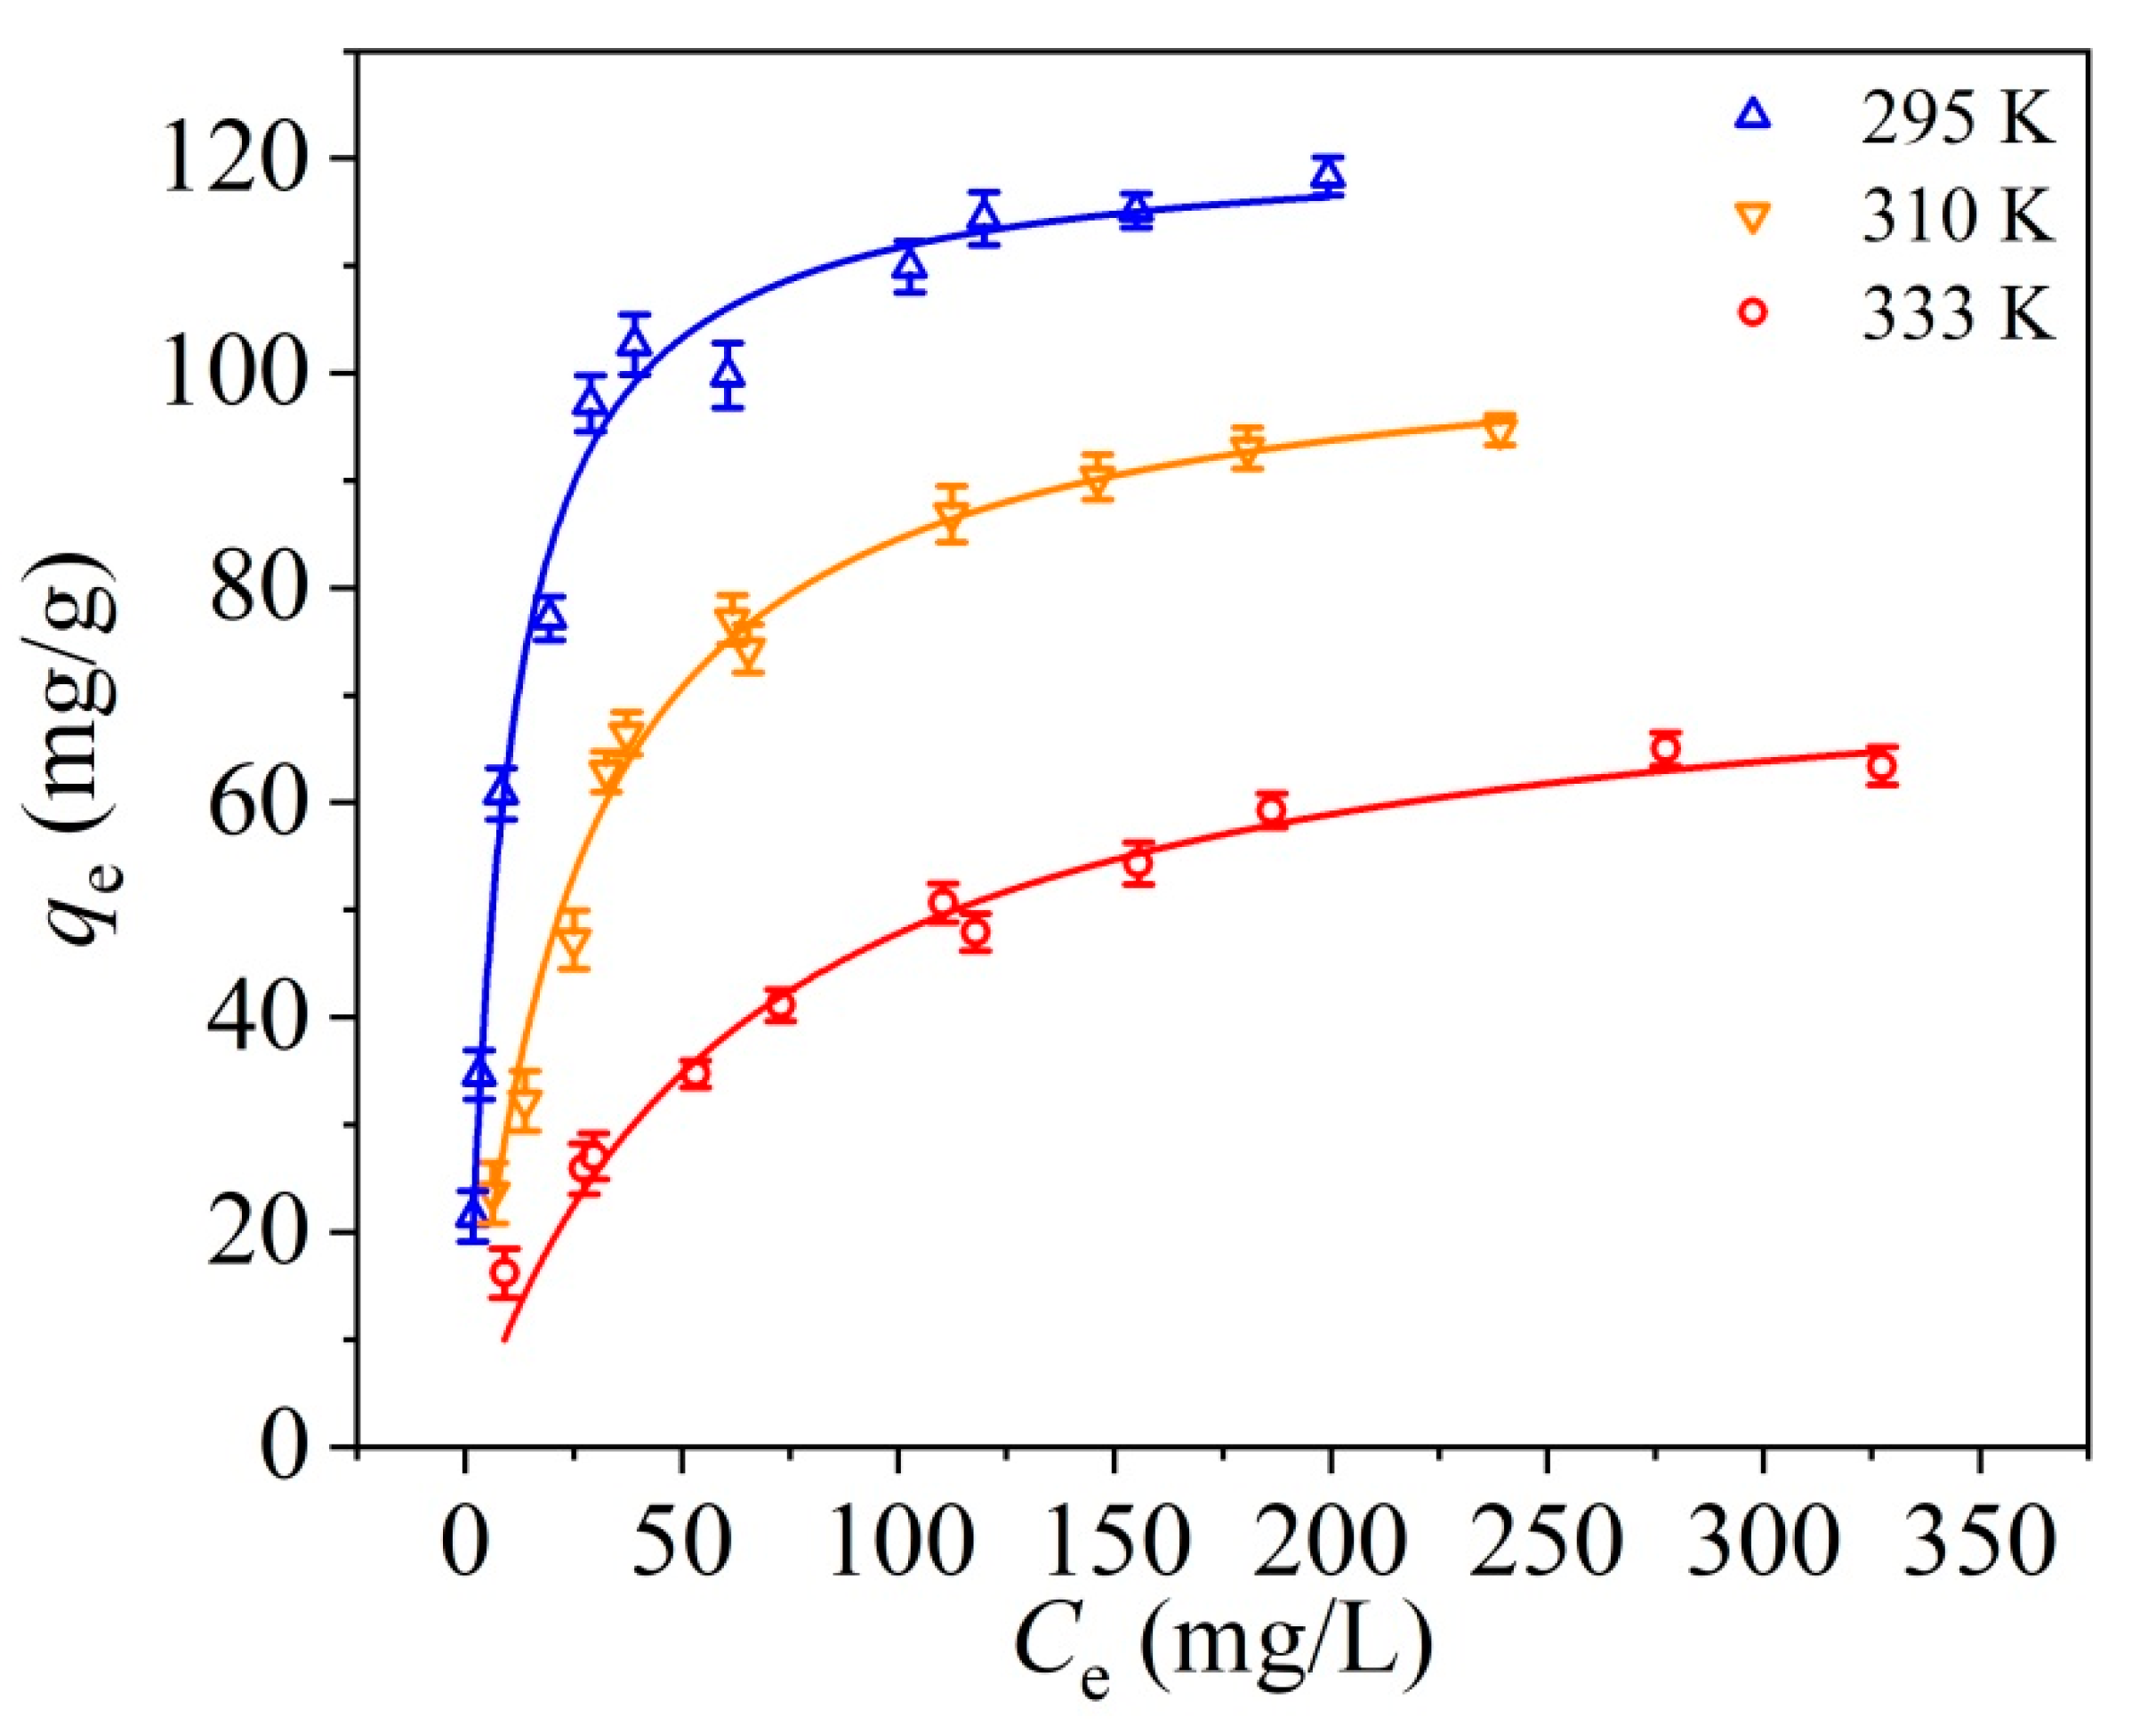
3.4. Adsorption Equilibrium Study

As shown in Figure 5, the RBBR adsorption capacity of UPA(θ) powders decreased with increasing temperature, which indicated that the adsorption reaction may be exothermic, and low temperature favored the adsorption process.
Based on the assumption that the monolayer adsorption can only occur at a finite number of definite localized sites with no lateral interaction and steric hindrance between the adsorbed molecules, even on adjacent sites, the Langmuir model is widely used for the fitting of the homogeneous adsorption [30,31,32]. This empirical model is graphically characterized by a plateau and an equilibrium saturation point where once a molecule occupies a site, no further adsorption can take place [29]. Unlike the Langmuir model, the Freundlich model is an empirical model widely applied in heterogeneous systems (e.g., organic compounds, highly interactive species on activated carbon and molecular sieves), which describes the nonideal and reversible adsorption with no restrictions to the formation of monolayer [35]. The Temkin model, which contains a factor that explicitly takes account of the adsorbent–adsorbate interactions, was firstly introduced describing the adsorption of hydrogen onto platinum electrodes in acidic solutions [37]. By ignoring the extremely low and large value of concentrations, this model assumes that the heat of adsorption (function of temperature) of all the molecules in the layer would decrease linearly rather than logarithmically with coverage [29,53]. Compared with its less applicability to the more complex adsorption systems, especially the liquid phase adsorption isotherms, the Temkin model can be well applied for predicting the gas phase equilibrium. The D–R model is an empirical model generally applied to express the adsorption mechanism with a Gaussian energy distribution onto a heterogeneous surface [38]. This model has often successfully fitted high solute activities and the intermediate range of concentrations data well.
The fitting results of the Langmuir, Freundlich, Temkin, and D–R isotherm models were shown in Figure 6, and the fitting parameters were listed in Table 3.
Compared the obtained R2 values from different isotherm models with each other, the Langmuir model fitted the adsorption equilibrium data better than the other three models (i.e., Langmuir > Temkin ≈ Freundlich > D–R model), indicating the presence of RBBR monolayer coverage on UPA(θ) surfaces [30,31,32]. Based on the Langmuir model, the qe,max values of RBBR adsorption retained by UPA(θ) powders were 122.55, 105.49, and 74.18 mg·g−1 for 295, 310, and 333 K, respectively. These results were in good accordance with the equilibrium qe values obtained from the adsorption equilibrium study (Figure 5), which was consistent with the low-temperature favorable conclusion, as discussed above. The RL values listed in Table 3 fell in the range of 0–1, indicating that the RBBR adsorption retained by UPA(θ) powders was favorable, and RBBR tended to remain the bonding on UPA(θ) surfaces [33]. The obtained R2 values from the Temkin model were slightly greater than those of the Freundlich model, and the equilibrium binding constants (KT) at high temperatures were less than that at room temperature. In the Freundlich model, all the values of 1/n at different temperatures were less than 1, indicating the surface heterogeneity of UPA(θ) powders during the adsorption process [5,29,36]. Among the isotherm models applied in this study, the obtained R2 values from the D–R model were the lowest among the considered isotherm models, and the qe,max values were much less than the equilibrium qe values obtained from the adsorption isotherms (Figure 5). Consequently, the model analysis indicated the low applicability of the D–R model on the adsorption process. Therefore, the Langmuir isotherm model was found to describe the adsorption equilibrium data best, and the maximum RBBR adsorption capacity retained by UPA(θ) powders was 122.55 mg·g−1 at 295 K.

3.5. Adsorption Thermodynamic Study

The thermodynamic parameters can define whether the RBBR adsorption retained by UPA(θ) powders was endothermic or exothermic, spontaneous or not [54,55]. The linear plots of lnKd versus Ce and lnK0 versus 1000/T were shown in Figure 7a,b, respectively. The obtained thermodynamic parameters were listed in Table 4.
In general, the positive ΔG0 values at all temperatures indicate that the adsorption process requires energy from an external source to convert reactants into products, which is considered thermodynamically unfavorable. In this study, the obtained negative ΔG0 values indicated that the RBBR adsorption process was thermodynamically favorable and spontaneous. The increase of ΔG0 value with increasing temperature indicated that low temperature favored the adsorption process. The negative ΔH0 value confirmed the exothermicity of the adsorption process. Moreover, the magnitude order of ΔH0 value can indicate the type of adsorption process to be either physical (2.1–20.9 kJ·mol−1) or chemisorption (80–200 kJ·mol−1) [56]. Consequently, the RBBR adsorption retained by UPA(θ) powders can be attributed to a combined physic–chemical adsorption in nature. The magnitude of ΔS0 value can be used to describe the randomness at the solid–liquid interface during the adsorption process. According to the previous studies [54,55,56], the negative value of ΔS0 reflected that the adsorption process involves an associative mechanism, and no significant change occurred in the internal structures of the adsorbent during the adsorption process, while the positive ΔS0 value reflected the affinity of the adsorbent to adsorbate species involving the dissociative mechanism. For the RBBR adsorption retained by UPA(θ) powders, the negative value of ΔS0 indicated that the adsorption process was enthalpy driven, accompanying a decreased disorder that occurred at the solid–liquid interface.

3.6. Adsorption Mechanism

Figure 8 showed the possible mechanisms for the adsorption of RBBR retained by UPA(θ) powders. Film diffusion, intraparticle diffusion, electrostatic attraction, surface complexation, and hydrogen bonding could be considered as the major interactions in the adsorption mechanisms for the removal of RBBR retained by UPA(θ) powders. The ultraporous nature of the UPA(θ) powders induced the adsorption of RBBR molecules by film and intraparticle diffusion mechanisms. The hydroxyl functional groups distributed on the UPA(θ) surface tended to form complexes with RBBR molecules by several mechanisms including electrostatic interaction and surface complexation, especially under acidic conditions. Moreover, hydrogen bonding between the hydroxyl functional groups (hydrogen bond donors) and nitrogen and/or oxygen centers in RBBR molecules (hydrogen bond acceptors) may also have some influences on the adsorption process.
Compared with the other organic, inorganic, or bio-based adsorbents reported in related studies in the literature (Table 5), UPA(θ) and UPA(γ) powders possess several advantages for large-scale applications including nontoxicity, facile synthesis, and higher RBBR adsorption capacity, compared with referenced adsorbents [4,5,6,7,13,45,46,47,49,50,57,58,59,60,61]. Therefore, UPA materials have high potentials as alternative adsorbents for the practical treatment of dye effluents.

4. Conclusions

In this study, UPA materials were synthesized as new effective and low-cost adsorbents for RBBR removal from aqueous solutions. The synthesized materials were characterized using FTIR, XRD, SEM, TEM, and BET. The adsorption process was pH- and temperature dependent, and the maximum RBBR adsorption capacity retained by UPA(θ) powders was 122.55 mg·g−1 at 295 K. Both the film diffusion and intraparticle diffusion contributed to the adsorption kinetics, and chemical reactions also played a significant role during the entire adsorption process. According to the obtained fitting results, the pseudo-second-order model and the Langmuir isotherm model were found to best describe the experimental data (i.e., pseudo-second-order > Lagergren pseudo-first-order model; and Langmuir > Temkin ≈ Freundlich > D–R isotherm model). Moreover, the thermodynamic parameters indicated that the adsorption process was spontaneous and exothermic in nature. The findings of this study highlight the UPA potentials in wastewater treatment, which can broaden our understanding and its applications in the environmental field.

Supplementary Materials

The following are available online at https://www.mdpi.com/article/10.3390/ma14113054/s1, Table S1: Nomenclature, Greek symbols, and subscripts, Figure S1: Physicochemical characteristics, molecular compositions, 3-D model and calibration curve of RBBR, Figure S2: Photo of the Milli-Q water system, Figure S3: Photos of raw aluminum grid, UPA monolith sample after different time of continuous growth process, Figure S4: Photo of the experimental instrument for the synthesis of UPA monolith, Figure S5: Photos of raw fragile UPA, under 4 h of isochronous annealing treatment in air at different temperatures, Figure S6: Nitrogen adsorption–desorption isotherms and pore size distributions of UPA(γ), UPA(θ), and UPA(α) powders, Figure S7: Adsorption isotherm profiles regarding RBBR adsorption capacity with units as mg·g−1 and mg·m−2, Figure S8: EDX spectra of UPA(θ) powders before and after RBBR adsorption, Figure S9: SEM images of UPA(θ) powders before and after RBBR adsorption, Figure S10: The pH variation after RBBR adsorption equilibrium, Figure S11: Zeta potential values of UPA(γ), UPA(θ), and UPA(α) powders as a function of pH, Figure S12: Infrared spectrum of RBBR.

Author Contributions

Conceptualization, H.X.; methodology, H.X. and G.B.; characterization, K.Z.; software, H.X. and K.Z.; formal analysis and investigation, H.X.; resources, M.N. and A.E.; data curation, A.K.; writing—original draft preparation, H.X., Z.J., R.A. and A.K.; writing—review and editing, Z.J., M.T. and A.K.; visualization, H.X.; supervision, Z.J., M.T., R.A. and A.E.; project administration, R.A., M.N. and A.E.; funding acquisition, M.N. and A.E. All authors have read and agreed to the published version of the manuscript.

Funding

This research received no external funding.

Institutional Review Board Statement

Not applicable.

Informed Consent Statement

Not applicable.

Data Availability Statement

The data presented in this study are available from the corresponding authors with reasonable requests.

Acknowledgments

H.X. thanks the China Scholarship Council (CSC) for his PhD fellowship, followed by one year of funding source provided by EBI, which is also gratefully acknowledged. The authors thank Amal Allouch for simulation support of the 3-D model of RBBR molecule, as well as Jianwen Weng for MATLAB-based matrix conversion and gridding.

Conflicts of Interest

The authors declare no conflict of interest.

References

  1. Lavis, L.D. Teaching old dyes new tricks: Biological probes built from fluoresceins and rhodamines. Annu. Rev. Biochem. 2017, 86, 825–843. [Google Scholar] [CrossRef] [PubMed]
  2. Routoula, E.; Patwardhan, S.V. Degradation of anthraquinone dyes from effluents: A review focusing on enzymatic dye degradation with industrial potential. Environ. Sci. Technol. 2020, 54, 647–664. [Google Scholar] [CrossRef] [PubMed]
  3. Bilal, M.; Asgher, M.; Parra-Saldivar, R.; Hu, H.-B.; Wang, W.; Zhang, X.-H.; Iqbal, H.M.N. Immobilized ligninolytic enzymes: An innovative and environmental responsive technology to tackle dye-based industrial pollutants—A review. Sci. Total Environ. 2017, 576, 646–659. [Google Scholar] [CrossRef]
  4. Madrakian, T.; Afkhami, A.; Jalal, N.R.; Ahmadi, M. Kinetic and thermodynamic studies of the adsorption of several anionic dyes from water samples on magnetite-modified multi-walled carbon nanotubes. Sep. Purif. Technol. 2013, 48, 2638–2648. [Google Scholar] [CrossRef]
  5. Cicek, F.; Özer, D.; Özer, A.; Özer, A. Low cost removal of reactive dyes using wheat bran. J. Hazard. Mater. 2007, 146, 408–416. [Google Scholar] [CrossRef]
  6. Gök, Ö.; Özcan, A.S.; Özcan, A. Adsorption behavior of a textile dye of Reactive Blue 19 from aqueous solutions onto modified bentonite. Appl. Surf. Sci. 2010, 256, 5439–5443. [Google Scholar] [CrossRef]
  7. Moussavi, G.; Mahmoudi, M. Removal of azo and anthraquinone reactive dyes from industrial wastewaters using MgO nanoparticles. J. Hazard. Mater. 2009, 168, 806–812. [Google Scholar] [CrossRef]
  8. Li, J.; Wang, X.-X.; Zhao, G.-X.; Chen, C.-L.; Chai, Z.-F.; Alsaedi, A.; Hayat, T.; Wang, X.-K. Metal-organic framework-based materials: Superior adsorbents for the capture of toxic and radioactive metal ions. Chem. Soc. Rev. 2018, 47, 2322–2356. [Google Scholar] [CrossRef] [PubMed]
  9. Zdarta, J.; Meyer, A.S.; Jesionowski, T.; Pinelo, M. Developments in support materials for immobilization of oxidoreductases: A comprehensive review. Adv. Colloid Interf. Sci. 2018, 258, 1–20. [Google Scholar] [CrossRef] [PubMed]
  10. Qiu, P.-P.; Ma, B.; Hung, C.-T.; Li, W.; Zhao, D.-Y. Spherical mesoporous materials from single to multilevel architectures. Acc. Chem. Res. 2019, 52, 2928–2938. [Google Scholar] [CrossRef] [PubMed]
  11. Vignes, J.-L.; Frappart, C.; Di Costanzo, T.; Rouchaud, J.-C.; Mazerolles, L.; Michel, D. Ultraporous monoliths of alumina prepared at room temperature by aluminium oxidation. J. Mater. Sci. 2008, 43, 1234–1240. [Google Scholar] [CrossRef]
  12. Nguyen, T.H.N. Elaboration and Modifications of Nanofibrous Al2O3. Chemical and Process Engineering. Ph.D. Thesis, Université Sorbonne, Paris, France, 2016. [Google Scholar]
  13. Monsef Khoshhesab, Z.; Ahmadi, M. Removal of reactive blue 19 from aqueous solutions using NiO nanoparticles: Equilibrium and kinetic studies. Desalin. Water Treat. 2015, 57, 20037–20048. [Google Scholar] [CrossRef]
  14. Beauvy, M.; Vignes, J.-L.; Michel, D.; Mazerolles, L.; Frappart, C.; Di Costanzo, T. Process for the Preparation of Monolithic Hydrated Alumina, Amorphous or Crystallized Alumina, Aluminates and Composite Materials by Metal Aluminum Oxidation or Aluminum Alloy. European Patent Application FR2847569, 28 May 2004. [Google Scholar]
  15. Beauvy, M.; Vignes, J.-L.; Michel, D.; Mazerolles, L.; Frappart, C.; Di Costanzo, T. Method for Preparing Monolithic Hydrated Aluminas and Composite Materials. European Patent Application EP1562859, 17 August 2005. [Google Scholar]
  16. Khatim, O.; Nguyen, T.H.N.; Amamra, M.; Museur, L.; Khodan, A.; Kanaev, A. Synthesis and photoluminescence properties of nanostructured mullite/α-Al2O3. Acta Mater. 2014, 71, 108–116. [Google Scholar] [CrossRef] [Green Version]
  17. Bouslama, M.; Amamra, M.C.; Jia, Z.-X.; Ben Amar, M.; Chhor, K.; Brinza, O.; Abderrabba, M.; Vignes, J.-L.; Kanaev, A. Nanoparticulate TiO2-Al2O3 photocatalytic media: Effect of particle size and polymorphism on photocatalytic activity. ACS Catal. 2012, 2, 1884–1892. [Google Scholar] [CrossRef]
  18. Bouslama, M.; Amamra, M.C.; Brinza, O.; Tieng, S.; Chhor, K.; Abderrabba, M.; Vignes, J.-L.; Kanaev, A. Isolation of titania nanoparticles in monolithic ultraporous alumina: Effect of nanoparticle aggregation on anatase phase stability and photocatalytic activity. Appl. Catal. A 2011, 402, 156–161. [Google Scholar] [CrossRef]
  19. Tchieda, V.K.; D’Amato, E.; Chiavola, A.; Parisi, M.; Chianese, A.; Amamra, M.; Kanaev, A. Removal of arsenic by alumina: Effects of material size, additives, and water contaminants. Clean 2016, 44, 496–505. [Google Scholar] [CrossRef]
  20. Chiavola, A.; Tchieda, V.K.; D’Amato, E.; Chianese, A.; Kanaev, A. Synthesis and characterization of nanometric titania coated on granular alumina for arsenic removal. Chem. Eng. Trans. 2016, 47, 331–336. [Google Scholar]
  21. Özsoy, H.D.; Ünyayar, A.; Mazmanci, M.A. Decolourisation of reactive textile dyes Drimarene Blue X3LR and Remazol Brilliant Blue R by Funalia trogii ATCC 200800. Biodegradation 2005, 16, 195–204. [Google Scholar] [CrossRef] [PubMed]
  22. Khodan, A.; Nguyen, T.H.N.; Esaulkov, M.; Kiselev, M.R.; Amamra, M.; Vignes, J.-L.; Kanaev, A. Porous monoliths consisting of aluminum oxyhydroxide nanofibrils: 3D structure, chemical composition, and phase transformations in the temperature range 25–1700 °C. J. Nanopart. Res. 2018, 20, 1–11. [Google Scholar] [CrossRef]
  23. Ho, Y.S.; McKay, G. A comparison of chemisorption kinetic models applied to pollutant removal on various sorbents. Process Saf. Environ. Prot. 1998, 76, 332–340. [Google Scholar] [CrossRef] [Green Version]
  24. Ho, Y.S.; McKay, G. Pseudo-second order model for sorption processes. Process. Biochem. 1999, 34, 451–465. [Google Scholar] [CrossRef]
  25. Boyd, G.E.; Adamson, A.W.; Myers, L.S.J. The exchange adsorption of ions from aqueous solutions by organic zeolites. II. Kinetics. J. Am. Chem. Soc. 1947, 69, 2836–2848. [Google Scholar] [CrossRef]
  26. Ho, Y.S.; Ng, J.C.Y.; McKay, G. Kinetics of pollutant sorption by biosorbents: Review. Sep. Pur. Met. 2000, 29, 189–232. [Google Scholar] [CrossRef]
  27. Weber, W.J.; Morris, J.C. Kinetics of adsorption of carbon from solutions. J. Sanit. Eng. Div. 1963, 89, 31–63. [Google Scholar] [CrossRef]
  28. Fan, H.-T.; Sun, W.; Jiang, B.; Wang, Q.-J.; Li, D.-W.; Huang, C.-C.; Wang, K.-J.; Zhang, Z.-G.; Li, W.-X. Adsorption of antimony(III) from aqueous solution by mercapto-functionalized silica-supported organic-inorganic hybrid sorbent: Mechanism insights. Chem. Eng. J. 2016, 286, 128–138. [Google Scholar] [CrossRef]
  29. Foo, K.Y.; Hameed, B.H. Insights into the modeling of adsorption isotherm systems. Chem. Eng. J. 2010, 156, 2–10. [Google Scholar] [CrossRef]
  30. Langmuir, I. The adsorption of gases on plane surfaces of glass, mica and platinum. J. Am. Chem. Soc. 1918, 40, 1361–1403. [Google Scholar] [CrossRef] [Green Version]
  31. Langmuir, I. The constitution and fundamental properties of solids and liquids. Part I. Solids. J. Am. Chem. Soc. 1916, 38, 2221–2295. [Google Scholar] [CrossRef] [Green Version]
  32. Langmuir, I. The constitution and fundamental properties of solids and liquids. Part II. Liquids. J. Am. Chem. Soc. 1917, 39, 1848–1906. [Google Scholar] [CrossRef] [Green Version]
  33. Hall, K.R.; Eagleton, L.C.; Acrivos, A.; Vermeulen, T. Pore- and solid-diffusion kinetics in fixed-bed adsorption under constant-pattern conditions. Ind. Eng. Chem. Fundamen. 1966, 5, 212–223. [Google Scholar] [CrossRef]
  34. Webber, T.W.; Chakkravorti, R.K. Pore and solid diffusion models for fixed-bed adsorbers. AlChE J. 1974, 20, 228–238. [Google Scholar] [CrossRef]
  35. Freundlich, H.M.F. Über die adsorption in lösungen (Over the adsorption in solution). J. Phys. Chem. 1906, 57, 385–471. [Google Scholar]
  36. Haghseresht, F.; Lu, G.-Q. Adsorption characteristics of phenolic compounds onto coal-reject-derived adsorbents. Energy Fuels 1998, 12, 1100–1107. [Google Scholar] [CrossRef]
  37. Temkin, M.I.; Pyzhev, V.P. Kinetics of ammonia synthesis on promoted iron catalyst. Acta Phys. Chim. USSR 1940, 12, 327–356. [Google Scholar]
  38. Dubinin, M.M.; Radushkevich, L.V. The equation of the characteristic curve of the activated charcoal. Proc. USSR Acad. Sci. 1947, 55, 331–337. [Google Scholar]
  39. Hobson, J.P. Physical adsorption isotherms extending from ultra high vacuum to vapor pressure. J. Phys. Chem. 1969, 73, 2720–2727. [Google Scholar] [CrossRef]
  40. Özcan, A.; Öncü, E.M.; Özcan, A.S. Kinetics, isotherm and thermodynamic studies of adsorption of Acid Blue 193 from aqueous solutions onto natural sepiolite. Colloid. Surf. A 2006, 277, 90–97. [Google Scholar] [CrossRef]
  41. Patel, H.; Vashi, R.T. Wastewater treatment by physical-chemical technologies. In Wastewater Engineering: Advanced Wastewater Treatment Systems; Aziz, H.A., Mojiri, A., Eds.; IJSR Publications: Ahmedabad, India, 2014; pp. 5–48. [Google Scholar]
  42. Souza Santos, P.; Souza Santos, H.; Toledo, S.P. Standard transition aluminas. Electron microscopy studies. J. Mater. Res. 2000, 3, 104–114. [Google Scholar] [CrossRef]
  43. Sing, K.S.W.; Everett, D.H.; Haul, R.A.W.; Moscou, L.; Pierotti, R.A.; Rouquérol, J.; Siemieniewska, T. Reporting physisorption data for gas/solid systems with special reference to the determination of surface area and porosity. Pure Appl. Chem. 1985, 57, 603–619. [Google Scholar] [CrossRef]
  44. Storck, S.; Bretinger, H.; Maier, W.F. Characterization of micro- and mesoporous solids by physisorption methods and pore-size analysis. Appl. Catal. A 1998, 174, 137–146. [Google Scholar] [CrossRef] [Green Version]
  45. Iqbal, M.; Saeed, A. Biosorption of reactive dye by loofa sponge-immobilized fungal biomass of Phanerochaete chrysosporium. Process Biochem. 2007, 42, 1160–1164. [Google Scholar] [CrossRef]
  46. O’Mahony, T.; Guibal, E.; Tobin, J.M. Reactive dye biosorption by Rhizopus arrhizus biomass. Enzyme Microb. Technol. 2002, 31, 456–463. [Google Scholar] [CrossRef]
  47. Shanehsaz, M.; Seidi, S.; Ghorbani, Y.; Shoja, S.M.; Rouhani, S. Polypyrrole-coated magnetic nanoparticles as an efficient adsorbent for RB19 synthetic textile dye: Removal and kinetic study. Spectrochim. Acta A 2015, 149, 481–486. [Google Scholar] [CrossRef]
  48. Taty-Costodes, V.C.; Fauduet, H.; Porte, C.; Delacroix, A. Removal of Cd(II) and Pb(II) ions, from aqueous solutions, by adsorption onto sawdust of Pinus sylvestris. J. Hazard. Mater. 2003, 105, 121–142. [Google Scholar] [CrossRef]
  49. Monsef Khoshhesab, Z.; Souhani, S. Adsorptive removal of reactive dyes from aqueous solutions using zinc oxide nanoparticles. J. Chin. Chem. Soc. 2018, 65, 1482–1490. [Google Scholar] [CrossRef]
  50. Monsef Khoshhesab, Z.; Modaresnia, N. Adsorption of Acid Black 210 and Remazol Brilliant Blue R onto magnetite nanoparticles. Inorg. Nano Met. Chem. 2019, 49, 231–239. [Google Scholar] [CrossRef]
  51. Ijagbemi, C.O.; Baek, M.H.; Kim, D.S. Montmorillonite surface properties and sorption characteristics for heavy metal removal from aqueous solutions. J. Hazard. Mater. 2009, 166, 538–546. [Google Scholar] [CrossRef] [PubMed]
  52. Srivastava, V.C.; Swamy, M.M.; Mall, I.D.; Prasad, B.; Mishra, I.M. Adsorptive removal of phenol by bagasse fly ash and activated carbon: Equilibrium, kinetics and thermodynamics. Colloid. Surf. A 2006, 272, 89–104. [Google Scholar] [CrossRef]
  53. Kim, Y.; Kim, C.; Choi, I.; Rengraj, S.; Yi, J. Arsenic removal using mesoporous alumina prepared via a templating method. Environ. Sci. Technol. 2004, 38, 924–931. [Google Scholar] [CrossRef] [PubMed]
  54. Aziz, A.; Ouali, M.S.; Elandaloussi, E.H.; De Menorval, L.C.; Lindheimer, M. Chemically modified olive stone: A low-cost sorbent for heavy metals and basic dyes removal from aqueous solutions. J. Hazard. Mater. 2009, 163, 441–447. [Google Scholar] [CrossRef] [PubMed]
  55. Anayurt, R.A.; Sari, A.; Tuzen, M. Equilibrium, thermodynamic and kinetic studies on biosorption of Pb(II) and Cd(II) from aqueous solution by macrofungus (Lactarius scrobiculatus) biomass. Chem. Eng. J. 2009, 151, 255–261. [Google Scholar] [CrossRef]
  56. Saha, P.; Chowdhury, S. Insight into adsorption thermodynamics. In Thermodynamics; Mizutani, T., Ed.; InTech: London, UK, 2011; pp. 349–364. ISBN 978-953-307-544-0. [Google Scholar]
  57. Azizi, A.; Alavi Moghaddam, M.R.; Arami, M. Applications of wood waste for removal of reactive blue 19 from aqueous solutions: Optimization through response surface methodology. Environ. Eng. Manag. J. 2012, 11, 795–804. [Google Scholar]
  58. Ayazi, Z.; Khoshhesab, Z.M.; Norouzi, S. Modeling and optimizing of adsorption removal of Reactive Blue 19 on the magnetite/graphene oxide nanocomposite via response surface methodology. Desalin. Water Treat. 2016, 57, 25301–25316. [Google Scholar] [CrossRef]
  59. Hu, C.-W.; Hu, N.-T.; Li, X.-L.; Shen, H.-L.; Zhao, Y.-J. Adsorption of remazol brilliant blue R by carboxylated multi-walled carbon nanotubes. Desalin. Water Treat. 2017, 62, 282–289. [Google Scholar] [CrossRef]
  60. Madrakian, T.; Afkhami, A.; Mahmood-Kashani, H.; Ahmadi, M. Adsorption of some cationic and anionic dyes on magnetite nanoparticles-modified activated carbon from aqueous solutions: Equilibrium and kinetics study. J. Iran. Chem. Soc. 2012, 10, 481–489. [Google Scholar] [CrossRef]
  61. Liao, M.-H.; Chen, W.-C.; Lai, W.-C. Magnetic nanoparticles assisted low-molecular weight polyethyleneimine for fast and effective removal of reactive blue 19. Fresen. Environ. Bull. 2006, 15, 609–613. [Google Scholar]
Figure 1. (a) SEM and (b) TEM images of UPA(θ) powders, and elemental mapping of UPA(θ) powders (c) before and (d) after RBBR adsorption.
Materials 14 03054 g001
Figure 2. (a) FTIR spectra of UPA(θ) powders before and after RBBR adsorption; (b) XRD pattern and (c) nitrogen adsorption–desorption isotherm of UPA(θ) powders (inset: pore size distribution); (d) zeta potential value of UPA(θ) powders as a function of pH. m/V[UPA(θ)] = 4.44 g·L−1, I = 100 mmol·L−1 sodium acetate.
Materials 14 03054 g002
Figure 3. (a) Effect of initial pH on RBBR adsorption, C[RBBR]initial = 800 mg·L−1, m/V[UPA(θ)] = 4.44 g·L−1, I = 100 mmol·L−1 sodium acetate, T = 310 K, stirring speed = 150 rpm, and equilibrium time = 24 h. Adsorption kinetics regarding the (b) adsorption percentage and (c) adsorption capacity of RBBR retained by UPA(θ) powders; (d) effect of UPA(θ) dosage on RBBR adsorption kinetics. C[RBBR]initial = 800 mg·L−1, initial pH = 4.0 ± 0.1, I = 100 mmol·L−1 sodium acetate, T = 310 K, stirring speed = 150 rpm, and terminal equilibrium time = 24 h. a Three-dimensional curved surface simulation based on MATLAB matrix conversion and gridding.
Materials 14 03054 g003
Figure 4. Tests of the (a) Lagergren pseudo-first-order, (b) pseudo-second-order, (c) film diffusion (Boyd plot), and (d) intraparticle diffusion (Weber and Morris plot) models on RBBR adsorption retained by UPA(θ) powders.
Materials 14 03054 g004
Figure 5. Adsorption isotherm profiles of RBBR retained by UPA(θ) powders at different temperatures. m/V[UPA(θ)] = 5.56 g·L−1, initial pH = 4.0 ± 0.1, I = 100 mmol·L−1 sodium acetate, stirring speed = 150 rpm, and equilibrium time = 24 h.
Materials 14 03054 g005
Figure 6. Tests of the (a) Langmuir, (b) Freundlich, (c) Temkin, and (d) D–R isotherm models on RBBR adsorption retained by UPA(θ) powders. at different temperatures.
Materials 14 03054 g006
Figure 7. Linear plots of (a) lnKd versus Ce and (b) ln K0 versus 1000/T for RBBR adsorption retained by UPA(θ) powders.
Materials 14 03054 g007
Figure 8. Possible mechanisms for RBBR adsorption retained by UPA(θ) powders.
Materials 14 03054 g008
Table 1. Parameters of RBBR adsorption kinetics fitted by the Lagergren pseudo-first-order and pseudo-second-order models at T = 310 K.
UPA(θ) Dosage (g·L−1)
Kinetic Models4.446.678.8913.33
Lagergren pseudo-first-order
k′ (h−1)0.1150.1380.0940.060
Qmc (mg·g−1) a15.84415.2439.1713.337
R20.5210.5110.3360.332
Pseudo-second-order
k″ (g·mg−1·h−1)0.0490.0460.1020.422
Qmc (mg·g−1) a86.20786.95779.74557.803
R20.9990.9990.9990.999
Qme (mg·g−1) b87.38587.93481.11659.987
aQmc (mg·g−1) is the calculated adsorption capacity at equilibrium obtained from the kinetic models. b Qme (mg·g−1) is the experimental adsorption capacity at equilibrium.
Table 2. Parameters of RBBR adsorption kinetics fitted by the film diffusion (Boyd plot) and intraparticle diffusion (Weber and Morris plot) models at T = 310 K.
First-Curved Adsorption PartSecond-Linear Adsorption Part
Diffusion Models4.446.678.8913.334.446.678.8913.33
Film diffusion
kFD (min−1)0.01110.01360.01840.01230.00060.00040.00030.0003
Intercept on Y axis a−0.746−0.556−0.690−1.922−3.108−3.691−3.471−3.545
R20.9110.9560.9760.8070.8850.9090.8660.826
Intraparticle diffusion
kIPD (mg·g−1·min−0.5)3.36284.05383.01171.03850.07690.03740.02810.0217
CIPD42.30932.29943.00346.34782.33284.42978.19957.072
R20.7080.9040.8730.7040.8990.9160.8750.838
a A linear plot of −ln(1 − Qt/Qm) versus t with zero intercept indicates that the kinetics of the adsorption process is controlled by diffusion through the liquid surrounding the solid adsorbent particles.
Table 3. Parameters of RBBR adsorption isotherms fitted by the Langmuir, Freundlich, Temkin, and D–R isotherm models at different temperatures.
Isotherm Models295 K310 K333 K
Langmuir
qe,max (mg·g−1)122.549105.48574.184
KL (L·mg−1)0.1070.0390.019
R20.9990.9980.991
RL0.011–0.0780.030–0.1880.056–0.275
Freundlich
KF (mg(1−1/n)·L1/n·g−1)24.54813.4616.991
1/n0.3350.3900.401
R20.8800.9030.982
Temkin
B (J·mol−1)20.89221.37614.824
KT (L·g−1)2.0360.4640.242
R20.9600.9610.973
D–R
qe,max (mg·g−1)107.03783.50254.976
β (mol2·kJ−2)7.795 × 10−63.257 × 10−58.496 × 10⁻⁵
R20.7840.8660.823
Table 4. Thermodynamic parameters of RBBR adsorption retained by UPA(θ) powders.
T (K)ΔG0 (KJ·Mol−1)ΔH0 (kJ·Mol−1)ΔS0 (J·Mol−1·K−1)
295−4.673
310−2.383−39.711−119.372
333−0.107
Table 5. Comparison of RBBR adsorption capacity retained by UPA materials with other organic, inorganic, or bio-based adsorbents reported in related studies in the literature.
AdsorbentsExperimental Conditions aqe,max (Mg·g−1) bRef.
Mazandaran wood waste (WW)pH = 1.72, T = ND4.75[57]
ZnO nanoparticles (ZnO NPs)pH = 3.0, T = 298 K38.02[49]
Commercial NiOpH = ND, T = 298 K38.62[13]
NiO nanoparticlespH = ND, T = 298 K98.83[13]
Magnetite/GO (MGO) nanocompositepH = 3.0, T = 298 K62.50[58]
Magnetite nanoparticles (MNPs)pH = ND, T = 298 K74.40[50]
Free fungal biomass (FFB)pH = 2.0, T = 303 K80.91[45]
Loofa sponge-immobilized fungal biomass (LSIFB)pH = 2.0, T = 303 K98.90[45]
Magnetite-modified MWCNTs (MMMCNTs)pH = 4.0, T = 298 K88.80[4]
Rhizopus arrhizus biomasspH = 2.0, T = 298 K90.00[46]
Carboxylated MWCNTspH = ND, T = 298 K95.24[59]
Wheat branpH = 1.5, T = 293 K97.10[5]
Magnetite nanoparticles-modified AC (MMAC)pH = 4.0, T = 298 K104.60[60]
Polypyrrole-coated Fe3O4 (Ppy@Fe3O4 MNPs)pH = 3.0, T = 298 K112.36[47]
Ultraporous alumina(γ) (UPA(α))pH = 4.0, T = 295 K17.42This study
Ultraporous alumina(θ) (UPA(θ))pH = 4.0, T = 295 K122.55This study
Ultraporous alumina(α) (UPA(γ))pH = 4.0, T = 295 K212.31This study
Modified polyethyleneimine (LMW–PEI)pH = 10.0, T = 298 K121.00[61]
Modified bentonite (DAH–bentonite)pH = 1.5, T = 293 K134.71[6]
MgO nanoparticles (Nano-MgO)pH = 8.0, T = 298 K166.70[7]
a ND: No data. b Adsorption capacity uniformly converted into mg·g−1 (typical unit).
Publisher’s Note: MDPI stays neutral with regard to jurisdictional claims in published maps and institutional affiliations.

