Article

Indentation Modulus, Indentation Work and Creep of Metals and Alloys at the Macro-Scale Level: Experimental Insights into the Use of a Primary Vickers Hardness Standard Machine

1
INRiM—Applied Metrology and Engineering Division, National Institute of Metrological Research, Str. delle Cacce 91, 10135 Turin, Italy
2
Department of Management and Production Engineering, Politecnico di Torino, Corso Duca degli Abruzzi 24, 10129 Turin, Italy
*
Author to whom correspondence should be addressed.
Materials 2021, 14(11), 2912; https://doi.org/10.3390/ma14112912
Submission received: 9 April 2021 / Revised: 26 May 2021 / Accepted: 27 May 2021 / Published: 28 May 2021

Abstract

:
In this work, the experimental method and the calculation model for the determination of indentation moduli, indentation work, and indentation creep of metallic materials, by means of macroscale-level forces provided by a primary hardness standard machine at the National Institute of Metrological Research (INRIM) at the at room temperature were described. Indentation moduli were accurately determined from measurements of indentation load, displacement, contact stiffness and hardness indentation imaging and from the slope of the indentation unloading curve by applying the Doerner-Nix linear model; indentation work, representing the mechanical work spent during the force application of the indentation procedure, was determined by calculating the areas under the loading–unloading indentation curve, through fitting experimental data with a polynomial law. Measurements were performed with a pyramidal indenter (Vickers test). The applied force was provided by a deadweight machine, and the related displacement was measured by a laser interferometric system. Applied forces and the occurring indentation depths were simultaneously measured: the resulting loading–unloading indentation curve was achieved. Illustrative tests were performed on metals and alloy samples. Discussion and comments on the suitability of the proposed method and analysis were reported.

1. Introduction

Knowledge of elastic and plastic properties of metallic materials at the macroscopic level is of interest in many engineering and industrial applications devoted to metal processing and assembling techniques, since it can directly provide information on the material’s mechanical behavior when subjected to high stresses or for large-scale applications.
The mechanical behavior of a metallic material, for example in terms of plastic deformation and elastic recovery, cannot always be univocally identified from Hooke’s law, since certain dependences on the applied force time/rate (static, quasi-static, dynamic, and impulse), the type of acting forces (compression, tension, torsion, and penetration), the stressed surface area, the investigated scale (from the nanoscale to the macroscale level), beyond the usual environmental conditions (temperature), and the effects of aging (oxidation and corrosion) often induce some deviations from the expected linearity [1,2,3,4,5]. Therefore, it is more appropriate to identify, from time to time, a specific experimental technique tailored to the actual application of the investigated metallic material, to provide a suitable characterization of its mechanical properties in terms of elastic and plastic behavior. If it is of interest to investigate the mechanical properties of a metallic material subjected to high stresses concentrated in a single point, parameters such as indentation hardness, indentation modulus, indentation creep, and indentation work at the macroscale level allow evaluating the elastic-plastic response for typical ranges of applied stress and related deformation occurring in many practical applications.
In the metalworking industry, many assembling and processing techniques involving large stresses and punctual deformations [6,7,8,9], such as hammering [10], riveting [11], crimping [12], milling [13], cutting [14], and drilling [15], are routinely carried out. As a consequence, the accurate and reliable determination of the mechanical properties of the involved metallic materials (from working tools to materials processing) allows improving the efficiency of the whole working performance, in terms of waste reduction (metals chips), powder dispersion, lubricant consumption, machinery degradation and tools wearing, among others [16,17,18,19].
Experimental techniques based on instrumented indentation (from the nano- to macroscale level [20]) are applied to estimate elastic and plastic properties of materials. These methods, for metallic materials, are collected in ISO 14577-1 [21]. In applied metrology, “hardness” is a quantity collected within the Calibration and Measurement Capabilities of the BIPM, beyond to be supported by international key comparisons [22]. As a consequence, the elastic and plastic properties can be assessed from standardized and accurate experimental procedures, which allow guaranteeing the reliability of measurement results, based on repeatable and reproducible data.
Elastic recovery effects in indentation tests were firstly observed in 1961 by Stilwell and Tabor [23]. Back to 1983, hardness and elastic modulus, based on instrumented indentation test, were measured at the nanoscale level by Pethicai, Hutchings, and Oliver: by using a method to evaluate hardness, it was shown that depth-sensing indentation allows building a load–displacement curve, compatible with typical stress–strain diagrams of materials [24]. The method was further improved by Doerner and Nix in 1986, by using a high-resolution depth-sensing instrument [25], and in 1992, Oliver and Pharr defined a constitutive physical model of elastic indentation modulus and hardness, based on instrumented indentation [26]. It is also known that microhardness, nanohardness, and Young’s modulus strongly depend on the state of the material surface and change upon contact. In particular, electrical contact with other metals strongly depends on the physical and mechanical properties of metals as shown in [27,28]. More recently, the indentation work has been identified as a promising energy-based parameter to evaluate the elastic and plastic properties of metallic materials [29,30,31,32,33,34]. These theoretical models and experimental methods are nowadays included in ISO 14577 series; nevertheless, several important developments have been recently proposed to improve both the measurement accuracy and the reliability of empirical and semi-empirical models [35,36,37,38,39,40]. In the following, elastic and plastic properties of copper alloy, aluminum alloy, stainless steel, and copper–chromium–zirconium alloy samples are investigated, in terms of indentation modulus, indentation creep, and indentation work, at the macroscale level. Measurements are performed using a primary hardness deadweight machine, designed and realized at the National Institute of Metrological Research (INRIM), as shown in Section 2.1. In practice, by applying traditional hardness test procedures (according to ISO 6507), the elastic and plastic properties (according to ISO 14577) are evaluated at the same time, from highly accurate (and traceable) load and displacement measurements. This point is of importance, since these measurements are currently carried out by means of commercially available hardness machines in testing laboratories and industries; nevertheless, the accuracy and reliability of experimental results are often disregarded.

2. Materials and Methods

Materials investigated in this paper were copper alloy, aluminum alloy, stainless steel, and copper–chromium–zirconium alloy. Young’s modulus Es and Poisson ratio νs of the tested materials were previously evaluated from accurate measurements of speeds of sound in solids and in tension at environmental temperature (~21 °C) [41,42,43,44]. Despite the known systematic difference between dynamic and static moduli, the reference data are accurate as the overall uncertainties are less than 1%. These values were determined to estimate the Poisson ratios νs of the tested metals and alloys. In Table 1, the experimental data, used as a reference, of the tested alloys are shown.
As a reference, ISO 14577-1 [21] experimental procedures, with some specific improvements according to the literature, were implemented to evaluate the fundamental mechanical properties of metallic materials, in terms of indentation hardness HIT, indentation modulus EIT, indentation creep CIT, and the elastic part of indentation work ηIT. In this section, experimental devices, test methods, and calculation models are described in detail.

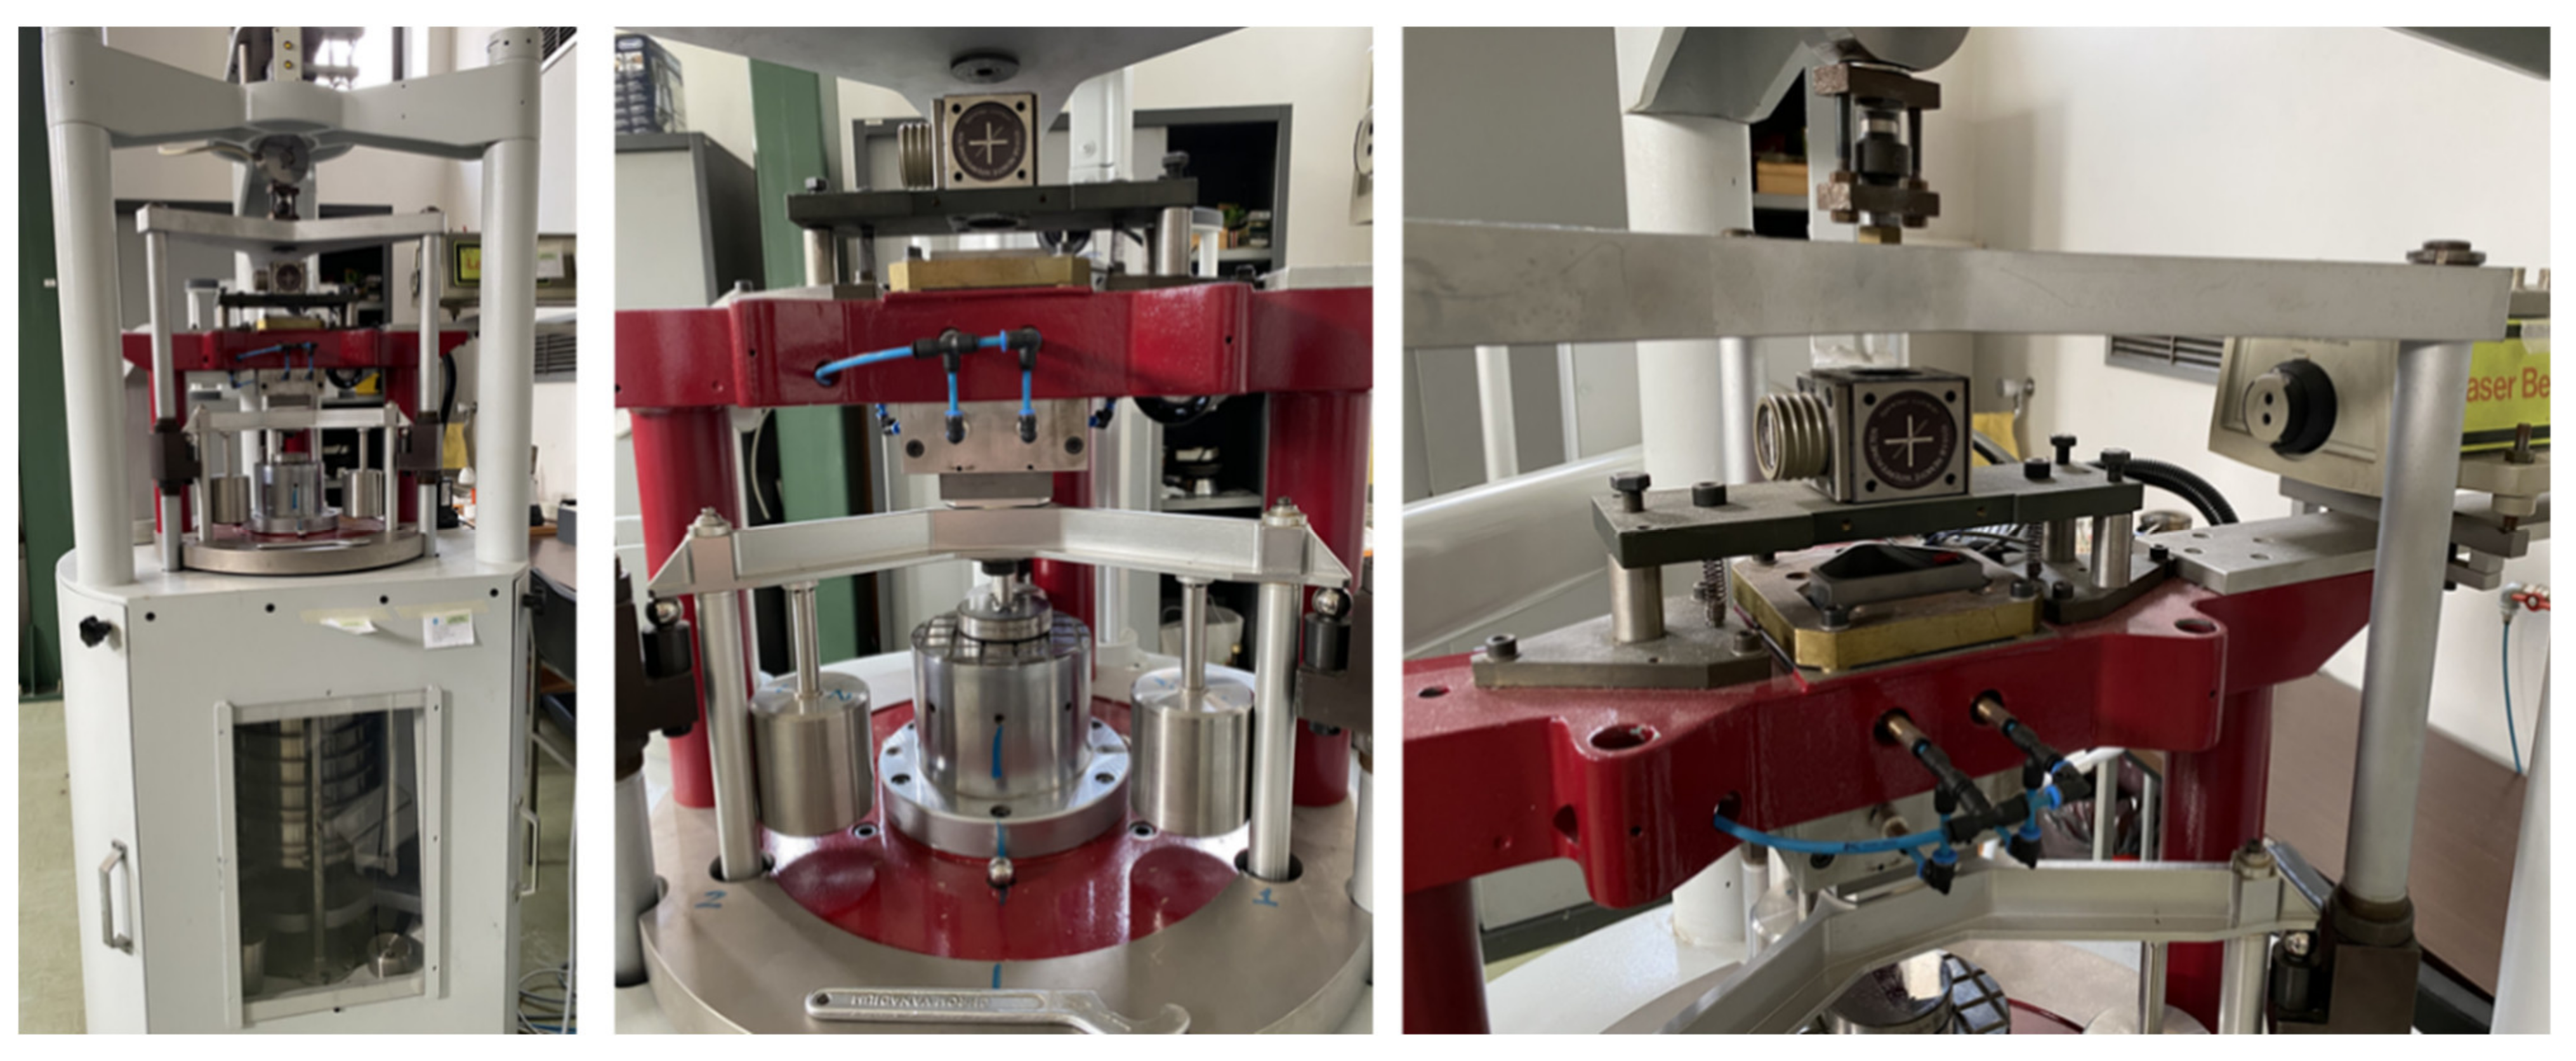
2.1. Primary Hardness Standard Machine

The indentation hardness, the indentation modulus, and the indentation work were determined by using a primary hardness standard deadweight machine from the INRIM, shown in Figure 1. The activities regarding the realization, maintenance, and improvement of the standard machine at the INRIM have been performed from the early 1970s up to the present day. Technical features and metrological characterization are summarized in detail in [45,46,47]. The standard deadweight machine complied with the requirements stated in Section 5 of the ISO 14577-1 [21]. The system applied forces by moving dead weights, and the occurring indentation depth were measured with a laser interferometric system. Applied forces were measured along the scale by a force transducer with an accuracy of 0.01%. The laser beam was aligned on the measurement axis, and the experimental data of the indentation depth were evaluated with a resolution of 0.02 µm. Force F and indentation depth h were recorded in real time at a 16 Hz sampling rate.

2.2. Indentation Hardness HIT

As stated in the standard ISO 14577-1 [21], indentation hardness HIT is determined as the ratio between the maximum load FMAX applied and the resulting contact projected area Ap, by the following equation:
H I T = F MAX A p ,
where projected contact area Ap, i.e., the value of the indenter area, functioning at the contact depth, depends on depth hc of the contact of the indenter with the sample at FMAX and on the type of the indenter. By using a Vickers diamond pyramidal indenter, with a vertex angle α, the projected contact area is written as:
A p = 2 h c · tan α 2 2 ,
where the depth hc of the contact of the indenter with the sample at FMAX is determined from Equation (3) as follows:
h c = h MAX ε · F MAX S C f · F MAX ,
where hMAX is the maximum indentation depth, FMAX is the maximum of the applied force, ε is a quantity depending on the indenter geometry and the extent of the plastic yield in the contact (for Vickers: ε = 0.75), S is the contact stiffness, and Cf is the frame compliance.
The contact stiffness S was determined by fitting the unloading indentation curve, as the incremental ratio S is expressed as: F h h MAX , as shown in Section 2.3.
Frame compliance Cf represents the elastic deformations of the testing machine during the indentation test. Frame compliance Cf was evaluated from experimental data by the slope of unloading curves, as shown in Section 2.6.
According to Annex F of the standard ISO 14577-1 [21], the values of indentation hardness HIT can be correlated to conventional Vickers hardness (HV) measured according to ISO 6507-1, [48], by applying a proper scaling factor. Divergences can be useful to identify some inaccuracies in applied procedures.

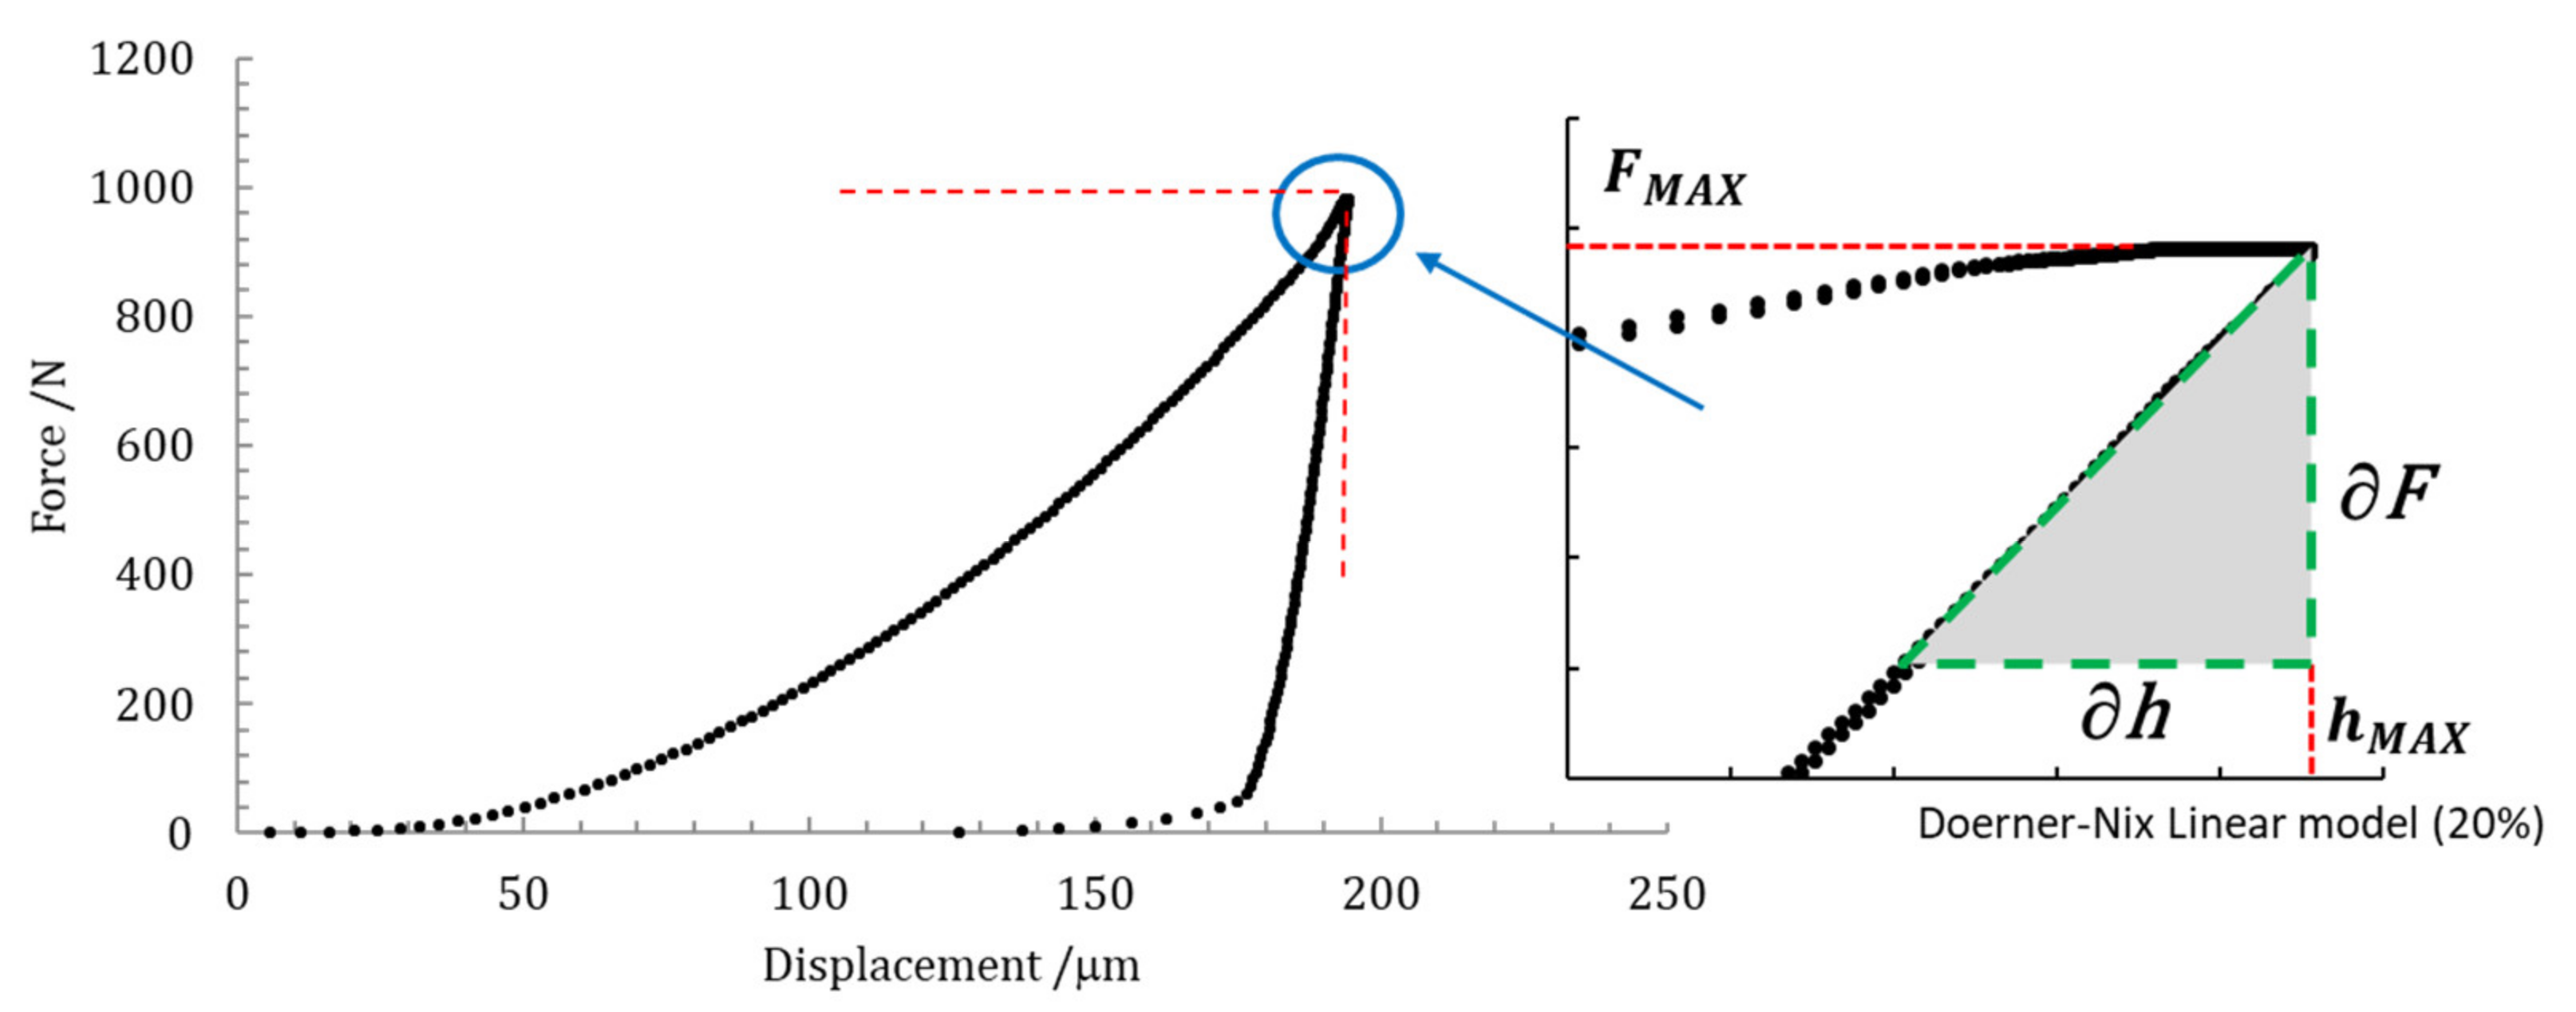
2.3. Indentation Modulus, EIT

Back to 1992, Oliver and Pharr introduced a method for the measurement of the indentation modulus based on an indentation technique [26]. Indentation modulus, EIT, quantifies the elastic response of a material subjected to the action of a concentrated load in a single point; nevertheless, the relationship between applied stress and displacements is no longer linear; thus, the indentation modulus represents a close estimation of Young’s modulus. Indentation modulus EIT depends on several parameters and boundary conditions, and according to ISO 14577-1 Annex A.5, it is expressed as [21]:
E I T = 1 ν s 2 2 A p S π 1 ν i 2 E i ,
where νs is the Poisson ratio of the sample under investigation, νi and Ei are the Poisson ratio and Young’s modulus of the indenter material, respectively, S is the contact stiffness, i.e., the incremental ratio between unloading force and related displacement at the maximum depth of indentation, and Ap is the projected contact area.
Once the maximum applied force FMAX and the maximum depth of indentation hMAX were known, the indentation modulus EIT was experimentally determined from the length of the Vickers indenter diagonals and from the contact stiffness S, depending on the slope of the indentation unloading curve.
In Figure 2, an experimental loading–unloading indentation curve as a function of true applied force and displacement and slope evaluation, is depicted.
In ISO 14577-1 [21], a linear model (the Doerner-Nix method) and a power law (the Oliver-Pharr method) are suggested to fit the unloading path of an indentation curve: the linear model is applied to the initial 20% of the unloading curve; the power-law allows fitting from 50% up to 80% of the unloading curve. However, in this paper, only the linear model was used to fit the unloading curve, since the power-law model relies on the depth of the unloading point, which has high uncertainties [38].

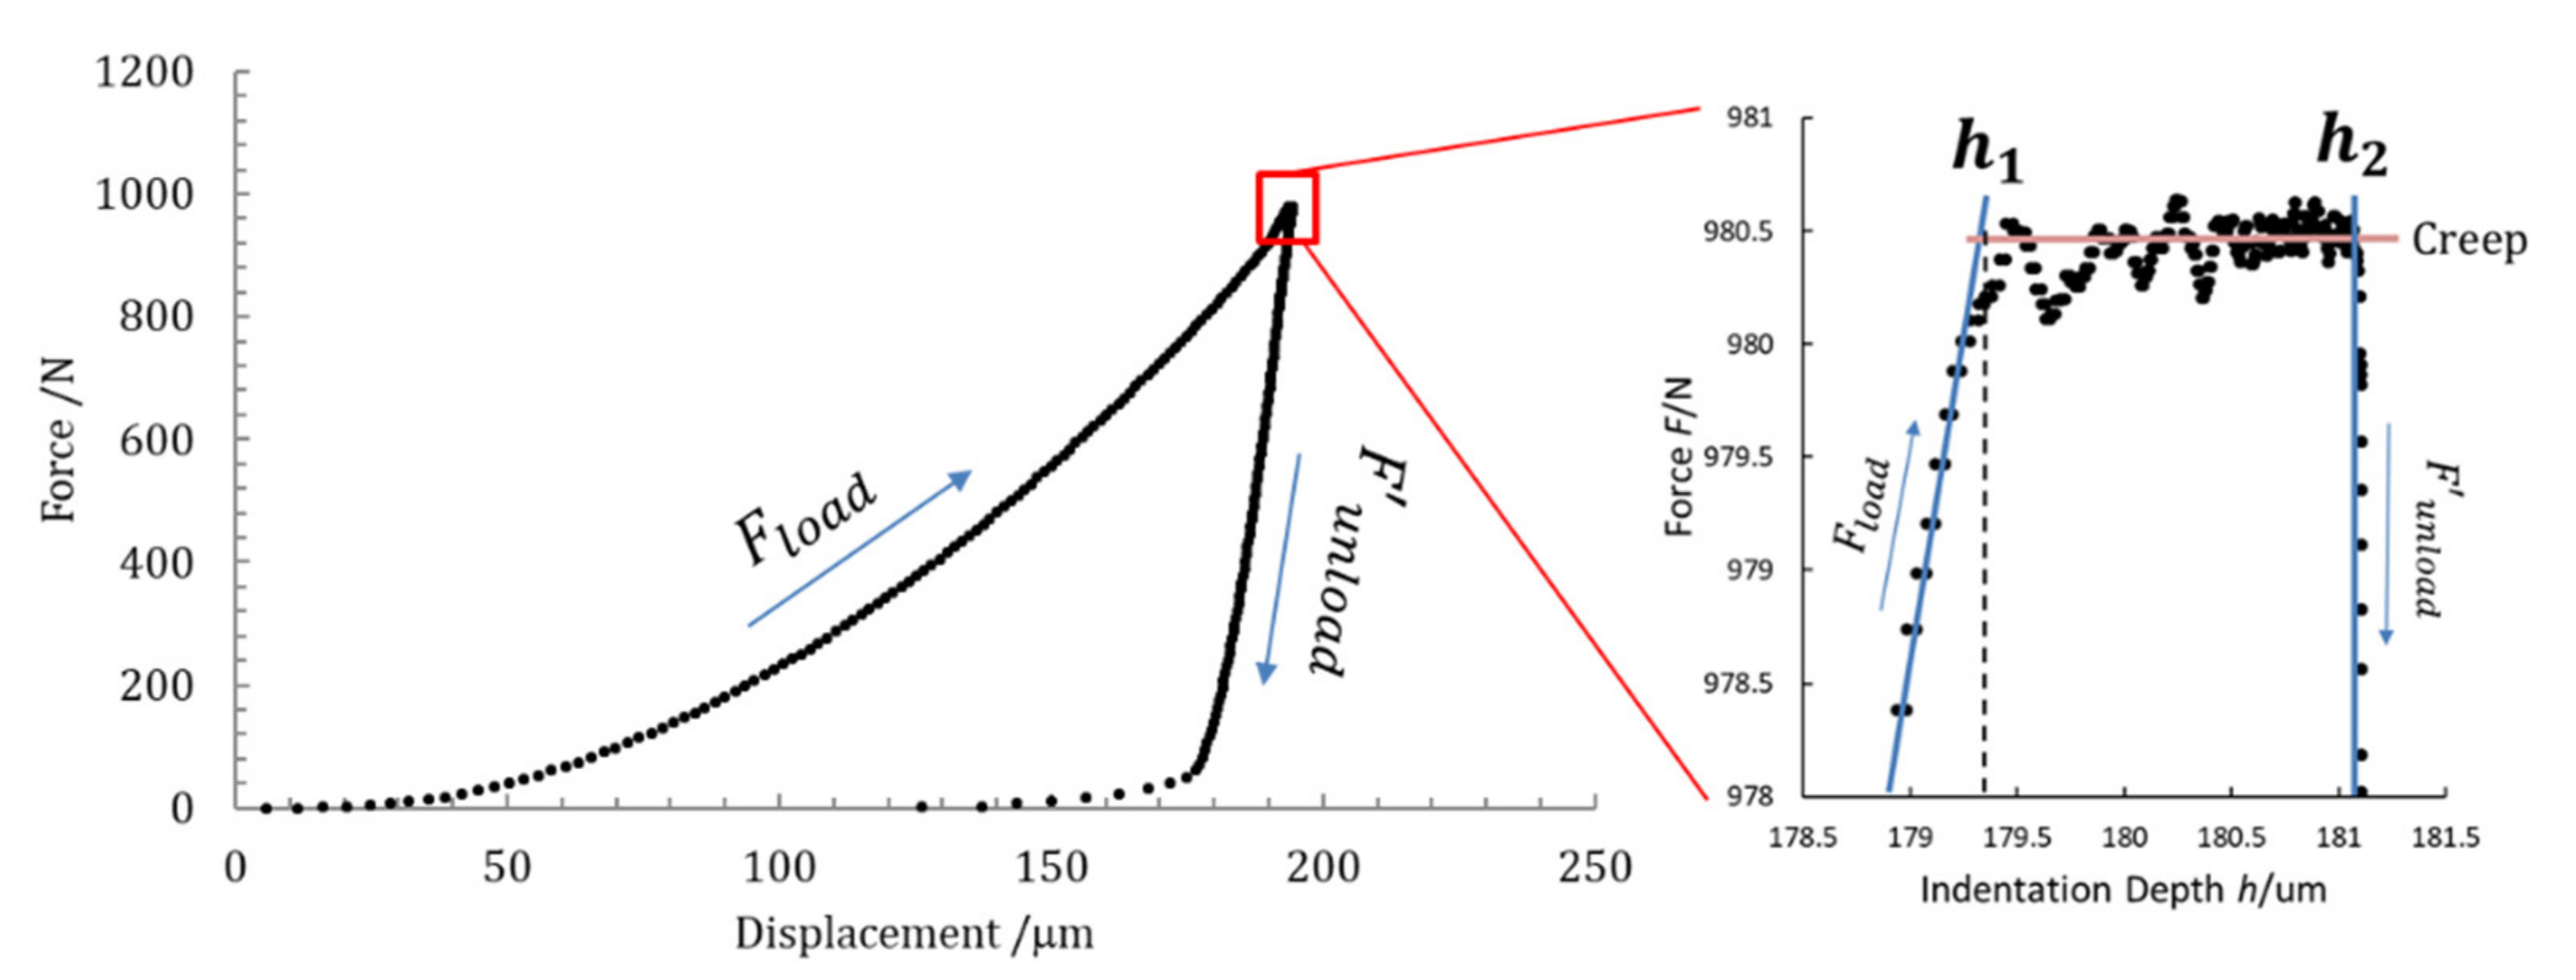
2.4. Indentation Creep

The variation of indentation depth, measured with a constant test force in a given time interval, depends on the creep of the material. Namely, indentation creep CIT is determined as the relative change of the indentation depth from the following Equation (5) according to ISO 14577-1 Annex A.6 [21]:
C I T = h 2 h 1 h 1 × 100 ,
where h1 is the indentation depth at time t1 of reaching the test force, which is kept constant and h2 is the indentation depth at the time (t2) of holding the constant test force (h2hMAX). Different intervals of time can be applied, depending on the implemented hardness test according to ISO 6507-1 [48], usually from 10 s to 15 s. In Figure 3, the observed creep at a constant test force is shown.

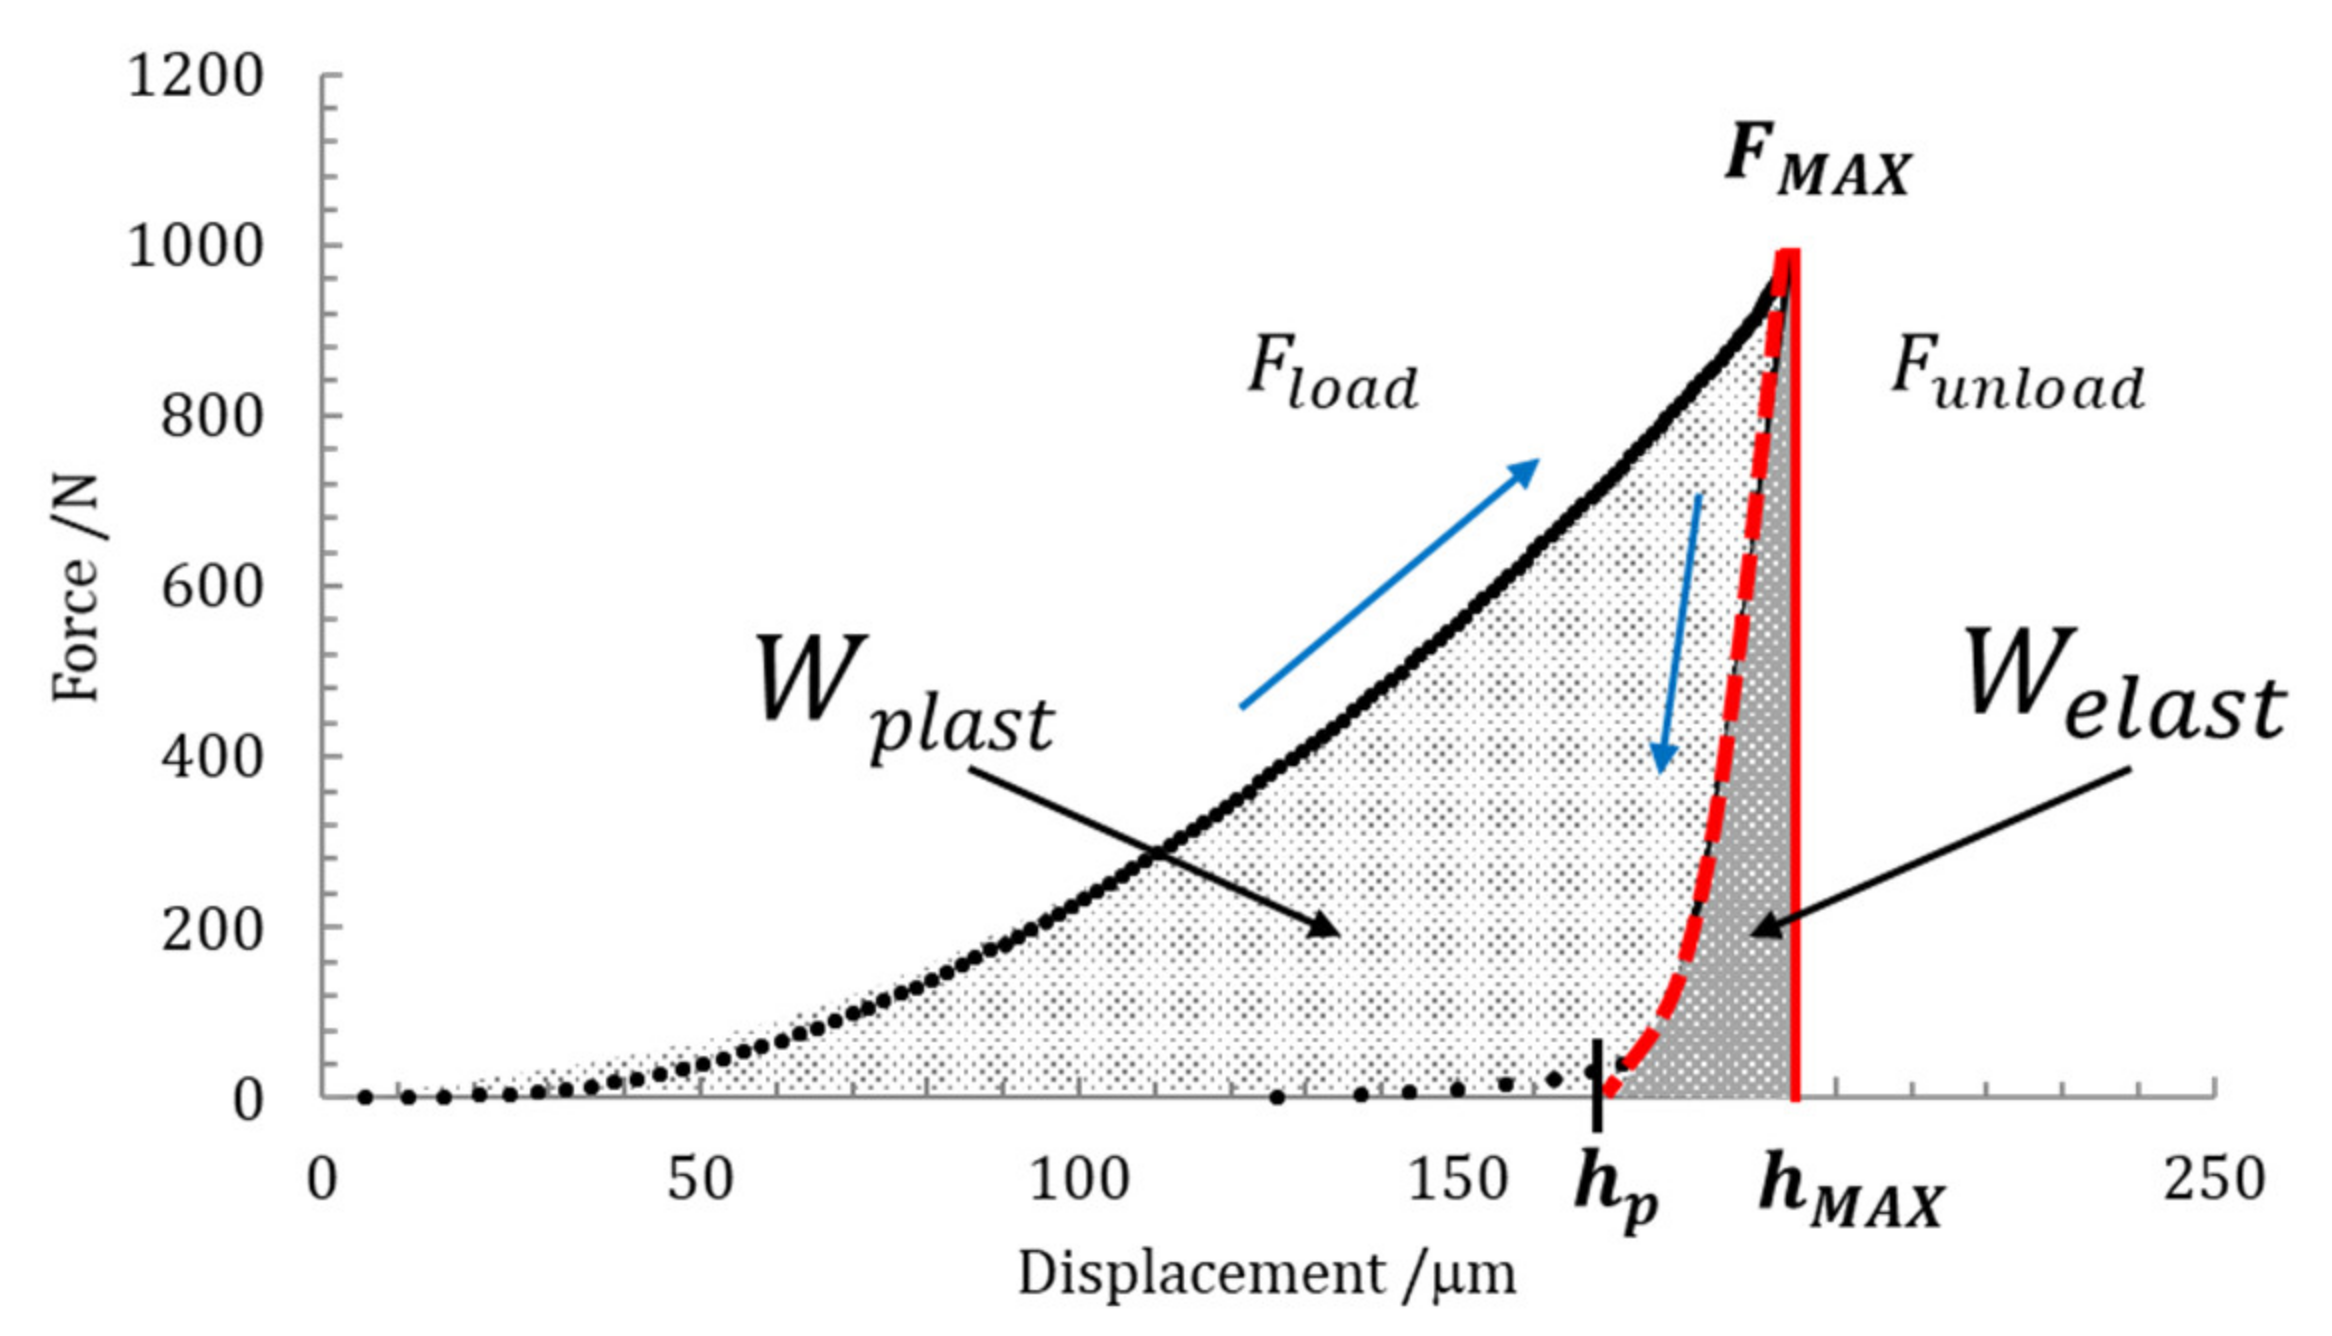
2.5. Indentation Work

The mechanical work (i.e., the total energy) Wtotal occurring in the indentation procedure, during the application of load and discharge, is partly dissipated as plastic deformation work Wplast and partially stored as the work of the elastic reverse deformation, Welast. Thus, the mechanical work is expressed as the sum of dissipated and stored energies during the indentation processes as follows:
W t o t a l = W p l a s t + W e l a s t = F · d h   z ,
Both the plastic part and elastic part can be quantified from the calculation of the areas under the loading and unloading indentation curves. In this case, suitable curve fittings are necessary to accurately evaluate the two areas, from the experimental data diagram, as shown in Figure 4.
As shown in Figure 4, a power law is usually applied for representing the loading and unloading paths [29,30]. The general relationships are given by Equations (7) and (8), respectively:
F l o a d = A · h n ,
F u n l o a d = B · h h p m ,
where Fload and Funload are the force experimental data of the loading and unloading paths, respectively, h is the displacement from F = 0 up to FMAX (on the loading curve) and hp is the permanent indentation depth reached from FMAX to F = 0 (on the unloading curve). Empirical values of A, B, n, and m are fitting parameters, calculated from the best functions approximating the experimental data.
According to the standard ISO 14577-1 [21], the elastic part of indentation work ηIT is expressed in percentage from Equation (9):
η I T = W e l a s t W t o t a l × 100 ,

2.6. Frame Compliance and Contact Compliance Evaluation

Frame compliance Cf is an experimental quantity affecting the accuracy of indentation modulus measurement [39], as well as the elastic–plastic deformations occurring in the sample under investigation. Frame compliance is related to the deformations of the testing machine during the indentation test. To estimate the actual frame compliance in this paper, according to ISO 14755-1 Annex C [21], a series of loading and unloading cycles, performed on a standardized stainless-steel reference block for hardness (ASAHI HV30) at a single indentation point, was applied. Actually, more procedures are available according to standards and recent literature [40,44], based on the actual indentation depth of Vickers indentation [49,50,51].
Frame compliance Cf is the difference between the total compliance Ctot and the sample contact compliance Cs and shown as follows:
C f = C t o t C s = h F F = F MAX A p S H I T F MAX ,
where Ctot is derived from the derivative of the (uncorrected) test force removal curve at the maximum force, and Cs is the contact compliance of the specimen material, depending on the indentation hardness HIT (obtained with Equation (1)), the projected contact area Ap (obtained with Equation (2)), and the resulting contact stiffness S at maximum indentation load FMAX.
Experimentally, total compliance Ctot was determined as the reciprocal of contact stiffness S, measured after a series of loading and unloading cycles at a single point. By measuring the slope of the indentation curve, after several repetitions, the frame compliance was calculated based on a linear regression, as shown in Figure 5.
On the basis of the experimental data, the contact compliance Cs was negligible with respect to the total compliance Ctot; therefore, it can be simply assumed that Cf∂h/∂F for the last loading and unloading indentation curves.
In this study, Cf was 94·10−9 m/N for HV3, Cf was 36·10−9 m/N for HV30, and Cf was 22·10−9 m/N for HV100. Taking into account that the experimental value of the contact compliance Cs of the stainless-steel reference block sample range between 10−13 m/N and 10−12 m/N, it is possible to assume that CfCtot, at the macroscale level. As a matter of fact, by applying a series of loading and unloading cycles at a single indentation point until the slope of contact stiffness S kept constant, the contact compliance tended to be minimized. The resulting slope of the last indentation curve (after eight cycles in this example) is only due to the machine deformations as a whole.

3. Experimental Methods and Procedures

In order to define indentation modulus EIT, indentation creep CIT and indentation work WIT (and the related elastic part ηIT), according to ISO 14577-1 [21] methods, HV measurements were carried out with maximum forces FMAX of 29.4 N, 294.2 N, and 980.6 N, i.e., HV3, HV30, and HV100, according to the ISO 6507-1 procedure [48]. In the graphs of Figure 6, as an example, the experimental data of the force-controlled test procedure as a function of time, performed on the stainless-steel sample (HV100) with the INRIM primary hardness machine, are shown.
The maximum indentation depth hMAX, measured by using the laser interferometric system, frame compliance Cf obtained by Equation (10) and contact area Ap obtained by Equation (2) were collected for every single measurement. The Young’s modulus and the Poisson ratio of the Vickers diamond pyramidal indenter are Ei = 1140 GPa and vi = 0.07, respectively [21]. In the graphs of Figure 7, Figure 8, Figure 9 and Figure 10, the experimental loading–unloading curves of the HV values of the investigated metallic materials are shown.
As stated in ISO 14577-1 [21], from the ratio between maximum force FMAX and contact area Ap, as shown in Equations (1)–(3), indentation hardness HIT was determined. Parameters used to calculate HIT were applied for the determination of EIT, according to Equation (3).
Contact stiffness S written as ∂F/∂h was determined from the Doerner-Nix linear model, by taking into account a portion of 20% of the unloading curve data, as shown in the graph of Figure 2. The geometrical dimensions of Vickers indentations, such as length l of the indentation side, calculated from the two diagonals d were accurately measured by the optical microscopy imaging technique, as described in detail in [44].
The indentation work WIT was calculated from the best fit of the loading and the unloading curves of the experimental data. As shown in Figure 4, the permanent indentation depth (at the end of the cycle) hp is the value of displacement on the unloading curve, in which the value of force is back to F = 0, and it was evaluated from the best fit of the experimental data. On the other hand, fitting curves introduce further uncertainties, depending on the accuracy of the mathematical model adopted. In particular, differently from the trends expressed in Equations (7) and (8), the shapes of the loading curve Fload and the unloading curve Funload at the macroscale level do not show a pure exponential trend, but a more complex relationship, as can be observed in Figure 6, Figure 7, Figure 8 and Figure 9. In particular, the “knees” observed on the unloading curves (where F → 0) are likely due to the load-removing mechanical system of the standard machine. To avoid this effect that is material-independent, the value of hp was determined by calculating the zero value from the best fit of the unloading curve.
Moreover, since a variation of the indentation depth was achieved when the maximum constant force FMAX is applied, as described in Section 2.4 and shown in Figure 5a, two values of the maximum indentation depth were identified, namely h1, i.e., the indentation depth at the time (t1) of reaching the test force, which is kept constant, and h2, i.e., the indentation depth at the time (t2) when the constant test force is removed (h2hMAX). In the interval of time (t2t1), in which the maximum constant force FMAX is applied, the occurring drift on indentation depth δh (described as: δh = h2h1) is due to the material creep, as shown in Figure 3. The mechanical work during the creep was also calculated, and the related quantity was added to the plastic deformation work Wplast. As a consequence, the total mechanical indentation work WIT, given by Equation (6), was rewritten in explicit physical terms as:
W I T = 0 h 1 F l o a d d h + F MAX h 1 h 2 d h p l a s t h 2 h p F u n l o a d d h e l a s t ,
The whole portion of energy dissipated during loading path h (from 0 to h1) and the occurring creep, at maximum constant force FMAX (from h1 to h2) is the plastic indentation work; the elastic part is quantified by the unloading path only from h2 to hp.
To accurately interpolate the experimental data and to build suitable (and reasonable) functions to be integrated, as shown in Equation (11), the loading and unloading curves were fitted with polynomial functions as follows:
F l o a d = a · h 6 + b · h 5 + c · h 4 + + f · h + g ,   for   0     h   h 1
F u n l o a d = a · h 5 + b · h 4 + + e · h + f ,   for   h p     h   h 2
where the loading path Fload is fitted by a single hexic-polynomial function from h = 0 up to h1, as shown in Figure 11a, and FMAX is a constant during creep, as shown in Figure 3, while the unloading path Funload is fitted by a quintic-polynomial function between maximum indentation depth h2 and hp (here identified as the point in which F = 0 is expected on the fitting curve). The portion of the area below the unloading path, from the “knee” (identified as a corner point) back to the point at which F = 0 was considered within the plastic part, as shown in the graph of Figure 11b.
In the graph of Figure 12, a representation of the whole mechanical work during the indentation procedure is schematically depicted. The part of the area under the creep drift δh quantifies the part of energy dissipated during the constant application of maximum load FMAX. Force application timings depend on the hardness test procedures according to pertinent standards.

4. Experimental Results

In Table 2, Table 3, Table 4 and Table 5, the experimental average data, and the empirical values of stainless steel, copper alloy, aluminum alloy, and copper–chromium–zirconium alloy, used to implement the calculation models of indentation hardness HIT, indentation modulus EIT indentation creep CIT, and indentation work ηIT from HV standard tests, were collected. According to [52,53], plasticity characteristic δH, which is a dimensionless parameter defined as the ratio between the plastic (hp in this specific case) and the total deformation (hMAX) during indentation, namely δH = hp/hMAX, is also reported.
Except for HV results, of which the uncertainties are around 1% derived from BIPM-CMC [54], the uncertainty of the experimental results was evaluated by propagating the uncertainties of the experimental data listed in Table 2, Table 3, Table 4 and Table 5 including the reproducibility obtained from seven measurement repetitions on the same sample for each indentation test. The overall experimental expanded uncertainties at a confidence level of 95% were between 13% and 20%.
By way of example, the detailed uncertainty budget for indentation modulus EIT in the case of HV100 on the copper alloy sample (see Table 3) is shown in Table 6. Symbols of independent variables appearing in the mathematical model and their values and notes distinguishing the type of contribution are written down in column xj. Entries in column u(xj) are the standard uncertainties for each contribution. Coefficients of sensitivity xj were evaluated by partial derivation, and individual contributions uj2 (EIT) of the variance of dependent variable EIT were calculated. By taking into account this information, it is possible to get the expanded uncertainty U(EIT).
It was obtained that the major individual contribution to the combined standard uncertainty of EIT was the reproducibility obtained from seven measurement repetitions on the same sample, which can be mainly attributed to the measurement itself. In this illustrative case, the relative standard deviation due to reproducibility was around 7.8%. The standard uncertainty of experimental data was much lower than reproducibility and was 0.6%. Finally, an overall relative expanded uncertainty of 17.4% was obtained.

5. Discussion

The experimental results shown in Table 2, Table 3, Table 4 and Table 5, obtained according to ISO 14577-1 [21] procedures by using the primary-hardness-standard machine at the INRIM in the macroforce range, were expressed only in terms of average values. A detailed procedure for the overall uncertainty evaluation, at the macro-scale level, is available in [40]. In this paper, the indentation of materials performed according to ISO 6507-1 [48] HV tests was not limited to the HV value determination, but it was investigated by monitoring the complete cycle of the load and the unload of the test force and the occurring displacement during plastic and elastic deformation [55]. Four metallic materials, namely stainless steel, copper alloy, aluminum alloy, and copper–chromium–zirconium alloy, were subjected to HV3, HV30, and HV100 tests, according to methods routinely used at the INRIM for international key comparisons; thus, experimental HV results were determined from well-established and reproducible procedures. The contribution of the frame compliance was identified as the reciprocal of contact stiffness S and measured after a series of loading and unloading cycles at a single point, until the slope of contact stiffness S was constant and the contact compliance was minimized; frame compliance is a sensitive parameter, affecting the accuracy of contact area Ap value.
Based on previous observations, once measurements are performed, a first comparison between HV values and HIT values allows identifying the trustworthiness of experimental data to be used in the calculation model: as a matter of fact, if HV ≈ c × g−1 × HIT (where c is the ratio of contact areas and g is the acceleration due to gravity and equals to approximately 1, according to ISO 14577-1 Annex F [21]), a good agreement between pure geometrical approximations of the indention and projected contact area Ap is achieved; on the contrary, if large divergences are observed, such as in stainless steel (see Table 2) or in HV3 and HV100 in aluminum alloy (Table 4), data might not be reliable enough to be implemented in the calculation model, and then inaccurate determinations of the indentation modulus could be easily achieved. Compatibility between HV and HIT, observed for HV3 and HV100 in copper alloy (Table 3), HV30 in aluminum alloy (Table 4), and HV30 and HV100 in copper–chromium–zirconium alloy (Table 5), suggests consequent reliability in the inherent mechanical properties of the tested materials. It is also shown that the hardness values vary as a function of the applied load. Such behavior is likely due to size effect phenomena occurring in nano- and microhardness, rather than pile-up or sink-in effects which are negligible for HV, as shown in [40].
Nevertheless, other parameters can be used to evaluate the reliability of the experimental results by calculating the relationship between the energy dissipated during the indentation and the ratio of hardness HIT to reduced elastic modulus Er [56] and from the plasticity characteristic values δH [52]. As observed, this energy ratio allows determining the hardness, elastic modulus, and contact area and circumventing the effects of pile-up and sink-in. The relationship is expressed as:
W e l a s t W t o t a l = k 1 H I T E r ,
where HIT is the indentation hardness, Er is the reduced modulus, namely Er = π · 2 C S A P 1 , and parameter k−1 depends on the type and on the geometry of indenter. As suggested, on the basis of FEM simulation [57], it is expected a parameter of proportionality k−1 for a Vickers indenter is five. Experimental results, obtained at macroscale force levels by applying the procedure here described, are in agreement with the proportionality of Equation (14), with an observed parameter of proportionality k−1 ≈ 7.
As previously stated, plasticity characteristic values δH are also reported. Experimental values change as a function of the tested material, ranging, as an average, between 0.85 and 0.94 for metals and alloys as found in [52,53], and are constants as a function of the applied load. Theoretical values of δH were also calculated by combining the Poisson’s ratio νs, Young’s modulus Es (Table 1), and Vickers hardness HV, as following:
δ H = 1 14.3 1 ν s 2 ν s 2 H V E s .
It was found that theoretical values of δH obtained by Equation (15) are comparable with experimental ones (i.e., δH = hp/hMAX), with mean relative differences of 2.1% for stainless steel alloy, 1.1% for aluminum alloy, 4.4% for copper alloy, and 2.6% for copper–chromium–zirconium alloy.
Although the methods for the evaluation of indentation modulus EIT are widely used, particularly at the micro- and nanoscale levels, and experimental results are often in agreement with the corresponding Young’s modulus, which is not always true at the macroscale level, as can be observed from the experimental results in Table 1 and in [43,44]. At the macro-scale level, the procedure for the calculation of the indentation work is presumably more suitable to properly evaluate the mechanical properties of tested materials, since it was founded with more reliable experimental results that it is independent of contact area Ap and is based on a large set of available experimental data; as a consequence, an accurate evaluation of dissipated and stored elastic energy can be useful (beyond the reliability and representativity of large deformations due to high locally applied stresses) to estimate the actual mechanical properties of tested materials, in terms of elastic and plastic behavior and in terms of creep.

6. Conclusions

In this paper, the experimental procedure and the calculation models for the determination of the indentation modulus, indentation work and indentation creep of metallic materials, by applying a macro-range of force with a primary hardness standard machine at the INRIM at room temperature are presented. The experimental procedure was performed according to the standard ISO 14577-1, applied to the HV tests from HV3 up to HV100, performed on the basis of the standard ISO 6507-1. Experimental data, suitable for HV values determination, were used for the calculation of indentation hardness HIT and indentation modulus EIT; indentation work WIT was determined by calculating the areas under the loading–unloading indentation curve, from the best fit of experimental data based on specific polynomial functions; the elastic part and the plastic part (with the work due to creep) of the whole indentation work were accurately identified in terms of stored and dissipated energy. The reliability of experimental results was verified by comparing HV and HIT according to ISO 14577-1 Annex F, with the parameter of proportionality k−1 and the plasticity characteristic values δH. From this experimental evidence, it is possible to plan suitable operations to improve the efficiency of assembling and processing techniques in the metalworking industry by reducing effects of wearing and degradation of working tools and processed metals.

Author Contributions

Conceptualization, A.S. and A.G.; methodology, A.S., C.O., A.G., and A.P.; software, C.O., A.G., and A.P.; validation, A.S., A.P., and G.G.; formal analysis, C.O., A.P., and G.G.; investigation, A.S.; resources, A.S. and A.G.; data curation, A.S. and C.O.; writing—original draft preparation, A.S.; writing—review and editing, A.S., A.G., A.P., and G.G. All authors have read and agreed to the published version of the manuscript.

Funding

This research was partially funded by EMPIR 14IND03 “Strength-ABLE”. The EMPIR is jointly funded by the EMPIR participating countries within EURAMET and the European Union.

Institutional Review Board Statement

Not applicable.

Informed Consent Statement

Not applicable.

Data Availability Statement

The data presented in this study are available on request from the corresponding author.

Acknowledgments

Part of experimental results and data analysis were carried out together with Giovanni Maizza (Polito), Roberto Cagliero (Polito), Frediano De Marco (Polito), Gianluca Coppola (Technische Universität München), and Giulio Barbato (Polito). Copper–chromium–zirconium alloy were provided by Alexandra Cackett and Christopher D. Hardie (United Kingdom Atomic Energy Authority) in the framework of EMPIR 14IND03 project.

Conflicts of Interest

The authors declare no conflict of interest.

References

  1. Ledbetter, H.M.; Reed, R.P. Elastic Properties of Metals and Alloys, I. Iron, Nickel, and Iron-Nickel Alloys. J. Phys. Chem. Ref. Data 1973, 2, 531–618. [Google Scholar] [CrossRef] [Green Version]
  2. Ledbetter, H.M.; Naimon, E.R. Elastic Properties of Metals and Alloys. II. Copper. J. Phys. Chem. Ref. Data 1974, 3, 897–935. [Google Scholar] [CrossRef]
  3. Pushkar, A.; Golovin, S.A.; Zubets, V.V.; Letko, I. Elastic modulus defect in structural materials under loading with various stresses and frequencies. Probl. Prochnosti 1987, 18, 74–77. [Google Scholar]
  4. Salvado, F.C.; Teixeira-Dias, F.; Walley, S.M.; Lea, L.J.; Cardoso, J.B. A review on the strain rate dependency of the dynamic viscoplastic response of FCC metals. Prog. Mater. Sci. 2017, 88, 186–231. [Google Scholar] [CrossRef] [Green Version]
  5. Kim, J.; Kim, D.-N. Computational Studies for the Yield-Point Phenomenon of Metals. Multiscale Sci. Eng. 2020, 2, 90–106. [Google Scholar] [CrossRef]
  6. Lesuer, D.R.; Kay, G.J.; LeBlanc, M.M. Modeling Large-Strain, High-Rate Deformation in Metals (No. UCRL-JC-134118); Lawrence Livermore National Lab.: Livermore, CA, USA, 2001. [Google Scholar]
  7. Mwema, F.; Obiko, J.; Akinlabi, E.; Akinlabi, S.; Fatoba, O. Effect of punch force on the upsetting deformation process using three-dimensional finite element analysis. J. Phys. Conf. Ser. 2019, 1378, 032094. [Google Scholar] [CrossRef]
  8. Kinsey, B.L.; Mori, K.-I.; Ngaile, G. Deformation Processes. Handb. Manuf. 2019, 277, 277–382. [Google Scholar] [CrossRef]
  9. Dixit, U.S. Modeling of Metal Forming: A Review. In Mechanics of Materials in Modern Manufacturing Methods and Processing Techniques; Elsevier BV: Amsterdam, The Netherlands, 2020; pp. 1–30. [Google Scholar]
  10. Kumar, K.; Kalita, H.; Zindani, D.; Davim, J.P. Forming. In Materials Forming, Machining and Tribology; J.B. Metzler: Stuttgart, Germany, 2019; pp. 53–63. [Google Scholar]
  11. Falk, T.; Jäckel, M. Increasing flexibility of self-pierce riveting using numerical and statistical methods. Proc. Manuf. 2019, 29, 264–270. [Google Scholar] [CrossRef]
  12. Dragobetskii, V.; Nevliudova, V.; Moloshtan, D.; Mospan, D.; Mospan, V.; Kotsyuba, V. Possibilities of the Electric Drive in the Implementation of the Intensifying Factors in the Plastic Deformation of Metals. In 2020 IEEE Problems of Automated Electrodrive. Theory and Practice (PAEP); Institute of Electrical and Electronics Engineers (IEEE): Piscataway, NJ, USA, 2020; pp. 1–4. [Google Scholar]
  13. Brecher, C.; Löpenhaus, C.; Greschert, R. Influence of the metalworking fluid on the micropitting wear of gears. Wear 2019, 434–435, 202996. [Google Scholar] [CrossRef]
  14. Yakubov, C.; Skakun, V.; Dzhemalyadinov, R. The Increase of Cutting Tool Life with Wear-Resistant Coating by a LCPM Directional Operation in a Starting Phase of Metalworking; Elsevier BV: Amsterdam, The Netherlands, 2021; Volume 38, pp. 1617–1621. [Google Scholar]
  15. Gopal, P.M. Effect of Silica Rich CRT on Thrust Force, Temperature and Surface Finish in Drilling Magnesium Hybrid MMC; Springer: Berlin/Heidelberg, Germany, 2020; pp. 1–11. [Google Scholar]
  16. Skakun, V.; Dzhemalyadinov, R.; Abdulkerimov, I. Experimental evaluation of the efficiency of lubricating process media during the running-in period of a metal-cutting tool. IOP Conf. Ser. Mater. Sci. Eng. 2020, 889, 012034. [Google Scholar] [CrossRef]
  17. Uysal, A.; Caudill, J.R.; Schoop, J.; Jawahir, I.S. Minimising carbon emissions and machining costs with improved human health in sustainable machining of austenitic stainless steel through multi-objective optimisation. Int. J. Sustain. Manuf. 2020, 4, 281–299. [Google Scholar] [CrossRef]
  18. Krolczyk, G.; Maruda, R.; Krolczyk, J.; Wojciechowski, S.; Mia, M.; Nieslony, P.; Budzik, G. Ecological trends in machining as a key factor in sustainable production—A review. J. Clean. Prod. 2019, 218, 601–615. [Google Scholar] [CrossRef]
  19. Olufayo, O.; Songmene, V.; Kenné, J.-P.; Ayomoh, M. Modelling for cost and productivity optimisation in sustainable manufacturing: A case of dry versus wet machining of mould steels. Int. J. Prod. Res. 2020, 1–20. [Google Scholar] [CrossRef]
  20. Broitman, E. Indentation Hardness Measurements at Macro-, Micro-, and Nanoscale: A Critical Overview. Tribol. Lett. 2017, 65, 23. [Google Scholar] [CrossRef] [Green Version]
  21. ISO 14577-1:2002. Metallic Materials—Instrumented Indentation Test for Hardness and Materials Parameters—Part 1: Test Method. Available online: https://www.iso.org/standard/30104.html (accessed on 1 April 2021).
  22. Germak, A.; Herrmann, K.; Low, S. Traceability in hardness measurements: From the definition to industry. Metrologia 2010, 47, S59–S66. [Google Scholar] [CrossRef]
  23. Stilwell, N.A.; Tabor, D. Elastic Recovery of Conical Indentations. Proc. Phys. Soc. 1961, 78, 169–179. [Google Scholar] [CrossRef]
  24. Pethicai, J.B.; Hutchings, R.; Oliver, W.C. Hardness measurement at penetration depths as small as 20 nm. Philos. Mag. A 1983, 48, 593–606. [Google Scholar] [CrossRef]
  25. Doerner, M.; Nix, W. A method for interpreting the data from depth-sensing indentation instruments. J. Mater. Res. 1986, 1, 601–609. [Google Scholar] [CrossRef]
  26. Oliver, W.C.; Pharr, G.M. An improved technique for determining hardness and elastic modulus using load and displacement sensing indentation experiments. J. Mater. Res. 1992, 7, 1564–1583. [Google Scholar] [CrossRef]
  27. Zuev, L.B.; Danilov, V.I.; Konovalov, S.V.; Filip’Ev, R.A.; Gromov, V.E. Influence of contact potential difference and electric potential on the microhardness of metals. Phys. Solid State 2009, 51, 1137–1141. [Google Scholar] [CrossRef]
  28. Orlova, D.V.; Danilov, V.I.; Zuev, L. Character of variation in the microhardness of the (0001) plane of Zn single crystals under the action of electrostatic field and the possible reason for this effect. Phys. Solid State 2013, 55, 353–357. [Google Scholar] [CrossRef]
  29. Cheng, Y.T.; Cheng, C.M. Scaling approach to conical indentation in elastic-plastic solids with work hardening. J. Appl. Phys. 1998, 84, 1284–1291. [Google Scholar] [CrossRef]
  30. Cheng, Y.-T.; Cheng, C.-M. Relationships between hardness, elastic modulus, and the work of indentation. Appl. Phys. Lett. 1998, 73, 614–616. [Google Scholar] [CrossRef]
  31. Zeng, K.; Chiu, C.-H. An analysis of load–penetration curves from instrumented indentation. Acta Mater. 2001, 49, 3539–3551. [Google Scholar] [CrossRef]
  32. N’Jock, M.Y.; Roudet, F.; Idriss, M.; Bartier, O.; Chicot, D. Work-of-indentation coupled to contact stiffness for cal-culating elastic modulus by instrumented indentation. Mech. Mater. 2016, 94, 170–179. [Google Scholar]
  33. Kang, J.J.; Becker, A.A.; Wen, W.; Sun, W. Extracting elastic-plastic properties from experimental loading-unloading indentation curves using different optimization techniques. Int. J. Mech. Sci. 2018, 144, 102–109. [Google Scholar] [CrossRef]
  34. Goto, K.; Watanabe, I.; Ohmura, T. Determining suitable parameters for inverse estimation of plastic properties based on indentation marks. Int. J. Plast. 2019, 116, 81–90. [Google Scholar] [CrossRef]
  35. Bao, Y.; Wang, W.; Zhou, Y. Investigation of the relationship between elastic modulus and hardness based on depth-sensing indentation measurements. Acta Mater. 2004, 52, 5397–5404. [Google Scholar] [CrossRef]
  36. Zorzi, J.; Perottoni, C. Estimating Young’s modulus and Poisson’s ratio by instrumented indentation test. Mater. Sci. Eng. A 2013, 574, 25–30. [Google Scholar] [CrossRef]
  37. Prou, J.; Kishimoto, K.; Constantinescu, A. Identification of Young’s Modulus from Indentation Testing and Inverse Analysis. J. Solid Mech. Mater. Eng. 2010, 4, 781–795. [Google Scholar] [CrossRef] [Green Version]
  38. Chudoba, T.; Jennett, N. Higher accuracy analysis of instrumented indentation data obtained with pointed indenters. J. Phys. D Appl. Phys. 2008, 41, 215407. [Google Scholar] [CrossRef]
  39. Ullner, C.; Reimann, E.; Kohlhoff, H.; Subaric-Leitis, A. Effect and measurement of the machine compliance in the macro range of instrumented indentation test. Measurement 2010, 43, 216–222. [Google Scholar] [CrossRef]
  40. Cagliero, R.; Barbato, G.; Maizza, G.; Genta, G. Measurement of elastic modulus by instrumented indentation in the mac-ro-range: Uncertainty evaluation. Int. J. Mech. Sci. 2015, 101, 161–169. [Google Scholar] [CrossRef]
  41. Lago, S.; Brignolo, S.; Cuccaro, R.; Musacchio, C.; Albo, P.G.; Tarizzo, P. Application of acoustic methods for a non-destructive evaluation of the elastic properties of several typologies of materials. Appl. Acoust. 2014, 75, 10–16. [Google Scholar] [CrossRef]
  42. Schiavi, A.; Origlia, C.; Germak, A.; Barbato, G.; Maizza, G.; Genta, G.; Cagliero, R.; Coppola, G. Measurement of Macro-Scale Indentation Modulus Using the Primary Hardness Standard Machines at INRIM. In Proceedings of the IMEKO TC3, TC5, TC22 Joint Conference, Helsinki, Finland, 1 June 2017. [Google Scholar]
  43. Schiavi, A.; Origlia, C.; Cackett, A.; Hardie, C.; Signore, D.; Petrella, O.; Germak, A. Comparison between tensile properties and indentation properties measured with various shapes indenters of Copper-Chromium-Zirconium alloy at macroscale level. J. Phys. Conf. Ser. 2018, 1065, 062010. [Google Scholar] [CrossRef]
  44. Schiavi, A.; Origlia, C.; Germak, A.; Barbato, G.; Maizza, G.; Genta, G.; Cagliero, R.; Coppola, G. Indentation modulus at macro-scale level measured from Brinell and Vickers indenters by using the primary hardness standard machine at IN-RiM. ACTA IMEKO 2019, 8, 3–12. [Google Scholar] [CrossRef]
  45. Barbato, G.; Desogus, S.; Levi, R. Design and performance of a dead-weight standard Rockwell hardness testing machine. J. Test. Eval. 1978, 6, 276–279. [Google Scholar]
  46. Germak, A.; Origlia, C. Metrological Characterization of the Vickers Hardness Calibration Machine and Gal-Vision Measuring System Realised by LTF for NIM (China). Available online: https://www.researchgate.net/profile/Alessandro-Germak/publication/236609733_Metrological_characterization_of_the_Gal-Indent_and_Gal-Vision_measuring_systems_realised_by_LTF_Spa_for_UME_Turkey/links/00463518d0bb899d9f000000/Metrological-characterization-of-the-Gal-Indent-and-Gal-Vision-measuring-systems-realised-by-LTF-Spa-for-UME-Turkey.pdf (accessed on 1 April 2021).
  47. Germak, A.; Liguori, A.; Origlia, C. Experience in the Metrological Characterization of Primary Hardness Standard Machines. In Proceedings of the HARDMEKO 2007, Tsukuba, Japan, 19–21 November 2007. [Google Scholar]
  48. ISO 6507-1:2018. Metallic Materials—Vickers Hardness Test—Part 1: Test Method. Available online: https://www.iso.org/standard/64065.html (accessed on 1 April 2021).
  49. Petit, F.; Vandeneede, V.; Cambier, F. Relevance of instrumented micro-indentation for the assessment of hardness and Young’s modulus of brittle materials. Mater. Sci. Eng. A 2007, 456, 252–260. [Google Scholar] [CrossRef]
  50. Prato, A.; Galliani, D.; Origlia, C.; Germak, A. A correction method for Vickers indenters squareness measurement due to the tilt of the pyramid axis. Measurement 2019, 140, 565–571. [Google Scholar] [CrossRef]
  51. Prato, A.; Origlia, C.; Germak, A. Verification of Knoop indenters with a Vickers-addressed optical system. Measurement 2020, 163, 107928. [Google Scholar] [CrossRef]
  52. Milman, Y.V.; Chugunova, S.I.; Goncharova, I.V.; Golubenko, A.A. Plasticity of Materials Determined by the Indentation Method. Usp. Fiz. Met. 2018, 19, 271–308. [Google Scholar] [CrossRef]
  53. Milman, Y.; Galanov, B.; Chugunova, S. Plasticity characteristic obtained through hardness measurement. Acta Met. Et Mater. 1993, 41, 2523–2532. [Google Scholar] [CrossRef]
  54. BIPM 2007. Available online: https://www.bipm.org/en/cipm-mra/kcdb.html (accessed on 1 April 2021).
  55. Nakamura, M. Theory and Application of Hardness Tests: Evaluating Hardness Based on Material Flow; Yamamoto Scientific Tool Laboratory Co., Ltd.: Osaka, Japan, 2019. [Google Scholar]
  56. Malzbender, J. Comment on the determination of mechanical properties from the energy dissipated during indentation. J. Mater. Res. 2005, 20, 1090–1092. [Google Scholar] [CrossRef]
  57. Venkatesh, T.A.; van Vleit, K.J.; Ginnakopoulos, A.E.; Suresh, S. Determination of elasto-plastic properties by instrumented sharp indentation: Guidelines for property extraction. Scr. Mater. 2000, 42, 833. [Google Scholar] [CrossRef]
Figure 1. Experimental measuring systems used in this investigation: primary hardness standard deadweight machine with the details of the anvil and the interferometric system.
Materials 14 02912 g001
Figure 2. Loading–unloading paths of the indentation curve, expressed as a function of applied force and displacement, with quantities used for the determination of contact stiffness S.
Materials 14 02912 g002
Figure 3. Loading–unloading paths of the indentation curve, expressed as a function of applied force and displacement with the indication of the creep of the material during the application of a constant force.
Materials 14 02912 g003
Figure 4. Experimental areas representing the plastic and elastic parts of the indentation work, under the loading and unloading indentation curves.
Materials 14 02912 g004
Figure 5. Series of loading and unloading cycles of the indentation curve at a single point (a); and the linear regression of the last reversed unloading curve for the HV100 procedure (b).
Materials 14 02912 g005
Figure 6. Experimental data of the applied load (a) and the indenter displacement (approaching and indentation) (b) of a HV100 indentation test. Forces were applied at a rate of 160 N/s (load displacement speed: 100 µm/s). The maximum load was applied for 15 s.
Materials 14 02912 g006
Figure 7. Loading–unloading curves of the Vickers hardness (HV) tests on stainless steel: (a) HV3; (b) HV30; (c) HV100.
Materials 14 02912 g007
Figure 8. Loading–unloading curves of the HV tests on aluminum alloy: (a) HV3; (b) HV30; (c) HV100.
Materials 14 02912 g008
Figure 9. Loading-unloading curves of the HV tests on copper alloy: (a) HV3; (b) HV30; (c) HV100.
Materials 14 02912 g009
Figure 10. Loading–unloading curves of the HV tests on Cu–Cr–Zr alloy: (a) HV3; (b) HV30; (c) HV100.
Materials 14 02912 g010
Figure 11. (a) Loading curve obtained by Equation (12); (b) best fit (red) of the unloading curve obtained by Equation (13) and the identification of the expected permanent indentation depth hp from the zero value of the fitting curve.
Materials 14 02912 g011
Figure 12. Schematic representation of the plastic, elastic, and creep parts of the indentation work beneath the loading and unloading indentation curves as a function of applied force and displacement.
Materials 14 02912 g012
Table 1. Experimental values of the Young’s moduli and Poisson ratios of metals and alloys under investigation.
MaterialYoung’s Modulus
Es (GPa)
Poisson Ratio
νs (-)
Stainless steel201.70.287
Aluminum alloy71.60.342
Copper alloy122.60.358
Cu–Cr–Zr135.00.310
Table 2. Data of the HV test results on stainless steel.
Experimental DataHV3HV30HV100
Maximum applied loadFMAX (N)29.4294.2980.6
Maximum indentation depth 1hMAX (µm)49.2102.5181.1
Contact depthhc (µm)48.097.9171.4
Permanent indentation depthhp (µm)44.991.6160.5
Maximum indentation depth 1h1 (µm)48.6101.4179.4
Creep driftΔh (µm)0.61.11.6
Contact areaAp (m)5.64 × 10−82.35 × 10−77.20 × 10⁻⁷
Frame complianceCf (mN−1)9.44 × 10−83.58 × 10−82.25 × 10⁻⁸
Contact stiffnessS (Nm−1)1.80 × 1074.75 × 1077.56 × 107
Contact complianceCs (mN−1)5.7 × 10−125.1 × 10−131.5 × 10⁻¹³
Experimental Results
Hardness (Vickers)HV210.8177.5173.9
Indentation hardnessHIT (MPa)1297.81039.81364.3
Indentation modulusEIT (GPa)80.887.390.6
Elastic part of indentation workηIT (%)20.814.814.4
Indentation creepCIT (%)1.21.10.9
Plastic deformation work 2Wplast (µJ)282753345,760
Work of creepWcreep (µJ)173341603
Elastic deformation workWelast (µJ)3210316923
Plasticity characteristicδH (-)0.920.900.89
1hMAXh2. 2 The plastic deformation work was computed with the work due to creep.
Table 3. Data of the HV test results on copper alloy.
Experimental DataHV3HV30HV100
Maximum applied loadFMAX (N)29.4294.2980.6
Maximum indentation depth 1hMAX (µm)43.6182.3320.4
Contact depthhc (µm)42.6178.7312.4
Permanent indentation depthhp (µm)38.8173.2302.2
Maximum indentation depth 1h1 (µm)43.3181.3318.7
Creep driftΔh (µm)0.31.01.7
Contact areaAp (m)4.44 × 10−87.83 × 10−72.39 × 10⁻⁶
Frame complianceCf (mN−1)9.44 × 10−83.58 × 10−82.25 × 10⁻⁸
Contact stiffnessS (Nm−1)2.15 × 1076.15 × 1079.14 × 107
Contact complianceCs (mN−1)2.7 × 10−122.9 × 10−131.2 × 10⁻¹³
Experimental Results
Hardness (Vickers)HV65.449.444.2
Indentation hardnessHIT (MPa)662.6521.9410.2
Indentation modulusEIT (GPa)92.473.151.8
Elastic part of indentation workηIT (%)11.66.16.4
Indentation creepCIT (%)0.70.50.5
Plastic deformation work 2Wplast (µJ)39315,666102,290
Work of creepWcreep (µJ)92841696
Elastic deformation workWelast (µJ)287975776
Plasticity characteristicδH (-)0.900.960.95
1hMAXh2. 2 The plastic deformation work was computed with the work due to creep.
Table 4. Data of the HV test results on aluminum alloy.
Experimental DataHV3HV30HV100
Maximum applied loadFMAX (N)29.4294.2980.6
Maximum indentation depth 1hMAX (µm)47.489.6194.1
Contact depthhc (µm)45.081.9178.6
Permanent indentation depthhp (µm)41.872.2161.1
Maximum indentation depth 1h1 (µm)47.189.1193.4
Creep driftΔh (µm)0.30.50.8
Contact areaAp (m)4.97 × 10−81.64 × 10−77.82 × 10⁻⁷
Frame complianceCf (mN−1)9.44 × 10−83.58 × 10−82.25 × 10⁻⁸
Contact stiffnessS (Nm−1)9.32 × 1062.86 × 1074.75 × 107
Contact complianceCs (mN−1)7.1 × 10−126.4 × 10−132.4 × 10⁻¹³
Experimental Results
Hardness (Vickers)HV176.6174.1170.9
Indentation hardnessHIT (MPa)1362.91790.51348.8
Indentation modulusEIT (GPa)58.167.852.7
Elastic part of indentation workηIT (%)21.423.821.8
Indentation creepCIT (%)0.70.50.4
Plastic deformation work2Wplast (µJ)257632540,914
Work of creepWcreep (µJ)9135750
Elastic deformation workWelast (µJ)53170410,573
Plasticity characteristicδH (-)0.890.810.83
1hMAXh2. 2 The plastic deformation work was computed with the work due to creep.
Table 5. Data of the HV test results on copper–chromium–zirconium alloy.
Experimental DataHV3HV30HV100
Maximum applied loadFMAX (N)29.4294.2980.6
Maximum indentation depth 1hMAX (µm)43.9150.7287.1
Contact depthhc (µm)42.7146.4278.2
Permanent indentation depthhp (µm)41.1137.7270.0
Maximum indentation depth 1h1 (µm)43.5149.6285.0
Creep driftΔh (µm)0.41.12.1
Contact areaAp (m)4.47 × 10−85.25 × 10−71.90 × 10⁻⁶
Frame complianceCf (mN−1)9.44 × 10−83.58 × 10−82.25 × 10⁻⁸
Contact stiffnessS (Nm−1)1.87 × 1075.18 × 1078.23 × 107
Contact complianceCs (mN−1)3.1 × 10−123.5 × 10−131.2 × 10⁻¹³
Experimental Results
Hardness (Vickers)HV90.062.757.8
Indentation HardnessHIT (MPa)887.8633.0631.5
Indentation ModulusEIT (GPa)91.570.691.2
Elastic part of indentation workηIT (%)13.57.67.3
Indentation CreepCIT (%)0.90.70.7
Plastic deformation work 2Wplast (µJ)34513,56088,507
Work of creepWcreep (µJ)113292032
Elastic deformation workWelast (µJ)329366066
Plasticity characteristicδH (-)0.950.920.95
1hMAXh2. 2 The plastic deformation work was computed with the work due to creep.
Table 6. Uncertainties for indentation modulus EIT of copper alloy for HV100.
VariableSymbolValueNoteu2 (xj)cjuj2 (EIT)
Young’s modulus (i)Ei (Pa)1.14 × 10⁶Tabulatednegligible
Poisson ratio (i)νI (-)7.00 × 10⁻²Tabulatednegligible
Poisson ratio (s)νs (-)3.30 × 10⁻¹Tabulated4.8 × 10−5−3.8 × 10107.0 × 1016
Vertex angleA (rad)2.37Certificate6.5 × 10−8−7.4 × 10103.5 × 1014
Max. indentation depthhMAX (m)3.20 × 10⁻⁴Resolution3.3 × 10−17−1.8 × 10141.1 × 1012
Maximum applied loadFMAX (N)9.81 × 10²Resolution2.4 × 10−35.6 × 1067.5 × 1010
Contact stiffnessS (Nm−1)9.14 × 10⁷Regression7.5 × 10105.5 × 1022.3 × 1016
Frame complianceCf (mN−1)2.25 × 10⁻⁸Regression1.3 × 10−201.8 × 10174.0 × 1014
EIT (Pa)4.10 × 10⁹Reproducibility1.6 × 101911.6 × 1019
Indentation modulusEIT (Pa)51.8 × 10⁹ U(EIT)8.9 × 10⁹
%17.4
Publisher’s Note: MDPI stays neutral with regard to jurisdictional claims in published maps and institutional affiliations.

