
Effect of Particle Size on the Mechanical Properties of TiO2–Epoxy Nanocomposites


Abstract
1. Introduction
2. Experiment
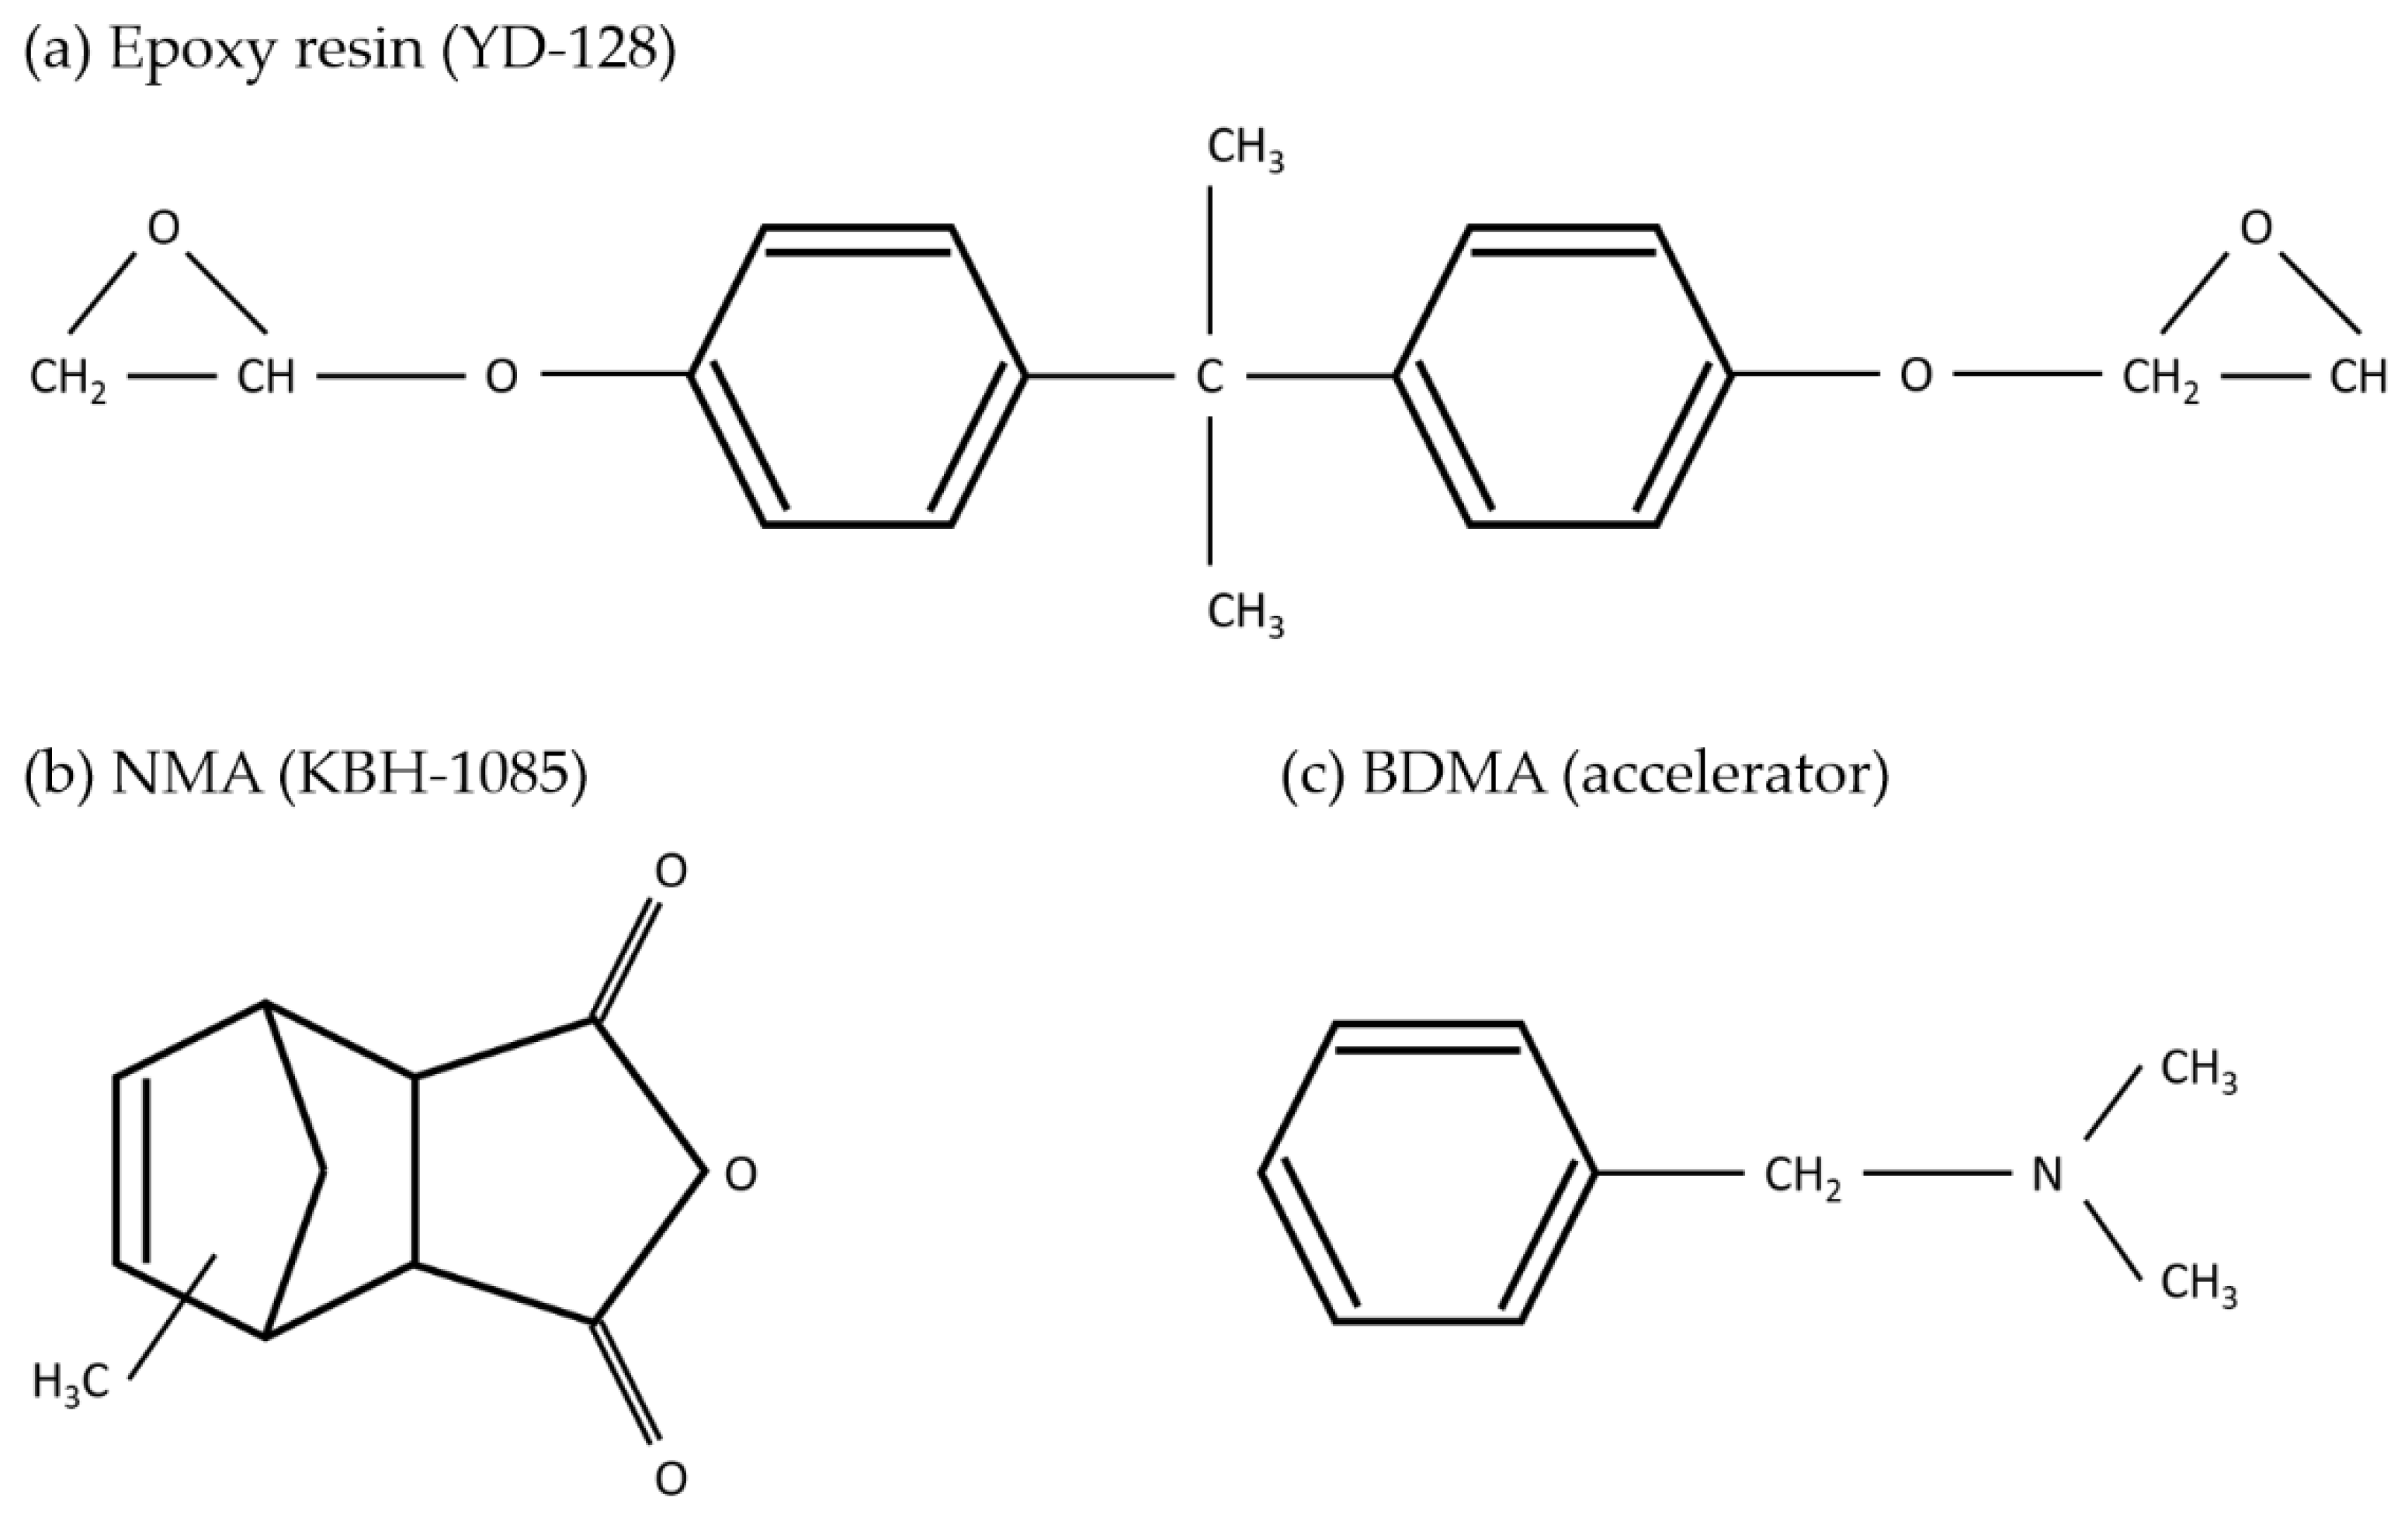
2.1. Materials
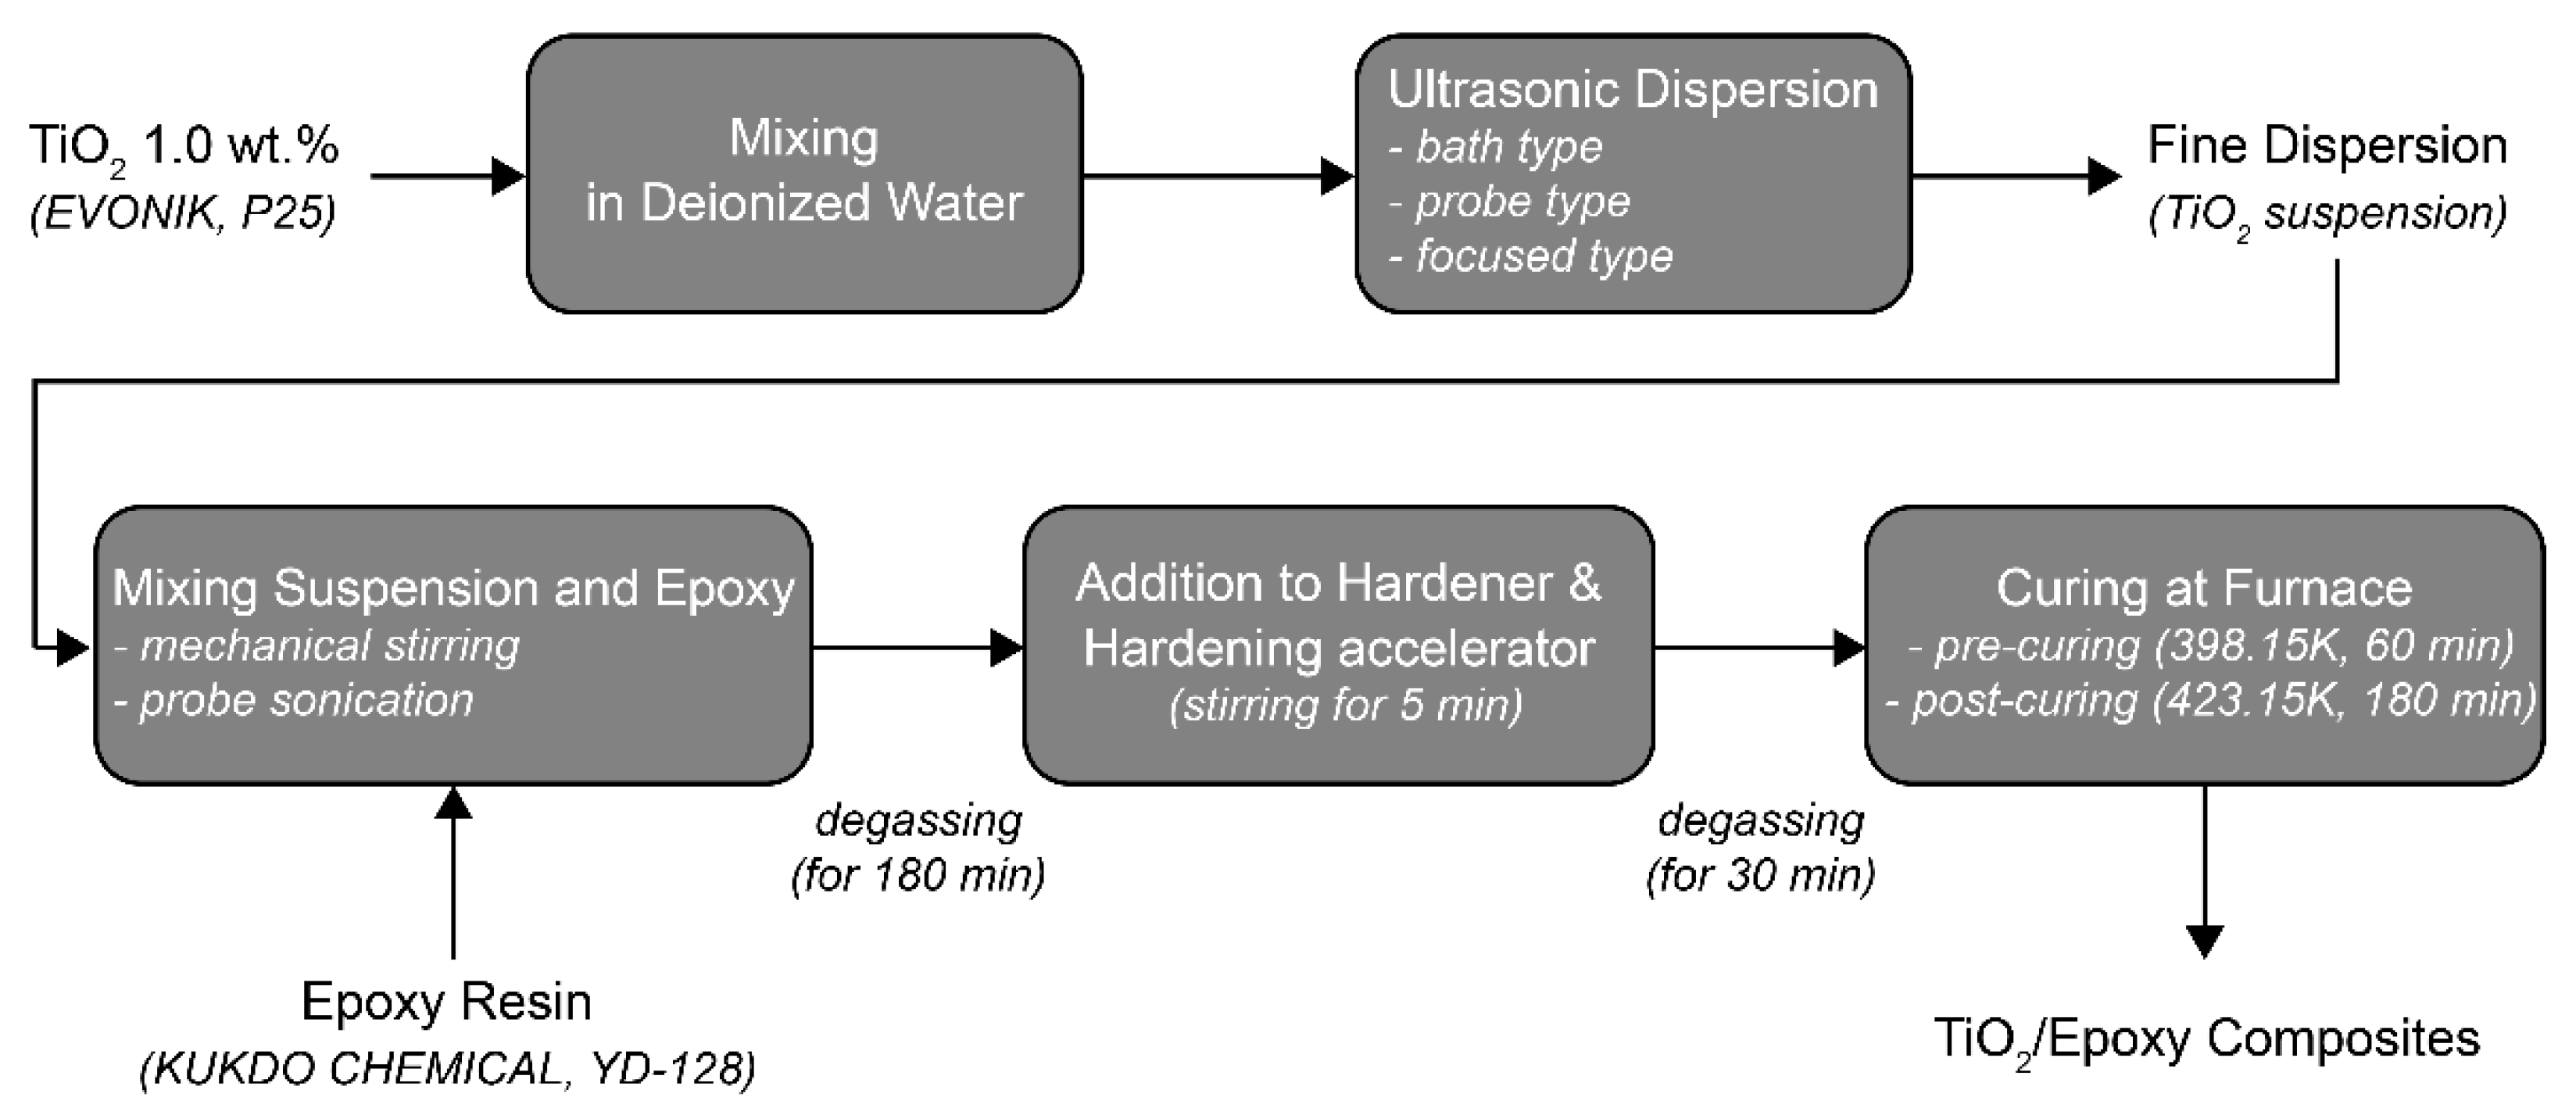
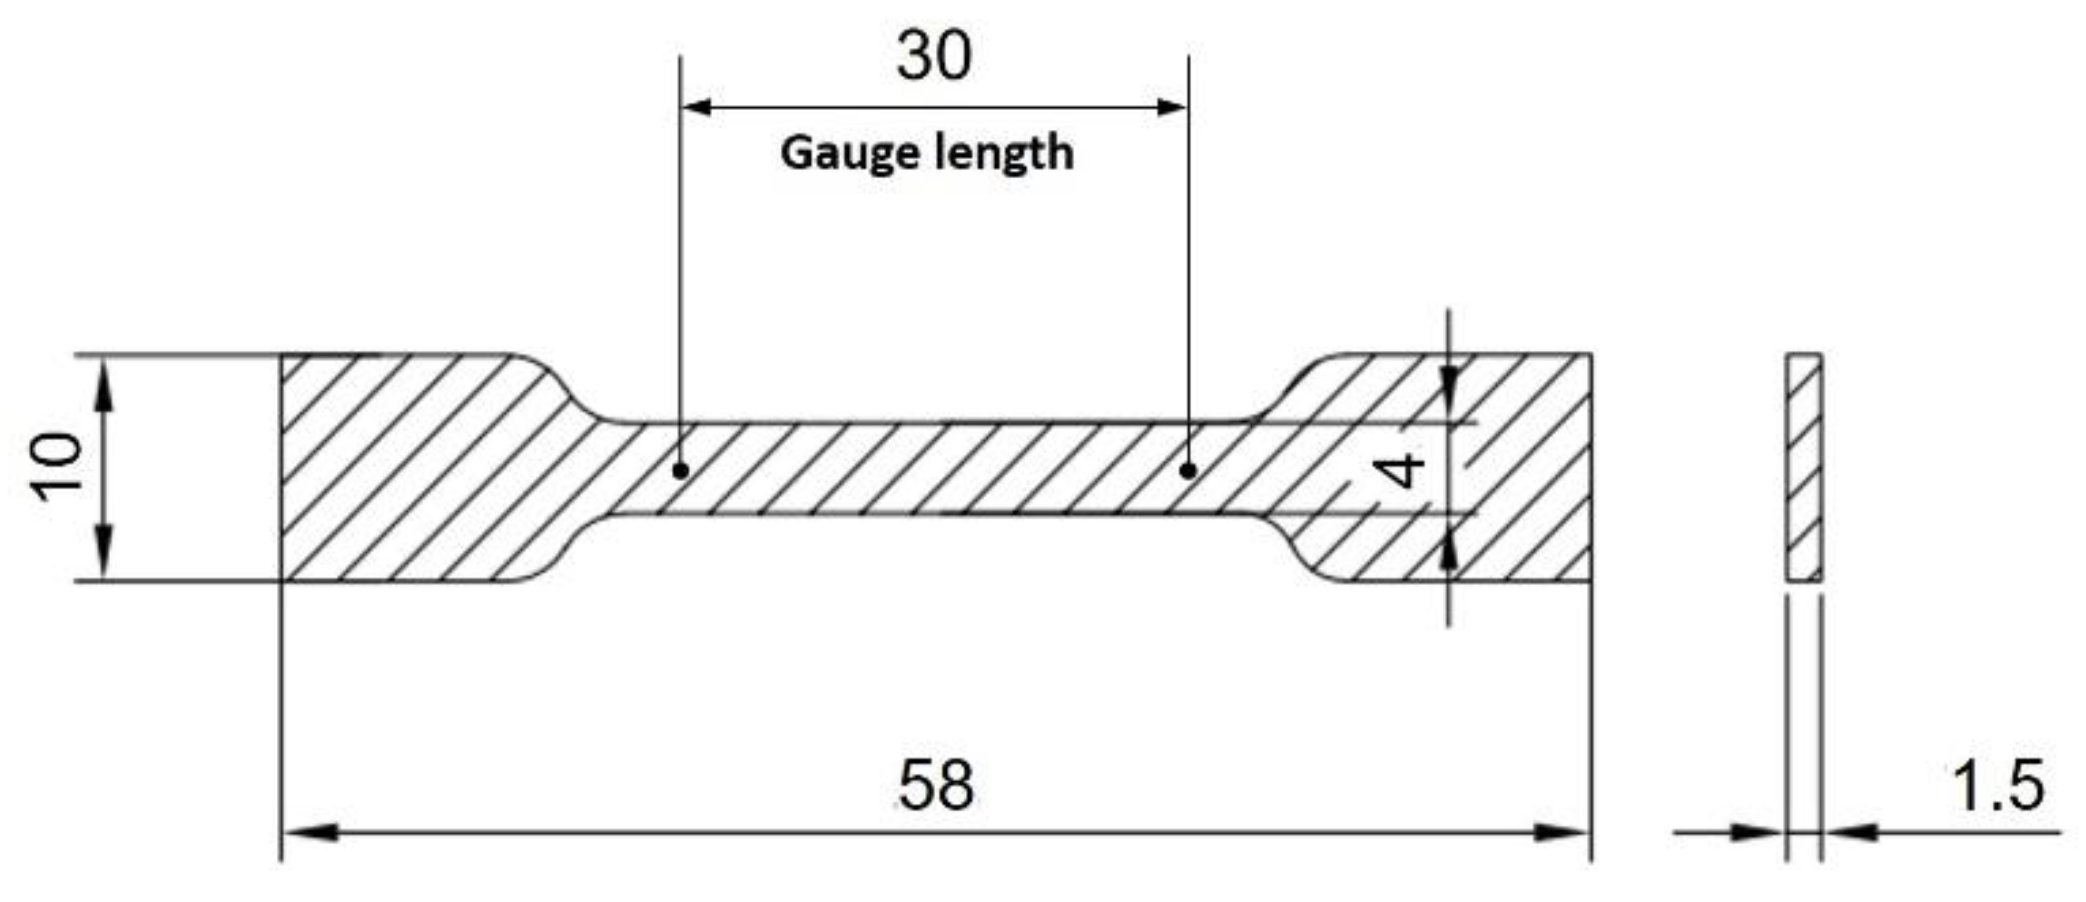
2.2. Sample Preparation
2.3. Characteristics of the Nanocomposites
3. Results and Discussion
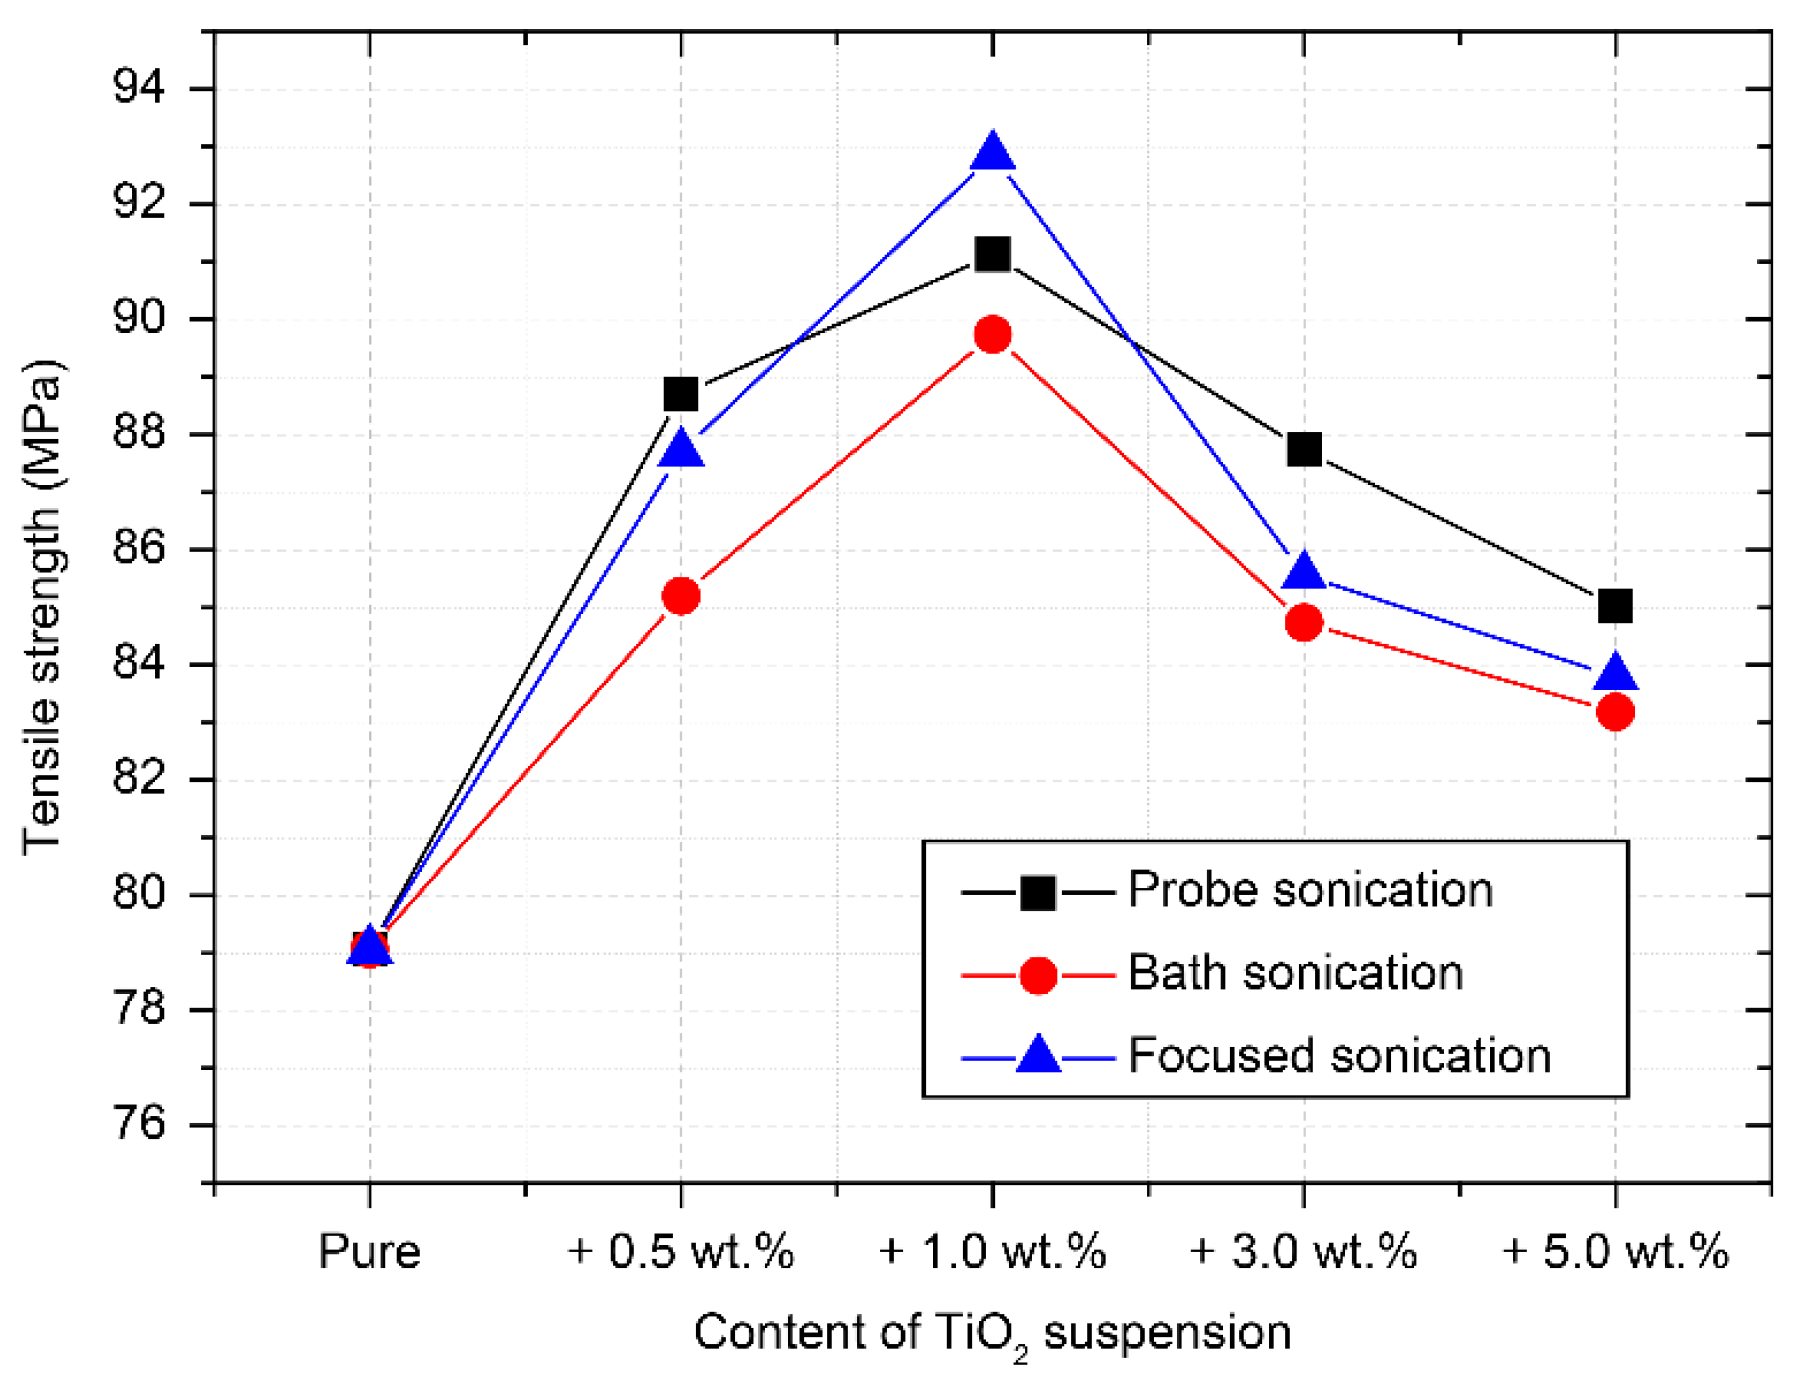
3.1. Mechanical Properties of Nanocomposites
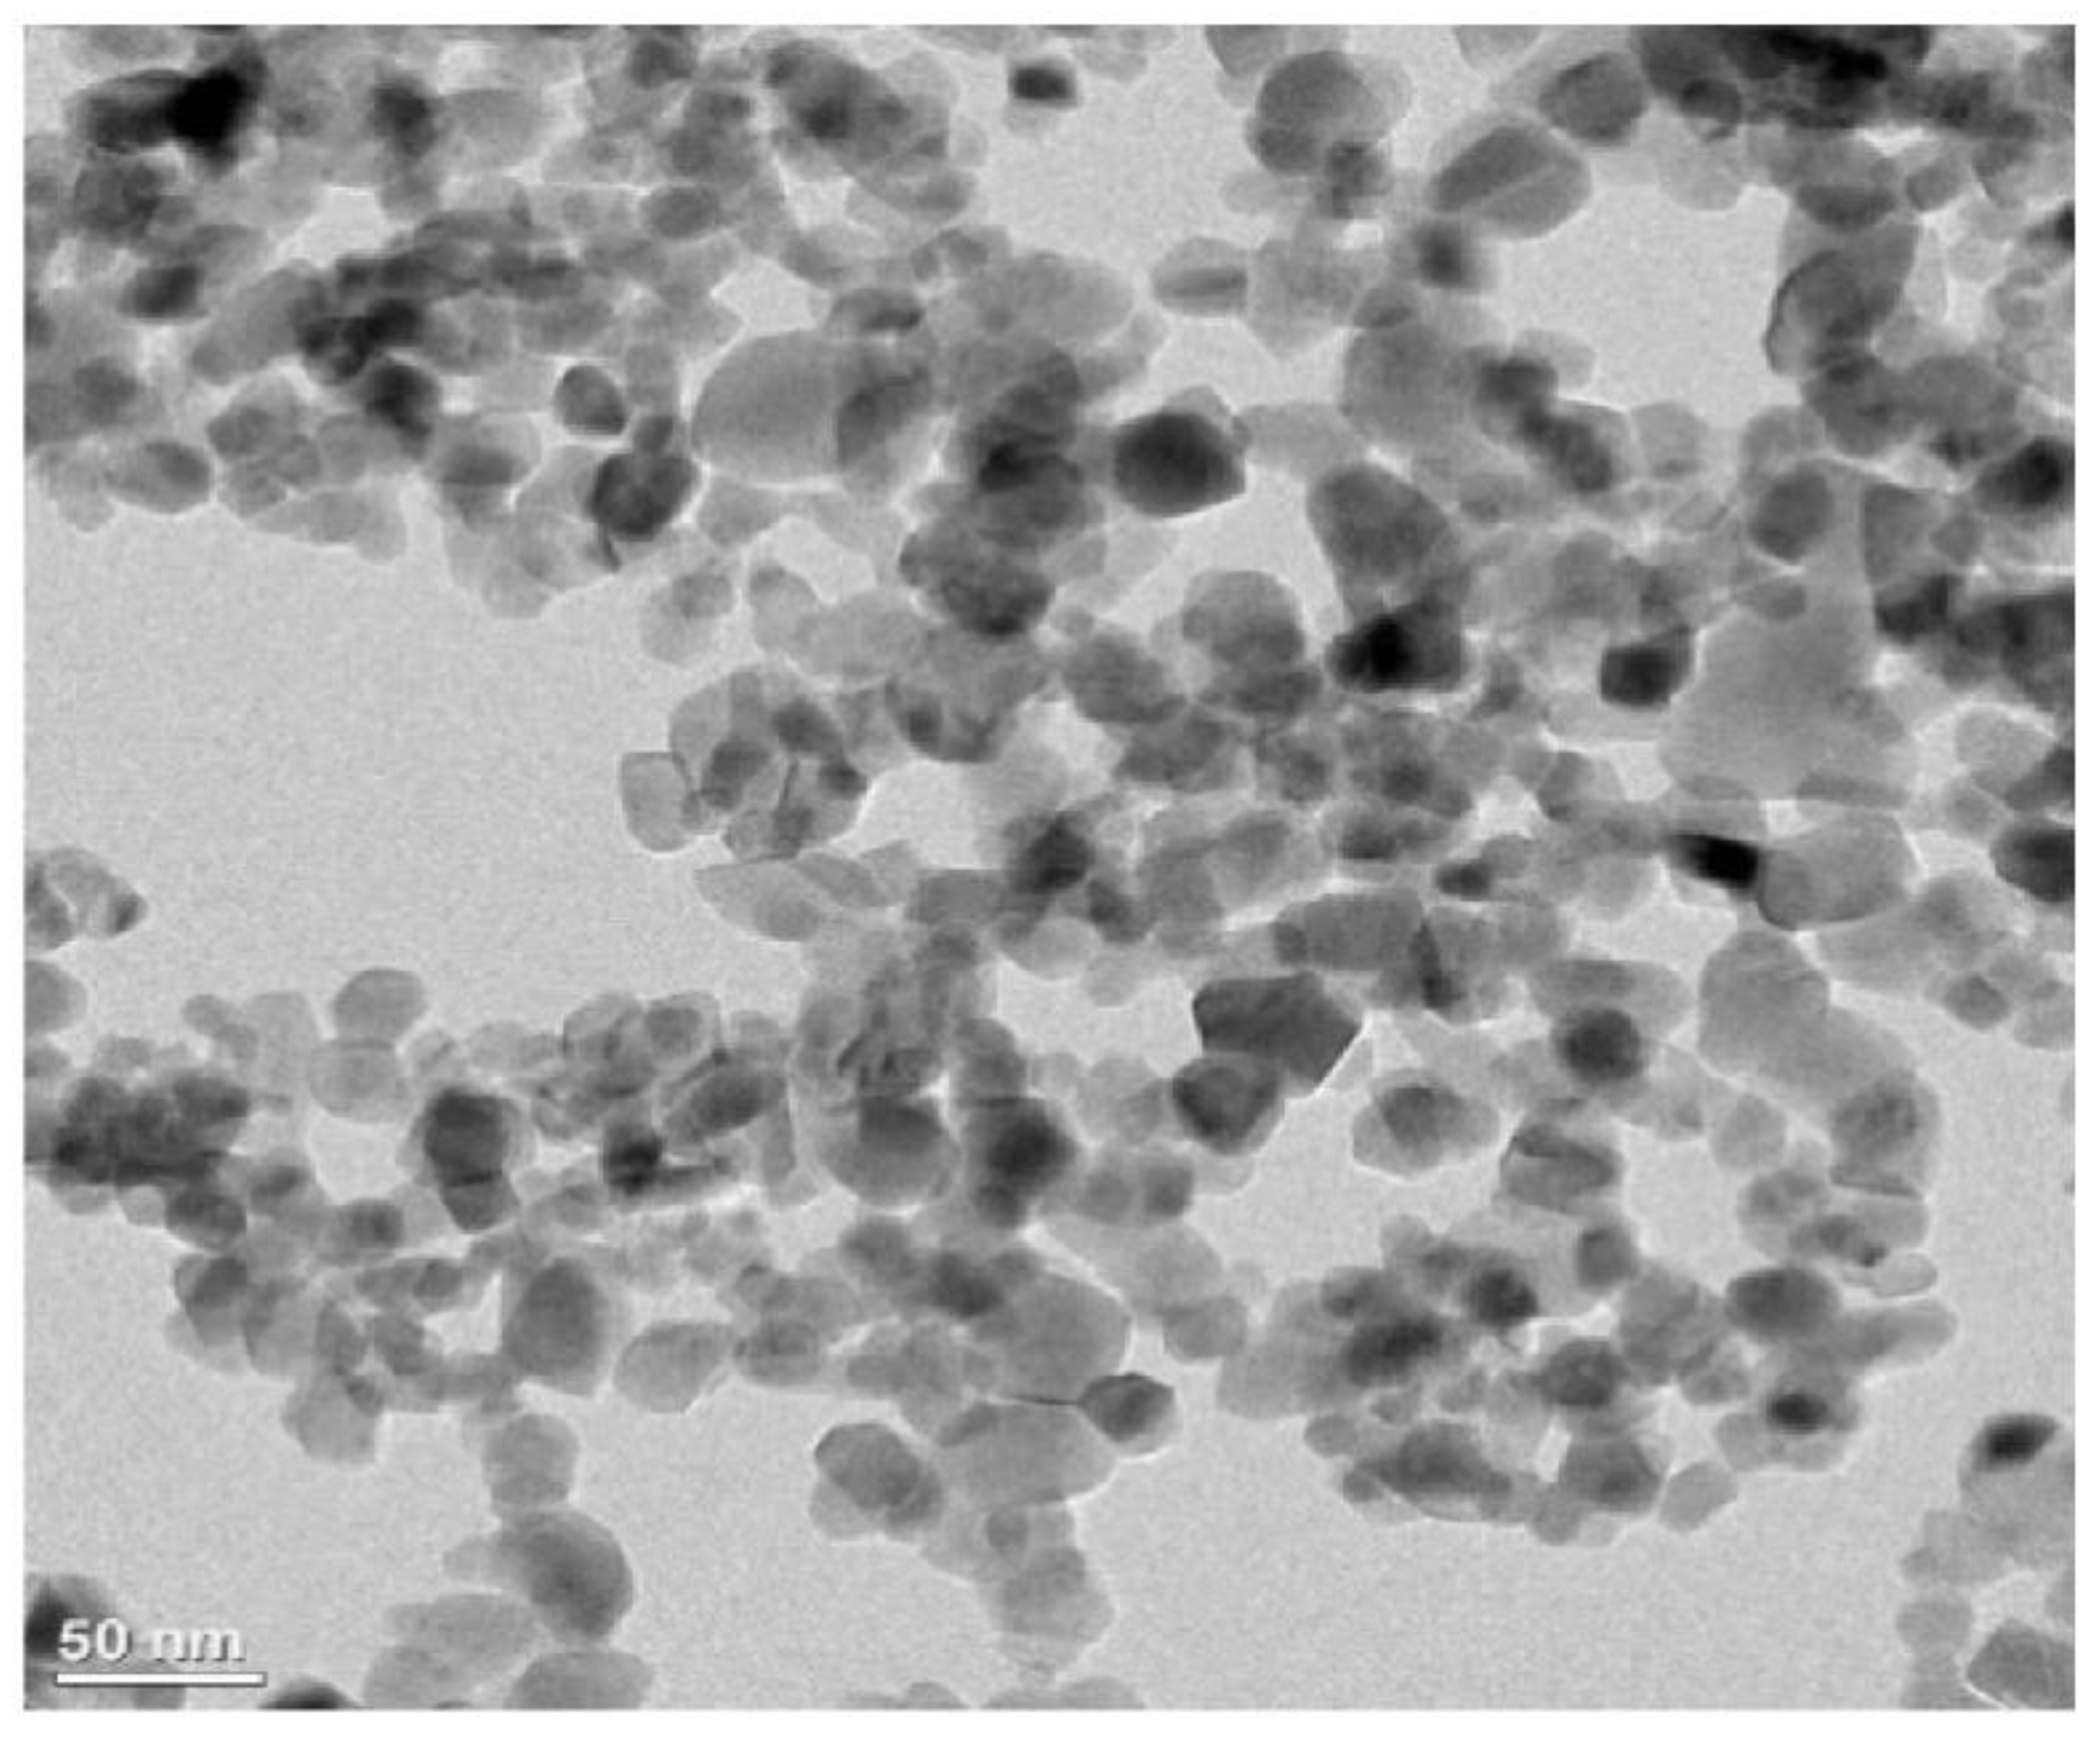
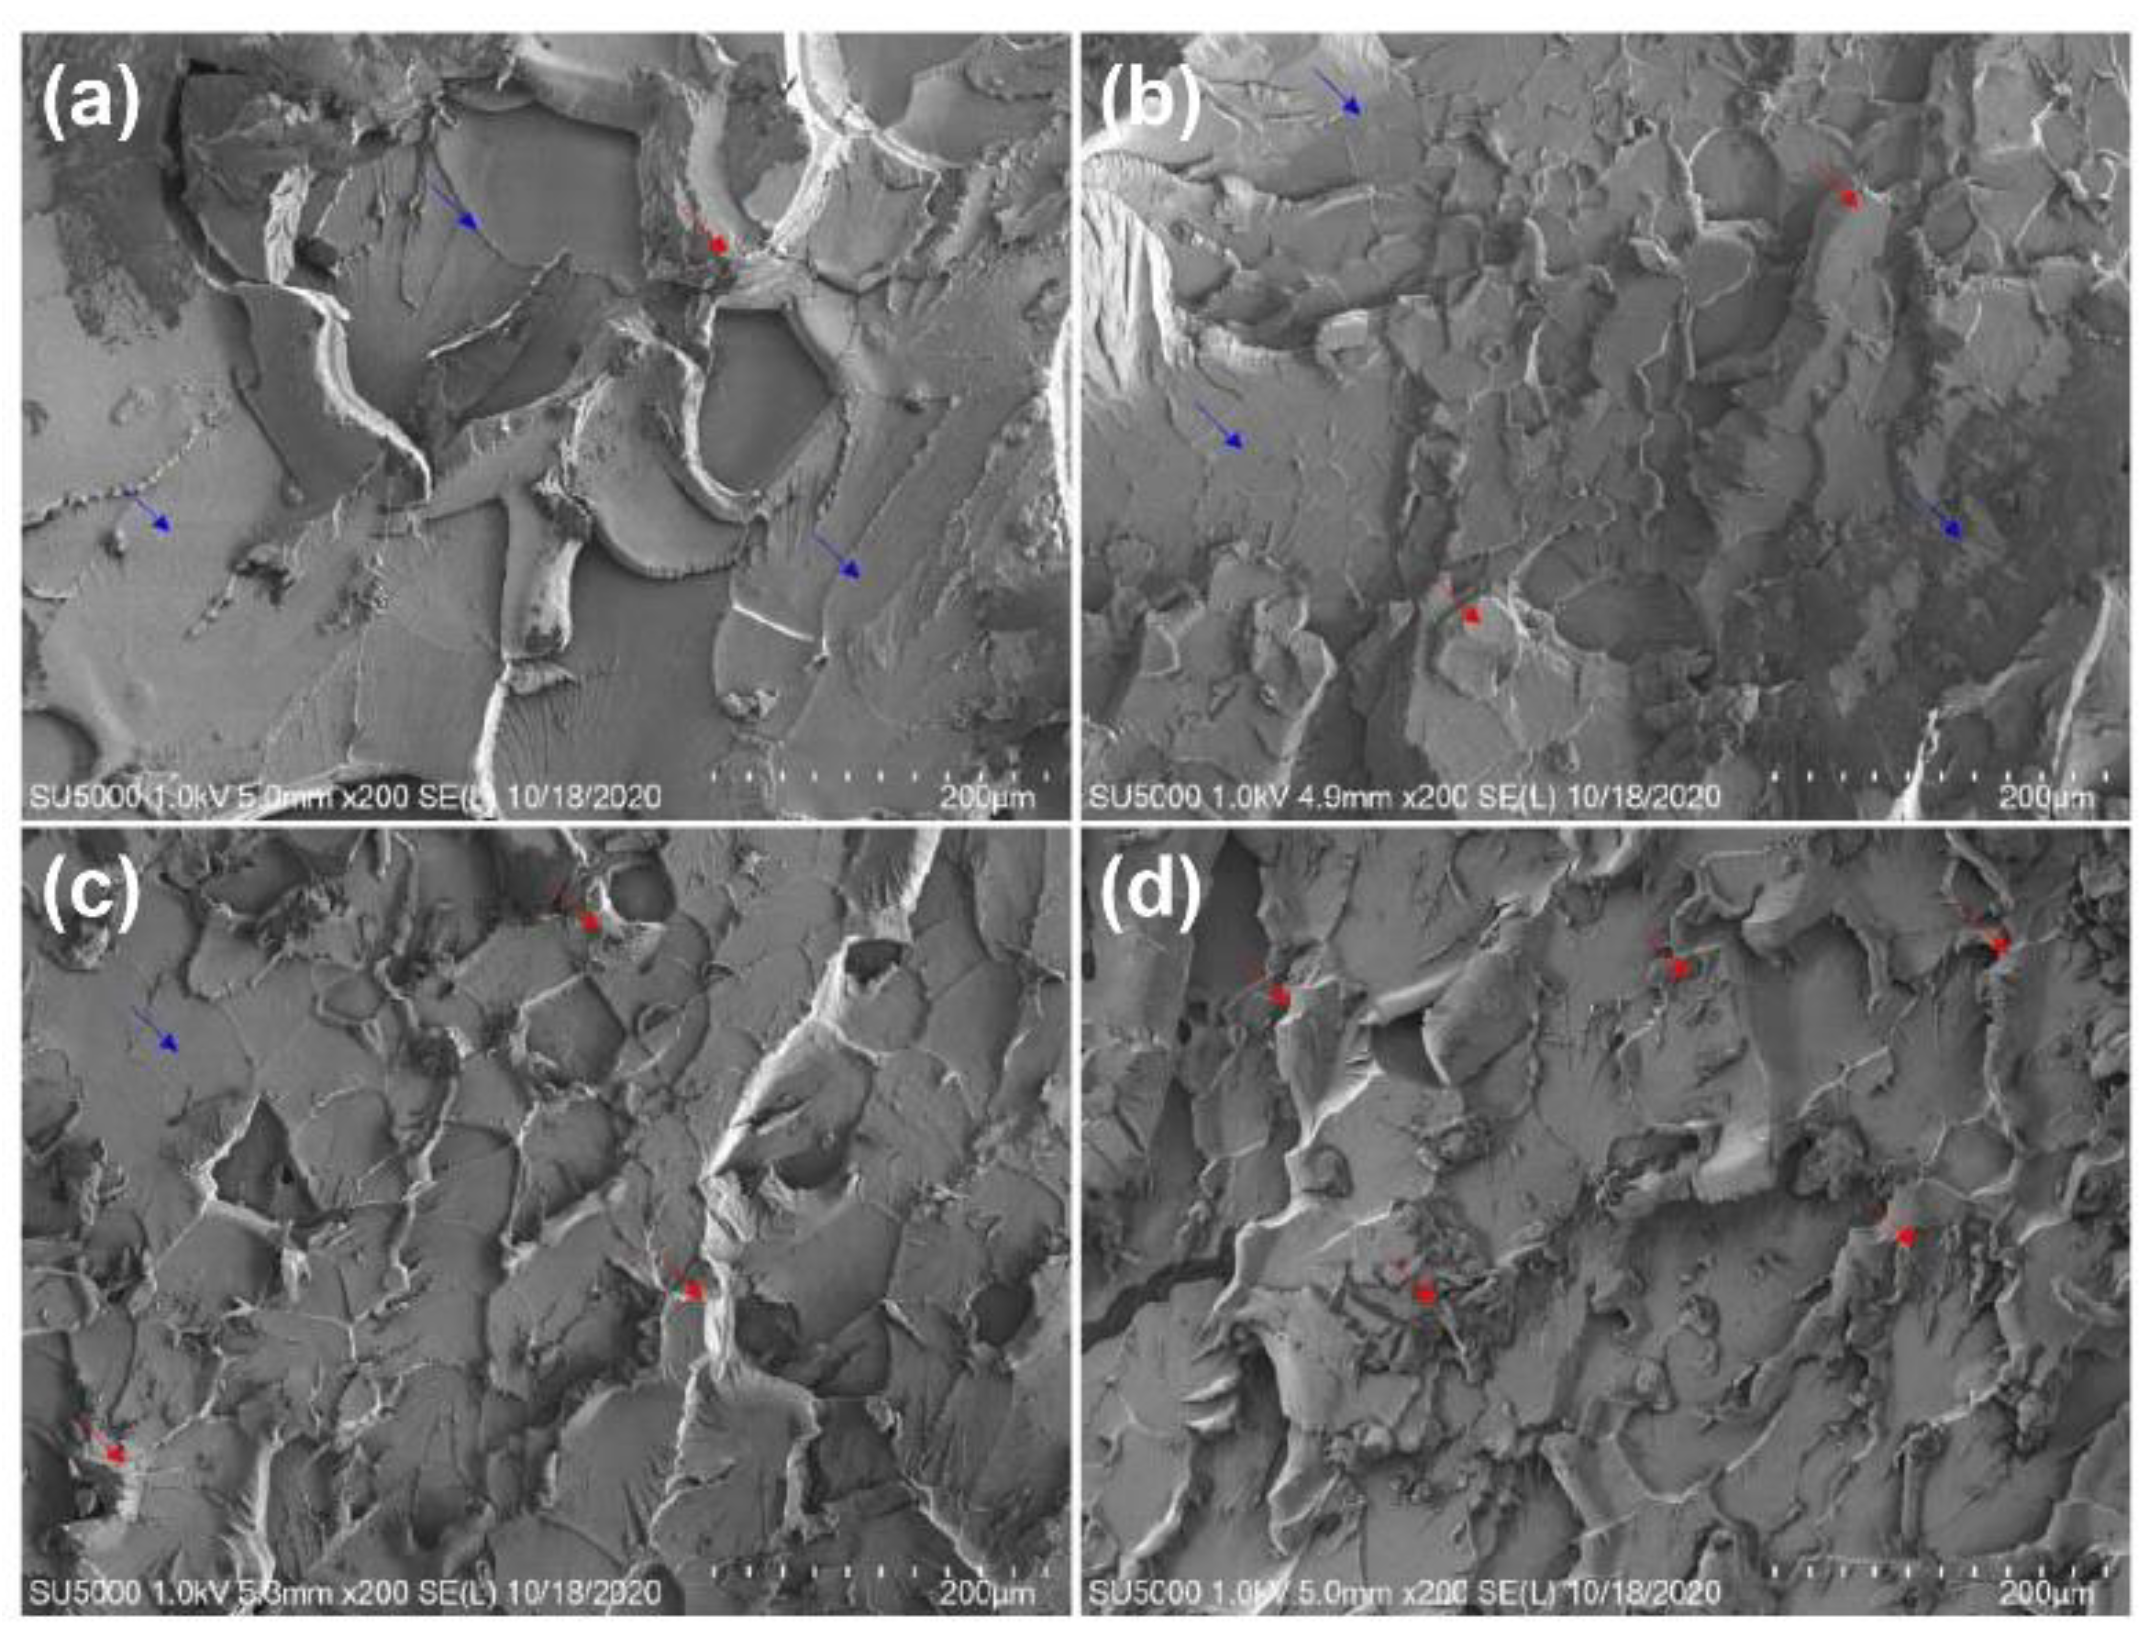
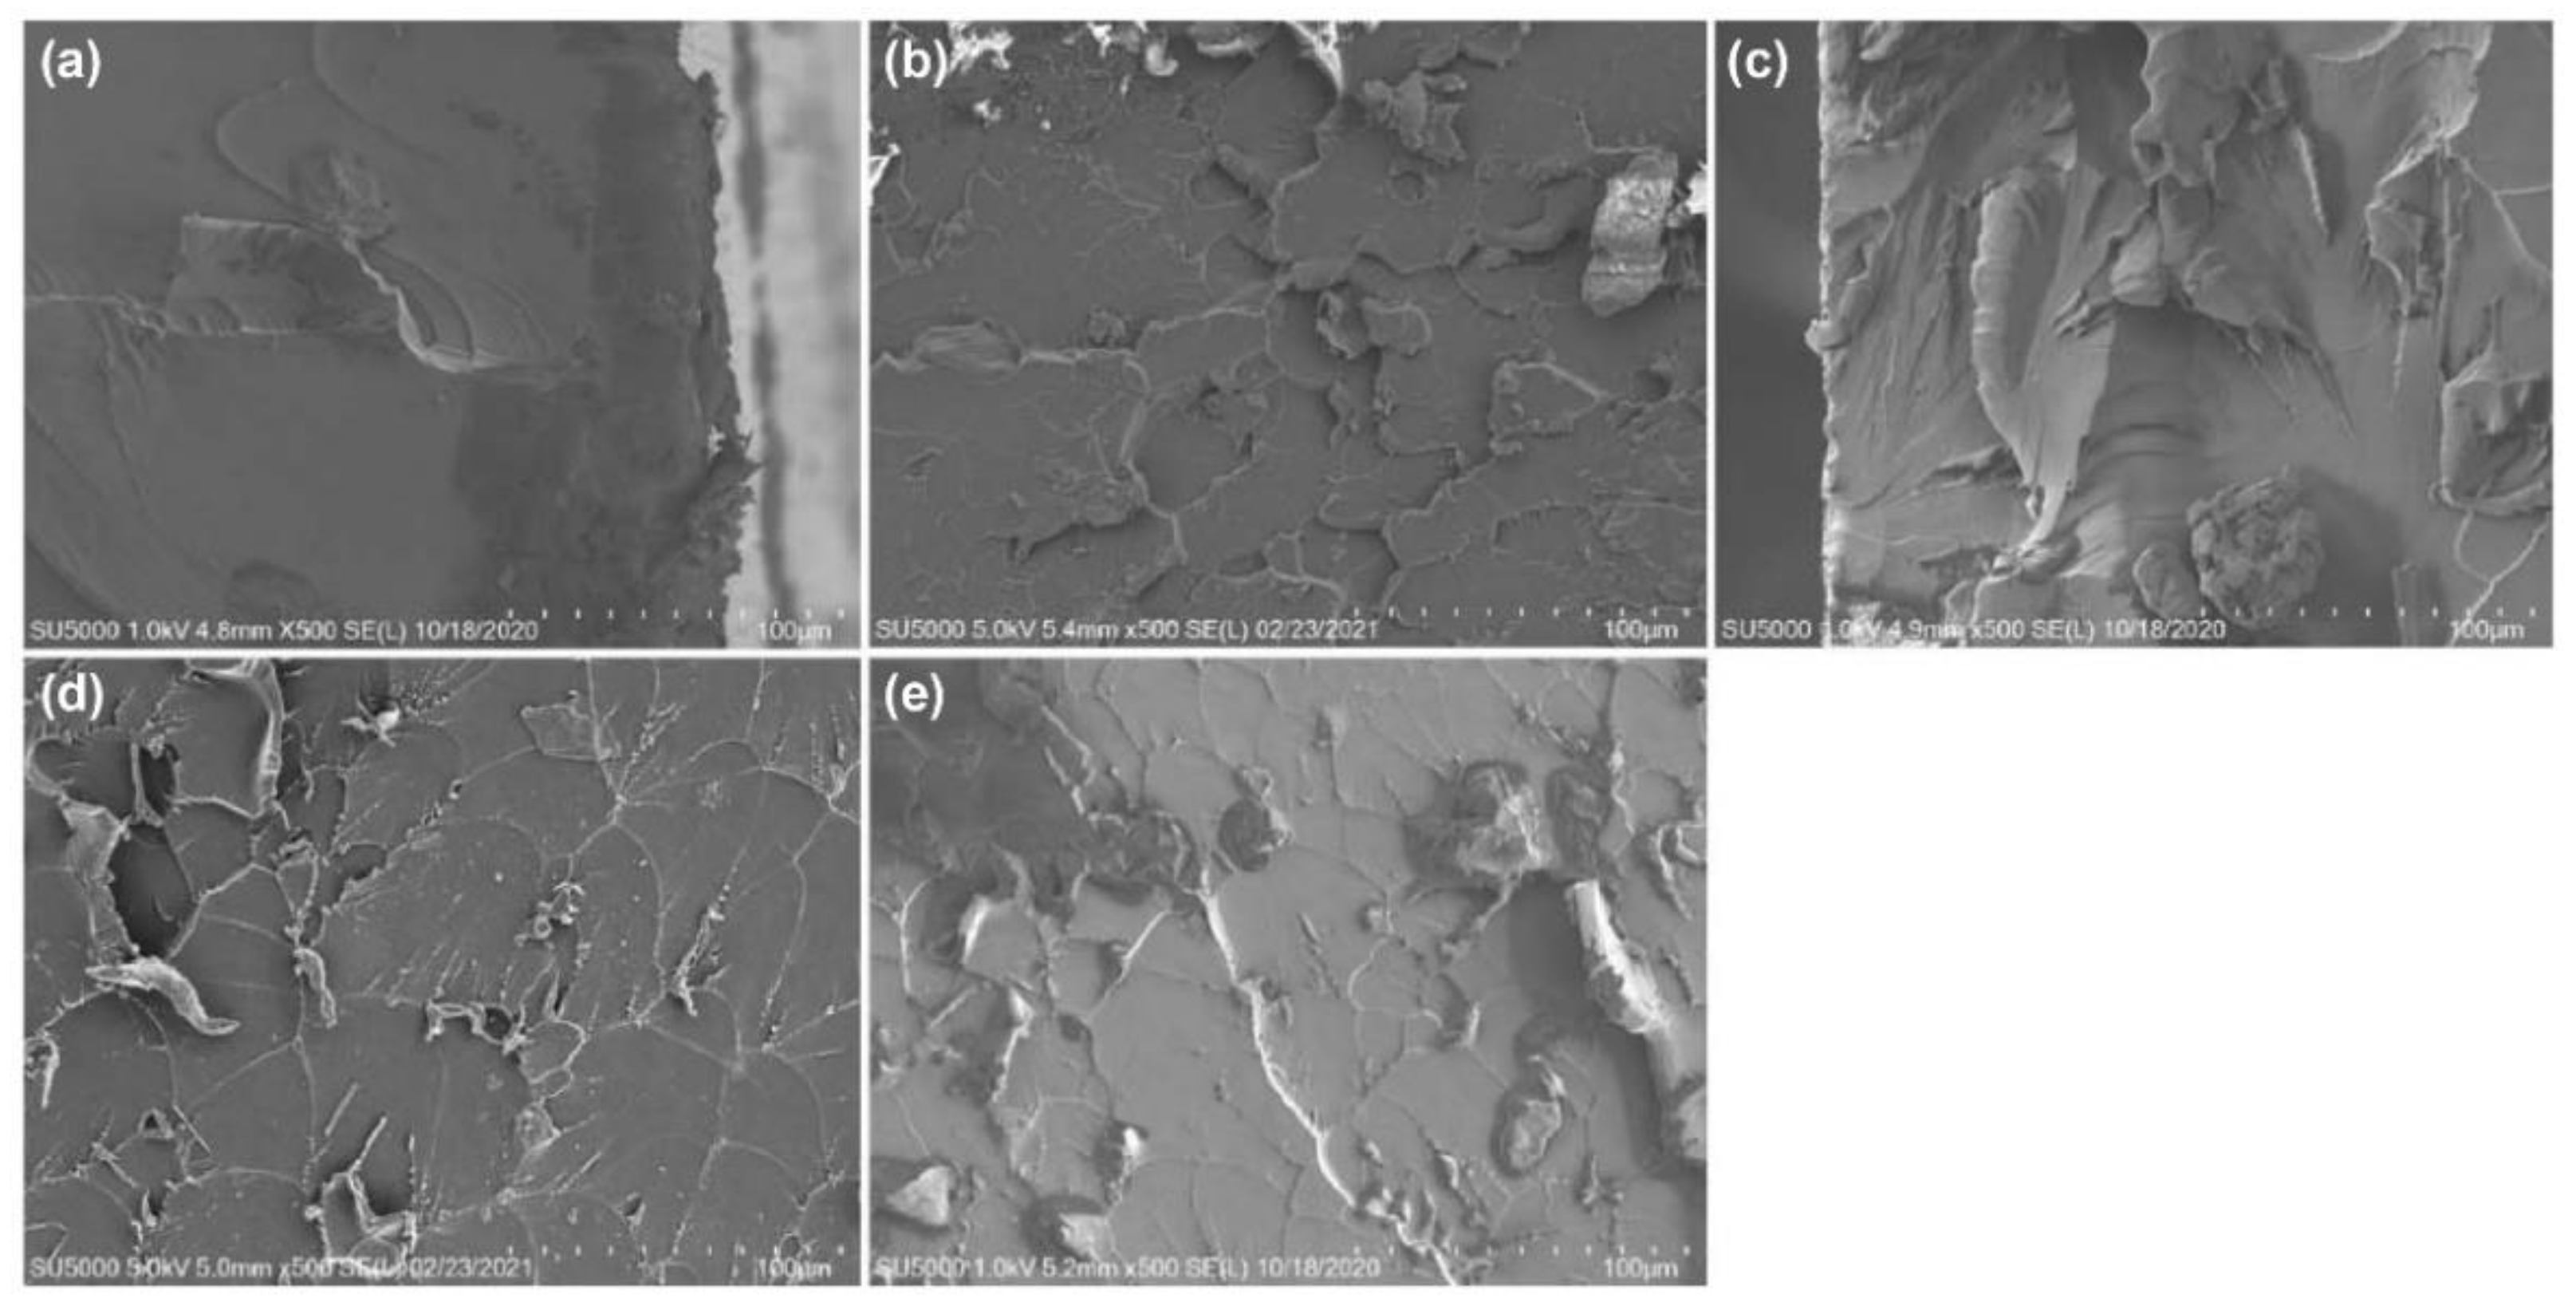
3.2. Microstructural and Morphological Analysis
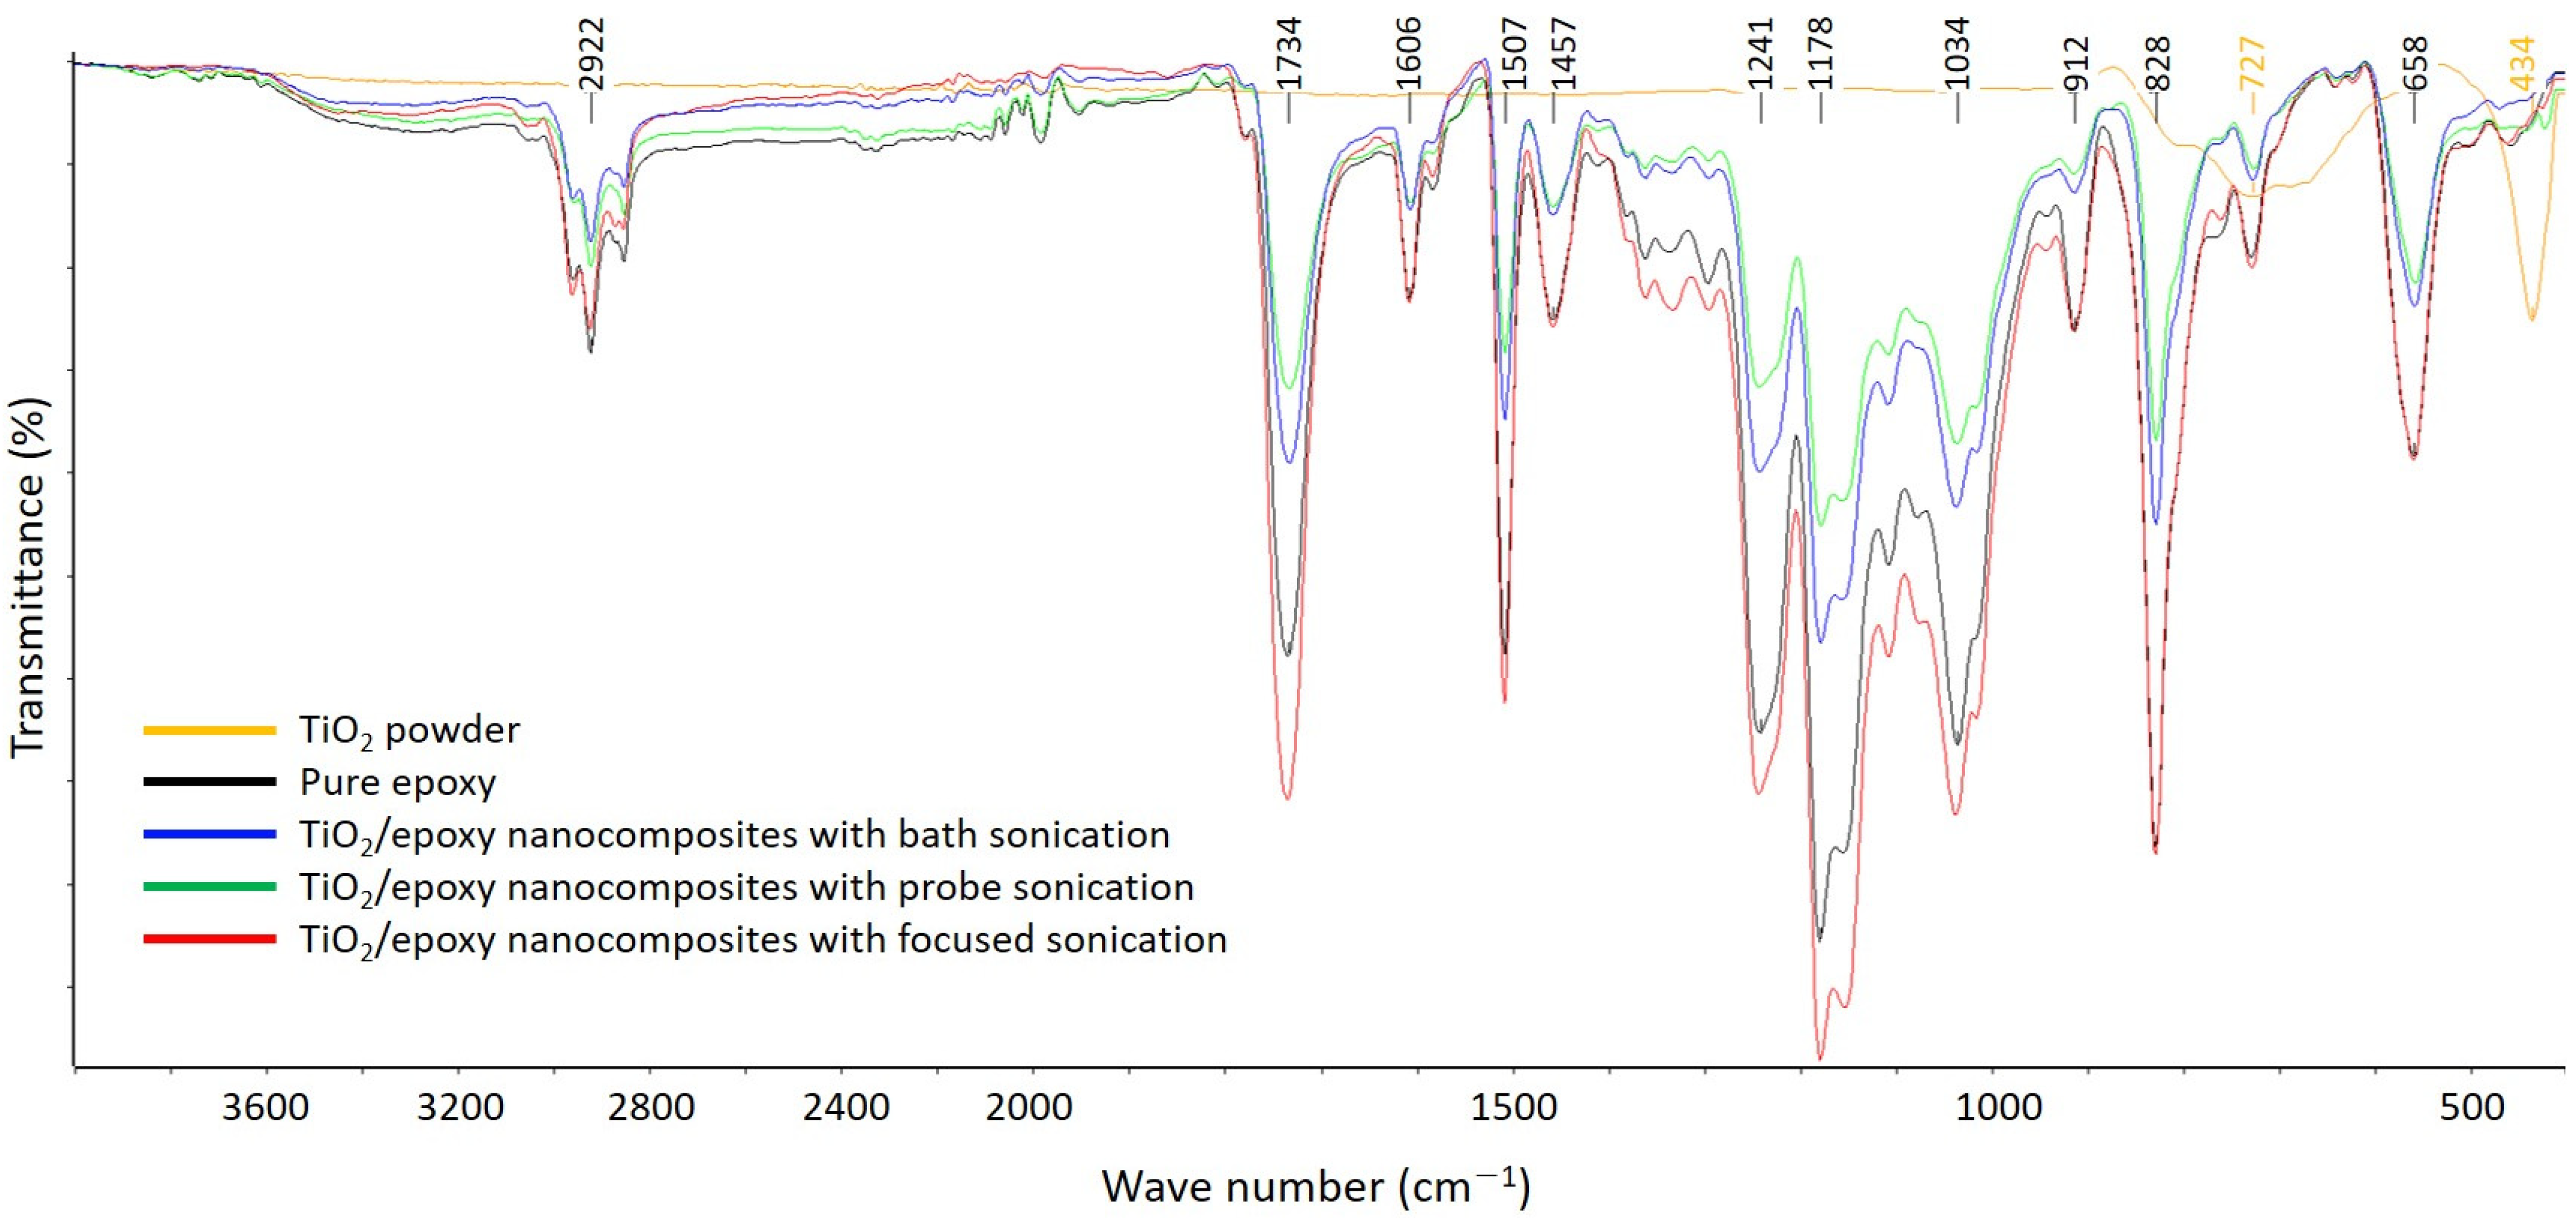
3.3. FT-IR Spectroscopy
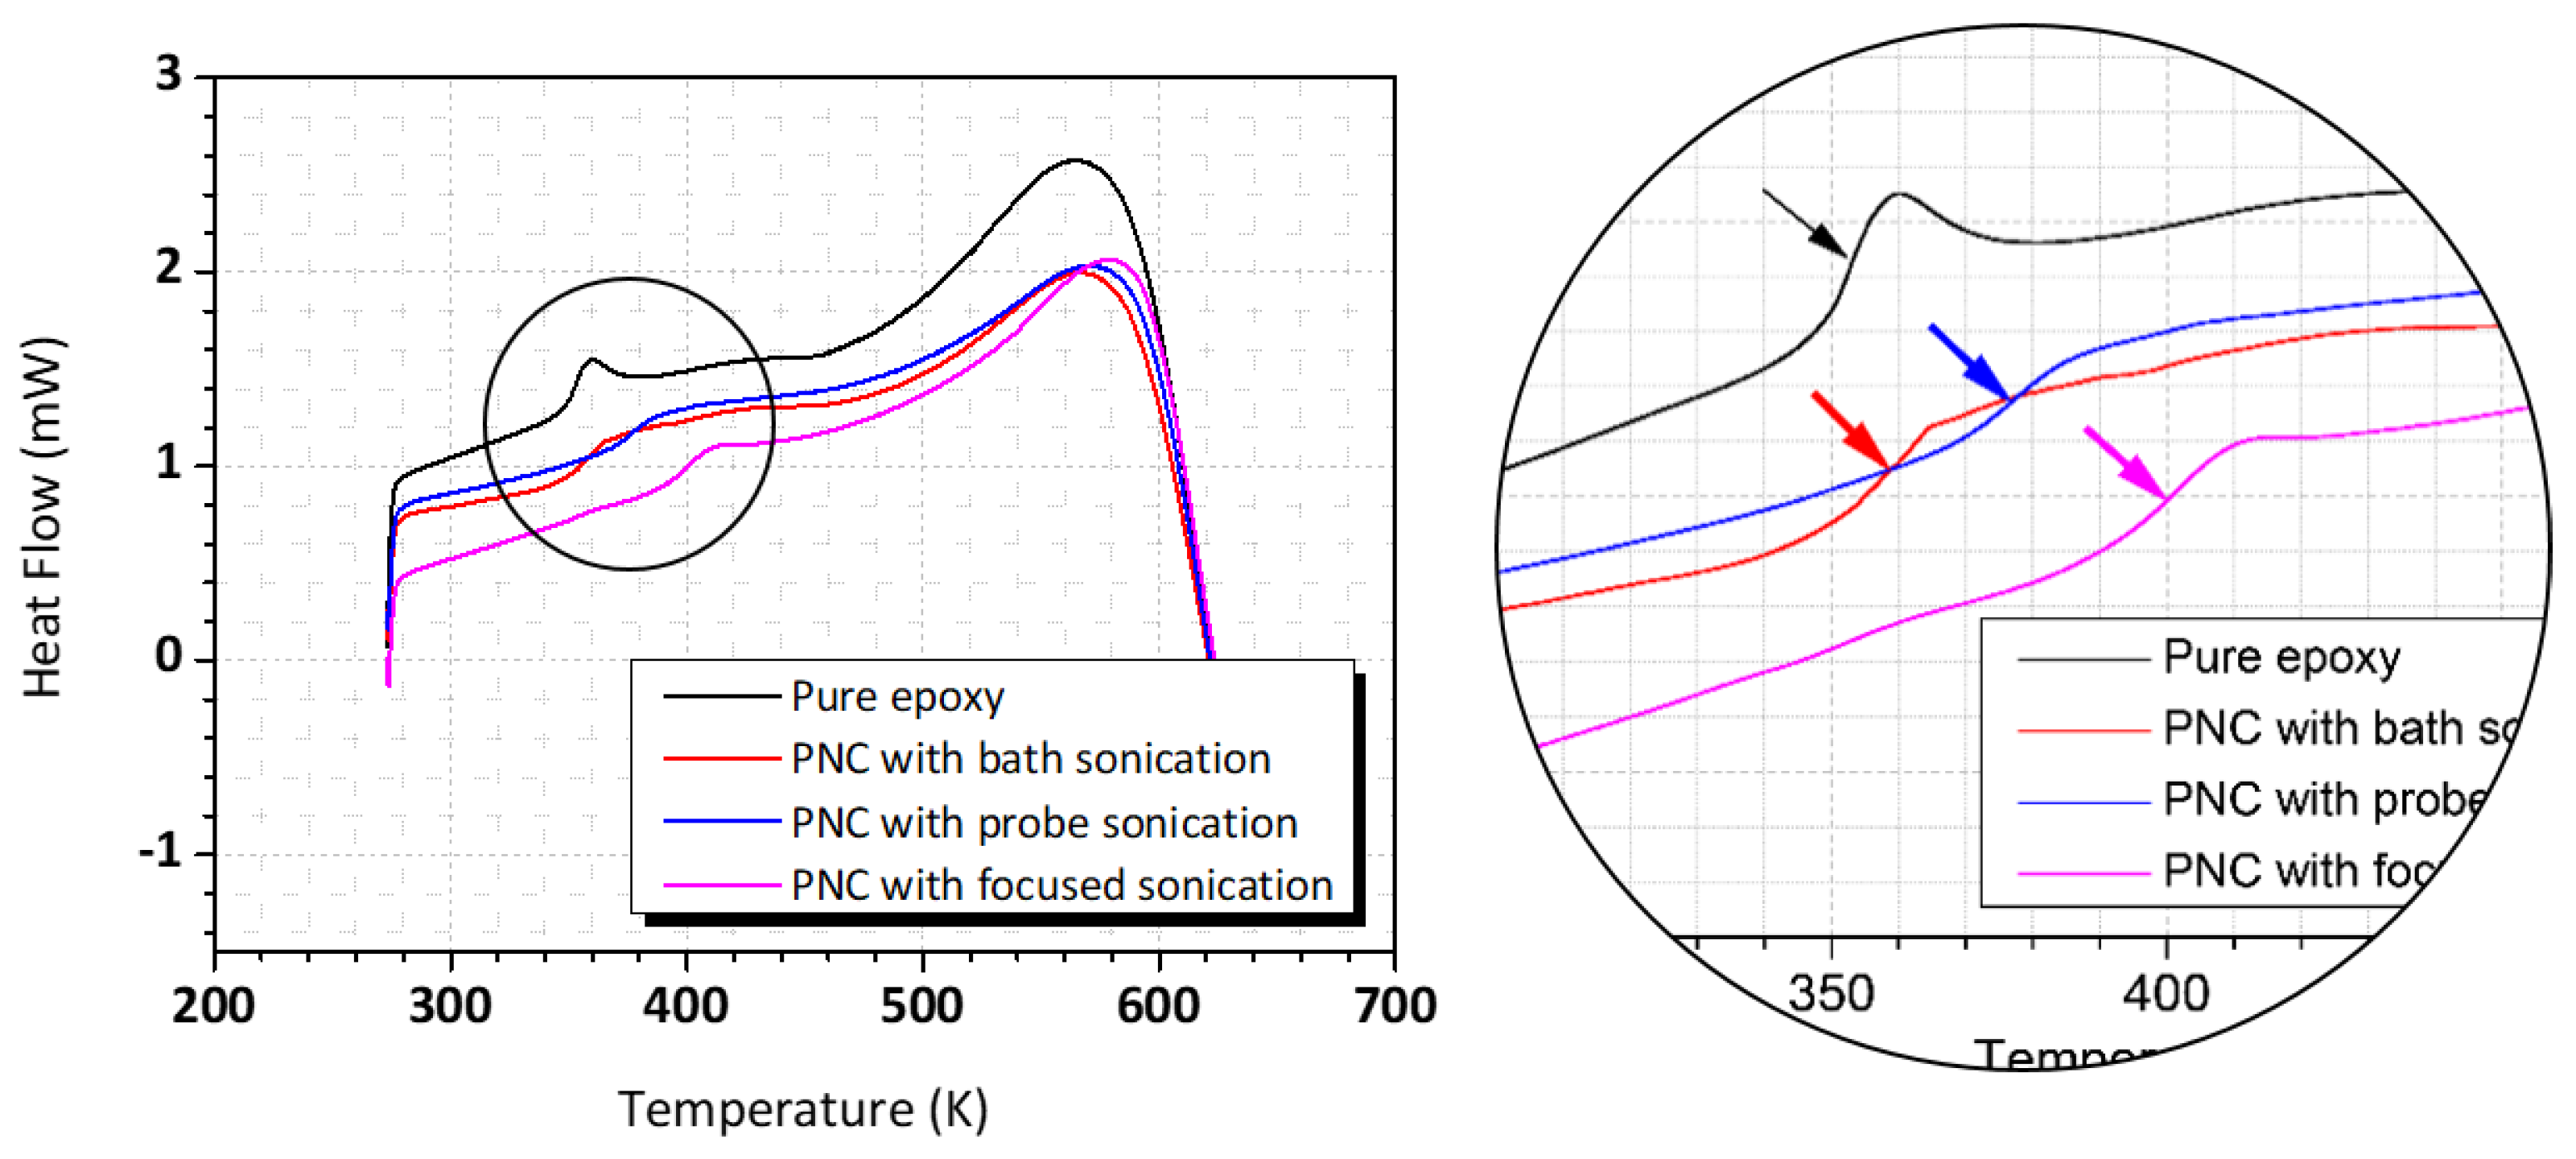
3.4. Thermal Property of Nanocomposites
4. Conclusions
- The tensile strength of the TiO2–epoxy NCs was improved compared to that of the pure EP. The highest tensile strength was observed when 1.0 wt.% of TiO2 suspension (mean particle size 100 nm or lower) dispersed by focused sonication was added. However, the tensile strength of more than 3.0 wt.% TiO2-reinforced epoxy NCs decreased regardless of particle size;
- The SEM analysis of the fracture surface indicated that the crack resistance of the TiO2–epoxy NCs was greater than that of the pure EP; this influences the tensile strength;
- The FT-IR spectra of the pure EP and TiO2–epoxy NCs were almost the same, which suggests that chemical bonding with TiO2 did not occur. The TiO2–epoxy NCs showed improved thermal properties compared to pure EP;
- The glass transition temperature of the TiO2-reinforced epoxy NCs with a particle size of 100 nm or less (dispersed by focused sonication) was the highest at 400 K; this implies that the performance improvement of the nanocomposite was affected by the size of the nanoparticles;
- Both the tensile strength and thermal properties improved when a suspension with a particle size of 100 nm or less was used; this was confirmed to be greatly influenced by the nanoparticle dispersion method.
Author Contributions
Funding
Data Availability Statement
Conflicts of Interest
References
- Ashrafi, M.; Hamadanian, M.; Ghasemi, A.R.; Kashi, F.J. Improvement mechanical and antibacterial properties of epoxy by polyethylene glycol and Ag/CuO nanoparticles. Polym. Compos. 2019, 40, 3393–3401. [Google Scholar] [CrossRef]
- Heng, Z.; Chen, Y.; Zou, H.; Liang, M. Simultaneously enhanced tensile strength and fracture toughness of epoxy resins by a poly (ethylene oxide)-block-carboxyl terminated butadiene-acrylonitrile rubber dilock copolymer. RSC Adv. 2015, 5, 42362–42368. [Google Scholar] [CrossRef]
- Flick, E.W. Epoxy Resins, Curing Agents, Compounds, and Modifiers: An Industrial Guide; William Andrew: Norwich, NY, USA, 2012. [Google Scholar]
- Shen, X.J.; Pei, X.Q.; Liu, Y.; Fu, S.Y. Tribological performance of carbon nanotube–graphene oxide hybrid/epoxy composites. Compos. Part B Eng. 2014, 57, 120–125. [Google Scholar] [CrossRef]
- Jiang, T.; Kuila, T.; Kim, N.H.; Ku, B.C.; Lee, J.H. Enhanced mechanical properties of silanized silica nanoparticle attached graphene oxide/epoxy composites. Compos. Sci. Technol. 2013, 79, 115–125. [Google Scholar] [CrossRef]
- Deng, S.H.; Zhou, X.D.; Zhu, M.Q.; Fan, C.J.; Lin, Q.F. Interfacial toughening and consequent improvement in fracture toughness of carbon fiber reinforced epoxy resin composites: Induced by diblock copolymers. Exp. Polym. Lett. 2013, 7, 925–935. [Google Scholar] [CrossRef]
- Rajangam, K.; Amuthameena, S.; Thangavel, S.; Sanjanadevi, V.S.; Balraj, B. Synthesis and characterisation of Ag incorporated TiO2 nanomaterials for supercapacitor applications. J. Mol. Struct. 2020, 1219, 128661. [Google Scholar] [CrossRef]
- Green, K.J.; Dean, D.R.; Vaidya, U.K.; Nyairo, E. Multiscale fiber reinforced composites based on a carbon nanofiber/epoxy nanophased polymer matrix: Synthesis, mechanical, and thermomechanical behavior. Compos. Part A Appl. Sci. Manuf. 2009, 40, 1470–1475. [Google Scholar] [CrossRef]
- Pinto, D.; Bernardo, L.; Amaro, A.; Lopes, S. Mechanical properties of epoxy nanocomposites using titanium dioxide as reinforcement–a review. Const Build. Mater. 2015, 95, 506–524. [Google Scholar] [CrossRef]
- Chatterjee, A.; Islam, M.S. Fabrication and characterization of TiO2–epoxy nanocomposite. Mater. Sci. Eng. A 2008, 487, 574–585. [Google Scholar] [CrossRef]
- Raja, A.; Rajasekaran, P.; Selvakumar, K.; Raman, R.G.; Swaminathan, M. Visible active TiO2-CdS-rGO ternary nanocomposite for enhanced photodecomposition of methylene blue. Mater. Today Proc. 2020, 29, 1125–1128. [Google Scholar] [CrossRef]
- Bayan, E.M.; Lupeiko, T.G.; Pustovaya, L.E.; Volkova, M.G.; Butova, V.V.; Guda, A.A. Zn–F co-doped TiO2 nanomaterials: Synthesis, structure and photocatalytic activity. J. Alloy Compd. 2020, 822, 153662. [Google Scholar] [CrossRef]
- Takari, A.; Ghasemi, A.R.; Hamadanian, M.; Sarafrazi, M.; Najafidoust, A. Molecular dynamics simulation and thermo-mechanical characterization for optimization of three-phase epoxy/TiO2/SiO2 nano-composites. Polym. Test. 2021, 93, 106890. [Google Scholar] [CrossRef]
- Kumar, K.; Ghosh, P.K.; Kumar, A. Improving mechanical and thermal properties of TiO2-epoxy nanocomposite. Compos. Part B Eng. 2016, 97, 353–360. [Google Scholar] [CrossRef]
- Barczewski, M.; Sałasińska, K.; Szulc, J. Application of sunflower husk, hazelnut shell and walnut shell as waste agricultural fillers for epoxy-based composites: A study into mechanical behavior related to structural and rheological properties. Polym. Test. 2019, 75, 1–11. [Google Scholar] [CrossRef]
- Alian, A.R.; Kundalwal, S.I.; Meguid, S.A. Multiscale modeling of carbon nanotube epoxy composites. Polymer 2015, 70, 149–160. [Google Scholar] [CrossRef]
- Abdalla, M.; Dean, D.; Robinson, P.; Nyairo, E. Cure behavior of epoxy/MWCNT nanocomposites: The effect of nanotube surface modification. Polymer 2008, 49, 3310–3317. [Google Scholar] [CrossRef]
- Kumar, A.; Kumar, K.; Ghosh, P.K.; Yadav, K.L. MWCNT/TiO2 hybrid nano filler toward high-performance epoxy composite. Ultrason. Sonochem. 2018, 41, 37–46. [Google Scholar] [CrossRef]
- Kumar, A.; Ghosh, P.K.; Yadav, K.L.; Kumar, K. Thermo-mechanical and anti-corrosive properties of MWCNT/epoxy nanocomposite fabricated by innovative dispersion technique. Compos. Part B Eng. 2017, 113, 291–299. [Google Scholar] [CrossRef]
- Mallakpour, S.; Abdolmaleki, A.; Azimi, F. Ultrasonic-assisted biosurface modification of multi-walled carbon nanotubes with Thiamine and its influence on the properties of PVC/Tm-MWCNTs nanocomposite films. Ultrason. Sonochem. 2017, 39, 589–596. [Google Scholar] [CrossRef]
- Kudo, T.; Sekiguchi, K.; Sankoda, K.; Namiki, N.; Nii, S. Effect of ultrasonic frequency on size distributions of nanosized mist generated by ultrasonic atomization. Ultrason. Sonochem. 2017, 37, 16–22. [Google Scholar] [CrossRef]
- Maktedar, S.S.; Mehetre, S.S.; Avashthi, G.; Singh, M. In situ sonochemical reduction and direct functionalization of graphene oxide: A robust approach with thermal and biomedical applications. Ultrason. Sonochem. 2017, 34, 67–77. [Google Scholar] [CrossRef] [PubMed]
- Mallakpour, S. Ultrasonic-assisted fabrication of starch/MWCNT-glucose nanocomposites for drug delivery. Ultrason. Sonochem. 2018, 40, 402–409. [Google Scholar] [CrossRef]
- Mallakpour, S.; Rashidimoghadam, S. Application of ultrasonic irradiation as a benign method for production of glycerol plasticized-starch/ascorbic acid functionalized MWCNTs nanocomposites: Investigation of methylene blue adsorption and electrical properties. Ultrason. Sonochem. 2018, 40, 419–432. [Google Scholar] [CrossRef]
- Dong, Z.; Delacour, C.; Mc Carogher, K.; Udepurkar, A.P.; Kuhn, S. Continuous ultrasonic reactors: Design, mechanism and application. Materials 2020, 13, 344. [Google Scholar] [CrossRef] [PubMed]
- Trujillo, F.J.; Juliano, P.; Barbosa-Cánovas, G.; Knoerzer, K. Separation of suspensions and emulsions via ultrasonic standing waves–A review. Ultrason. Sonochem. 2014, 21, 2151–2164. [Google Scholar] [CrossRef]
- Shields IV, C.W.; Reyes, C.D.; López, G.P. Microfluidic cell sorting: A review of the advances in the separation of cells from debulking to rare cell isolation. Lab Chip 2015, 15, 1230–1249. [Google Scholar] [CrossRef] [PubMed]
- Evander, M.; Nilsson, J. Acoustofluidics 20: Applications in acoustic trapping. Lab. Chip 2012, 12, 4667–4676. [Google Scholar] [CrossRef]
- Gelin, P.; Van Lindt, J.; Bratek-Skicki, A.; Stroobants, S.; Krzek, M.; Ziemecka, I.; Tompa, P.; De Malsche, W.; Maes, D. Focusing of microcrystals and liquid condensates in acoustofluidics. Crystals 2019, 9, 120. [Google Scholar] [CrossRef]
- Muthoosamy, K.; Manickam, S. State of the art and recent advances in the ultrasound-assisted synthesis, exfoliation and functionalization of graphene derivatives. Ultrason. Sonochem. 2017, 39, 478–493. [Google Scholar] [CrossRef] [PubMed]
- Ghosh, P.K.; Patel, A.; Kumar, K. Adhesive joining of copper using nano-filler composite adhesive. Polymer 2016, 87, 159–169. [Google Scholar] [CrossRef]
- Hwangbo, S.; Kwak, M.; Kim, J.; Lee, T.G. Novel surfactant-free water dispersion technique of TiO2 NPs using focused ultrasound system. Nanomaterials 2021, 11, 427. [Google Scholar] [CrossRef]
- DeLoid, G.M.; Cohen, J.M.; Pyrgiotakis, G.; Demokritou, P. Preparation, characterization, and in vitro dosimetry of dispersed, engineered nanomaterials. Nat. Protoc. 2017, 12, 355–371. [Google Scholar] [CrossRef]
- Sato, K.; Li, J.G.; Kamiya, H.; Ishigaki, T. Ultrasonic dispersion of TiO2 nanoparticles in aqueous suspension. J. Am. Ceram. Soc. 2008, 91, 2481–2487. [Google Scholar] [CrossRef]
- Ahmad, Z.; Ansell, M.P.; Smedley, D. Moisture absorption characteristics of epoxy based adhesive reinforced with CTBN and ceramic particles for bonded-in timber connection: Fickian or non-Fickian behaviour. IOP Conf Ser. Mater. Sci. Eng. 2011, 17, 012011. [Google Scholar] [CrossRef]
- Antoon, M.K.; Koenig, J.L. Irreversible effects of moisture on the epoxy matrix in glass-reinforced composites. J. Polym. Sci. Polym. Phys. 1981, 19, 197–212. [Google Scholar] [CrossRef]
- Hu, H.; Onyebueke, L.; Abatan, A. Characterizing and modeling mechanical properties of nanocomposites-review and evaluation. J. Miner. Mater. Charact. Eng. 2010, 9, 275. [Google Scholar] [CrossRef]
- Fisher, F.T.; Brinson, L.C. Nanomechanics of nanoreinforced polymers. In Handbook of Theoretical and Computational Nanoscience; Volume 9: Nanocomposites, Nano-Assemblies, and Nanosurfaces; American Scientific Publishers: Karlsruhe, Germany, 2006; pp. 253–360. [Google Scholar]
- Moniruzzaman, M.; Winey, K.I. Polymer nanocomposites containing carbon nanotubes. Macromolecules 2006, 39, 5194–5205. [Google Scholar] [CrossRef]
- Bortz, D.R.; Heras, E.G.; Martin-Gullon, I. Impressive fatigue life and fracture toughness improvements in graphene oxide/epoxy composites. Macromolecules 2012, 45, 238–245. [Google Scholar] [CrossRef]
- Rafiee, M.A.; Rafiee, J.; Wang, Z.; Song, H.; Yu, Z.Z.; Koratkar, N. Enhanced mechanical properties of nanocomposites at low graphene content. ACS Nano 2009, 3, 3884–3890. [Google Scholar] [CrossRef]
- Kumar, R.V.; Koltypin, Y.; Palchik, O.; Gedanken, A. Preparation and characterization of nickel–polystyrene nanocomposite by ultrasound irradiation. J. Appl. Polym. Sci. 2002, 86, 160–165. [Google Scholar] [CrossRef]
- Wu, C.L.; Zhang, M.Q.; Rong, M.Z.; Friedrich, K. Silica nanoparticles filled polypropylene: Effects of particle surface treatment, matrix ductility and particle species on mechanical performance of the composites. Compos. Sci. Technol. 2005, 65, 635–645. [Google Scholar] [CrossRef]


| Specification | Bath Sonication | Probe Sonication | Focused Sonication |
|---|---|---|---|
| Frequency | 40 kHz | 20 kHz | 400 kHz |
| Solution volume | 100 mL | 100 mL | 100 mL |
| Irradiation time | 32 h 12 min | 1 h 47 min | 2 h |
| Ultrasonic energy (P) | 1.7 J/s | 29.6 J/s | 27.0 J/s |
| Delivered sonic energy (DSE) | 194.7 J/mL | 194.7 J/mL | 194.7 J/mL |
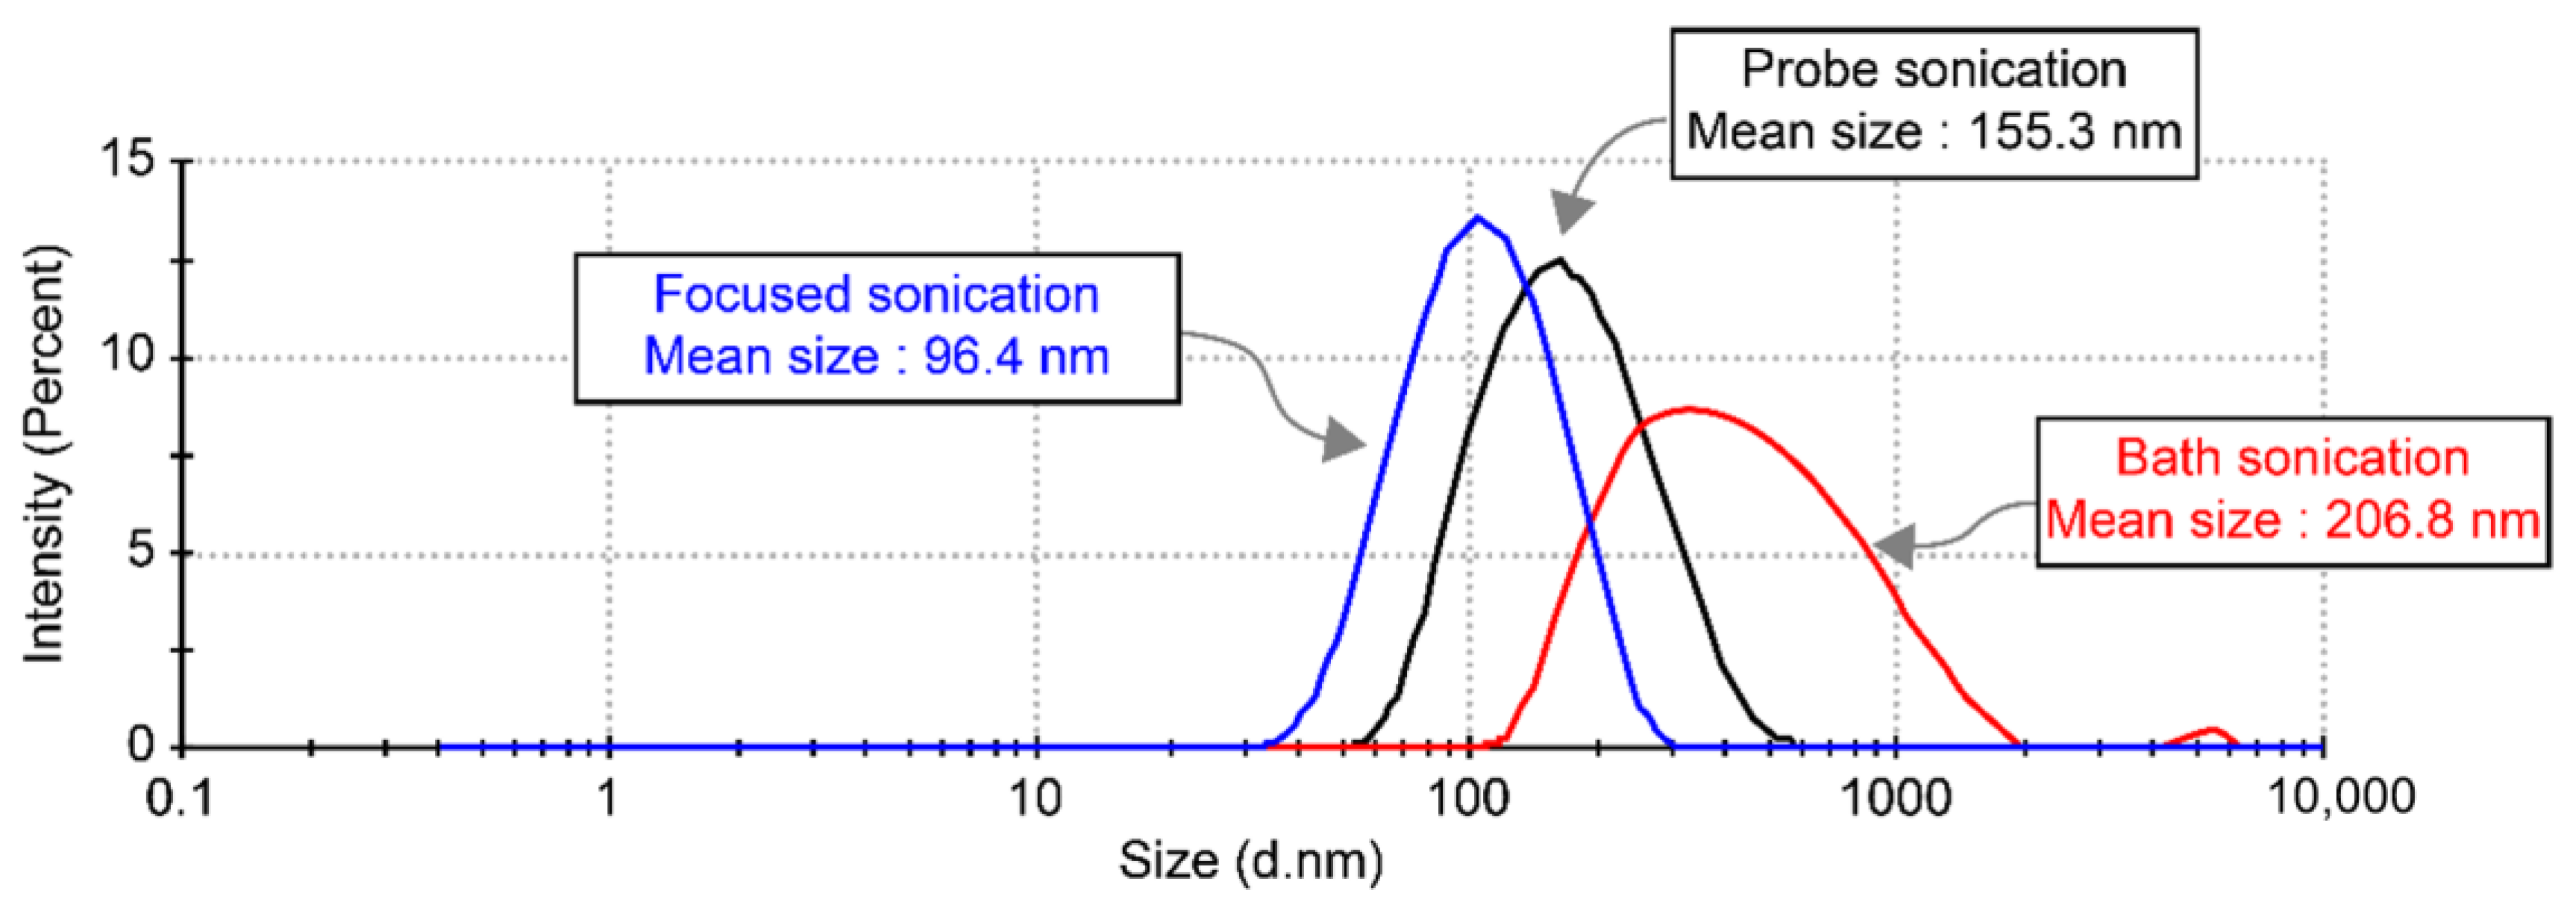
| Median particle size | 206.8 nm | 155.3 nm | 96.4 nm |
| Range of particle size distribution | 122–5560 nm | 60–531 nm | 37.8–255 nm |
Publisher’s Note: MDPI stays neutral with regard to jurisdictional claims in published maps and institutional affiliations. |
© 2021 by the authors. Licensee MDPI, Basel, Switzerland. This article is an open access article distributed under the terms and conditions of the Creative Commons Attribution (CC BY) license (https://creativecommons.org/licenses/by/4.0/).
Share and Cite
Choi, Y.-M.; Hwangbo, S.-A.; Lee, T.G.; Ham, Y.-B. Effect of Particle Size on the Mechanical Properties of TiO2–Epoxy Nanocomposites. Materials 2021, 14, 2866. https://doi.org/10.3390/ma14112866
Choi Y-M, Hwangbo S-A, Lee TG, Ham Y-B. Effect of Particle Size on the Mechanical Properties of TiO2–Epoxy Nanocomposites. Materials. 2021; 14(11):2866. https://doi.org/10.3390/ma14112866
Chicago/Turabian StyleChoi, Young-Min, Seon-Ae Hwangbo, Tae Geol Lee, and Young-Bog Ham. 2021. "Effect of Particle Size on the Mechanical Properties of TiO2–Epoxy Nanocomposites" Materials 14, no. 11: 2866. https://doi.org/10.3390/ma14112866
APA StyleChoi, Y.-M., Hwangbo, S.-A., Lee, T. G., & Ham, Y.-B. (2021). Effect of Particle Size on the Mechanical Properties of TiO2–Epoxy Nanocomposites. Materials, 14(11), 2866. https://doi.org/10.3390/ma14112866