Abstract
Pastes containing reduced graphene oxide (rGO) and SnCl2 solution were screen printed on carbon cloth and then calcined using a CO2 tornado-type atmospheric-pressure plasma jet (APPJ). The tornado circulation of the plasma gas enhances the mixing of the reactive plasma species and thus ensures better reaction uniformity. Scanning electron microscopy (SEM), energy-dispersive spectroscopy (EDS), and X-ray photoelectron spectroscopy (XPS) were performed to characterize the synthesized rGO-SnO2 nanocomposites on carbon cloth. After CO2 tornado-type APPJ treatment, the pastes were converted into rGO-SnO2 nanocomposites for use as the active electrode materials of polyvinyl alcohol (PVA)-H2SO4 gel-electrolyte flexible supercapacitors (SCs). Various APPJ scanning times were tested to obtain SCs with optimized performance. With seven APPJ scans, the SC achieved the best areal capacitance of 37.17 mF/cm2 in Galvanostatic charging/discharging (GCD) and a capacitance retention rate of 84.2% after 10,000-cycle cyclic voltammetry (CV) tests. The capacitance contribution ratio, calculated as pseudocapacitance/electrical double layer capacitance (PC/EDLC), is ~50/50 as analyzed by the Trasatti method. GCD data were also analyzed to obtain Ragone plots; these indicated an energy density comparable to those of SCs processed using a fixed-point nitrogen APPJ in our previous study.
1. Introduction
A supercapacitor (SC) is a passive energy storage device that has a higher energy density than conventional capacitors and a higher power density than batteries [1]. Many aspects of SCs have been investigated, including their low-cost manufacturing process [2,3], flexibility [4], thermal stability [5], electrochemical stability [6], and high power density [7]. The selection and preparation of electrode active materials play critical roles in determining the SC performance [8]. SCs have two main types of charge storage mechanisms: (1) electric double-layer capacitance (EDLC) [9], in which charges are stored on the electrode–electrolyte interface, and (2) pseudocapacitance (PC) [10], which is based on the Faraday redox reaction. Typically, in a combination of carbon-based materials, metal oxides, and conductive polymers, carbon-based materials contribute the EDLC, and the multivalent metal oxides and conductive polymers contribute the PC [11,12].
Graphene is a two-dimensional carbon material that was first successfully prepared by Novoselov and Geim in 2004 [13]. Since graphene has high conductivity, carrier mobility, and specific surface area, it has been widely used in fuel cells [14], solar cells [15], oxygen evolution reactions [16], oxygen reduction reaction [17,18,19], and SCs [20]. However, in practical applications, graphene may be agglomerated and stacked, and therefore, the charge accumulation of the electric double layer could be limited [21,22]. To increase the capacitance further, graphene is often compounded with a metal oxide to combine the EDLC and the PC [23]. The metal oxides used commonly in SCs include MnO2, Co3O4, V2O5, SnO2, and RuO2 [11,20,24,25]. In the present study, rGO and SnO2 were combined and processed using a scan-mode CO2 tornado-type atmospheric-pressure plasma jet (APPJ). SnO2 is cost effective and has good electrochemical properties [20,25]. Recently, many methods have been developed for synthesizing rGO-SnO2 including one-step synthesis [26], microwave-assisted synthesis [27], solvothermal synthesis [22], dynamic assembly [28], and sonochemical preparation [29].
Atmospheric pressure plasma (APP) can be processed on large scale in a regular-pressure environment without using a vacuum system. This generally reduces the cost. In contrast to a vacuum plasma system, an APP is relatively dusty and is therefore suitable for robust materials processing. Frequently used APP systems include arc, corona, dielectric barrier discharge (DBD) plasma, and APPJ [30,31,32]. An APP contains reactive plasma species with different self-sustaining temperatures. The properties of APPs can mainly be designed by the electrode configuration and the excitation power source. With various operating temperatures, various materials processes such as thin film deposition [33], etching [34], biomedical processing [35], and surface modification [36] can be designed.
CO2 is a common greenhouse gas on Earth. In this light, enabling the simultaneous reuse and decomposition of CO2 would be very beneficial. Therefore, many studies have investigated the recovery, degradation, conversion, and decomposition of CO2 [37,38,39,40]. Nonthermal plasma technology shows promise for the conversion of CO2 [41]. Further, many studies have used CO2 plasma systems to modify and oxidize materials [42,43,44]. CO2 DBD plasma has also been used for oxidizing carbon-based materials for use as the electrodes of SCs [45].
Previously, we have processed carbon nanotube (CNT)–SnO2 SCs using a fixed-point nitrogen APPJ [46,47]. However, the adhesion of SnO2 and CNTs was not good enough. Our subsequent study indicated that a higher SC specific capacitance value could be achieved by replacing 50 wt% of CNTs with reduced graphene oxides (rGOs) [8,48], possibly owing to the higher specific surface area of rGOs. Therefore, we used rGOs with SnO2 for the direct APPJ processing of rGO pastes containing SnCl2 solution, and this approach resulted in promising adhesion between SnO2 and rGOs [49]. In the present study, a scanning CO2 tornado-type APPJ was used to process screen-printed rGO pastes containing SnCl2 solution. The use of a CO2 tornado-type APPJ is beneficial for CO2 reuse and decomposition. The SCs fabricated by the CO2 tornado-type APPJ show comparable performance to those fabricated by the nitrogen fixed-point APPJ.
2. Experimental Sections
2.1. Preparation of rGO-SnCl2 Pastes for Screen Printing
The rGO-SnCl2 pastes were prepared by mixing rGOs (thickness: <5 nm, Golden Innovation Business, New Taipei City, Taiwan), SnCl2 (purity: 98%, anhydrous, Acros Organics, Geel, Belgium) solution, ethyl cellulose (#46070 and #46080, Sigma, Munich, Germany), ethanol (purity: 95%, Echo Chemical, Miaoli, Taiwan), and terpineol (anhydrous, Aldrich, Munich, Germany). The rGO was used as an active material to provide EDLC; SnCl2 solution was used as a precursor for converting to SnO2; ethyl cellulose was used as a binder, and the ethanol and terpineol were used as solvents. The details are described elsewhere [49].
2.2. Fabrication of rGO-SnO2 Electrodes
Figure 1a–c shows the fabrication process of the rGO-SnO2 electrode. First, rGO-SnCl2 pastes were screen printed on a carbon cloth current collector three times. The printed area was 1.5 × 2 cm2, as shown in Figure 2b. Next, the rGO-SnCl2 pastes printed on the carbon cloth were calcined at 100 °C for 10 min to remove excess solvent. Then, the screen-printed electrodes were scanned one, three, five, seven, and nine times using CO2 tornado-type APPJ (AC-PG-E-02, Click Sunshine Co., Ltd., New Taipei City, Taiwan). Figure 2a shows the schematic diagram of the APPJ. The APPJ parameters are as follows: CO2 flow rate is 35 slm, the distance between the plasma jet and the substrate is 4 mm, the power is 700 W, and the frequency of voltage source is 33 kHz. Figure 2c shows the APPJ scanning routine. Owing to the use of a rotating jet (i.e., tornado-type APPJ), the plasma was formed at the circumference of the jet rather than at the center of the jet. To ensure a homogenous process, the scanning area was much larger than the screen-printed area. The time required for each scan was ~55 s. The distance between each horizontal scan was 2 mm, and the distance between the exit of the plasma jet and the substrate was 4 mm.
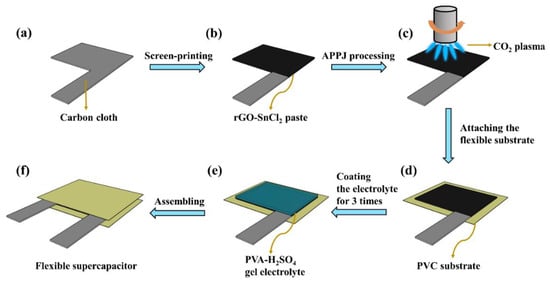
Figure 1.
Schematic of fabrication process of rGO-SnO2 SC: (a) carbon cloth current collector; (b) screen printing; (c) processing by CO2 plasma; (d) attaching to flexible substrate; (e) coating gel–electrolyte; (f) assembling two electrodes to form sandwich-type SCs.
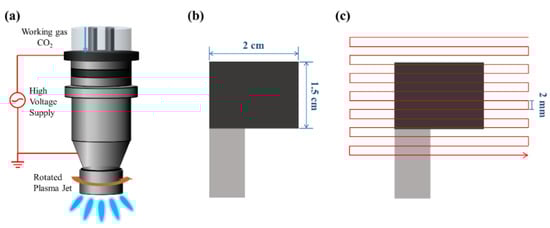
Figure 2.
The schematic diagram of the APPJ processing: (a) schematic of CO2 APPJ system; (b) top view of screen-printed carbon cloth; (c) APPJ scanning routine.
2.3. Preparation of Gel–Electrolyte and Assembly of rGO-SnO2 Supercapacitor
The polyvinyl alcohol (PVA)–H2SO4 gel–electrolyte was prepared by mixing 1.7 g of PVA (99+% hydrolyzed) and 1 M of H2SO4 (purity: 95–97%, AUECC, Kaohsiung, Taiwan) under magnetic stirring with a rotation speed of 300 rpm at 80 °C until the solution became clear.
Figure 1d−f shows the assembly procedure and the structure of SCs. First, the rGO-SnO2 electrode was attached to a PVC substrate. Then, 0.5 mL PVA-H2SO4 electrolyte was dropped uniformly on the rGO-SnO2 electrode and dried for one day. This step was repeated three times. Finally, two pieces of PVA-H2SO4 electrolyte-coated electrodes were sandwiched on the gel-electrolyte sides to form a sandwich-structured SC.
2.4. Characterization of Materials and SCs
A k-type thermocouple and module (NI-9211, National Instruments, Austin, TX, USA) were used to measure the sample temperature during APPJ processing. A spectrometer (Mars HS2000+, GIE Optics, Taipei, Taiwan) was used to detect the optical emission spectra (OES). The integration time for the OES detection was 16 ms. The water contact angle of the electrodes was measured using an optical goniometer (Model 100SB, Sindetake, Taipei, Taiwan). The morphology of the rGO-SnO2 nanocomposites was observed by scanning electron microscopy (SEM, JSM-7800 Prime, JEOL, Tokyo, Japan) with energy-dispersive spectroscopy (EDS) at magnifications of 3000×, 30,000×, 100,000×. The bonding configuration was characterized using X-ray photoelectron spectroscopy (XPS, Sigma Probe, Thermo VG Scientific, Waltham, MA, USA) with an Al-Kα source and EDS. Electrochemical measurements were performed using cyclic voltammetry (CV) and galvanostatic charging/discharging (GCD) with a two-electrode configuration. The CV measurement was performed using an electrochemical workstation (Zennium, Zahner-Elektrik, Kronach, Germany) with potential scan rates of 200, 20, and 2 mV/s and a potential window of 0–0.8 V. The GCD measurement was performed using another electrochemical workstation (PGSTAT204, Metrohm Autolab, Utrecht, The Netherlands) with a potential window of 0–0.8 V and charging/discharging currents of 4, 2, 1, 0.5, and 0.25 mA.
3. Results and Discussions
3.1. Basic Information about CO2 Tornado-Type APPJ
Figure 3a shows the substrate temperature during CO2 APPJ processing (one scan). The temperature is slightly higher than 50 °C before APPJ scanning because of the residual heat left by the warm-up scan. The temperature quickly increases to hundreds of degrees Celsius. Therefore, the APPJ is suitable for rapid thermal processing. The plasma directly bombards the substrate surface, and the instantaneous maximum temperature becomes ~350 °C. Temperature oscillations could be caused by the rotation of the jet (i.e., tornado-type APPJ). Figure 3b shows the OES of the CO2 APPJ. The peaks generated at wavelengths of 282.8, 297.9, and 519.7 nm are mainly caused by CO species [50,51]. The peak observed at 359.9 nm is caused by the transition (v3–v16) of CO2. The peak at 406.0 nm is caused by the excitation of O2. Further, atomic O lines can be found at 776.4 and 843.9 nm [50]. The emission peaks at 386.5 and 458.1 nm are assigned to the CN violet system; the emission peaks at 391.0, 425.5 nm are assigned to the tail bands of CN; and those at 463.7 and 469.0 nm, to Le Blanc’s system [52]. Balmer’s series of Hδ, Hγ, and Hα can be detected at 410.8, 433.5, and 657.0 nm, respectively [53]. Further, another emission peak of H2 can be found at 722.5 nm [54]. The reaction of the CO2 APPJ is quite complicated and involves reactions with environmental gases. Many characteristic peaks related to oxygen can be detected, indicating that the plasma system has a strong oxidizing property. CN species were generated owing to the use of a carbon source in CO2, which would react with nitrogen in the surroundings. In addition, the generation of hydrogen and some oxygen species was attributed to the splitting of water vapor in the atmospheric environments by Equation (1) [55,56].
2H2O → 2H2 + O2
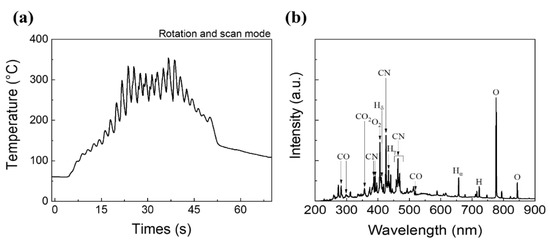
Figure 3.
The basic information of CO2 APPJ: (a) temperature evolution of the substrate during APPJ scanning (one scan); (b) OES of CO2 APPJ.
This phenomenon could have further increased the number of oxygen species. As a result, the oxygen species were produced by the splitting of both CO2 and water vapor.
3.2. Water Contact Angles of rGO-SnO2
Figure 4 shows the water contact angle of the rGO-SnO2 electrode. The as-deposited rGO-SnCl2 has a high-water contact angle of 120.9°. After CO2 APPJ processing, the water droplet penetrated into the carbon cloth instantly for all APPJ scanning times. The increased hydrophilicity is mainly due to the oxygen functional groups implanted by the APPJ. This is partly due to heat and partly due to the oxidizing nature of our CO2 APPJ. This shows that the CO2 APPJ treatment can also effectively improve hydrophilicity. The increased hydrophilicity can improve the contact between the electrode and the gel–electrolyte, thereby improving the capacitance values.
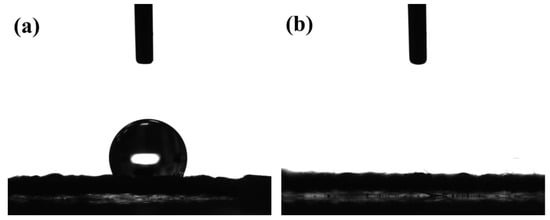
Figure 4.
Water contact angle of screen-printed rGO–SnCl2 pastes scanned (a) zero and (b) APPJ-processed.
3.3. Surface Morphology of rGO-SnO2 Electrode
Figure S1 shows SEM images of the rGO-SnO2 electrode at a magnification of 3000×. The surface of the as-deposited electrode is relatively smooth, and the rGOs cannot be identified clearly because too much ethyl cellulose is attached to their surface. This could degrade the EDLC provided by rGOs, resulting in poor SC performance. Upon increasing the number of APPJ scans, the graphene sheets or stacks become more obvious, and most of the ethyl cellulose is burned off.
Figure S2 shows SEM images of the rGO-SnO2 electrodes at a magnification of 30,000×. A small number of SnO2 particles is seen in the sample with one APPJ scan. After more than five APPJ scans, these particles are uniformly distributed on the rGO sheets. In our previous study of rGO SCs, no nanoparticle could be seen [57]. This indicates the successful synthesis of metal oxides in the study. Figure 5 shows the SEM images of rGO-SnO2 electrodes at a magnification of 100,000×. SnO2 can be seen clearly; further, this SnO2 contributes PC to SCs.
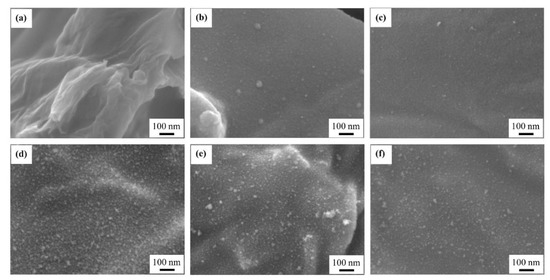
Figure 5.
SEM images (100,000×) of rGO-SnO2 electrodes scanned (a) zero, (b) one, (c) three, (d) five, (e) seven, and (f) nine times using CO2 APPJ.
3.4. Chemical Bonding Analyses by XPS
Figure 6 shows an XPS survey scan of the screen-printed electrode. Elemental identification was conducted based on the reference book [58]. The as-deposited electrode exhibits a little Si pollution. This Si may come from the screen-printing process. In addition, only C, O, Sn, and a little Cl can be detected. Table 1 shows the elemental ratio of C, O, Sn, and Cl. Higher C and lower Sn atomic contents are seen because a large amount of ethyl cellulose exists in the printed electrode. After CO2 APPJ processing, the C content apparently decreased, mainly owing to the removal of excess ethyl cellulose. Furthermore, the large increase in the O content indicates that the CO2 APPJ is fairly suitable for oxidizing carbon-based materials. The detectability of Sn increases after APPJ processing. Further, the Cl content decreases after APPJ processing. This demonstrates that the CO2 tornado-type APPJ can quickly decompose SnCl2 and convert it into SnO2.
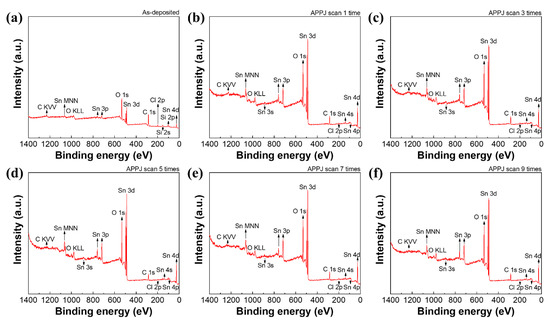
Figure 6.
XPS analysis of electrodes scanned (a) zero, (b) one, (c) three, (d) five, (e) seven, (f) and nine times using the APPJ.

Table 1.
Elemental ratios analyzed based on XPS survey scan spectra in Figure 6.
Figure S3 shows the EDS analysis of the as-deposited and APPJ-processed electrode (seven scans). In contrast to the detection depth of XPS, which is less than 10 nm, EDS can be used to obtain chemical information from great depths in samples [59]. Figure S3a,b shows the EDS analysis of the as-deposited electrodes. The C content is 75.5% owing to the combined contribution from carbon cloth, rGOs, ethyl cellulose, and little organic solvent. The O content is contributed to by the ethyl cellulose, rGOs, and SnO2. The Sn and Cl signals arise from SnCl2. Figure S3c,d shows the XPS results obtained when the electrode was scanned seven times using the APPJ. The differences in C and O contents are small between the as-deposited and the seven-times APPJ-scanned samples. After seven APPJ scans, the C content increased from 75.5% to 77.9%, whereas the O content decreased from 20.0% to 17.1%. The O content may have decreased owing to the burnout of ethyl cellulose. Further, the Cl content decreased from 2.2% to 0.5%, clearly indicating the decomposition of SnCl2.
3.5. CV Measurements
To confirm that the increased capacitance mainly arises from the deposited rGO-SnO2 and not from the carbon fibers of carbon cloth, bare carbon cloth SCs without rGO-SnO2 coatings were fabricated. The CO2 APPJ was also used for processing the carbon cloth before gel–electrolyte was spread on it. The areal capacitance is calculated using Equation (2) [23] as follows:
where CA is the areal capacitance (mF/cm2); S, the integral area of the total cyclic voltammetry loop; ΔV, the potential window (V); v, the potential scan rate (mV/s); and A, the area of each electrode. Figure S4 shows the CV measurement of the bare carbon cloth SC processed using the CO2 APPJ. The cyclic curves are triangular owing to the EDLC of an ideal carbon SC [60]. Table S1 shows the relationship between the APPJ scan time and the areal capacitance value. The best performance can be obtained with seven APPJ scans. The improved areal capacitance mainly arises from the increased hydrophilicity. However, the capacitance is 4.48 mF/cm2, as evaluated under a potential scan rate of 2 mV/s; this value is much lower than that of rGO-SnO2 processed using the CO2 APPJ, as described below.
Figure 7 shows the CV measurement of the rGO-SnO2 SCs processed using the CO2 APPJ. Compared with the CV curves of the bare carbon cloth SC (Figure S4) and rGO SCs processed using the APPJ [61], the curve shapes are no longer squarish. This is attributable to the PC caused by the deposition of SnO2. A slight hump is detected at ~0.3 V in the forward scan (0 to 0.8 V) and ~0.2 V in the reverse scan (0.8 to 0 V); this small hump becomes clearer in the sample scanned seven times. Similar characteristics were noted in related studies [26,62]. These could be redox peaks caused by SnO2. The addition of SnO2 apparently provided PC with EDLC, thereby further increasing the capacitance value. With a slower potential scan rate, a larger areal capacitance can be obtained. This is because ions can have more reaction time to intercalate the surface materials, thereby providing PC. As the potential scan rate increases, the charges may not have sufficient time to undergo redox Faradaic reactions. Therefore, the PC effect becomes less obvious, leading to a smaller capacitance value [63]. Table 2 shows the relationship between the areal capacitance value and the number of APPJ scans. The rGO-SnO2 SC that was scanned seven times shows the optimal areal capacitance of 33.59 mF/cm2 under a potential scan rate of 2 mV/s. Based on our previous study with Raman spectra, an overlong plasma process will damage the structure of graphene. It will reduce the capacitance value [8]. As a result, the areal capacitance decreased with the electrode APPJ scanned nine times.
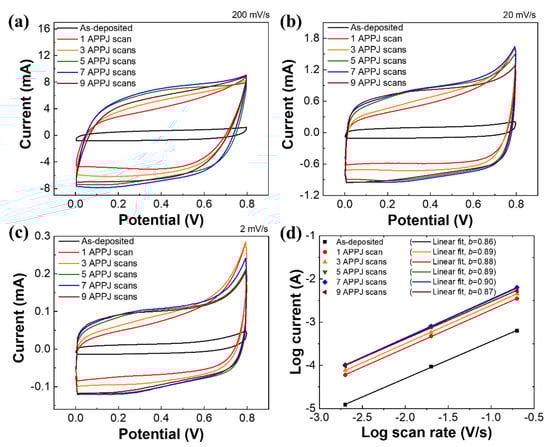
Figure 7.
CV curves of rGO-SnO2 SCs under potential scan rates of (a) 200 mV, (b) 20 mV, and (c) 2 mV. (d) Logarithm of currents and scan rates.
Table 2.
Areal capacitance of rGO-SnO2 SCs calculated based on CV curves shown in Figure 7.
In addition, the current change with the scan rate in the CV curve follows the power–law in Equation (3) [5].
where i is the response current at 0.3 V; v is potential scan rate; a and b are variable parameters. The b-values are calculated from log(i) vs. log(v). The electrodes with b = 1 are classified as EDLCs; the electrodes with 0.8 < b < 1 are corresponded to PCs; the electrode with 0.5 < b < 0.8 is attributed to battery-type behavior [64]. Figure S4d and Figure 7d show the power–law relationship with carbon cloth and rGO-SnO2 SCs. In carbon cloth SCs, the b-values were 0.93~0.96, which is close to ideal EDLCs. In rGO-SnO2 SCs, the b-values were 0.86~0.9, reflecting the behavior of PCs.
3.6. Trasatti Analysis
The capacitance contribution ratio, calculated as EDLC/PC, can be easily determined by the Trasatti method [65]. The Trasatti method divides the charge storage mechanisms of the surface charge (Cout), which is associated with EDLC, and the diffusion-controlled charge (Cin), which is proportional to v−1/2 (v is the potential scan rate) and is associated with PC. The two mechanisms have different responses to different potential scan rates [66]. When the potential scan rate approaches zero, both Cin and Cout readily respond to applied electric fields. When the potential scan rate approaches infinity, only Cout responds to applied electric fields [67,68]. Figure S5 shows the Trasatti plots and capacitive contribution of carbon cloth SCs. Figure S5a,b shows the relationship between 1/CA (subscript A denotes the areal capacitance) and v1/2, which can be used to extrapolate the vertical axis (v1/2 = 0) to find the Ctotal = Cin + Cout. Figure S5c shows the relationship between CA and v−1/2, which can be used to extrapolate to the vertical axis (v−1/2 = 0) to find Cout. Cin can then be calculated by subtracting Cout from Ctotal. Table S2 lists the calculated capacitive contribution, indicating that most of the electrochemical reaction of the carbon cloth SCs is dominated by EDLC. This is reasonable because carbon fibers contribute capacitance to the EDLC mechanism. The capacitive contributions of rGO-SnO2 SCs are also calculated. Figure 8 shows the Trasatti plots of rGO-SnO2 SCs. Table 3 shows Ctotal, Cin, and Cout, as well as the capacitive contribution of rGO-SnO2 SCs based on Trasatti analysis. The PC/EDLC ratio is ~50% for all APPJ scan times. This confirms that the rGO-SnO2 composites effectively improved the areal capacitance and provided both PC and EDLC. The improved PC mainly arises from SnO2 [25].
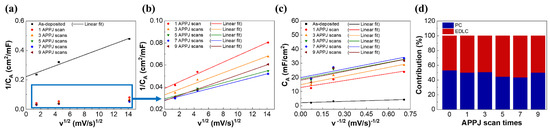
Figure 8.
Trasatti plots of rGO-SnO2 SCs: (a,b) 1/CA vs. v1/2; (c) CA vs. v−1/2; (d) capacitive contribution of rGO-SnO2 SCs.
Table 3.
Capacitive contribution of rGO-SnO2 SCs.
3.7. GCD Measurements
The GCD measurement was used to evaluate the areal capacitance. The areal capacitance is calculated using Equation (4) [23] as follows:
where CA is the areal capacitance (mF/cm2); ΔV, the potential window (V); I, the constant discharging current (mA); T, the discharging time (s); and A, the area of each electrode. Figure S6 and Table S3 show the GCD results of carbon cloth SCs processed using the CO2 APPJ. As the I–R drop would be large when the GCD current is too large, the GCD current was varied as 1, 0.5, 0.25, and 0.1 mA in this experiment. The charging/discharging curves are shaped like an isosceles triangle; this is characteristic of EDLC and confirmed the results of the CV results. The capacitance of the carbon cloth SC is much lower than that of the rGO-SnO2 SC, as described below. This suggests that the rGO-SnO2 coating processed using CO2 tornado-type APPJ significantly improves the capacitance value.
Figure 9 and Table 4 show the GCD results of rGO-SnO2 SCs. The GCD results show an optimal capacitance of 37.17 mF/cm2 with seven APPJ scans. The charging and discharging times are similar, indicating excellent Coulombic efficiency [69]. Finally, Figure S6e and Figure 9f show the areal capacitance of the carbon cloth and rGO-SnO2 SCs under different charging/discharging currents. A smaller GCD charging/discharging current results in a larger areal capacitance owing to the response of the PC effect.
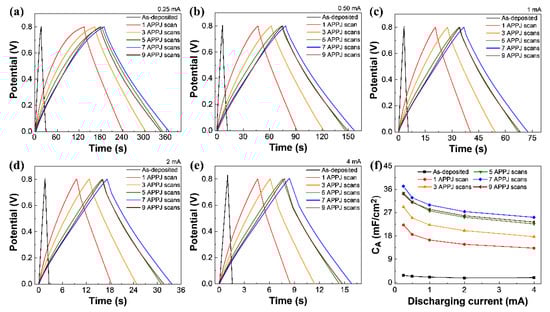
Figure 9.
GCD of rGO-SnO2 supercapacitor under charge/discharge current of (a) 0.25 mA, (b) 0.50 mA, (c) 1 mA (d) 2 mA, and (e) 4 mA. (f) Areal capacitances calculated based on GCD results under different discharging currents.
Table 4.
Areal capacitance of rGO-SnO2 SCs calculated based on GCD results.
3.8. Ragone Plots
Ragone plots are used to evaluate the energy and power density of the SCs. There are, respectively, calculated with Equations (5) and (6) [70] as follows:
where EA is the energy density (per unit area) (µWh/cm2); CA, the areal capacitance calculated by the GCD method (mF/cm2); ΔV, the potential window (V); PA, power density (per unit area) (mW/cm2); and T, the discharging time (s). Figure 10 shows the Ragone plots of the SCs. With screen-printed rGO-SnO2 and optimal CO2 APPJ processing, the rGO-SnO2 SC exhibits the best energy density of 3.304 µWh/cm2 under a discharging current of 0.25 mA and the best power density of 1.067 mW/cm2 under a discharging current of 4 mA. Compared with bare carbon cloth SCs, rGO-SnO2 apparently promotes energy density. In comparison to the rGO-SnO2 SCs processed using fixed-point nitrogen APPJ [49], the energy density of SCs processed by CO2 tornado-type APPJ is nearly comparable. The slightly lower energy density value could be partly due to the temperature difference. Previously, the working temperature of our nitrogen APPJ was stably maintained at ~500–600 °C; in contrast, the working temperature of the CO2 tornado-type APPJ was 200–350 °C. We did not increase the operating temperature of the CO2 tornado-type APPJ because the rotation and scanning modes of the plasma jet would make heat dissipate more easily forming the surface and thereby reducing the temperature.
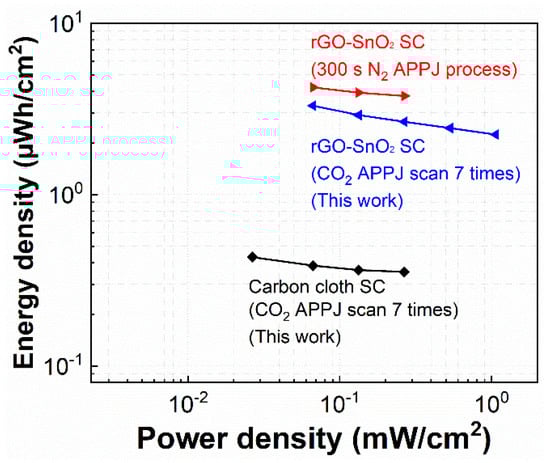
Figure 10.
Ragone plots of rGO-SnO2. Comparison of results of CO2 tornado-type APPJ-processed rGO-SnO2 and bare carbon cloth SCs to those of fixed-point nitrogen APPJ-processed rGO-SnO2 SCs (our previous study [49]).
3.9. Electrochemical and Mechanical Stability of SCs
The 10,000-cycle CV stability was tested under a potential scan rate of 200 mV/s. Figure 11a shows the results. The rGO-SnO2 SC has an areal capacitance of 18.84 mF/cm2 in the first cycle. After 10,000 cycles, its areal capacitance decreased to 15.86 mF/cm2. Therefore, the capacitance retention was 84.2%. Furthermore, the rGO-SnO2 SC was tested under repeated bending with a bending radius of 7.5 mm (1000 times). Figure 11b shows the results of the bending test; the areal capacitance increased by 7.7% after 1000 bending cycles. This is because a small bending mechanical stress mainly facilitates improved contact between the electrolyte and the rGO-SnO2 composites.
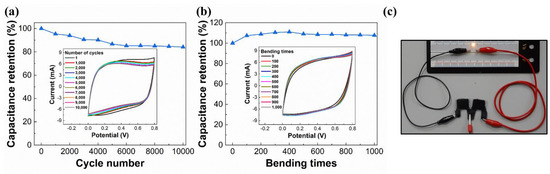
Figure 11.
(a) CV cycling stability under a potential scan rate of 200 mV/s for 10,000 cycles; (b) cyclic bending test under a radius of 7.5 mm for 1000 cycles; (c) LED lit using two serially connected rGO-SnO2 SCs.
3.10. Illumination of LED by Charged SCs
To verify whether the rGO-SnO2 SCs fabricated using CO2 tornado-type APPJ can actually be used as a power source for external electronic components, we use charged SCs to power up an LED. Toward this end, two rGO-SnO2 SCs were connected serially and charged by a 4.5 V DC power source for only 10 s. Then, the charged SCs were connected to the LED. The LED can be lighted at least for 30 s by the charged SCs, as shown in Figure 11c and Video S1 (Supplementary Materials).
4. Conclusions
A CO2 tornado-type APPJ was successfully used for converting rGO–SnCl2 pastes into rGO-SnO2 composites that were then used as the electrodes of flexible SCs. CO2 tornado-type APPJ treatment could also improve the hydrophilicity of the electrode materials and facilitate contact between the gel–electrolyte and the electrodes. XPS and EDS validated the conversion of SnCl2 into SnO2. The best-performing SC, processed using seven CO2 tornado-type APPJ scans, exhibited an areal capacitance of 37.17 mF/cm2 in the GCD test. Comparing with the results of bare carbon cloth SCs confirms that the contribution of the capacitance was mainly from CO2 APPJ-processed rGO-SnO2. Trasatti analysis shows that the capacitance contribution ratio PC/EDLC is ~50/50 with PC enhanced by the inclusion of SnO2. The SC shows a capacitance retention rate of 84.2% after a 10,000-cycle CV stability test. Further, no degradation was observed after 1000 bending cycles with a bending radius of 7.5 mm.
Supplementary Materials
The following are available online at https://www.mdpi.com/article/10.3390/ma14112777/s1, Figure S1: SEM images (3000×) of rGO–SnO2 electrodes scanned (a) zero, (b) one, (c) three, (d) five, (e) seven, and (f) nine times using CO2 APPJ, Figure S2: SEM images (30,000×) of rGO–SnO2 electrodes scanned (a) zero, (b) one, (c) three, (d) five, (e) seven, and (f) nine times using CO2 APPJ, Figure S3. Energy-dispersive spectroscopy (EDS) analysis of the electrodes: (a) The measuring points of as-deposited electrode. (b) EDS analysis of as-deposited electrode. (c) The measuring points of seven-times APPJ-scanned electrode. (d) EDS analysis of seven-times APPJ scanned electrode, Figure S4: CV of bare carbon cloth SCs (without rGO–SnO2) under potential scan rates of (a) 200 mV, (b) 20 mV, and (c) 2 mV. (d) Logarithm of currents and scan rates. Figure S5: Trasatti plots of bare carbon cloth electrode SCs: (a,b) 1/CA vs. v1/2, (c) CA vs. v−1/2, and (d) capacitive contribution, Figure S6: GCD of carbon cloth SC under constant current of (a) 0.10 mA, (b) 0.25 mA, (c) 0.50 mA, and (d) 1 mA. (e) Areal capacitances calculated based on GCD results, Table S1: Areal capacitance of bare carbon cloth SCs (without rGO-SnO2), Table S2: Capacitive contribution of carbon cloth SCs, Table S3: Areal capacitance of carbon cloth SCs calculated by GCD. Video S1: LED lit using two serially connected rGO-SnO2 SCs.
Author Contributions
Conceptualization, J.-Z.C., Y.-L.K., and C.-R.Y.; methodology, J.-Z.C.; software, J.-H.C. and S.-Y.C.; validation, J.-H.C., S.-Y.C., and J.-Z.C.; formal analysis, J.-H.C. and J.-Z.C.; investigation, J.-H.C. and S.-Y.C.; resources, J.-H.C. and S.-Y.C.; data curation, J.-H.C.; writing—original draft preparation, J.-H.C. and J.-Z.C.; writing—review and editing, J.-H.C., S.-Y.C., and J.-Z.C.; supervision, J.-Z.C. and Y.-L.K.; project administration, J.-Z.C. and Y.-L.K.; funding acquisition, J.-Z.C., Y.-L.K., and C.-R.Y. All authors have read and agreed to the published version of the manuscript.
Funding
This study is supported by the “Advanced Research Center for Green Materials Science and Technology” from The Featured Area Research Center Program of the Higher Education Sprout Project by the Ministry of Education (110L9006) and the Ministry of Science and Technology in Taiwan (MOST 110-2634-F-002-043 and MOST 108-2221-E-002-088-MY3). J.-Z.C., C.-R.Y., and Y.-L.K. gratefully acknowledge the funding support from Innovation-Orientated Trilateral Proposal for Young Investigators of NTU System under Grant Nos. NTU-IOTP-109PNTUS06 and 109TY5F05.
Institutional Review Board Statement
Not applicable.
Informed Consent Statement
Not applicable.
Data Availability Statement
All data are included in the paper and the Supplementary Materials.
Acknowledgments
We thank Yuan-Tze Lee at the Instrument Center in the Department of Materials Science and Engineering, National Taiwan University for conducting SEM experiments and Li-Fan Chen at the High-resolution Analytical Instrumentation Center, National Central University for conducting XPS experiments.
Conflicts of Interest
The authors declare no conflict of interest.
References
- Yan, J.; Wang, Q.; Wei, T.; Fan, Z. Recent Advances in Design and Fabrication of Electrochemical Supercapacitors with High Energy Densities. Adv. Energy Mater. 2014, 4, 1300816. [Google Scholar] [CrossRef]
- Yang, P.; Ding, Y.; Lin, Z.; Chen, Z.; Li, Y.; Qiang, P.; Ebrahimi, M.; Mai, W.; Wong, C.P.; Wang, Z.L. Low-cost high-performance solid-state asymmetric supercapacitors based on MnO2 nanowires and Fe2O3 nanotubes. Nano Lett. 2014, 14, 731–736. [Google Scholar] [CrossRef] [PubMed]
- Kaempgen, M.; Chan, C.K.; Ma, J.; Cui, Y.; Gruner, G. Printable thin film supercapacitors using single-walled carbon nanotubes. Nano Lett. 2009, 9, 1872–1876. [Google Scholar] [CrossRef] [PubMed]
- Shao, Y.; El-Kady, M.F.; Wang, L.J.; Zhang, Q.; Li, Y.; Wang, H.; Mousavi, M.F.; Kaner, R.B. Graphene-based materials for flexible supercapacitors. Chem. Soc. Rev. 2015, 44, 3639–3665. [Google Scholar] [CrossRef]
- Kim, D.W.; Jung, S.M.; Jung, H.Y. Long term thermostable supercapacitor using in-situ SnO2 doped porous graphene aerogel. J. Power Sources 2020, 448, 8. [Google Scholar] [CrossRef]
- Chen, X.Y.; Chen, C.; Zhang, Z.J.; Xie, D.H.; Deng, X.; Liu, J.W. Nitrogen-doped porous carbon for supercapacitor with long-term electrochemical stability. J. Power Sources 2013, 230, 50–58. [Google Scholar] [CrossRef]
- Sikdar, A.; Majumdar, A.; Dutta, P.; Borah, M.; Kim, S.O.; Maiti, U.N. Ultra-large area graphene hybrid hydrogel for customized performance supercapacitors: High volumetric, areal energy density and potential wearability. Electrochim. Acta 2020, 332, 135492. [Google Scholar] [CrossRef]
- Kuok, F.-H.; Chien, H.-H.; Lee, C.-C.; Hao, Y.-C.; Yu, S.; Hsu, C.-C.; Cheng, I.-C.; Chen, J.-Z. Atmospheric-pressure-plasma-jet processed carbon nanotube (CNT)–reduced graphene oxide (rGO) nanocomposites for gel-electrolyte supercapacitors. RSC Adv. 2018, 8, 2851–2857. [Google Scholar] [CrossRef]
- Chen, Y.J.; Zhu, C.L.; Xue, X.Y.; Shi, X.L.; Cao, M.S. High capacity and excellent cycling stability of single-walled carbon nanotube/SnO2 core-shell structures as Li-insertion materials. Appl. Phys. Lett. 2008, 92, 3. [Google Scholar] [CrossRef]
- Sivaraman, P.; Rath, S.K.; Hande, V.R.; Thakur, A.P.; Patri, M.; Samui, A.B. All-solid-supercapacitor based on polyaniline and sulfonated polymers. Synth. Met. 2006, 156, 1057–1064. [Google Scholar] [CrossRef]
- Zhi, M.; Xiang, C.; Li, J.; Li, M.; Wu, N. Nanostructured carbon–metal oxide composite electrodes for supercapacitors: A review. Nanoscale 2013, 5, 72–88. [Google Scholar] [CrossRef]
- Tseng, C.H.; Hsin, J.C.; Tsai, J.H.; Chen, J.Z. Dielectric-Barrier-Discharge Jet Treated Flexible Supercapacitors with Carbon Cloth Current Collectors of Long-Lasting Hydrophilicity. J. Electrochem. Soc. 2020, 167, 116511. [Google Scholar] [CrossRef]
- Novoselov, K.S.; Geim, A.K.; Morozov, S.V.; Jiang, D.; Zhang, Y.; Dubonos, S.V.; Grigorieva, I.V.; Firsov, A.A. Electric field effect in atomically thin carbon films. Science 2004, 306, 666–669. [Google Scholar] [CrossRef] [PubMed]
- Antolini, E. Graphene as a new carbon support for low-temperature fuel cell catalysts. Appl. Catal. B Environ. 2012, 123, 52–68. [Google Scholar] [CrossRef]
- Yin, Z.; Zhu, J.; He, Q.; Cao, X.; Tan, C.; Chen, H.; Yan, Q.; Zhang, H. Graphene-based materials for solar cell applications. Adv. Energy Mater. 2014, 4, 1300574. [Google Scholar] [CrossRef]
- Arivu, M.; Masud, J.; Umapathi, S.; Nath, M. Facile synthesis of Ni3B/rGO nanocomposite as an efficient electrocatalyst for the oxygen evolution reaction in alkaline media. Electrochem. Commun. 2018, 86, 121–125. [Google Scholar] [CrossRef]
- Ma, R.; Lin, G.; Zhou, Y.; Liu, Q.; Zhang, T.; Shan, G.; Yang, M.; Wang, J. A review of oxygen reduction mechanisms for metal-free carbon-based electrocatalysts. NPJ Comput. Mater. 2019, 5, 78. [Google Scholar] [CrossRef]
- Higgins, D.; Zamani, P.; Yu, A.; Chen, Z. The application of graphene and its composites in oxygen reduction electrocatalysis: A perspective and review of recent progress. Energy Environ. Sci. 2016, 9, 357–390. [Google Scholar] [CrossRef]
- Kamedulski, P.; Lukaszewicz, J.P.; Witczak, L.; Szroeder, P.; Ziolkowski, P. The Importance of Structural Factors for the Electrochemical Performance of Graphene/Carbon Nanotube/Melamine Powders towards the Catalytic Activity of Oxygen Reduction Reaction. Materials 2021, 14, 2448. [Google Scholar] [CrossRef]
- Rames, S.; Yadav, H.M.; Lee, Y.J.; Hong, G.W.; Kathalingam, A.; Sivasamy, A.; Kim, H.S.; Kim, H.S.; Kim, J.H. Porous materials of nitrogen doped graphene oxide@SnO2 electrode for capable supercapacitor application. Sci. Rep. 2019, 9. [Google Scholar] [CrossRef]
- Zheng, W.; Li, S.; Yu, X.; Chen, C.; Huang, H.; Huang, Y.; Li, L. Synthesis of hierarchical reduced graphene oxide/SnO2/polypyrrole ternary composites with high electrochemical performance. Mater. Res. Bull. 2016, 80, 303–308. [Google Scholar] [CrossRef]
- Lim, S.P.; Huang, N.M.; Lim, H.N. Solvothermal synthesis of SnO2/graphene nanocomposites for supercapacitor application. Ceram. Int. 2013, 39, 6647–6655. [Google Scholar] [CrossRef]
- Xiang, C.; Li, M.; Zhi, M.; Manivannan, A.; Wu, N. A reduced graphene oxide/Co3O4 composite for supercapacitor electrode. J. Power Sources 2013, 226, 65–70. [Google Scholar] [CrossRef]
- Selvan, R.K.; Perelshtein, I.; Perkas, N.; Gedanken, A. Synthesis of hexagonal-shaped SnO2 nanocrystals and SnO2@C nanocomposites for electrochemical redox supercapacitors. J. Phys. Chem. C 2008, 112, 1825–1830. [Google Scholar] [CrossRef]
- Velmurugan, V.; Srinivasarao, U.; Ramachandran, R.; Saranya, M.; Grace, A.N. Synthesis of tin oxide/graphene (SnO2/G) nanocomposite and its electrochemical properties for supercapacitor applications. Mater. Res. Bull. 2016, 84, 145–151. [Google Scholar] [CrossRef]
- Li, F.H.; Song, J.F.; Yang, H.F.; Gan, S.Y.; Zhang, Q.X.; Han, D.X.; Ivaska, A.; Niu, L. One-step synthesis of graphene/SnO2 nanocomposites and its application in electrochemical supercapacitors. Nanotechnology 2009, 20. [Google Scholar] [CrossRef]
- Garino, N.; Sacco, A.; Castellino, M.; Munoz-Tabares, J.A.; Chiodoni, A.; Agostino, V.; Margaria, V.; Gerosa, M.; Massaglia, G.; Quaglio, M. Microwave-Assisted Synthesis of Reduced Graphene Oxide/SnO2 Nanocomposite for Oxygen Reduction Reaction in Microbial Fuel Cells. ACS Appl. Mater. Interfaces 2016, 8, 4633–4643. [Google Scholar] [CrossRef] [PubMed]
- Chen, M.X.; Wang, H.; Li, L.Z.; Zhang, Z.; Wang, C.; Liu, Y.; Wang, W.; Gao, J.P. Novel and Facile Method, Dynamic Self-Assemble, To Prepare SnO2/rGO Droplet Aerogel with Complex Morphologies and Their Application in Supercapacitors. ACS Appl. Mater. Interfaces 2014, 6, 14327–14337. [Google Scholar] [CrossRef]
- Choudhari, A.; Bhanvase, B.A.; Saharan, V.K.; Salame, P.H.; Hunge, Y. Sonochemical preparation and characterization of rGO/SnO2 nanocomposite: Electrochemical and gas sensing performance. Ceram. Int. 2020, 46, 11290–11296. [Google Scholar] [CrossRef]
- Tendero, C.; Tixier, C.; Tristant, P.; Desmaison, J.; Leprince, P. Atmospheric pressure plasmas: A review. Spectrochim. Acta Part B At. Spectrosc. 2006, 61, 2–30. [Google Scholar] [CrossRef]
- Schutze, A.; Jeong, J.Y.; Babayan, S.E.; Park, J.; Selwyn, G.S.; Hicks, R.F. The atmospheric-pressure plasma jet: A review and comparison to other plasma sources. IEEE Trans. Plasma Sci. 1998, 26, 1685–1694. [Google Scholar] [CrossRef]
- Laroussi, M.; Akan, T. Arc-free atmospheric pressure cold plasma jets: A review. Plasma Process. Polym. 2007, 4, 777–788. [Google Scholar] [CrossRef]
- Bornholdt, S.; Wolter, M.; Kersten, H. Characterization of an atmospheric pressure plasma jet for surface modification and thin film deposition. Eur. Phys. J. D 2010, 60, 653–660. [Google Scholar] [CrossRef]
- Fricke, K.; Steffen, H.; Von Woedtke, T.; Schröder, K.; Weltmann, K.D. High rate etching of polymers by means of an atmospheric pressure plasma jet. Plasma Process. Polym. 2011, 8, 51–58. [Google Scholar] [CrossRef]
- Shashurin, A.; Keidar, M.; Bronnikov, S.; Jurjus, R.; Stepp, M. Living tissue under treatment of cold plasma atmospheric jet. Appl. Phys. Lett. 2008, 93, 181501. [Google Scholar] [CrossRef]
- Hsu, Y.-w.; Li, H.-C.; Yang, Y.-J.; Hsu, C.-C. Deposition of zinc oxide thin films by an atmospheric pressure plasma jet. Thin Solid Film. 2011, 519, 3095–3099. [Google Scholar] [CrossRef]
- Mikkelsen, M.; Jorgensen, M.; Krebs, F.C. The teraton challenge. A review of fixation and transformation of carbon dioxide. Energy Environ. Sci. 2010, 3, 43–81. [Google Scholar] [CrossRef]
- Centi, G.; Quadrelli, E.A.; Perathoner, S. Catalysis for CO2 conversion: A key technology for rapid introduction of renewable energy in the value chain of chemical industries. Energy Environ. Sci. 2013, 6, 1711–1731. [Google Scholar] [CrossRef]
- Pruess, K. Enhanced geothermal systems (EGS) using CO2 as working fluid—A novel approach for generating renewable energy with simultaneous sequestration of carbon. Geothermics 2006, 35, 351–367. [Google Scholar] [CrossRef]
- Snoeckx, R.; Bogaerts, A. Plasma technology—A novel solution for CO2 conversion? Chem. Soc. Rev. 2017, 46, 5805–5863. [Google Scholar] [CrossRef]
- Ashford, B.; Tu, X. Non-thermal plasma technology for the conversion of CO2. Curr. Opin. Green Sustain. Chem. 2017, 3, 45–49. [Google Scholar] [CrossRef]
- Nekano, J.; Suzuki, M. Oxidation mechanism in rf CO2 plasma. Vacuum 1986, 36, 85–88. [Google Scholar] [CrossRef]
- Balat, M.; Berjoan, R.; Pichelin, G.; Rochman, D. High-temperature oxidation of sintered silicon carbide under pure CO2 at low pressure: Active–passive transition. Appl. Surf. Sci. 1998, 133, 115–123. [Google Scholar] [CrossRef]
- Li, Y.L.; Ishigaki, T. Controlled One-Step Synthesis of Nanocrystalline Anatase and Rutile TiO2 Powders by In-Flight Thermal Plasma Oxidation. J. Phys. Chem. B 2004, 108, 15536–15542. [Google Scholar] [CrossRef]
- Zhou, Q.; Zhao, Z.; Chen, Y.; Hu, H.; Qiu, J. Low temperature plasma-mediated synthesis of graphene nanosheets for supercapacitor electrodes. J. Mater. Chem. 2012, 22, 6061–6066. [Google Scholar] [CrossRef]
- Xu, C.-H.; Chen, J.-Z. Atmospheric-pressure plasma jet processed SnO2/CNT nanocomposite for supercapacitor application. Ceram. Int. 2016, 42, 14287–14291. [Google Scholar] [CrossRef]
- Liao, C.-Y.; Kuok, F.-H.; Chen, C.-W.; Hsu, C.-C.; Chen, J.-Z. Flexible quasi-solid-state SnO2/CNT supercapacitor processed by a dc-pulse nitrogen atmospheric-pressure plasma jet. J. Energy Storage 2017, 11, 237–241. [Google Scholar] [CrossRef]
- Kuok, F.H.; Kan, K.Y.; Yu, I.S.; Chen, C.W.; Hsu, C.C.; Cheng, I.C.; Chen, J.Z. Application of atmospheric-pressure plasma jet processed carbon nanotubes to liquid and quasi-solid-state gel electrolyte supercapacitors. Appl. Surf. Sci. 2017, 425, 321–328. [Google Scholar] [CrossRef]
- Chang, J.-H.; Lin, M.-F.; Kuo, Y.-L.; Yang, C.-R.; Chen, J.-Z. Flexible rGO-SnO2 supercapacitors converted from pastes containing SnCl2 liquid precursor using atmospheric-pressure plasma jet. Ceram. Int. 2021, 47, 1651–1659. [Google Scholar] [CrossRef]
- Khan, M.; Rehman, N.; Khan, S.; Ullah, N.; Masood, A.; Ullah, A. Spectroscopic study of CO2 and CO2–N2 mixture plasma using dielectric barrier discharge. AIP Adv. 2019, 9, 085015. [Google Scholar] [CrossRef]
- Ray, D.; Saha, R. DBD plasma assisted CO2 decomposition: Influence of diluent gases. Catalysts 2017, 7, 244. [Google Scholar]
- Pearse, R.W.B.; Gaydon, A.G. Identification of Molecular Spectra; Chapman and Hall: London, UK, 1976. [Google Scholar]
- Fendrych, F.; Taylor, A.; Peksa, L.; Kratochvilova, I.; Vlcek, J.; Rezacova, V.; Petrak, V.; Kluiber, Z.; Fekete, L.; Liehr, M.; et al. Growth and characterization of nanodiamond layers prepared using the plasma-enhanced linear antennas microwave CVD system. J. Phys. D Appl. Phys. 2010, 43. [Google Scholar] [CrossRef]
- Lien, S.Y.; Chang, Y.Y.; Cho, Y.S.; Wang, J.H.; Weng, K.W.; Chao, C.H.; Chen, C.F. Characterization of HF-PECVD a-Si:H thin film solar cells by using OES studies. J. Non Cryst. Solids 2011, 357, 161–164. [Google Scholar] [CrossRef]
- Chaffin, J.H.; Bobbio, S.M.; Inyang, H.I.; Kaanagbara, L. Hydrogen production by plasma electrolysis. J. Energy Eng. 2006, 132, 104–108. [Google Scholar] [CrossRef]
- Gaens, W.V.; Bogaerts, A. Kinetic modelling for an atmospheric pressure argon plasma jet in humid air. J. Phys. D Appl. Phys. 2013, 46, 275201. [Google Scholar] [CrossRef]
- Chien, H.-H.; Cheng, Y.-C.; Hao, Y.-C.; Hsu, C.-C.; Cheng, I.C.; Yu, I.-S.; Chen, J.-Z. Nitrogen DC-pulse atmospheric-pressure-plasma jet (APPJ)-processed reduced graphene oxide (rGO)-carbon black (CB) nanocomposite electrodes for supercapacitor applications. Diam. Relat. Mat. 2018, 88, 23–31. [Google Scholar] [CrossRef]
- Chastain, J.; King, R.C., Jr. Handbook of X-ray photoelectron spectroscopy. Perkin Elmer Corp. 1992, 40, 221. [Google Scholar]
- Gorzalski, A.S.; Donley, C.; Coronell, O. Elemental composition of membrane foulant layers using EDS, XPS, and RBS. J. Membr. Sci. 2017, 522, 31–44. [Google Scholar] [CrossRef]
- Zhang, T.C.; Kim, C.H.J.; Cheng, Y.W.; Ma, Y.W.; Zhang, H.B.; Liu, J. Making a commercial carbon fiber cloth having comparable capacitances to carbon nanotubes and graphene in supercapacitors through a “top-down” approach. Nanoscale 2015, 7, 3285–3291. [Google Scholar] [CrossRef] [PubMed]
- Hsu, A.R.; Chien, H.H.; Liao, C.Y.; Lee, C.C.; Tsai, J.H.; Hsu, C.C.; Cheng, I.C.; Chen, J.Z. Scan-Mode Atmospheric-Pressure Plasma Jet Processed Reduced Graphene Oxides for Quasi-Solid-State Gel-Electrolyte Supercapacitors. Coatings 2018, 8, 52. [Google Scholar] [CrossRef]
- Bonu, V.; Gupta, B.; Chandra, S.; Das, A.; Dhara, S.; Tyagi, A.K. Electrochemical supercapacitor performance of SnO2 quantum dots. Electrochim. Acta 2016, 203, 230–237. [Google Scholar] [CrossRef]
- Binitha, G.; Soumya, M.S.; Madhavan, A.A.; Praveen, P.; Balakrishnan, A.; Subramanian, K.R.V.; Reddy, M.V.; Nair, S.V.; Nair, A.S.; Sivakumar, N. Electrospun alpha-Fe2O3 nanostructures for supercapacitor applications. J. Mater. Chem. A 2013, 1, 11698–11704. [Google Scholar] [CrossRef]
- Okhay, O.; Tkach, A. Graphene/Reduced Graphene Oxide-Carbon Nanotubes Composite Electrodes: From Capacitive to Battery-Type Behaviour. Nanomaterials 2021, 11, 1240. [Google Scholar] [CrossRef]
- Ardizzone, S.; Fregonara, G.; Trasatti, S. “Inner” and “outer” active surface of RuO2 electrodes. Electrochim. Acta 1990, 35, 263–267. [Google Scholar] [CrossRef]
- Tiwari, P.; Jaiswal, J.; Chandra, R. Hierarchal growth of MoS2@CNT heterostructure for all solid state symmetric supercapacitor: Insights into the surface science and storage mechanism. Electrochim. Acta 2019, 324, 134767. [Google Scholar] [CrossRef]
- Huang, C.; Zhang, J.; Young, N.P.; Snaith, H.J.; Grant, P.S. Solid-state supercapacitors with rationally designed heterogeneous electrodes fabricated by large area spray processing for wearable energy storage applications. Sci. Rep. 2016, 6. [Google Scholar] [CrossRef] [PubMed]
- Shao, J.J.; Zhou, X.Y.; Liu, Q.; Zou, R.J.; Li, W.Y.; Yang, J.M.; Hu, J.Q. Mechanism analysis of the capacitance contributions and ultralong cycling-stability of the isomorphous MnO2@MnO2 core/shell nanostructures for supercapacitors. J. Mater. Chem. A 2015, 3, 6168–6176. [Google Scholar] [CrossRef]
- Song, Z.; Zhang, Y.; Liu, W.; Zhang, S.; Liu, G.; Chen, H.; Qiu, J. Hydrothermal synthesis and electrochemical performance of Co3O4/reduced graphene oxide nanosheet composites for supercapacitors. Electrochim. Acta 2013, 112, 120–126. [Google Scholar] [CrossRef]
- Zhang, Y.X.; Liu, Y.; Bai, Y.F.; Liu, Y.P.; Xie, E.Q. Boosting the electrochemical properties of carbon materials as bipolar electrodes by introducing oxygen functional groups. RSC Adv. 2020, 10, 35295–35301. [Google Scholar] [CrossRef]
Publisher’s Note: MDPI stays neutral with regard to jurisdictional claims in published maps and institutional affiliations. |
© 2021 by the authors. Licensee MDPI, Basel, Switzerland. This article is an open access article distributed under the terms and conditions of the Creative Commons Attribution (CC BY) license (https://creativecommons.org/licenses/by/4.0/).