Abstract
Tensile deformation behavior and microstructure of nickel-base superalloy Inconel 625 are investigated under different strain rates of 5 × 10⁻⁴ s−1 and 5 × 10⁻⁵ s−1. According to the experimental results, yield strength and ultimate tensile strength of the alloy increase with the increase in strain rate in room temperature. Microstructure results indicate that the size of dimples is smaller in the tensile fracture surface at low strain rate than the high strain rate, and the number of dimples is also related to the strain rates and twins appear earlier in the specimens with higher strain rates. Apart from Hollomon and Ludwik functions, a new formula considering the variation trend of strength in different deformation stages is deduced and introduced, which fit closer to the tensile curves of the 625 alloy used in the present work at both strain rates. Furthermore, the Schmid factors of tensile samples under two strain rates are calculated and discussed. In the end, typical work hardening behavior resulting from the dislocations slip behavior under different strain rates is observed, and a shearing phenomenon of slip lines cross through the δ precipitates due to the movement of dislocations is also be note.
1. Introduction
Inconel 625 superalloy is extensively used as a structural material in aeronautical, petrochemical, and marine industries because of excellent high-temperature mechanical properties and resistance to severely aggressive corrosive environments especially in applications require a moderate strength at temperatures below 1200 °C [1,2,3,4]. Generally, the alloy derives its strength from the solid-solution hardening effect by adding substitutional alloying elements chromium (Cr) and molybdenum (Mo). In addition, during the aging process, in the austenite matrix at the temperature range of 600–650 °C [5], precipitation hardening of this alloy is mostly born of the precipitation of delicate metastable phase γ (an ordered body-centered tetragonal structure with Ni3Nb stoichiometry), the equilibrium phase δ (an ordered orthorhombic structure), formed directly during aging at 750 °C and above or by a transformation of the metastable γ phase [6,7], and the intergranular precipitations Laves phase also the blocky MC (M denotes Nb, Ti), M6C (M denotes Si, Ni, Cr), and M23C6 (M denotes Cr) carbides [8,9,10].
Strain hardening behavior is a critical factor in evaluating the plastic deformation of materials, especially for different strain rates [11,12,13]. Zheng et al. [14] studied the effect of temperature and strain rate on tensile properties of UNS N10276 and correlated the fracture modes with the mechanical properties gained from the tensile tests. Ajit K. Roy et al. [15] presented a mechanistic understanding of relation of the plastic deformation of Alloy C-276 and its temperature and strain rate. Two strengthening mechanisms in Inconel 718 alloy based on the values of strain-hardening coefficient is identified by Sundararaman et al. [7] as: (i) when n~0.85, the fracture mode exhibits shearing of γ precipitate particles by dislocations; (ii) when n < 0.57, the fracture mode exhibits twinning within γ particles. The activation of the local slip on multiple slip system is found by ALAN Xu et al. [16], which caused strain hardening during in situ micro-tensile tests. Moreover, an increase in strain rate causes an increase in flow stress for single Ni crystals during tensile test along <100> and <110> directions. Zhang et al. [16] investigated the strain hardening behavior and deformation microstructure of single crystal superalloys CMSX-4, and calculated strain hardening rate with several empirical equations. Vani Shankar et al. [3] also calculated the values of strain-hardening coefficient and exponent of thermally aged service exposed 625 alloy using experimental functions. J. Mittra et al. [17] investigated the deformation behavior of Alloy 625 in precipitated and unaged conditions, and explained the deformation phenomena with deformation microstructure and various parameters obtained from the work-hardening analysis.
Thus far, only a few works have been published that study the strain hardening behavior, and the strain rate sensitivity of Inconel 625 alloy, an empirical fitting formula of flow stress curves specially for this material is scarely seen in the open literature. The current study aims to analysis the strain hardening behavior and failure mechanism of Inconel 625 alloy through micro-tensile tests at two different strain rates and to fit the strain hardening exponent with different empirical equations and a modified ‘hybrid’ equation. Then, the electron microscopy was used to observe the fracture surface and to define the slip properties and dislocation distribution, and to study the deformation behavior and failure mechanism under both strain rates. In the following content, the experimental procedures are described in Section 2. In Section 3, the hardening exponent is calculated using a different fit equation, and deformation microstructure characterization at different strain rates about 2.0% plastic strain is observed and presented. Furthermore, the Schmid factor is calculated, and the compressive strength and deformation mechanics are analyzed. After that, the conclusion is presented in Section 4.
2. Experimental Procedure
The material was solution treated at 1200 °C for 2 h followed by water quenched immediately and the chemical composition of Inconel 625 alloy used in this work is provided by the manufacturer which is presented in Table 1. Tensile tests were performed on test system SHIMADZU AGX 100 (SHIMADZU CORPORATION, Kyoto, Japan) at two different strain rates, i.e., 5 × 10 −4 s−1 and 5 × 10 −5 s−1, respectively, at room temperature (RT). The micro-specimens for monotonic tensile testing were designed as the micro-plate shape referring to the international standard and previous work [16,18], as shown in Figure 1. Three specimens were tested at each strain rate, and one of the three specimens was interrupted at around 2.0% plastic strain to study the deformation structure.

Table 1.
Chemical composition (wt.%) of the Inconel 625 alloy used for the current study.
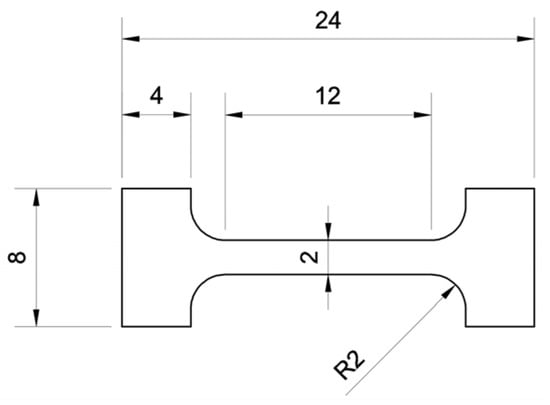
Figure 1.
The geometry of the tensile test specimens (unit: mm).
To check the microstructure before the tests, specimens for microstructural observation were wet ground with 400~1200 grit SiC papers and then were etched in a solution of H2SO4 and CH3OH with a volume ratio of 1:4. After that, the microstructure of as-received material is detected using Quanta 450F scanning electron microscope (SEM) (FEI NanoPorts, Hillsboro, OR, USA) with HKL Channel 5 electron backscattering dif-fraction (EBSD), and FEI-TALOS F200X transmission electron microscope (TEM) (Oxford Instruments, Oxford, UK) with Super-XTM EDS detector at 200 kV voltage, respectively. In the end, morphologies of the fracture surfaces of the specimens were observed by scanning electron microscope (SEM).
3. Results and Discussion
3.1. Initial Microstructure
Quantification of microstructure characteristics was achieved by EBSD. Pole figures show that there is no obvious texture in the material and the statistical results show that the sample mainly consists of equiaxed grains and the average grain size is 11.61 µm. The graphic of the frequency of the grain misorientation distribution of the as-received alloy, presented in Figure 2d, exhibits a relatively high fraction of low angle grain boundaries (LAGBs, θ < 15°) [19] caused by the presence of substructures created by a large number of dislocations. These structures can hinder the slip of dislocations explaining to some extent the high tensile strengths of the superalloy [20]. Moreover, a significant level of misorientation about 60 deg indicates an array of twins in the as-received materials [21].
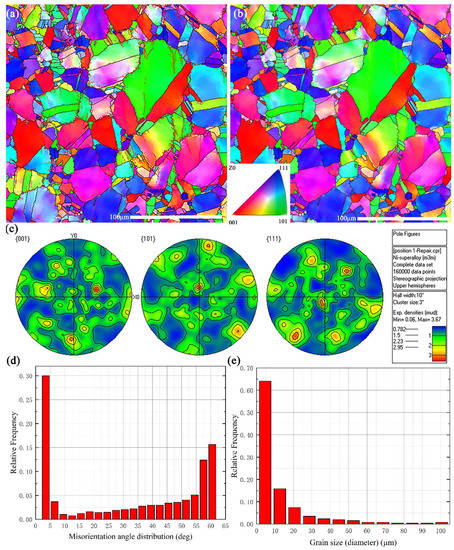
Figure 2.
EBSD characterization of Inconel 625: (a) inverse pole figure with grain boundaries, (b) inverse pole figure with high angle grain boundaries, (c) pole figure, (d) misorientation angle distribution, (e) grain size distribution.
Furthermore, the main composed phase in as-received Inconel 625 superalloy presented in Figure 3 by TEM images is γ phase, and the needled morphology distributed within the grains and at their boundaries suggests δ phase [22]. Apart from the needled-like δ phase, a globular precipitate is also be found in the intergranular regions.
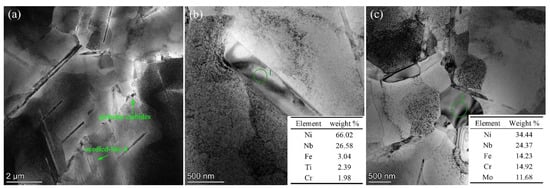
Figure 3.
(a) TEM microstructure of the as-received sample; (b,c) EDS pattern of the selected areas.
To differentiate the identity of these precipitates, two areas, labeled 1 and 2, respectively, in Figure 3b,c, were selected for the TEM observations and EDS pattern microanalysis. For precipitate 1, based on its chemical analysis result, the average composition of this needled-like precipitation was determined for the major concentrations of Ni, Nb, Fe, Ti, Cr. The results confirm that it is δ phase [1,23,24,25]. As to the large blocky precipitate 2, the EDS analysis results of this area revealed that this polygonal shaped precipitate was Laves phase, which is consistent observed by Wang et al. [26,27,28,29]. To summarize, according to the SEM and TEM observations, it can be claimed that the δ phase is present in the γ matrix, and a few brittle phase of Inconel 625, Laves particles can be found at grains boundaries [30,31].
3.2. Dependence on Strain Rate of Tensile Behavior
The stress–strain curves under different strain rates were shown in Figure 4. All the specimens show a similar performance during the whole elastic stage. However, no apparent serrated flow behavior was observed on the micro-plasticity stage. As to the macro-plasticity stage, with continuous deformation, the true stress increases until fracture. It was evident that the yield strength and the ultimate tensile strength increase with increasing strain rate from 5 × 10⁻⁴ s−1 to 5 × 10⁻⁵ s−1 as illustrated in Table 2.
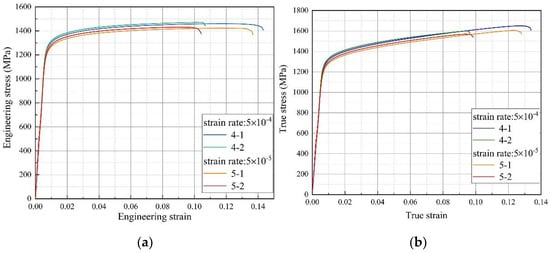
Figure 4.
The tensile curves at different strain rates: (a) engineering stress–strain curves, (b) true stress-true strain curves.
Table 2.
Mechanical properties of Inconel 625 at two strain rates.
Besides, from Figure 4, a significant strain rate sensitivity was observed above the elastic limit. To evaluate the strain hardening behavior, the hardening capacity Hc of Inconel 625 can be described as following [32],
Considering no obvious yield point in the stress–strain curves, σY is determined as the engineering stress proof 0.2% plastic deformation, and σUTS is the ultimate tensile strength. The Hc value of each specimen was calculated and listed in Table 3. However, a small gap of Hc between both strain rates is not sufficient to justify the hardening capacity of the superalloy. To further confirm the strain hardening behavior of the superalloy, the strain hardening exponent (n) of the alloy was evaluated using several mathematical expressions, which are the most common. However, it is not surprising that these empirical equations can not accurately describe the stress–strain curves for a specified metals. Thus, the aim of this section is to study the applicability of two types (unsaturation extrapolation formula and saturated extrapolation formula) widely used fit functions [33,34] for the estimation of the n exponent, and to suggest an improved stress–strain fitting model.
Table 3.
Hardening index of Inconel 625 at two strain rates.
The unsaturated model is represented by classical Hollomon [35] and Ludwik equation [13,36]. The Hollomon model is a typical full-strain model, which describes that the material strength increases in the form of power of constant hardening coefficient (n) during the whole process of deformation. The Ludwik model is an evolution of the Hollomon model with a fixed initial value. The extrapolated stress value of the Hollomon and Ludwik model has no upper limit, and they are written, respectively, as the following:
where n1 and n2 are the strain hardening exponent; K1 and K2 are the strength parameters of the superalloy; σ and σy are true stress and yield stress, respectively; ε is the true strain and εy used in Equation (3) is the true strain before yielding, which means the Ludwik equation only considers the true plastic deformation stage (i.e., between yield strength and ultimate tensile strength) for the curve fitting.
The variations in true stress (σ) with the true strain (ε) and true plastic strain (ε − εY) were, respectively presented as double logarithmic plots in Figure 5. The hardening exponent (n1, n2) is determined as the slope of the corresponding curve, as shown in Table 3. Calculation results of n1 and n2 expose a similar rule that hardening exponent increases with increasing strain rate. This distinctly indicates that the strain hardening stages of the Inconel 625 alloy used in this work are related to the strain rate. It must be pointed out that a much higher growth of n2 at strain rate from 5 × 10⁻⁴ s−1 to 5 × 10⁻⁵ s−1, fitted by Equation (3) than that of n1 was strongly due to Equation (3) exclusive the impact of elastic deformation stage based on Hook’s law which has no contribution for strain hardening. Accordingly, the index n2 is more sensitive to the strain rate than n1 fitted by the Hollomon equation.
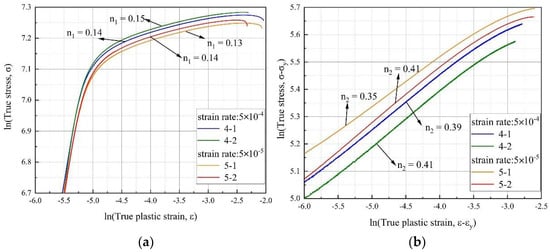
Figure 5.
The strain hardening exponent of Inconel 625 at two strain rates: (a) strain hardening exponent using Equation (2), and (b) Equation (3).
Referring to the above mentioned, model with the constant initial value, i.e., start from the yield point (0, σY) seems to be more suitable for the hardening exponent calculation. However, as the stress increases indefinitely with the strain increases, the unsaturated extrapolation model shows deficiencies at the end of the deformation as presented in Figure 6 (blue dotted line). On this basis, saturated extrapolation model introduced the concept of hardening factor is of great significance in describing the large strain stage, in which Hockett–Sherby (H–S) [37] is a typical model, as follows:
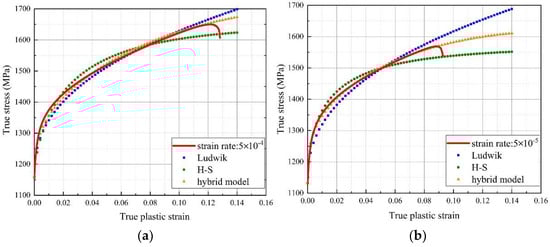
Figure 6.
The fitting curves of Inconel 625 by different equations. (a) 5 × 10⁻⁴ s −1 and (b) 5 × 10⁻⁵ s −1.
m1 is material constant; σ∞ is the stress at fracture.
The fitting curves of H–S method were shown in Figure 6. It is not hard to find that when the material starts to yield, flow stress rises rapidly, and the Ludwik equation is better fit for this stage than the H–S, then as the strain increases, unsaturated extrapolation loss accuracy, in contrast, H–S curves match better with the true case. At this point, a key problem of these above-mentioned fit equations appears: How to find a more appropriate formula, that considers both specialties of the whole variation trend. Hence, a hybrid method consists of the Ludwik and the H–S equation with a strain-dependent factor Φ is presented as below:
where Φ = cε/ε∞, ε∞ is the strain at fracture; n* is the hardening exponent; m2, c and K are the material constant. Relevant parameters of the hybrid model and the relative error are in Table 4. Error analysis was realized by taking relative error (RE) of curve integral, where the error is defined as:
where, σFIT, σEXP are the fitted stress and experimental stress, respectively; εP is the true plastic strain. The error results show that the curve fitted by the hybrid model has the highest approximation to the measured curve, and its relative error reaches 0.48% and 0.79% at 5 × 10 −4 s−1 and 5 × 10 −5 s−1, respectively.
Table 4.
Fitting parameters of different model.
In addition, according to the change in strain, this new hybrid model contributes to harmonizing the proportion of saturated and unsaturated equations. Obviously, the divergence of flow stress control by the Ludwik equation decreases significantly, as H–S gradually takes its effect with the increase in true plastic strain. The fit curves of these models can be seen in Figure 6, in which Ludwik and H–S fitting curves show their limitations, hybrid model, by contrast, always keeps consistent with the true curve and the hardening exponents obtained by the new method were also listed in Table 3. The largest gap of n* from 0.3 to 0.35 between two strain rates indicates the material’s strain rate sensitivity, whereas a dramatic increase in stress at the latter stage of deformation leads to a higher value of n2 fitted by Ludwik equation. Analysis of exponents also confirms the applicability of this new hybrid model for specified 625 superalloys.
3.3. Fracture Pattern and Microstructure Morphology
According to the above investigation, the tensile properties of Inconel 625 superalloy depend strongly on the strain rates, resulting in different fracture patterns at both strain rates. In that way, the representative SEM micrographs of fracture morphology of the specimens after tensile tests show quite different features, as shown in Figure 7.
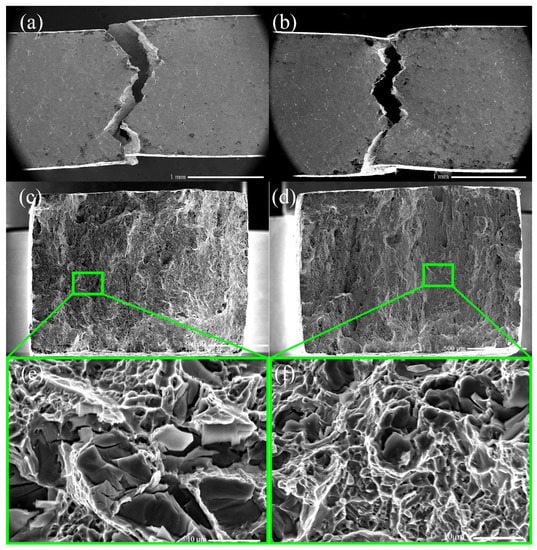
Figure 7.
The SEM microstructure of Inconel 625 superalloys after tensile tests, fracture and magnified view of fracture (a,c,e) 5 × 10⁻⁴ s −1 (b,d,f) 5 × 10⁻⁵ s −1.
A slight neck can be observed at both strain rates, as shown in Figure 7a,b, which indicates that local plasticity presents before final failure. There is a flat fracture surface with river patterns and fine and shallow dimples on the fracture surface at 5 × 10⁻⁵ s−1 presented in Figure 7d,f, which show ductile fracture mode by the occurrence of dimples on the fracture surface. Comparing to the low strain rate, a large number of transgranular cracks can be observed from the specimens destroyed under 5 × 10⁻⁴ s−1 in Figure 7c. However, the tensile fracture of high strain rate is mixed mode of fracture though the failure was predominantly intercrystalline. It should also be indicated that the dimple size increases with the increasement of the strain rate.
To study the deformation mechanism and dislocation configuration, the TEM images of interrupted tensile tests (2.0% plastic strain excluding elastic strain) as shown in Figure 8 and are gathered for the following analysis. All the deformed samples show planar slip with high dislocation density. Some specific slip bands (Figure 8a) consisted of dislocation structure of densely packed primary and secondary dislocations was observed in the gauge length [38,39]. A few nano deformation twins are occasionally observed in several grains [40] at 5 × 10⁻⁴ s−1 without 5 × 10⁻⁵ s−1, see Figure 8b Generally, in face-centered cubic (FCC), twinning is facilitated through lower stacking fault energy (SFE) and special deformation conditions (such as low deformation temperatures or high strain rates) [41,42]. For Inconel 625, as an FCC metal with low SFE, the deformation mechanism is twinning ({111}<112>) and dislocation slip ({111}<110>) through the tensile deformation modes [43]. Therefore, slip is the main deformation mode during the initial stages of tensile deformation under both strain rates. After dislocation multiplication and tangle formation, further deformation results in dislocation cross slip being suppressed to that extent the cross slip of Shockley partial dislocations could lead to intrinsic stacking faults on parallel {111} planes, leading to twins [44]. Thus, twinning is the other deformation mode during the futher stages of tensile deformation, and twin boundaries act as strong obstacles to the dislocation motion, resulting in improvement of alloy strength [45,46]. Li et al. [47] has also found the deformation twins in other alloys, and demonstrate that this critical change of deformation mechanisms from dislocation slips to twinning behavior is responsible for such an increasing of hardening exponent (n) value from 5 × 10⁻⁵ s−1 to 5 × 10⁻⁴ s−1. This is consistent with our experimental results.
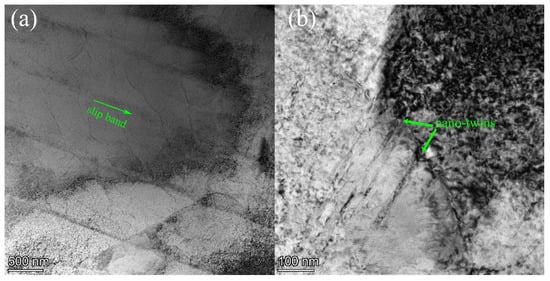
Figure 8.
The TEM microstructure of Inconel 625 superalloys at 2.0% plastic strain. (a) slip band (b) nano deformation twin at 5 × 10⁻⁴ s −1 sample.
In addition, the typical planar slip during deformation is dicided by the Schmid factor and yield stress. With the consideration of the crystal orientation, the critical resolved shear stress (CRSS) can be determined as following with Schmid’s law [48].
where M is Schmid factor.
To define the relationship between Schmid factor and slip, a free MATLAB toolbox MTEX [49] was used to calculate the Schmid factor and visualize the active slip systems of a given EBSD map in Figure 9. The Schmid factor on different slip systems and CRSS of a typical grain is presented in Table 5.

Figure 9.
Schematic of slip direction calculated by MTEX.
Table 5.
Slip behaviour and CRSS of Inconel 625 at two strain rates.
The slip direction calculated by MTEX (white arrow) is in accordance with the EBSD map presented in Figure 9. and the results show possible primary slip system was (−1, 1, −1) [0, −1, −1], the secondary slip system (111) [0, −1, 1] and the third slip system (−1, 1, 1) [1, 0, 1] are activated during tensile tests. Furthermore, the max CRSS value on the strain rate of 5 × 10⁻⁴ s−1 is 573.72 Mpa, which is higher than 547.91 MPa at 5 × 10⁻⁵ s−1. It indicates that CRSS value can be affected by the strain rate, which can be explained with the Taylor equation;
where α is a constant measuring the efficiency of dislocation strengthening, G is the shear modulus and b is the Burgers vector, hence it is clear that shear stress (τ) is directly related to the final dislocation density (ρ).
3.4. Failure Mechanism
In this section, the work-hardening concepts were induced to explain and predict the stress–strain response of the alloy from the point of dislocation theosries, and the work-hardening rate of 625 superalloy shows an increase with increasing strain rate. As seen in the Kocks–Mecking type plot of strain hardening rate θ (=dσ/dε); vs. net flow stress (σ − σY) at two strain rates of the Inconel 625 superalloy, as shown in Figure 10, work-hardening behaviour of this alloy is characterized by an initial sharp fall in θ, followed by satge II, i.e., a plateau and then a further gradual fall can be denoted as stage III work-hardening, respectively [17].
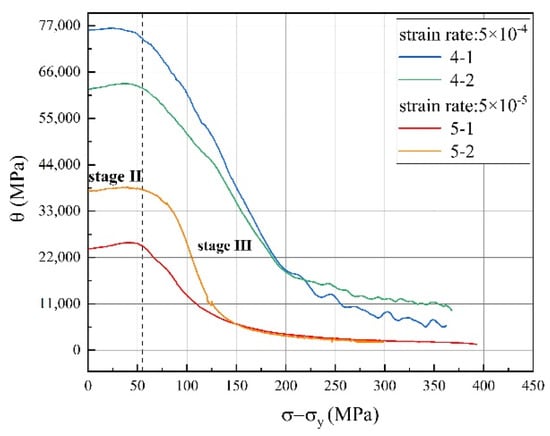
Figure 10.
The strain hardening rate and exponent of Inconel 625 at two different strain rates.
Stage II is characterized by a high initial θ value that almost stabilised at a constant, and such a behaviour is attributed to an initially linear stage II strain hardening behaviour [12]. Additionally, the stress reaches the CRSS, one or more slip systems are activated in this stage. Meanwhile, dislocation shear into δ phase has been observed, as shown in Figure 11, which plays an important role in controlling the tensile performance of the alloy. As to stage III, the sharp drop in the slope of the sample under 5 × 10 −4 s−1, as shown in Figure 10, occurs earlier than that of the low strain rate sample. This indicates a premature recovery process occurs on a high strain rate sample, speculated as once the recovery process starts in the specimen with higher dislocation density, it goes faster than the other [17].
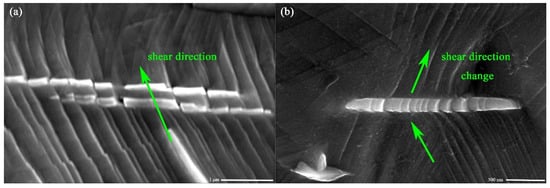
Figure 11.
Slip line shear into δ phase. (a) 5 × 10⁻⁴ s −1; (b) 5 × 10⁻⁵ s −1.
Based on the above discussion, a model about strain hardening takes into account to explain the strain hardening behavior of this alloy [50],
where σ0 is the stress contributed by the friction; σHP = kd1/2 is contributed by the Hall–Petch; σd = MαGbρ1/2 is contributed by the Taylor dislocation.
σ = σ0 + σHP + σd
During deformation, the gliding of dislocation causes plastic strain in the material. As the strain increases, the material begins to yield, dislocations nucleate, and interact, leading to dislocation density increases. Thus stress contribution caused by dislocation density can be written as the total flow stress subtracting the yield stress,
ρ1/2 ∝ σd − σy
The applied stress necessary to deformation is obviously proportional to the dislocation density in the material. Thus far, dislocation density is affirmed necessary in this investigation. The magnitude ρ was determined by the line intersection method [51,52,53] based on the superimposition of a grid consisting of horizontal and vertical test lines on the TEM micrographs that contained dislocations of the specimens at both strain rates. Since here we only need to compare the different influence between the two strain rates qualitatively, we can briefly distinguish the dislocation density of different strain rates by computing the average number of intersections of each test lines with dislocations. To simplify the computing process further, the grid was drawn as a square, as illustrated in Figure 12. For each strain rate, two pictures were used, and for each picture, we grid two areas that unaffected by the precipitate, then the computing results are listed in Table 6.
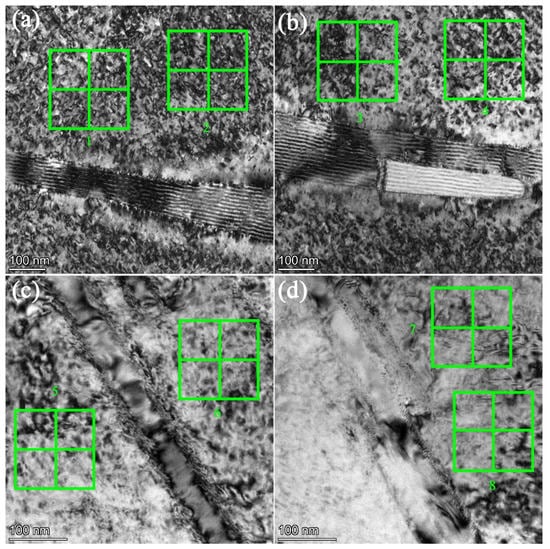
Figure 12.
TEM micrograph used to calculate ρ. (a,b) 5 × 10⁻⁴ s −1; (c,d) 5 × 10⁻⁵ s −1.
Table 6.
The number of dislocation under both strain rates.
However, the average values of intersection number determined from the TEM micrographs of tensile specimens strained at 5 × 10⁻⁴ s−1 was relatively higher than the low stain rate ones 5 × 10⁻⁵ s−1. This can also be verified by examining the TEM micrographs presented in Figure 11, showing the denser population of dislocations at this strain rate. Essrntially, the number and velocity of dislocations are improved at a high strain rate, which accompanied with the increasing of the dislocation density per unit area. Accordingly, the high initial dislocation density in the high strain rate specimens might have contributed to the initial high and nearly constant strain hardening rate (i.e., stage II linear hardening shown in Figure 10 of the specimens under 5 × 10⁻⁵ s−1. This suggests that much higher activation energy is required for the plastic flow due to powerful barriers to the dislocation movement [54]. As described by reference [12], a positive work hardening stage II occurs due to continuous reduction in mean free path during dislocation–dislocation interaction and dislocation pileups at the grain boundary. Thus, the Taylor dislocation contribution σd = MαGbρ1/2 in Equation (7) dominates this region. The increasing of the number of dislocations leads to the increasing of the resistance to the dislocation movement, and the stress required to deform the materials becomes higher with increasing deformation. This is in accordance with Zhang’s results in nickel-based superalloy [16].
Moreover, an interesting phenomenon worth to note is that the original shearing direction changes when dislocations slip shear through the δ phase under a low strain rate, see Figure 11. In contrast, under a high strain rate, shearing is always in the same direction. The following statement may interpret this strain rate related performance: When experiments were carried out at a high strain rate, with a high per unit time strain, the inside of the material is subjected to more intense deformation per unit time, which means more energy is imported to help dislocations go through the obstacle. On the opposite, low strain rate specimens cannot cross the δ phase directly. Therefore, shearing direction will change to the pass with the lowest energy cost [55,56,57,58].
4. Conclusions
Tensile tests have been conducted on nickel-base superalloy Inconel 625 under two strain rates at RT. The main conclusions derived from this study are as follows:
- (1)
- All the strain–stress curves show a similar trend: no apparent serrated flow on the micro-plasticity stage. During the macro-plasticity stage, the true stress increases until fracture. In contrast, there are differences between different strain rates: with increasing strain rate from 5 × 10⁻⁴ s−1 to 5 × 10⁻⁵ s−1, the yield strength and the ultimate tensile strength increase.
- (2)
- Higher strain rate also results in greater strain hardening exponents. It should also be pointed out that the equation excludes the impact of the elastic deformation stage on Hook’s law, is more appropriate to fit the strain hardening exponents n than the Hollomon equation. In addition, the hybrid model, integrates saturated and unsaturated methods is the most accurate for the calculation of hardening exponents.
- (3)
- The fracture morphologies of tensile specimens depend on the strain rate. Flat fracture surface and dimples can be observed in all the deformed samples. The size of the cleavage facet and dimple increases with the increase in the strain rate.
- (4)
- The strain hardening stages depend on the strain rate. Under a high strain rate, specimens possess a high constant work hardening value at stage II and a high slop in stage III. The original shearing direction changes when dislocations slip shear through the δ phase under a low strain rate, while under a high strain rate, shearing is always along the same direction.
Author Contributions
Conceptualization, H.Z. and M.L.; methodology, M.L.; software, Y.C.; validation, T.W., Y.P. and Y.L.; formal analysis, M.L.; investigation, Q.W. (Quanyi Wang); resources, Y.L.; data curation, Y.C.; writing—original draft preparation, M.L.; writing—review and editing, H.Z.; visualization, D.L.; supervision, Y.L.; project administration, Q.W. (Qingyuan Wang); funding acquisition, H.Z. All authors have read and agreed to the published version of the manuscript.
Funding
This work was supported by the National Natural Science Foundation of China (No. 11832007, No. 11772209, No. 12022208) and China Postdoctoral Science Foundation (No. 2019M653396), the Si-chuan Province Science and Technology Support Program (No. 2019JDS0006), the Sichuan University & ZiGong government Support Program (No. 2019CDZG-4), the Sichuan University & Yibin government Support Program (No. 2019CDYB-24). The authors are sincerely grateful for the financial support provided by the Fundamental Research Funds for the Central Universities, Si-chuan University postdoctoral foundation (No. 2019SCU12056) and State Key Laboratory of Long-life High Temperature Materials (No. DTCC28EE190227). The authors thank Yan Li for performing the experimental tests and Weihua Guo for performing the microstructure tests.
Institutional Review Board Statement
Not applicable.
Informed Consent Statement
Not applicable.
Data Availability Statement
The data presented in this study are available on request from the corresponding author.
Conflicts of Interest
The authors declare no conflict of interest.
References
- Xing, X.; Di, X.; Wang, B. The effect of post-weld heat treatment temperature on the microstructure of Inconel 625 deposited metal. J. Alloys Compd. 2014, 593, 110–116. [Google Scholar] [CrossRef]
- Spinelli, J.; Ferreira, I.; Garcia, A. Influence of melt convection on the columnar to equiaxed transition and microstructure of downward unsteady-state directionally solidified Sn–Pb alloys. J. Alloys Compd. 2004, 384, 217–226. [Google Scholar] [CrossRef]
- Shankar, V.; Valsan, M.; Rao, K.B.S.; Mannan, S. Room temperature tensile behavior of service exposed and thermally aged service exposed alloy 625. Scr. Mater. 2001, 44, 2703–2711. [Google Scholar] [CrossRef]
- Smith, G.; Salzman, T.; Stuerzlinger, W.; Fisher, B.; Dawson-Howe, K.; O’Sullivan, C. 3D scene manipulation with constraints. In Virtual and Augmented Architecture (VAA’01); Metzler, J.B., Ed.; Springer: London, UK, 2001; pp. 35–46. [Google Scholar]
- Chakravartty, J.K.; Singh, J.B.; Sundararaman, M. Microstructural and mechanical properties of service exposed Alloy 625 ammonia cracker tube removed after 100,000 h. Mater. Sci. Technol. 2012, 28, 702–710. [Google Scholar] [CrossRef]
- Singh, J.B.; Chakravartty, J.K.; Sundararaman, M. Work hardening behaviour of service aged Alloy 625. Mater. Sci. Eng. A 2013, 576, 239–242. [Google Scholar] [CrossRef]
- Sundararaman, M.; Mukhopadhyay, P.; Banerjee, S. Deformation behaviour of γ″ strengthened inconel 718—ScienceDirect. Acta Metall. 1988, 36, 847–864. [Google Scholar] [CrossRef]
- Guo, Q.; Li, D.; Guo, S.; Peng, H.; Hu, J. The effect of deformation temperature on the microstructure evolution of Inconel 625 superalloy. J. Nucl. Mater. 2011, 414, 440–450. [Google Scholar] [CrossRef]
- Paul, C.; Ganesh, P.; Mishra, S.; Bhargava, P.; Negi, J.; Nath, A. Investigating laser rapid manufacturing for Inconel-625 components. Opt. Laser Technol. 2007, 39, 800–805. [Google Scholar] [CrossRef]
- Zhang, Y.; Huang, Y.; Yang, L.; Li, J. Evolution of microstructures at a wide range of solidification cooling rate in a Ni-based superalloy. J. Alloys Compd. 2013, 570, 70–75. [Google Scholar] [CrossRef]
- Qin, K.; Yang, L.M.; Hu, S.-S. Interpretation of Strain Rate Effect of Metals, Dynamic Behavior of Materials; Springer: Cham, Switzerland, 2013; Volume 12014, pp. 21–27. [Google Scholar]
- Kocks, U.; Mecking, H. Physics and phenomenology of strain hardening: The FCC case. Prog. Mater. Sci. 2003, 48, 171–273. [Google Scholar] [CrossRef]
- Afrin, N.; Chen, D.; Cao, X.; Jahazi, M. Strain hardening behavior of a friction stir welded magnesium alloy. Scr. Mater. 2007, 57, 1004–1007. [Google Scholar] [CrossRef]
- Pu, E.; Zheng, W.; Song, Z.; Feng, H.; Yang, F.; Dong, H. Effects of temperature and strain rate on tensile deformation behavior of superalloy UNS N10276. Mater. Sci. Eng. A 2017, 699, 88–98. [Google Scholar] [CrossRef]
- Roy, A.K.; Pal, J.; Mukhopadhyay, C. Dynamic strain ageing of an austenitic superalloy—Temperature and strain rate effects. Mater. Sci. Eng. A 2008, 474, 363–370. [Google Scholar] [CrossRef]
- Zhang, H.; Li, P.; Gong, X.; Wang, T.; Li, L.; Liu, Y.; Wang, Q. Tensile properties, strain rate sensitivity and failure mechanism of single crystal superalloys CMSX-4. Mater. Sci. Eng. A 2020, 782, 139105. [Google Scholar] [CrossRef]
- Mittra, J.; Dubey, J.; Kulkarni, U.; Dey, G. Role of dislocation density in raising the stage II work-hardening rate of Alloy 625. Mater. Sci. Eng. A 2009, 512, 87–91. [Google Scholar] [CrossRef]
- ISO. Metallic Materials—Tensile Testing—Part 1: Method of Test at Room Temperature; ISO: Geneva, Switzerland, 2009. [Google Scholar]
- Hu, Y.L.; Lin, X.; Li, Y.L.; Zhang, S.Y.; Gao, X.H.; Liu, F.G.; Li, X.; Huang, W.D. Plastic deformation behavior and dynamic recrystallization of Inconel 625 superalloy fabricated by directed energy deposition. Mater. Des. 2020, 186, 108359. [Google Scholar] [CrossRef]
- Marchese, G.; Parizia, S.; Rashidi, M.; Saboori, A.; Manfredi, D.; Ugues, D.; Lombardi, M.; Hryha, E.; Biamino, S. The role of texturing and microstructure evolution on the tensile behavior of heat-treated Inconel 625 produced via laser powder bed fusion. Mater. Sci. Eng. A 2020, 769, 138500. [Google Scholar] [CrossRef]
- Rivera, O.G.; Allison, P.G.; Jordon, J.B.; Rodriguez, O.L.; Brewer, L.N.; McClelland, Z.; Whittington, W.R.; Francis, D.; Su, J.; Martens, R.L.; et al. Microstructures and mechanical behavior of Inconel 625 fabricated by solid-state additive manufacturing. Mater. Sci. Eng. A 2017, 694, 1–9. [Google Scholar] [CrossRef]
- Kreitcberg, A.; Brailovski, V.; Turenne, S. Elevated temperature mechanical behavior of IN625 alloy processed by laser powder-bed fusion. Mater. Sci. Eng. A 2017, 700, 540–553. [Google Scholar] [CrossRef]
- Wei, Y.; Le, G.; Xu, Q.; Yang, L.; Li, R.; Wang, W. The Interface Microstructures and Mechanical Properties of Laser Additive Repaired Inconel 625 Alloy. Materials 2020, 13, 4416. [Google Scholar] [CrossRef]
- Marchese, G.; Bassini, E.; Parizia, S.; Manfredi, D.; Ugues, D.; Lombardi, M.; Fino, P.; Biamino, S. Role of the chemical homogenization on the microstructural and mechanical evolution of prolonged heat-treated laser powder bed fused Inconel 625. Mater. Sci. Eng. A 2020, 796, 140007. [Google Scholar] [CrossRef]
- Petrzak, P.; Kowalski, K.; Blicharski, M. Analysis of Phase Transformations in Inconel 625 Alloy during Annealing. Acta Phys. Pol. A 2016, 130, 1041–1044. [Google Scholar] [CrossRef]
- Wang, J.; Sun, Q.; Wang, H.; Liu, J.; Feng, J. Effect of location on microstructure and mechanical properties of additive layer manufactured Inconel 625 using gas tungsten arc welding. Mater. Sci. Eng. A 2016, 676, 395–405. [Google Scholar] [CrossRef]
- Xu, F.; Lv, Y.; Liu, Y.; Shu, F.; He, P.; Xu, B. Microstructural Evolution and Mechanical Properties of Inconel 625 Alloy during Pulsed Plasma Arc Deposition Process. J. Mater. Sci. Technol. 2013, 29, 480–488. [Google Scholar] [CrossRef]
- Xu, F.; Lv, Y.; Xu, B.; Liu, Y.; Shu, F.; He, P. Effect of deposition strategy on the microstructure and mechanical properties of Inconel 625 superalloy fabricated by pulsed plasma arc deposition. Mater. Des. 2013, 45, 446–455. [Google Scholar] [CrossRef]
- Verdi, D.; Garrido, M.; Múnez, C.; Poza, P. Mechanical properties of Inconel 625 laser cladded coatings: Depth sensing indentation analysis. Mater. Sci. Eng. A 2014, 598, 15–21. [Google Scholar] [CrossRef]
- Dubiel, B.; Sieniawski, J. Precipitates in additively manufactured Inconel 625 Superalloy. Materials 2019, 12, 1144. [Google Scholar] [CrossRef] [PubMed]
- Ahsan, R.; Fan, X.; Seo, G.-J.; Ji, C.; Noakes, M.; Nycz, A.; Liaw, P.K.; Kim, D.B. Microstructures and mechanical behavior of the bimetallic additively-manufactured structure (BAMS) of austenitic stainless steel and Inconel 625. J. Mater. Sci. Technol. 2021, 74, 176–188. [Google Scholar] [CrossRef]
- Luo, J.; Mei, Z.; Tian, W.; Wang, Z. Diminishing of work hardening in electroformed polycrystalline copper with nano-sized and uf-sized twins. Mater. Sci. Eng. A 2006, 441, 282–290. [Google Scholar] [CrossRef]
- Goijaerts, A.; Govaert, L.; Baaijens, F. Evaluation of ductile fracture models for different metals in blanking. J. Mater. Process. Technol. 2001, 110, 312–323. [Google Scholar] [CrossRef]
- Kleemola, J.H.; Nieminen, A.M. On the strain-hardening parameters of metals. Metall. Trans. 1974, 5, 1863–1866. [Google Scholar] [CrossRef]
- Hollomon, J.H. Tensile deformation. Met. Technol. 1945, 12, 268–290. [Google Scholar]
- Ludwik, P. Elemente der Technologischen Mechanik; Springer: Berlin/Heidelberg, Germany, 1909; pp. 54–57. [Google Scholar]
- Dziallach, S.; Bleck, W.; Blumbach, M.; Hallfeldt, T. Sheet Metal Testing and Flow Curve Determination under Multiaxial Conditions. Adv. Eng. Mater. 2007, 9, 987–994. [Google Scholar] [CrossRef]
- Li, P.; Li, S.; Wang, Z.; Zhang, Z. Unified factor controlling the dislocation evolution of fatigued face-centered cubic crystals. Acta Mater. 2017, 129, 98–111. [Google Scholar] [CrossRef]
- Yan, B.; Cheng, A.; Buchinger, L.; Stanzl, S.; Laird, C. The cyclic stress—strain response of single crystals of Cu-16 at.% Al alloy I: Cyclic hardening and strain localization. Mater. Sci. Eng. 1986, 80, 129–142. [Google Scholar] [CrossRef]
- Xiao, B.; Xu, L.; Zhao, L.; Jing, H.; Han, Y. Tensile mechanical properties, constitutive equations, and fracture mechanisms of a novel 9% chromium tempered martensitic steel at elevated temperatures. Mater. Sci. Eng. A 2017, 690, 104–119. [Google Scholar] [CrossRef]
- Dillamore, I.L. The stacking fault energy dependence of the mechanisms of deformation in Fcc metals. Metall. Trans. 1970, 1, 2463–2470. [Google Scholar]
- Christian, J.W.; Mahajan, S. Deformation twinning. Prog. Mater. Sci. 1995, 39, 1–157. [Google Scholar] [CrossRef]
- Gao, Y.; Ding, Y.; Chen, J.; Xu, J.; Ma, Y.; Wang, X. Effect of twin boundaries on the microstructure and mechanical properties of Inconel 625 alloy. Mater. Sci. Eng. A 2019, 767, 138361. [Google Scholar] [CrossRef]
- Cohen, J.B.; Weertman, J. Reply to comments on “A dislocation model for twinning in f.c.c. metals”. Acta Metall. 1963, 11, 1368–1369. [Google Scholar] [CrossRef]
- Heye, W.; Wasserman, G. The formation of the rolling textures in FCC metals by slip and twinning. Scr. Met. 1968, 2, 205–207. [Google Scholar] [CrossRef]
- Lu, K.; Lu, L.; Suresh, S. Strengthening Materials by Engineering Coherent Internal Boundaries at the Nanoscale. Science 2009, 324, 349–352. [Google Scholar] [CrossRef]
- Li, Z.; Voisin, T.; McKeown, J.T.; Ye, J.; Braun, T.; Kamath, C.; King, W.E.; Wang, Y.M. Tensile properties, strain rate sensitivity, and activation volume of additively manufactured 316L stainless steels. Int. J. Plast. 2019, 120, 395–410. [Google Scholar] [CrossRef]
- Chawla, K.K.; Meyers, M.A. Mechanical Behavior of Materials; Cambridge University Press: Cambridge, UK, 2009. [Google Scholar]
- Bachmann, F.; Hielscher, R.; Schaeben, H. Texture Analysis with MTEX—Free and Open Source Software Toolbox. Solid State Phenom. 2010, 160, 63–68. [Google Scholar] [CrossRef]
- del Valle, J.A.; Carreño, F.; Ruano, O.A. Influence of texture and grain size on work hardening and ductility in magnesium-based alloys processed by ECAP and rolling. Acta Mater. 2006, 54, 4247–4259. [Google Scholar] [CrossRef]
- Loretto, M.H. Electron Beam Analysis of Materials; Springer: Berlin/Heidelberg, Germany, 1984. [Google Scholar]
- Hirsch, P.B.; Howie, A.; Nicholson, R.B.; Pashley, D.W.; Whelan, M.J.; Marton, L. Electron microscopy of thin crystals. Phys. Today 1966, 19, 93–95. [Google Scholar] [CrossRef]
- Pešička, J.; Kužel, R.; Dronhofer, A.; Eggeler, G. The evolution of dislocation density during heat treatment and creep of tempered martensite ferritic steels. Acta Mater. 2003, 51, 4847–4862. [Google Scholar] [CrossRef]
- Wu, H.Y.; Zhou, G.Z. Plastic anisotropy and strain-hardening behavior of Mg–6%Li–1%Zn alloy thin sheet at elevated temperatures. J. Mater. Sci. 2009, 44, 6182–6186. [Google Scholar]
- Sui, S.; Tan, H.; Chen, J.; Zhong, C.; Li, Z.; Fan, W.; Gasser, A.; Huang, W. The influence of Laves phases on the room temperature tensile properties of Inconel 718 fabricated by powder feeding laser additive manufacturing. Acta Mater. 2019, 164, 413–427. [Google Scholar] [CrossRef]
- Shang, S.; Jing, C.; Fan, E.; Yang, H.; Xin, L.; Huang, W. The influence of Laves phases on the high-cycle fatigue behavior of laser additive manufactured Inconel 718. Mater. Sci. Eng. A 2017, 695, 6–13. [Google Scholar]
- Tang, P.-Y.; Huang, G.-H.; Huang, J.-L.; Ma, L.; Fan, T.-W. First-principles study of the ideal shear strengths and stacking fault energies of face-centered cubic Al3Ti. Comput. Mater. Sci. 2020, 177, 109596. [Google Scholar] [CrossRef]
- Zhang, H.; Wang, Q.; Gong, X.; Wang, T.; Zhang, W.; Chen, K.; Wang, C.; Liu, Y.; Wang, Q. Dependence on temperature of compression behavior and deformation mechanisms of Nickel-based single crystal CMSX-4. J. Alloys Compd. 2021, 866, 158878. [Google Scholar] [CrossRef]
Publisher’s Note: MDPI stays neutral with regard to jurisdictional claims in published maps and institutional affiliations. |
© 2021 by the authors. Licensee MDPI, Basel, Switzerland. This article is an open access article distributed under the terms and conditions of the Creative Commons Attribution (CC BY) license (https://creativecommons.org/licenses/by/4.0/).