Influence of Applied Liquid-Type Scanning-Aid Material on the Accuracy of the Scanned Image: An In Vitro Experiment


 ,
,  , ,
, ,  and
and
Abstract
1. Introduction
2. Materials and Methods
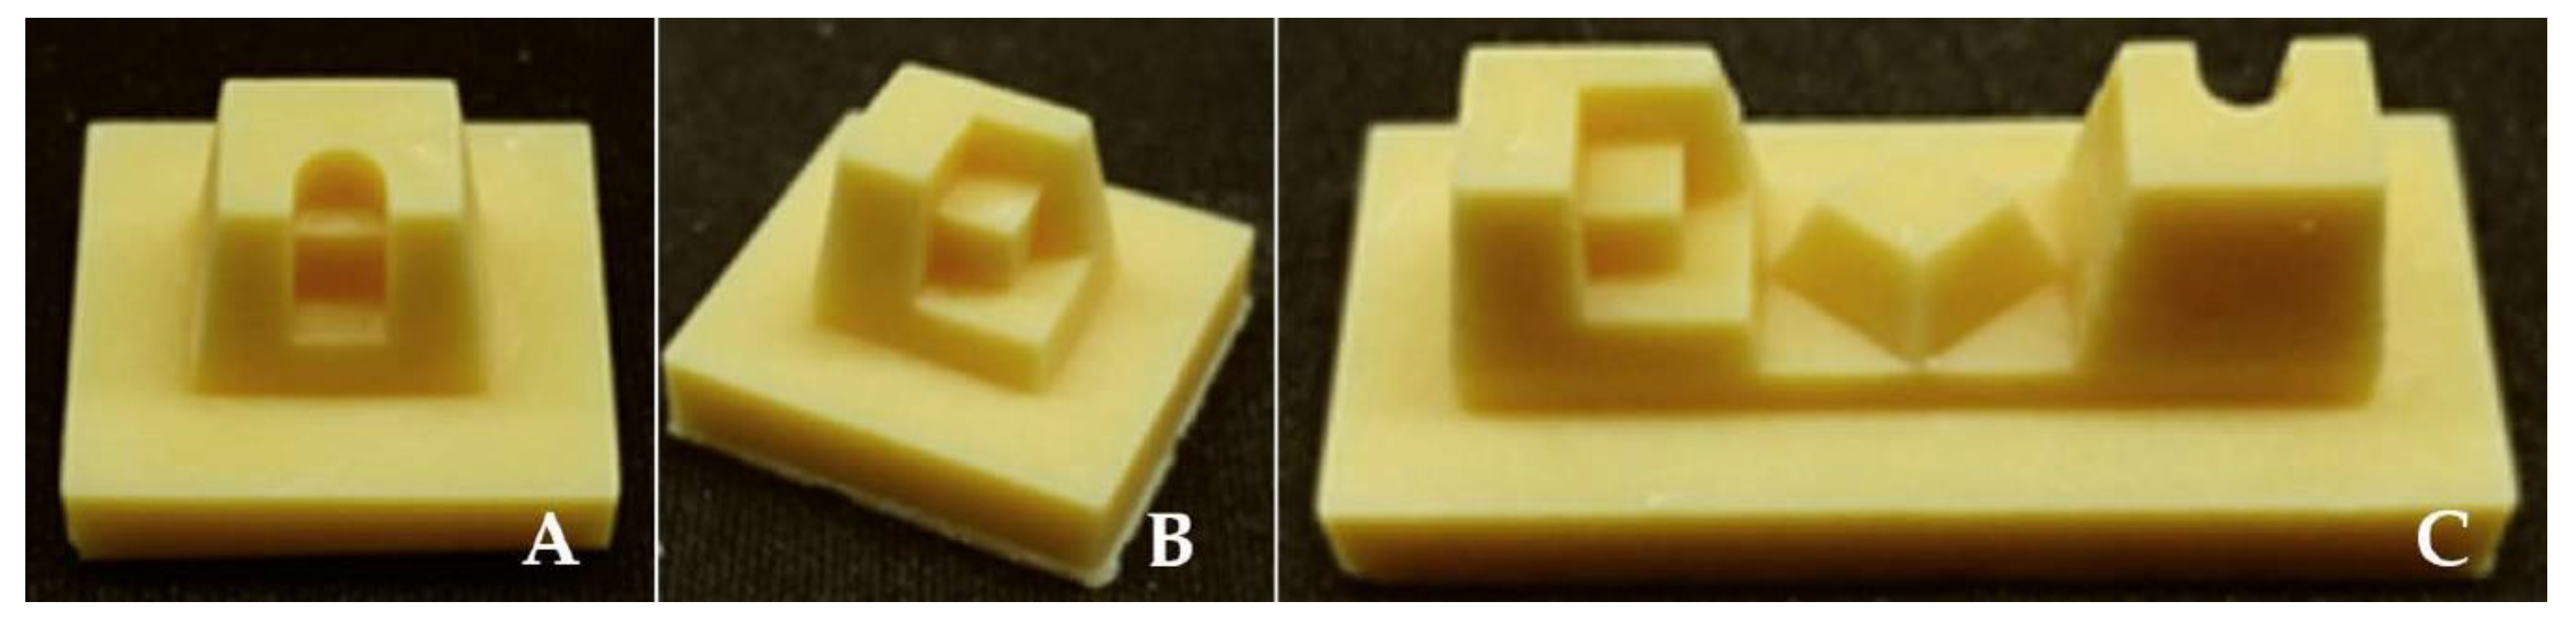
2.1. Reference Models
2.2. Scanning-Aid Materials
2.3. Acquisition of Scanned Data and 3D Comparison
2.4. Comparison of Working Time
2.5. Statistical Analysis
3. Results
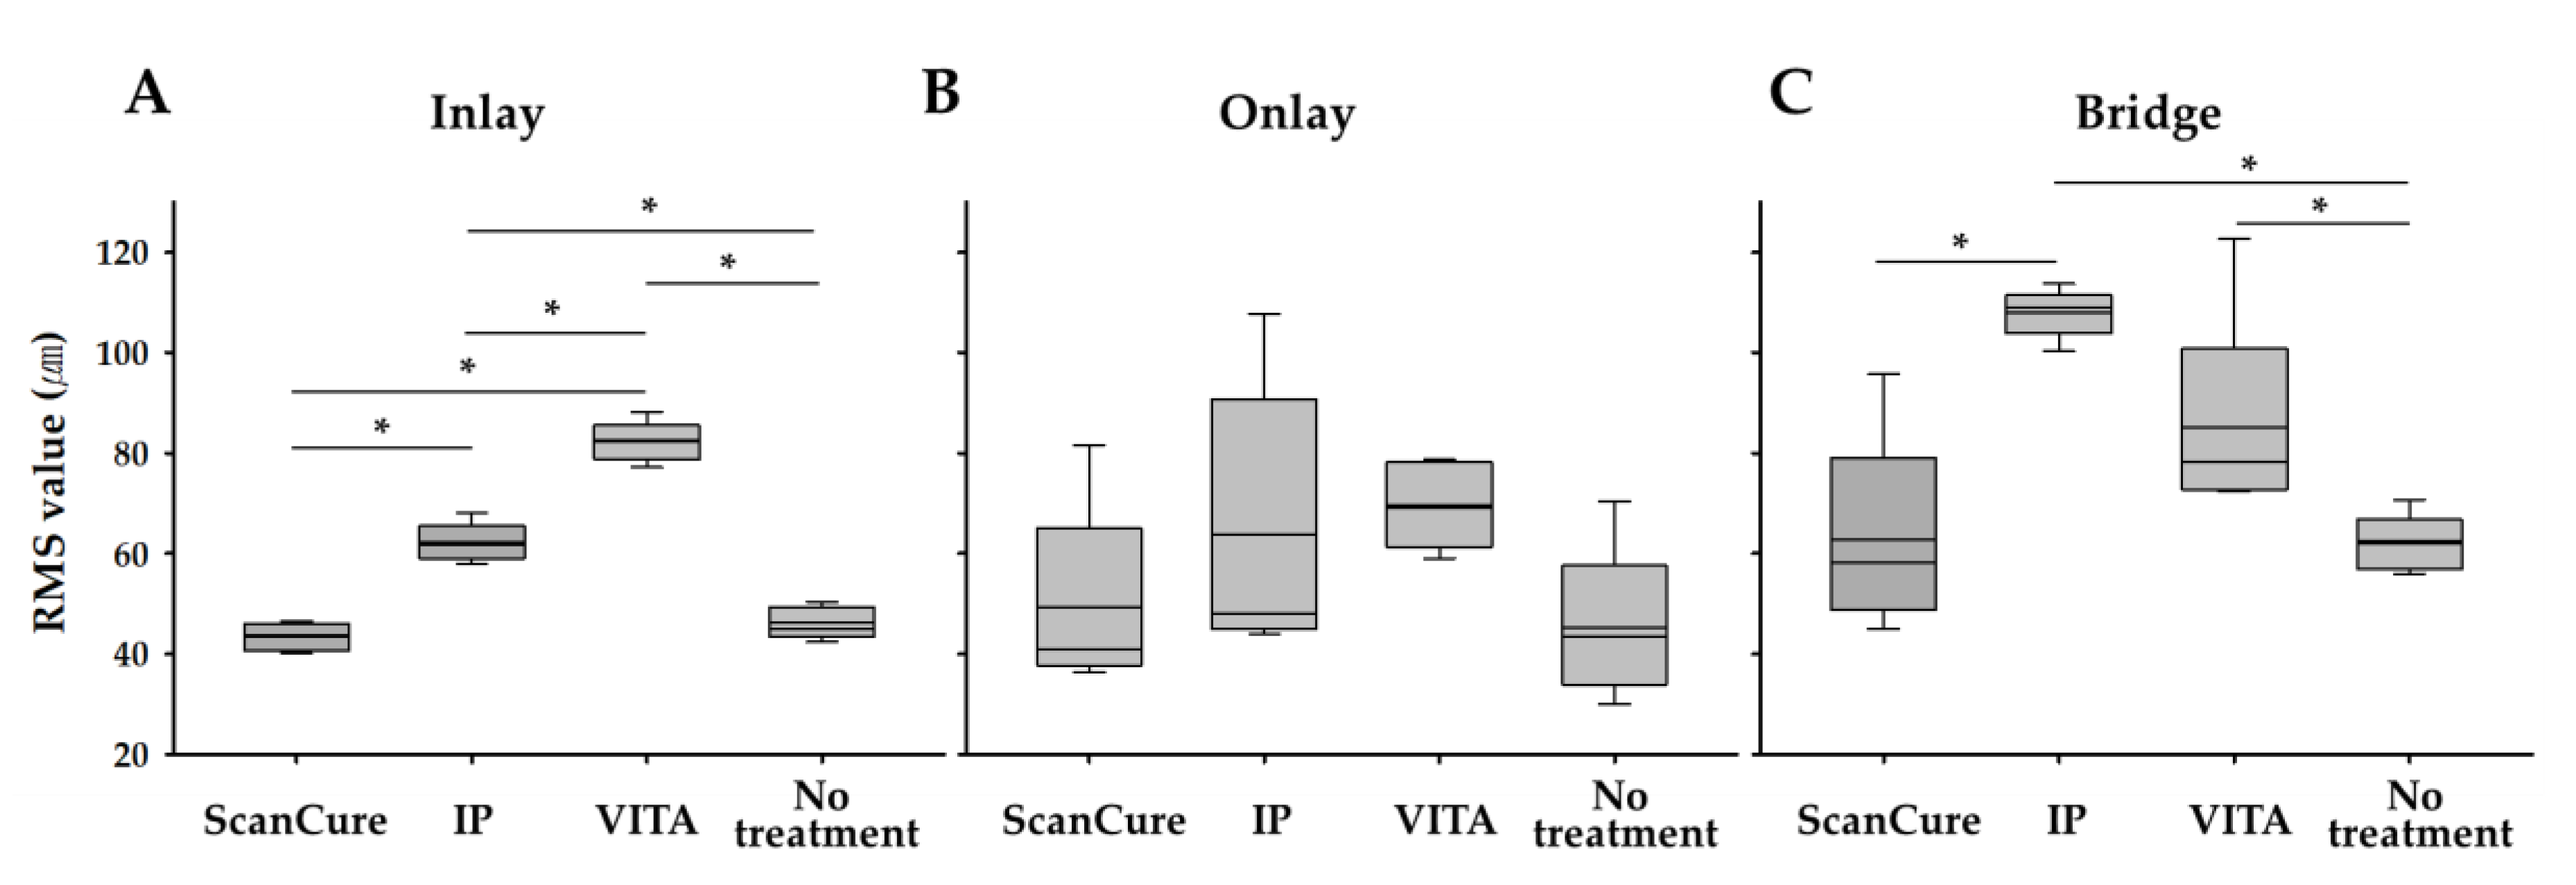
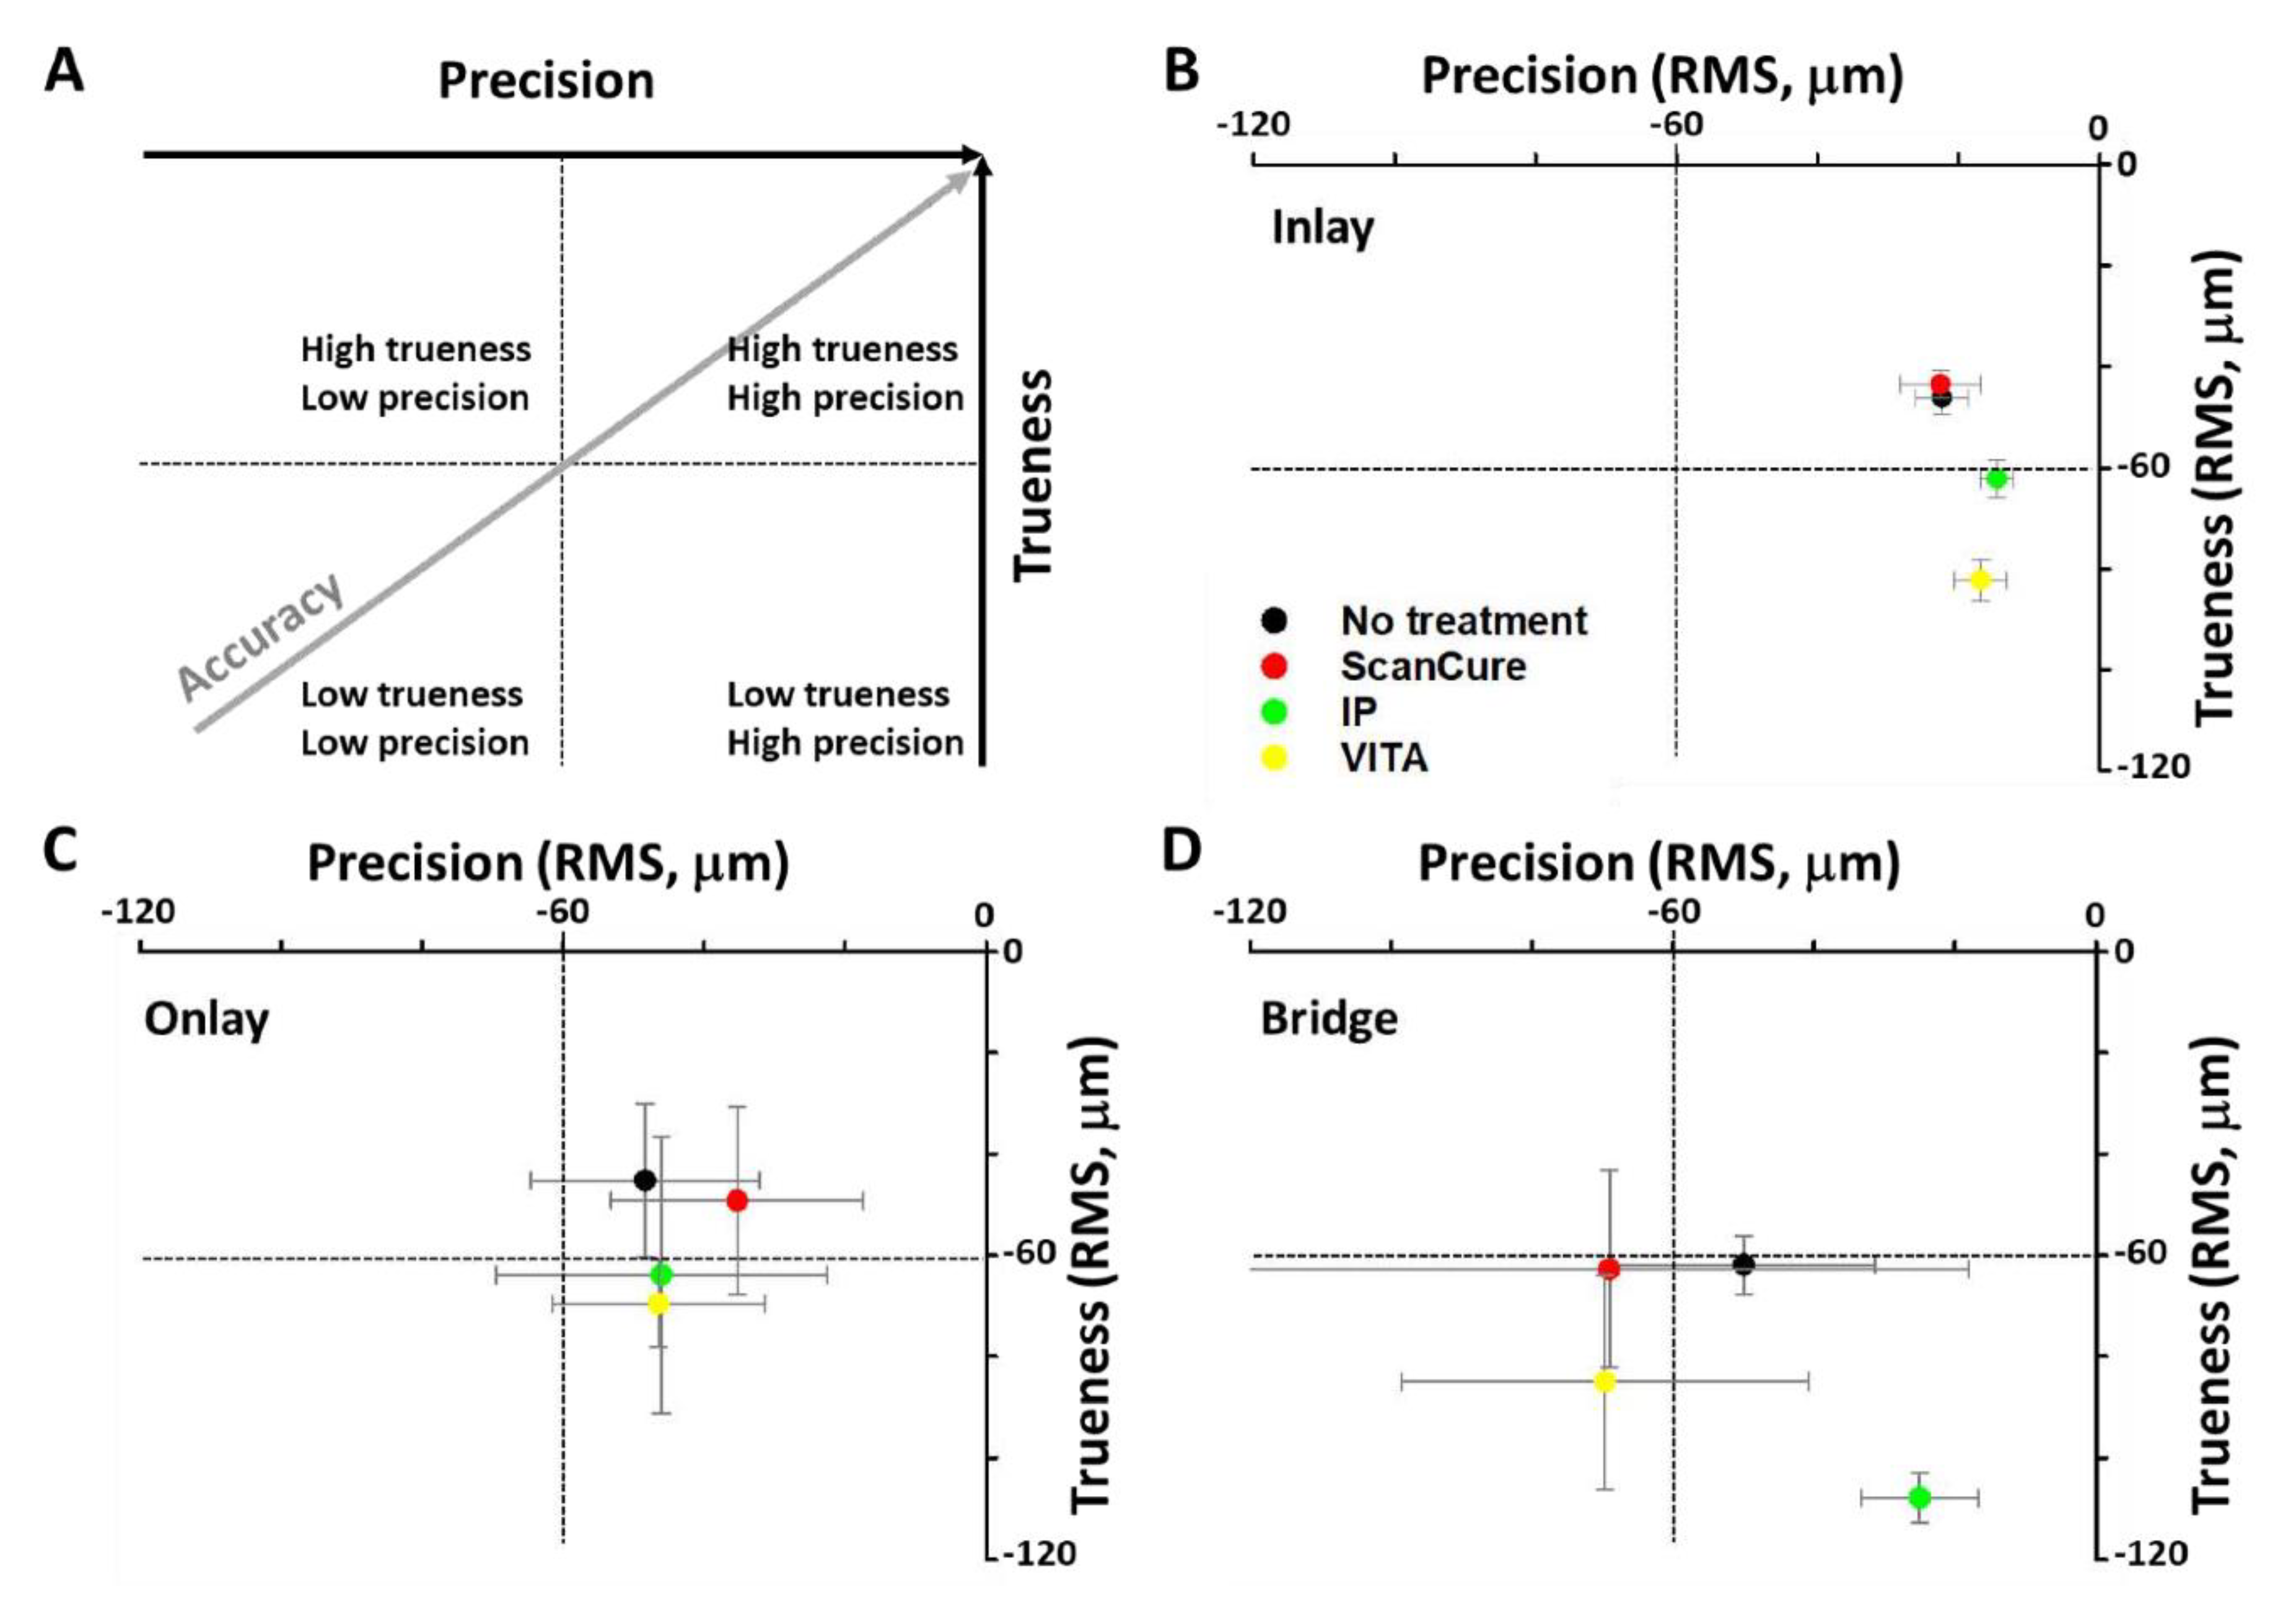
3.1. Trueness
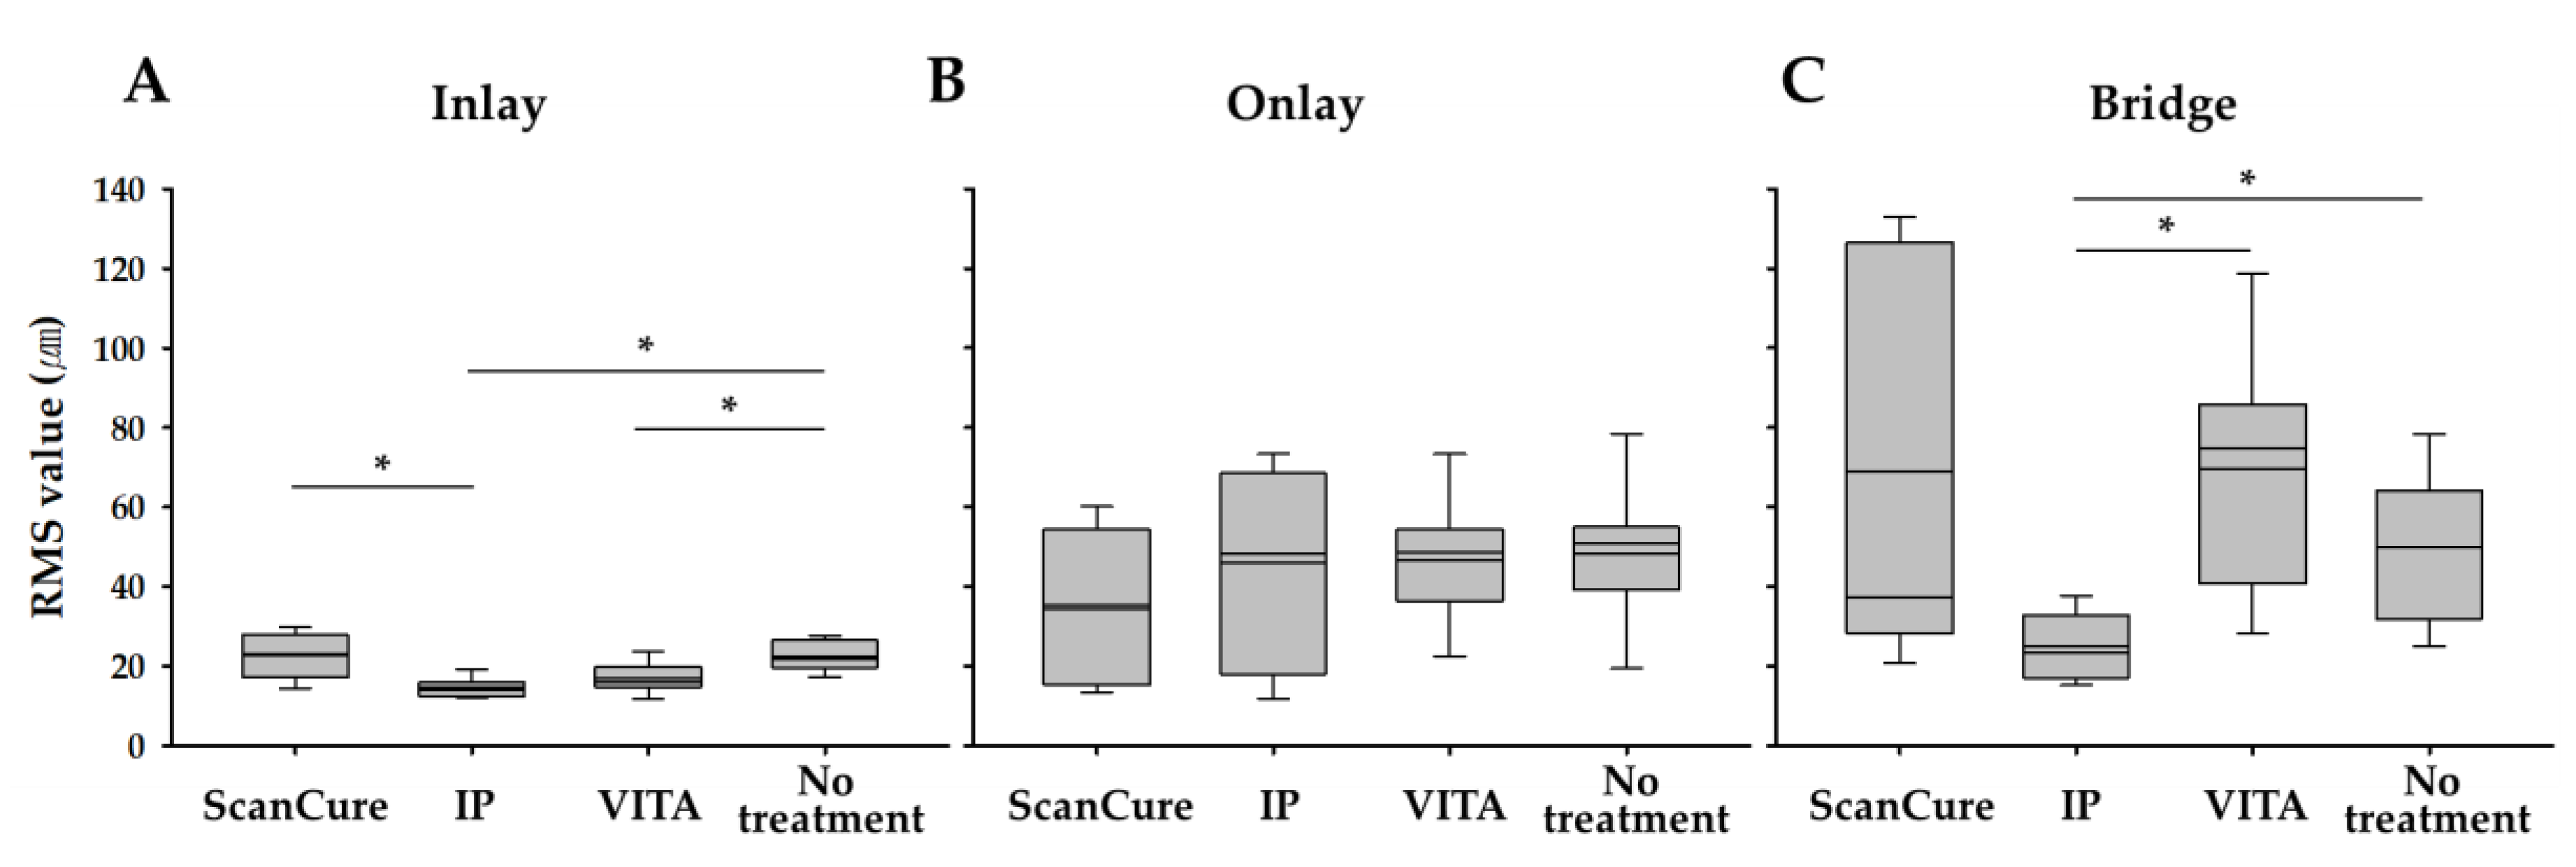
3.2. Precision
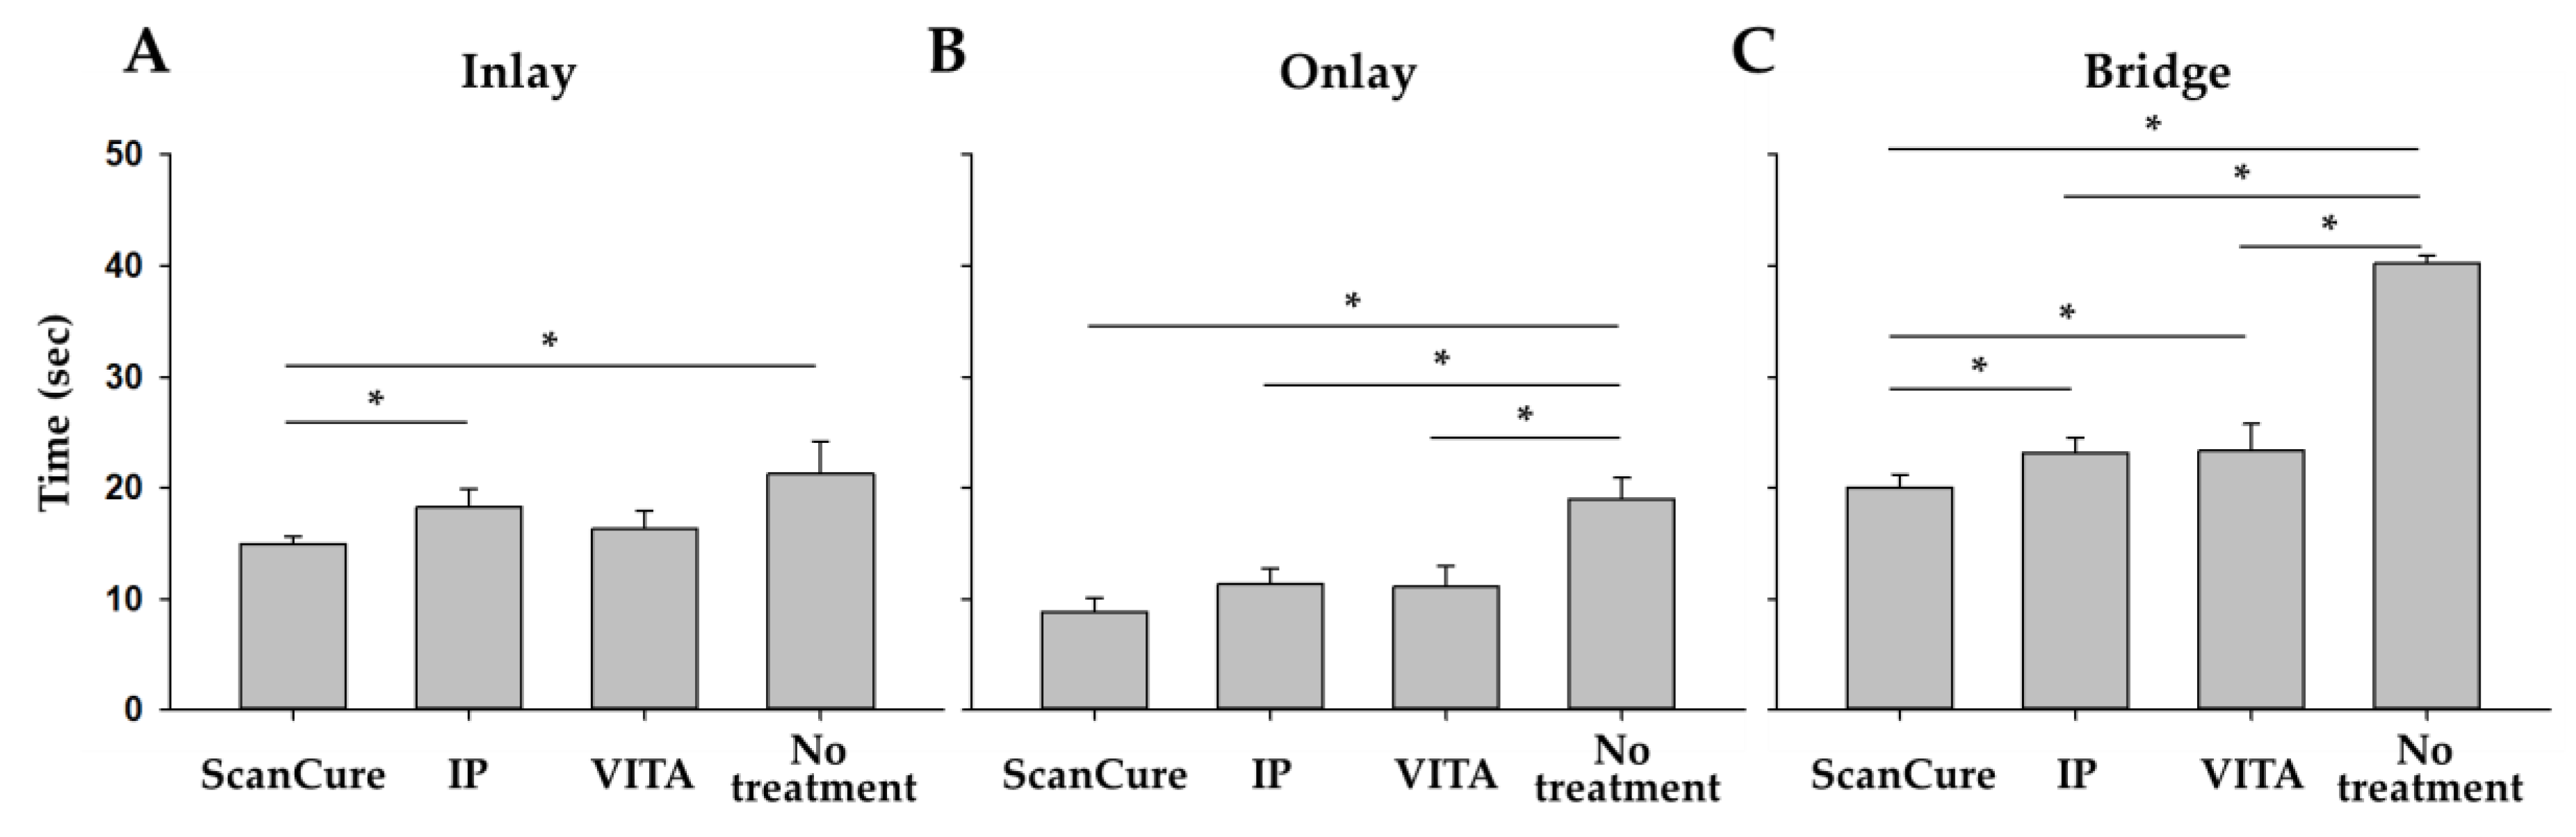
3.3. Time Efficiency
4. Discussion
4.1. Trueness and Precision
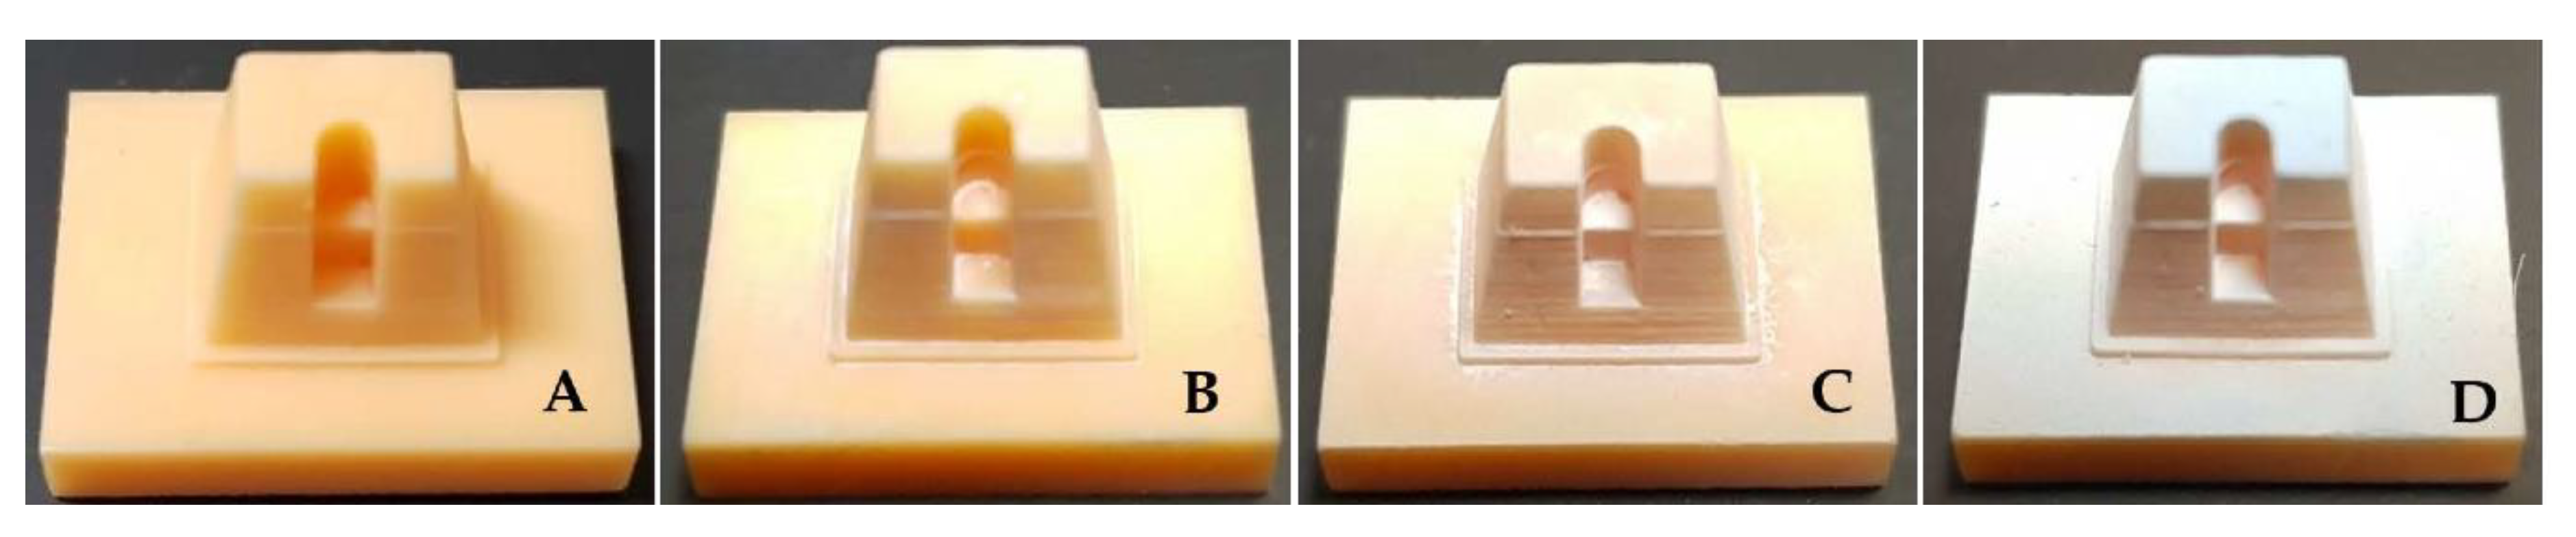
4.2. Comparison in Visual Between Scanning-Aid Materials
4.3. Comparison in Working Time Between Scanning-Aid Materials
5. Conclusions
Author Contributions
Funding
Conflicts of Interest
References
- Christensen, G.J. Will digital impressions eliminate the current problems with conventional impressions? J. Am. Dent. Assoc. 2008, 139, 761–763. [Google Scholar] [CrossRef]
- Christensen, G.J. The challenge to conventional impressions. J. Am. Dent. Assoc. 2008, 139, 347–349. [Google Scholar] [CrossRef]
- Yuzbasioglu, E.; Kurt, H.; Turunc, R.; Bilir, H. Comparison of digital and conventional impression techniques: Evaluation of patients’ perception, treatment comfort, effectiveness and clinical outcomes. BMC Oral Health 2014, 14, 10. [Google Scholar] [CrossRef]
- Ender, A.; Mehl, A. Accuracy of complete-arch dental impressions: A new method of measuring trueness and precision. J. Prosthet. Dent. 2013, 109, 121–128. [Google Scholar] [CrossRef]
- Park, G.H.; Son, K.; Lee, K.B. Feasibility of using an intraoral scanner for a complete-arch digital scan. J. Prosthet. Dent. 2019, 121, 803–810. [Google Scholar] [CrossRef]
- Malik, J.; Rodriguez, J.; Weisbloom, M.; Petridis, H. Comparison of Accuracy Between a Conventional and Two Digital Intraoral Impression Techniques. Int. J. Prosthodont. 2018, 31, 107–113. [Google Scholar] [CrossRef]
- Kuhr, F.; Schmidt, A.; Rehmann, P.; Wöstmann, B. A new method for assessing the accuracy of full arch impressions in patients. J. Dent. 2016, 55, 68–74. [Google Scholar] [CrossRef]
- Khraishi, H.; Duane, B. Evidence for use of intraoral scanners under clinical conditions for obtaining full-arch digital impressions is insufficient. Evid. Based Dent. 2017, 18, 24–25. [Google Scholar] [CrossRef]
- Ender, A.; Mehl, A. In-vitro evaluation of the accuracy of conventional and digital methods of obtaining full-arch dental impressions. Quintessence Int. 2015, 46, 9–17. [Google Scholar]
- Park, J.H.; Seol, J.H.; Lee, J.J.; Lee, S.P.; Lim, Y.J. A Comparative Study on the Scanned Images according to Materials and Surface Conditions of International Standard Models for Various Dental Scanners Evaluation. J. Dent. Rehabil. Appl. Sci. 2018, 34, 104–115. [Google Scholar] [CrossRef]
- Burde, A.V.; Dudea, D.; Cuc, S.; Moldovan, M.; Campian, R.S. Three-dimensional Evaluations of the Coating Thickness of Two Optical Conditioning Scanning Sprays. MATERIALE PLASTICE 2016, 53, 65–67. [Google Scholar]
- Quaas, S.; Rudolph, H.; Luthardt, R.G. Direct mechanical data acquisition of dental impressions for the manufacturing of CAD/CAM restorations. J. Dent. 2007, 35, 903–908. [Google Scholar] [CrossRef]
- Van Geelen, M.J. The Influence of Powder on Accuracy of Digital Imprint Techniques: Varying Spraying Duration. Master’s Thesis, Umeå University, Umeå, Sweden, 2016. [Google Scholar]
- Dehurtevent, M.; Robberecht, L.; Béhin, P. Influence of dentist experience with scan spray systems used in direct CAD/CAM impressions. J. Prosthet. Dent. 2015, 113, 17–21. [Google Scholar] [CrossRef]
- Rupf, S.; Berger, H.; Buchter, A.; Harth, V.; Ong, M.F.; Hannig, M. Exposure of patient and dental staff to fine and ultrafine particles from scanning spray. Clin. Oral Investig. 2015, 19, 823–830. [Google Scholar] [CrossRef]
- Winkler, J.; Gkantidis, N. Trueness and precision of intraoral scanners in the maxillary dental arch: An in vivo analysis. Sci. Rep. 2020, 10, 1172. [Google Scholar] [CrossRef]
- Mutwalli, H.; Braian, M.; Mahmood, D.; Larsson, C. Trueness and Precision of Three-Dimensional Digitizing Intraoral Devices. Int. J. Dent. 2018, 5189761. [Google Scholar] [CrossRef]
- Hayama, H.; Fueki, K.; Wadachi, J.; Wakabayashi, N. Trueness and precision of digital impressions obtained using an intraoral scanner with different head size in the partially edentulous mandible. J. Prosthodont. Res. 2018, 62, 347–352. [Google Scholar] [CrossRef]
- Mangano, F.G.; Hauschild, U.; Veronesi, G.; Imburgia, M.; Mangano, C.; Admakin, O. Trueness and precision of 5 intraoral scanners in the impressions of single and multiple implants: A comparative in vitro study. BMC Oral Health. 2019, 19, 101. [Google Scholar] [CrossRef]
- Uhm, S.H.; Kim, J.H.; Jiang, H.B.; Woo, C.W.; Chang, M.; Kim, K.N.; Bae, J.M.; Oh, S. Evaluation of the accuracy and precision of four intraoral scanners with 70% reduced inlay and four-unit bridge models of international standard. Dent. Mater. J. 2017, 36, 27–34. [Google Scholar] [CrossRef]
- Jeon, J.H.; Kim, H.Y.; Kim, J.H.; Kim, W.C. Accuracy of 3D white light scanning of abutment teeth impressions: Evaluation of trueness and precision. J. Adv. Prosthodont. 2014, 6, 468–473. [Google Scholar] [CrossRef]
- Kurbad, A. The optical conditioning of Cerec preparations with scan spray. Int. J. Comput. Dent. 2000, 3, 269–3279. [Google Scholar] [PubMed]
- Meyer, B.J.; Mörmann, W.H.; Lutz, F. Optimierung der Puderapplikation bei der Cerecmethode mit umweltfreundlichen Treibgassystemen [Optimization of the powder application in the Cerec method with environment-friendly propellant systems]. Schweiz Monatsschr Zahnmed 1990, 100, 1462–1468. [Google Scholar] [PubMed]
- Kurz, M.; Attin, T.; Mehl, A. Influence of material surface on the scanning error of a powder-free 3D measuring system. Clin. Oral Investig. 2015, 19, 2035–2043. [Google Scholar] [CrossRef] [PubMed]
- Kim, J.; Park, J.M.; Kim, M.; Heo, S.J.; Shin, I.H.; Kim, M. Comparison of experience curves between two 3-dimensional intraoral scanners. J. Prosthet. Dent. 2016, 116, 221–230. [Google Scholar] [CrossRef] [PubMed]


| Commercial name | ScanCure® | IP Scan Spray® | Vita Powder Scan Spray® |
|---|---|---|---|
| Product |  |  |  |
| Method of application | painting | spraying | spraying |
| Type | liquid | powder | powder |
| Composition | Ethanol TiO2 | Butane, Propane Ethanol Isobutane TiO2 | Ethanol, Isobutane TiO2-free |
| Color | white | white | Light blue |
| Trueness | n | ScanCure (µm) | IP (µm) | VITA (µm) | No Treatment (µm) |
|---|---|---|---|---|---|
| Inlay | 5 | 43.44 ± 2.75 | 62.16 ± 3.77 | 82.28 ± 4.06 | 46.12 ± 3.23 |
| Onlay | 5 | 49.26 ± 18.63 | 63.90 ± 27.38 | 69.62 ± 8.60 | 45.26 ± 15.20 |
| Bridge | 5 | 62.78 ± 19.53 | 107.90 ± 4.87 | 85.08 ± 21.18 | 61.90 ± 5.74 |
| Precision | n | ScanCure (µm) | IP (µm) | VITA (µm) | No Treatment (µm) |
|---|---|---|---|---|---|
| Inlay | 10 | 22.60 ± 5.65 | 14.53 ± 2.36 | 16.83 ± 3.68 | 22.36 ± 3.66 |
| Onlay | 10 | 35.31 ± 17.90 | 46.04 ± 23.52 | 46.50 ± 15.14 | 48.39 ± 16.25 |
| Bridge | 10 | 69.08 ± 51.10 | 25.00 ± 8.28 | 69.67 ± 28.91 | 49.97 ± 18.54 |
| Time | n | ScanCure (sec) | IP (sec) | VITA (sec) | No Treatment (sec) |
|---|---|---|---|---|---|
| Inlay | 5 | 14.92 ± 0.70 | 18.22 ± 1.68 | 16.30 ± 1.62 | 21.28 ± 2.90 |
| Onlay | 5 | 8.87 ± 1.23 | 11.32 ± 1.44 | 11.11 ± 1.87 | 18.97 ± 1.91 |
| Bridge | 5 | 20.01 ± 1.19 | 23.17 ± 1.34 | 23.37 ± 2.40 | 40.18 ± 0.69 |
© 2020 by the authors. Licensee MDPI, Basel, Switzerland. This article is an open access article distributed under the terms and conditions of the Creative Commons Attribution (CC BY) license (http://creativecommons.org/licenses/by/4.0/).
Share and Cite
Oh, H.-S.; Lim, Y.-J.; Kim, B.; Kim, W.H.; Kim, M.-J.; Kwon, H.-B. Influence of Applied Liquid-Type Scanning-Aid Material on the Accuracy of the Scanned Image: An In Vitro Experiment. Materials 2020, 13, 2034. https://doi.org/10.3390/ma13092034
Oh H-S, Lim Y-J, Kim B, Kim WH, Kim M-J, Kwon H-B. Influence of Applied Liquid-Type Scanning-Aid Material on the Accuracy of the Scanned Image: An In Vitro Experiment. Materials. 2020; 13(9):2034. https://doi.org/10.3390/ma13092034
Chicago/Turabian StyleOh, Hyun-Su, Young-Jun Lim, Bongju Kim, Won Hyeon Kim, Myung-Joo Kim, and Ho-Beom Kwon. 2020. "Influence of Applied Liquid-Type Scanning-Aid Material on the Accuracy of the Scanned Image: An In Vitro Experiment" Materials 13, no. 9: 2034. https://doi.org/10.3390/ma13092034
APA StyleOh, H.-S., Lim, Y.-J., Kim, B., Kim, W. H., Kim, M.-J., & Kwon, H.-B. (2020). Influence of Applied Liquid-Type Scanning-Aid Material on the Accuracy of the Scanned Image: An In Vitro Experiment. Materials, 13(9), 2034. https://doi.org/10.3390/ma13092034