Author Contributions
Conceptualization: M.R.M., S.S.; Data curation: M.R.M., S.S.; Formal analysis: M.R.M., S.S.; Funding acquisition: T.S.Y.C; Investigation: L.C.A., S.A.R., T.S.Y.C.; Methodology: M.R.M., S.S., T.S.Y.C.; S.H.T.; Supervision: L.C.A., S.A.R., T.S.Y.C., U.R., I.A.N.; Validation: M.R.M., S.S., T.S.Y.C., U.R., I.A.N.; Visualization: S.S., T.S.Y.C.; Writing—original draft: M.R.M.; S.H.T.; Writing—review and editing: S.S. All authors have read and agreed to the published version of the manuscript.
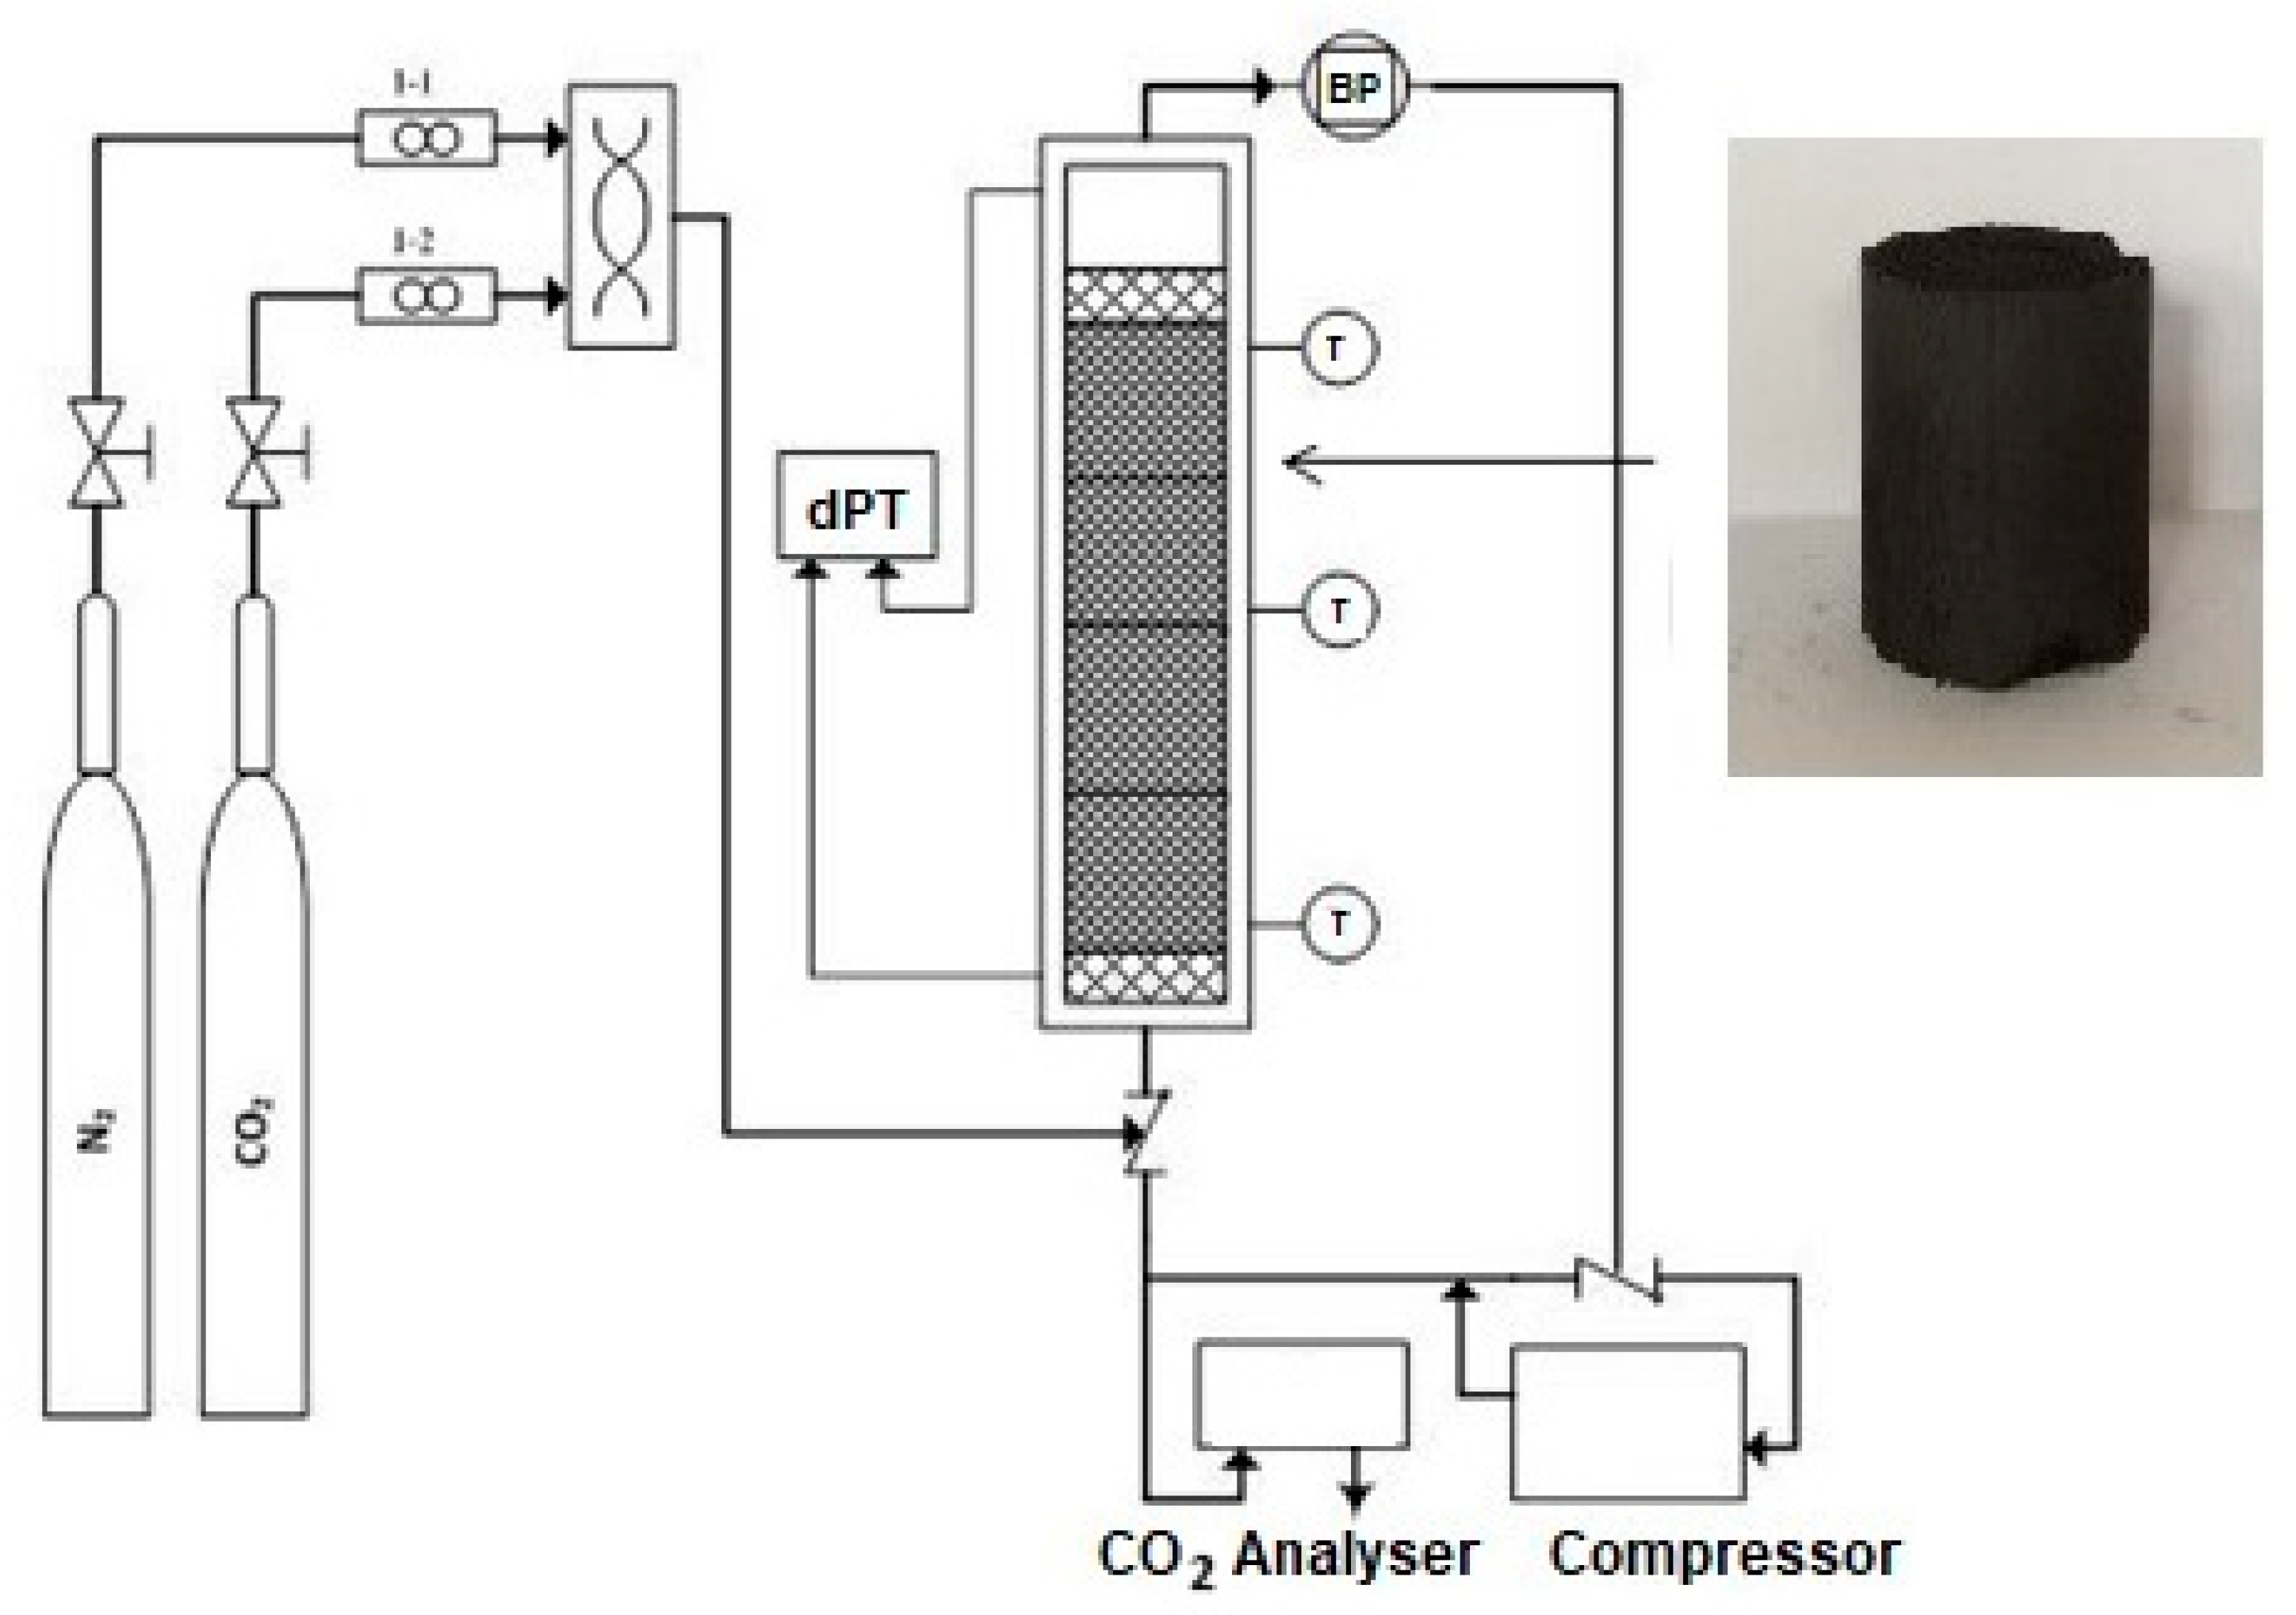
Figure 1.
A graphical illustration of the experimental set-up for adsorption of carbon dioxide (CO2).
Figure 1.
A graphical illustration of the experimental set-up for adsorption of carbon dioxide (CO2).
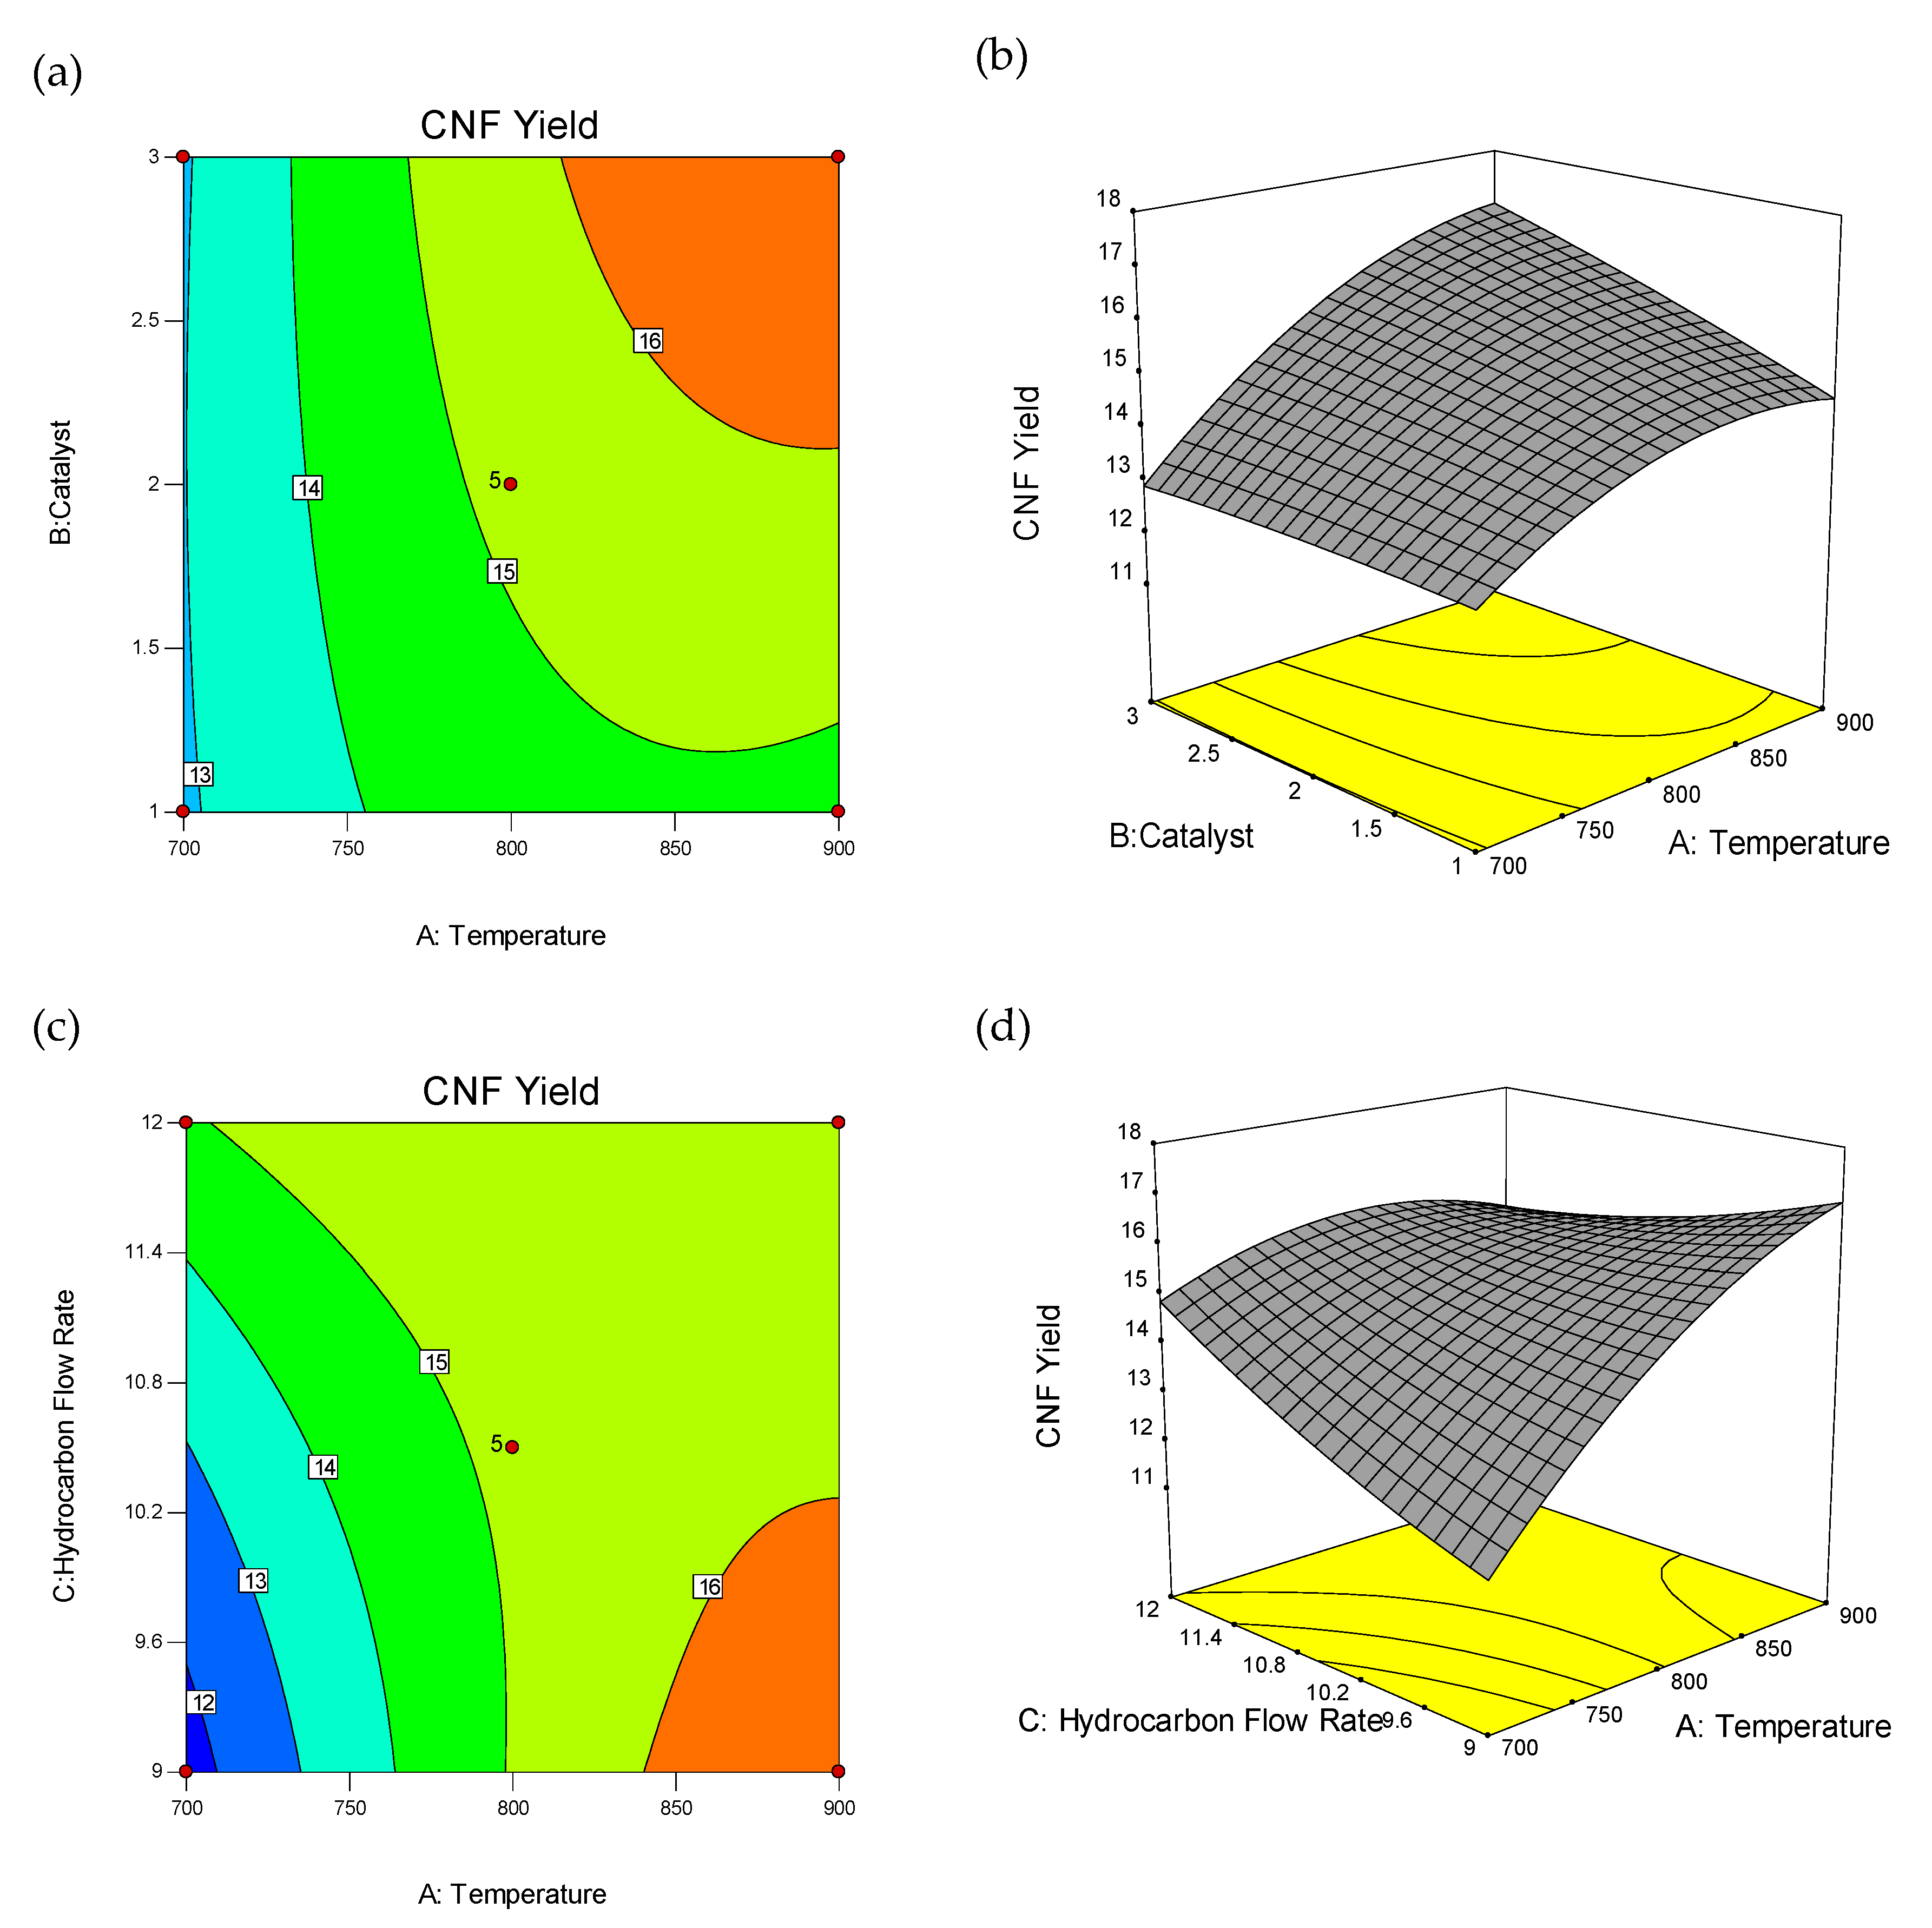
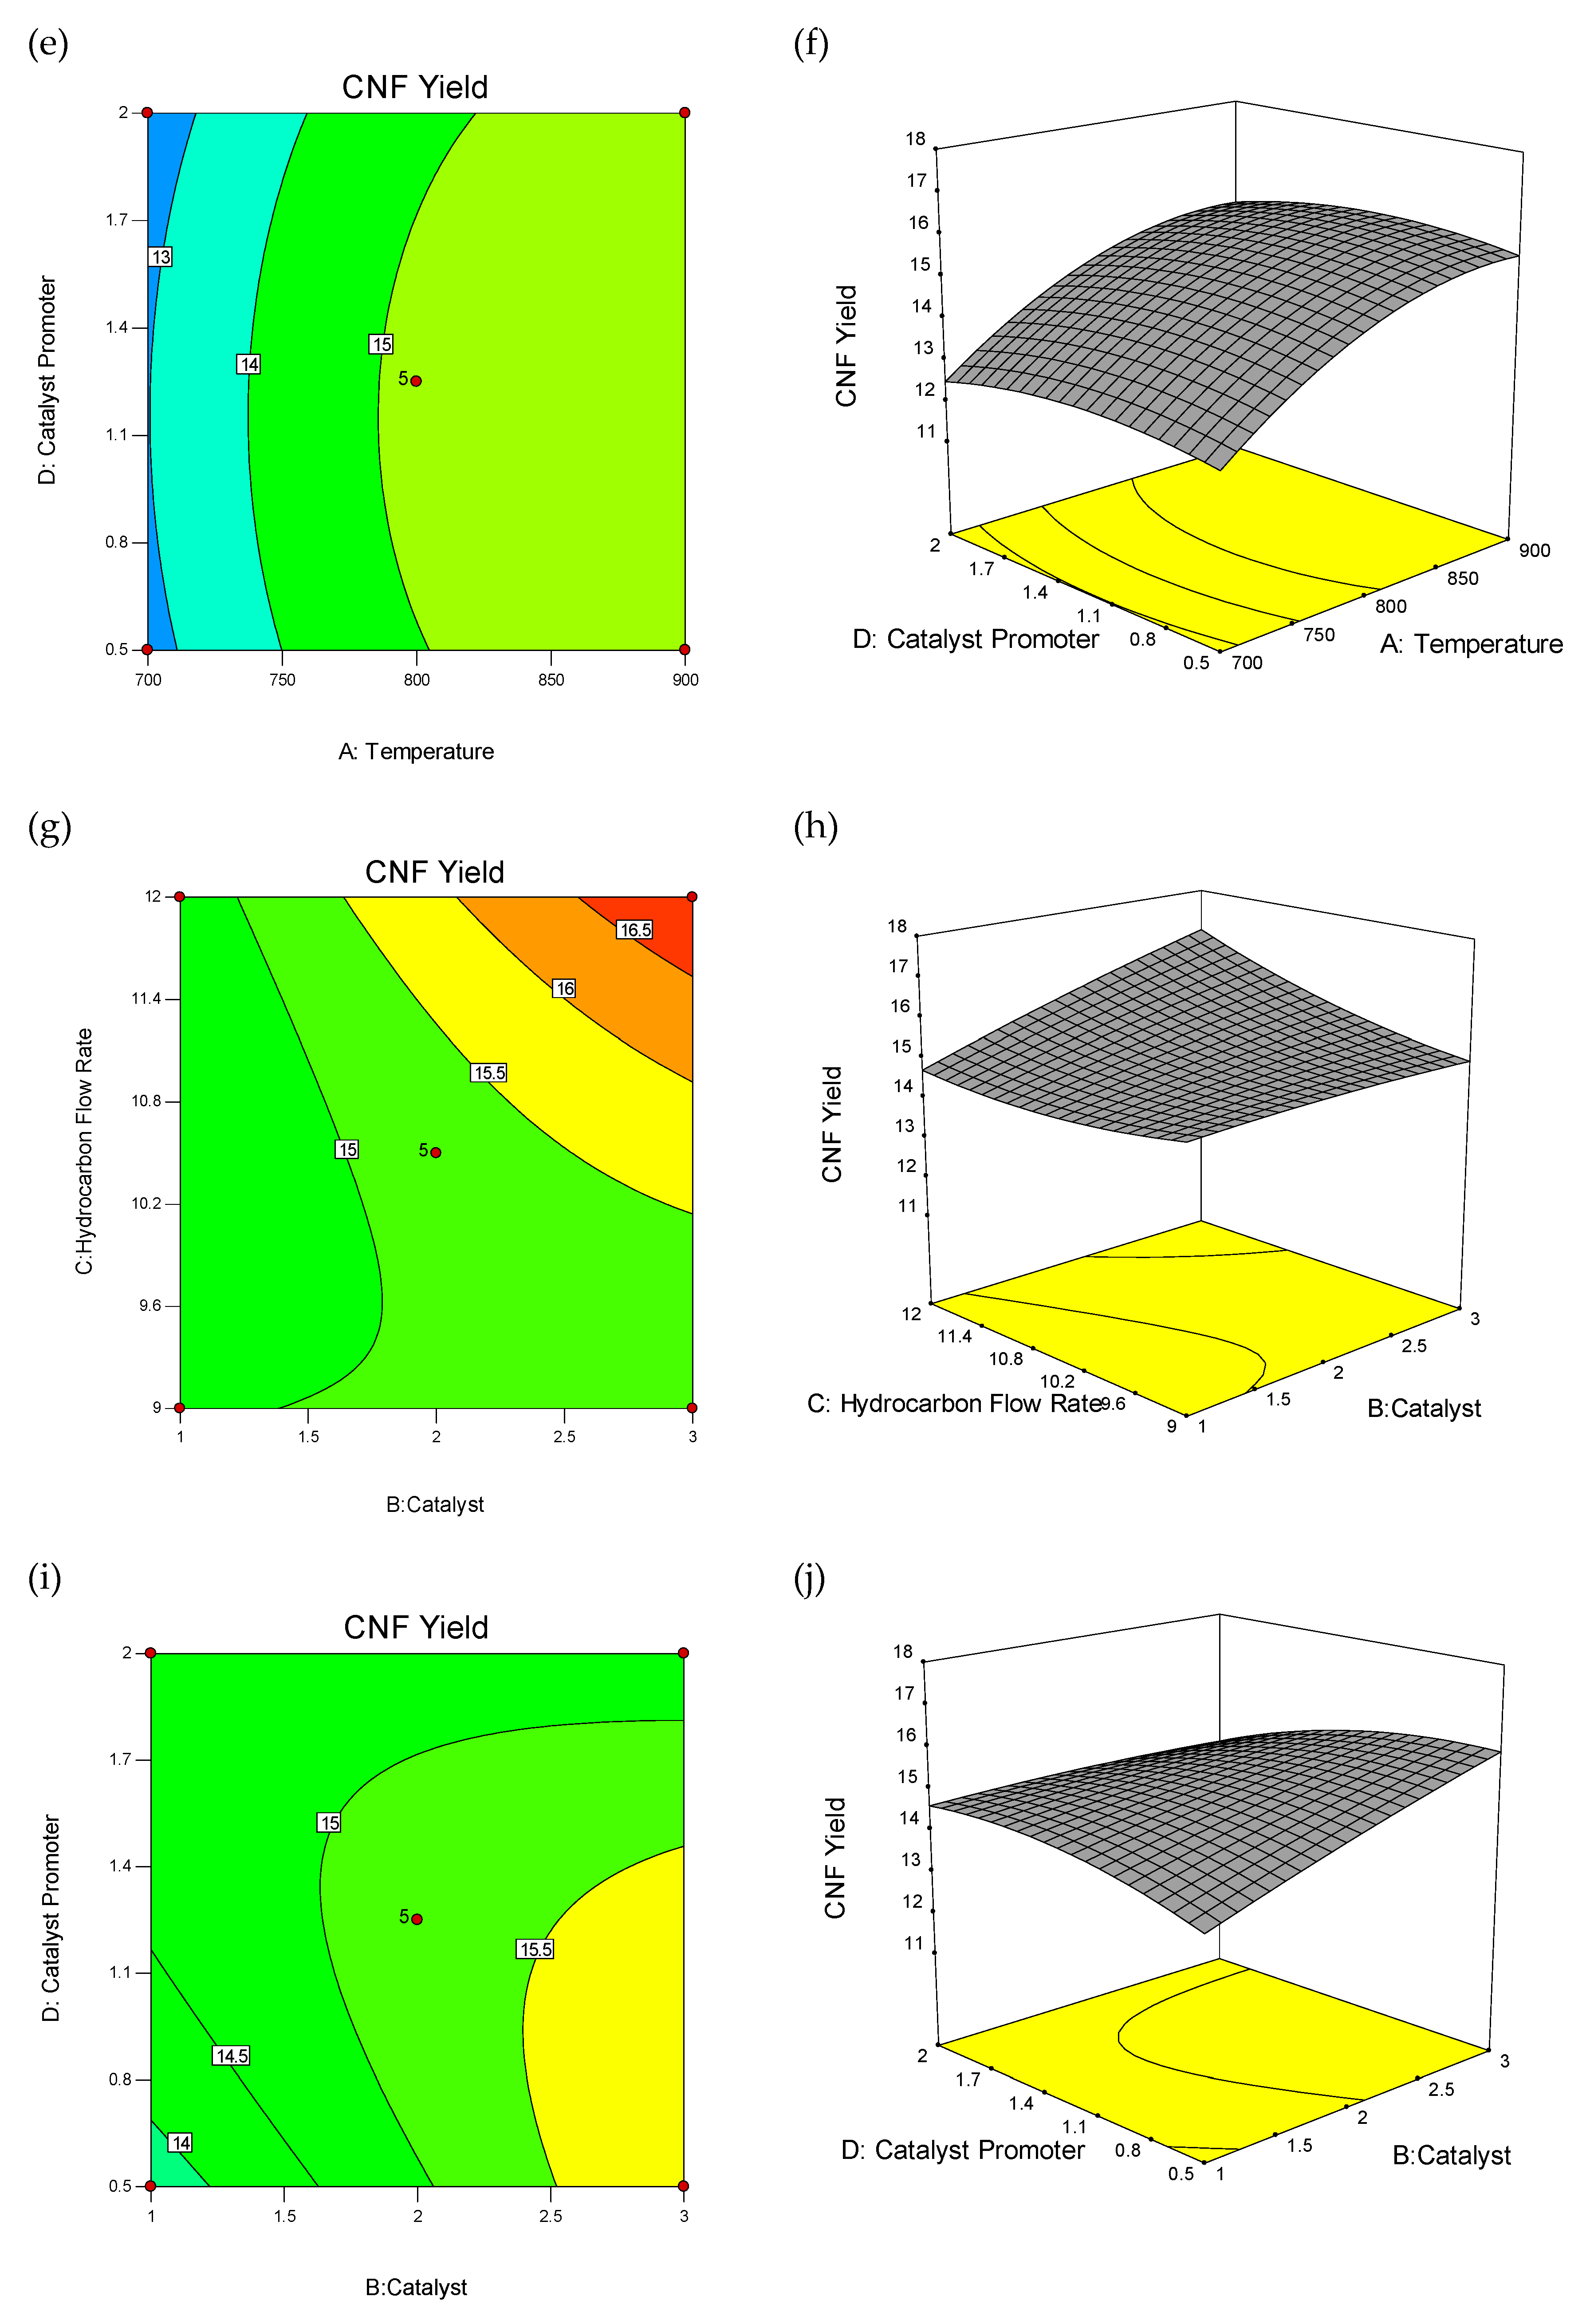
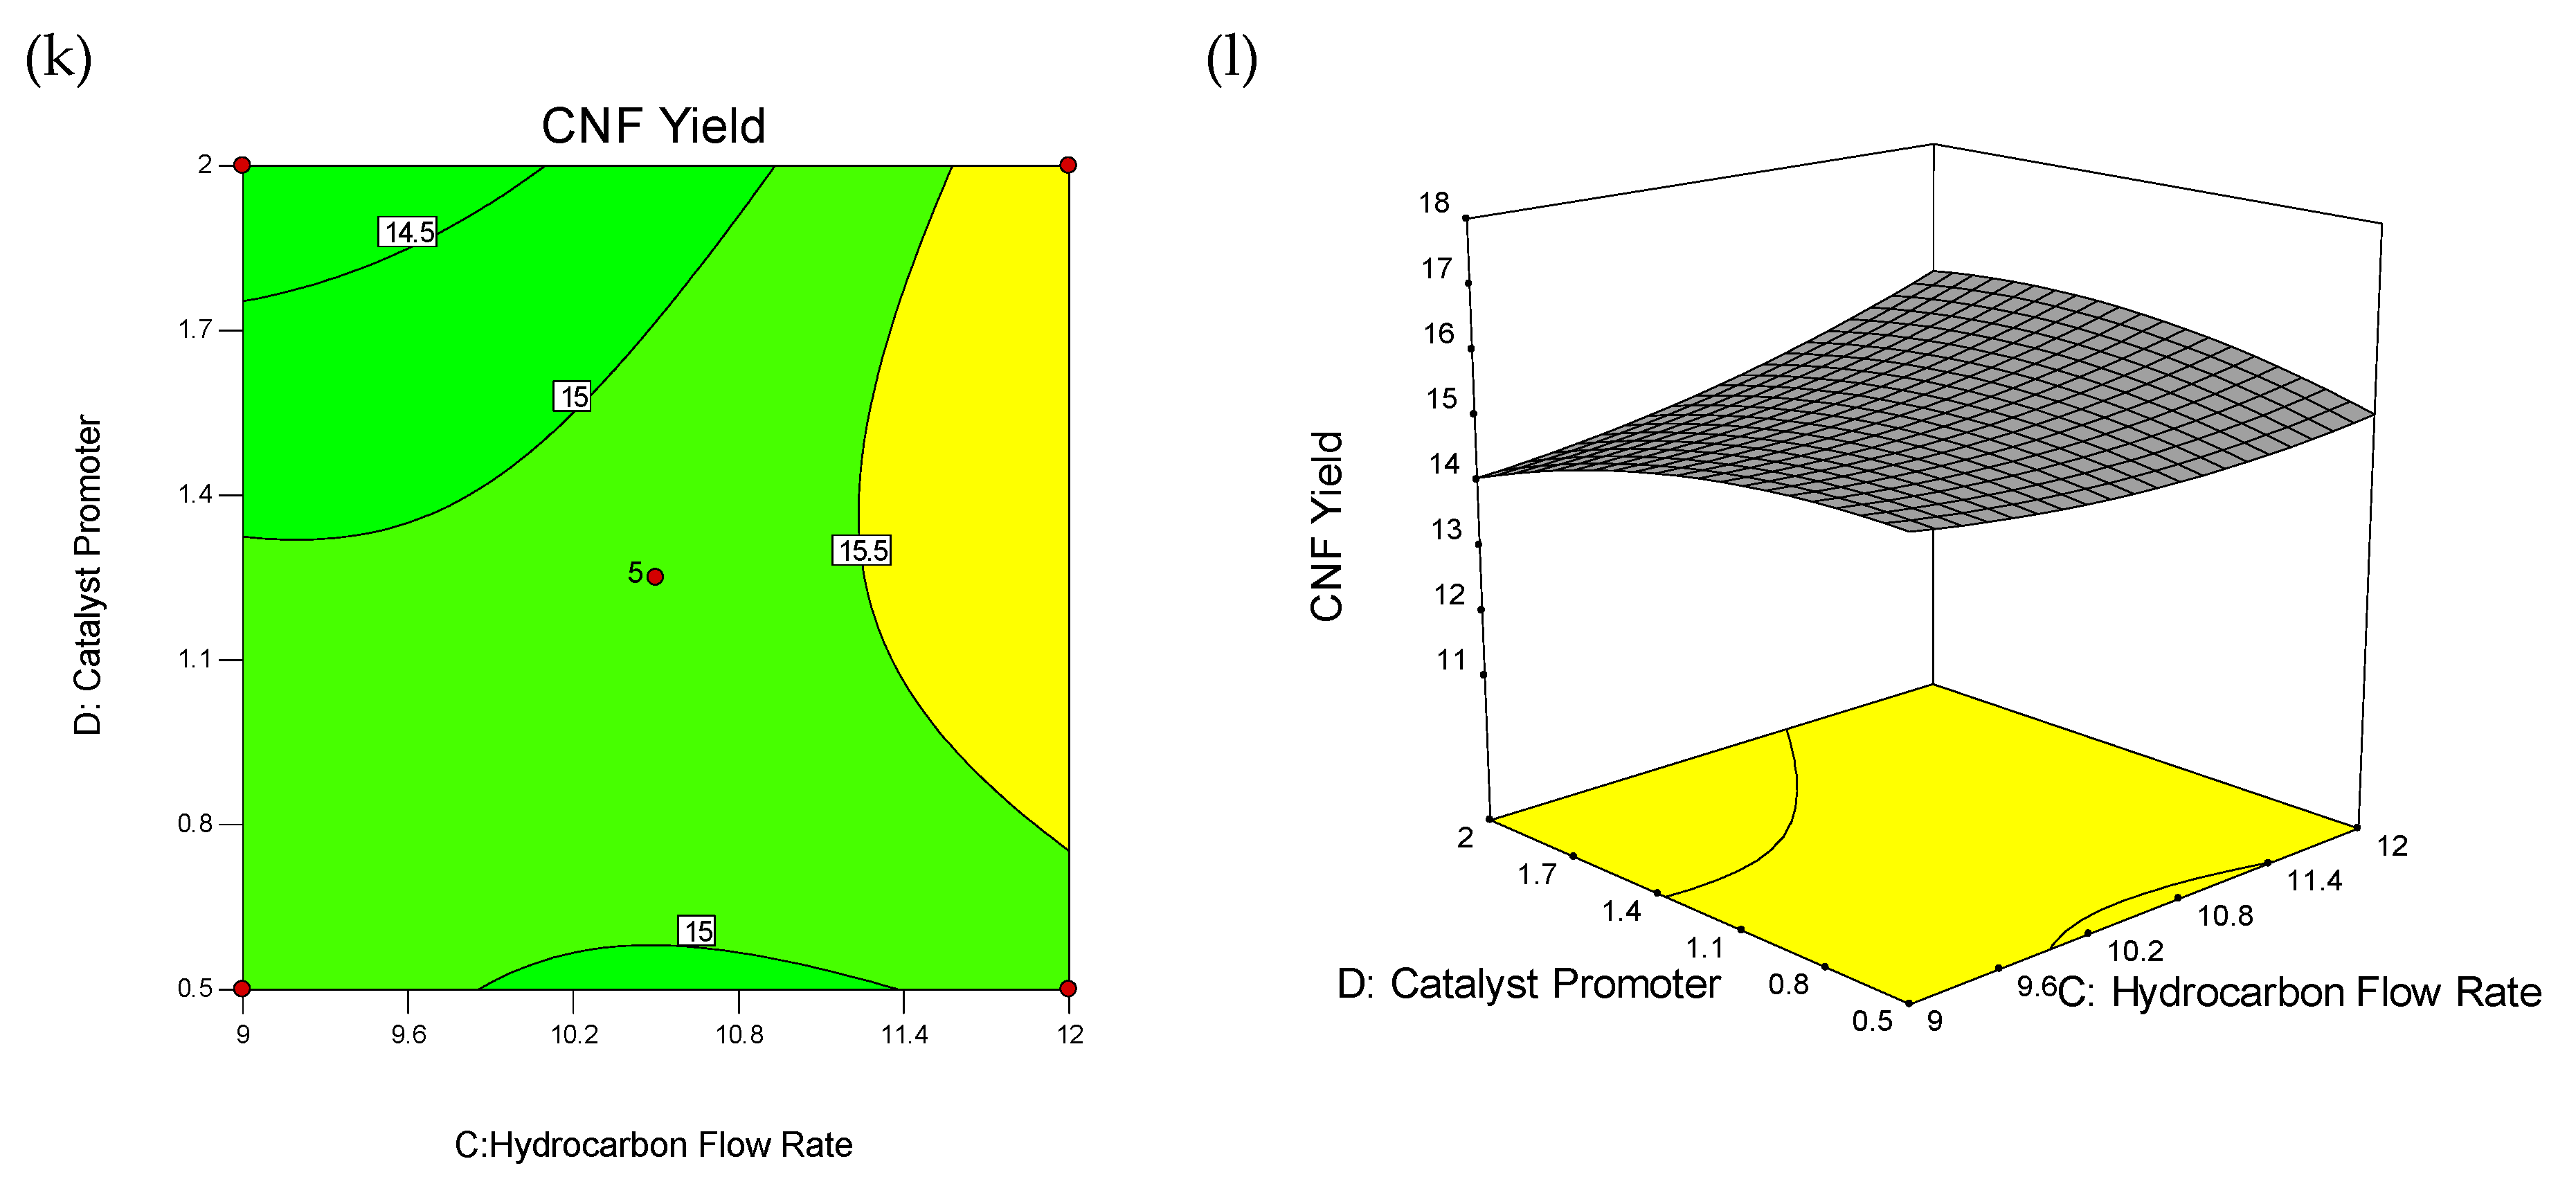
Figure 2.
3D wireframe surface plot and contour plot: Interaction effect of factors on carbon nanofiber (CNF) yield (%). Contour Plot of Interactions between Temperature and Catalyst Weight (a), Temperature and Hydrocarbon Flow Rate (c), Temperature and Catalyst Promoter Concentration (e), Hydrocarbon Flow Rate and Catalyst Weight (g), Catalyst Promoter Concentration and catalyst weight (i), Catalyst Promoter Concentration and Hydrocarbon Flow Rate (k), and 3D Wireframe Surface Plot of the Interactions between Temperature and Catalyst Weight (b), Temperature and Hydrocarbon Flow Rate (d), Temperature and Catalyst Promoter Concentration (f), Hydrocarbon Flow Rate and Catalyst Weight (h), Catalyst Promoter Concentration and Catalyst Weight (j), Catalyst Promoter Concentration and Hydrocarbon Flow Rate (l) on Yield of CNF.
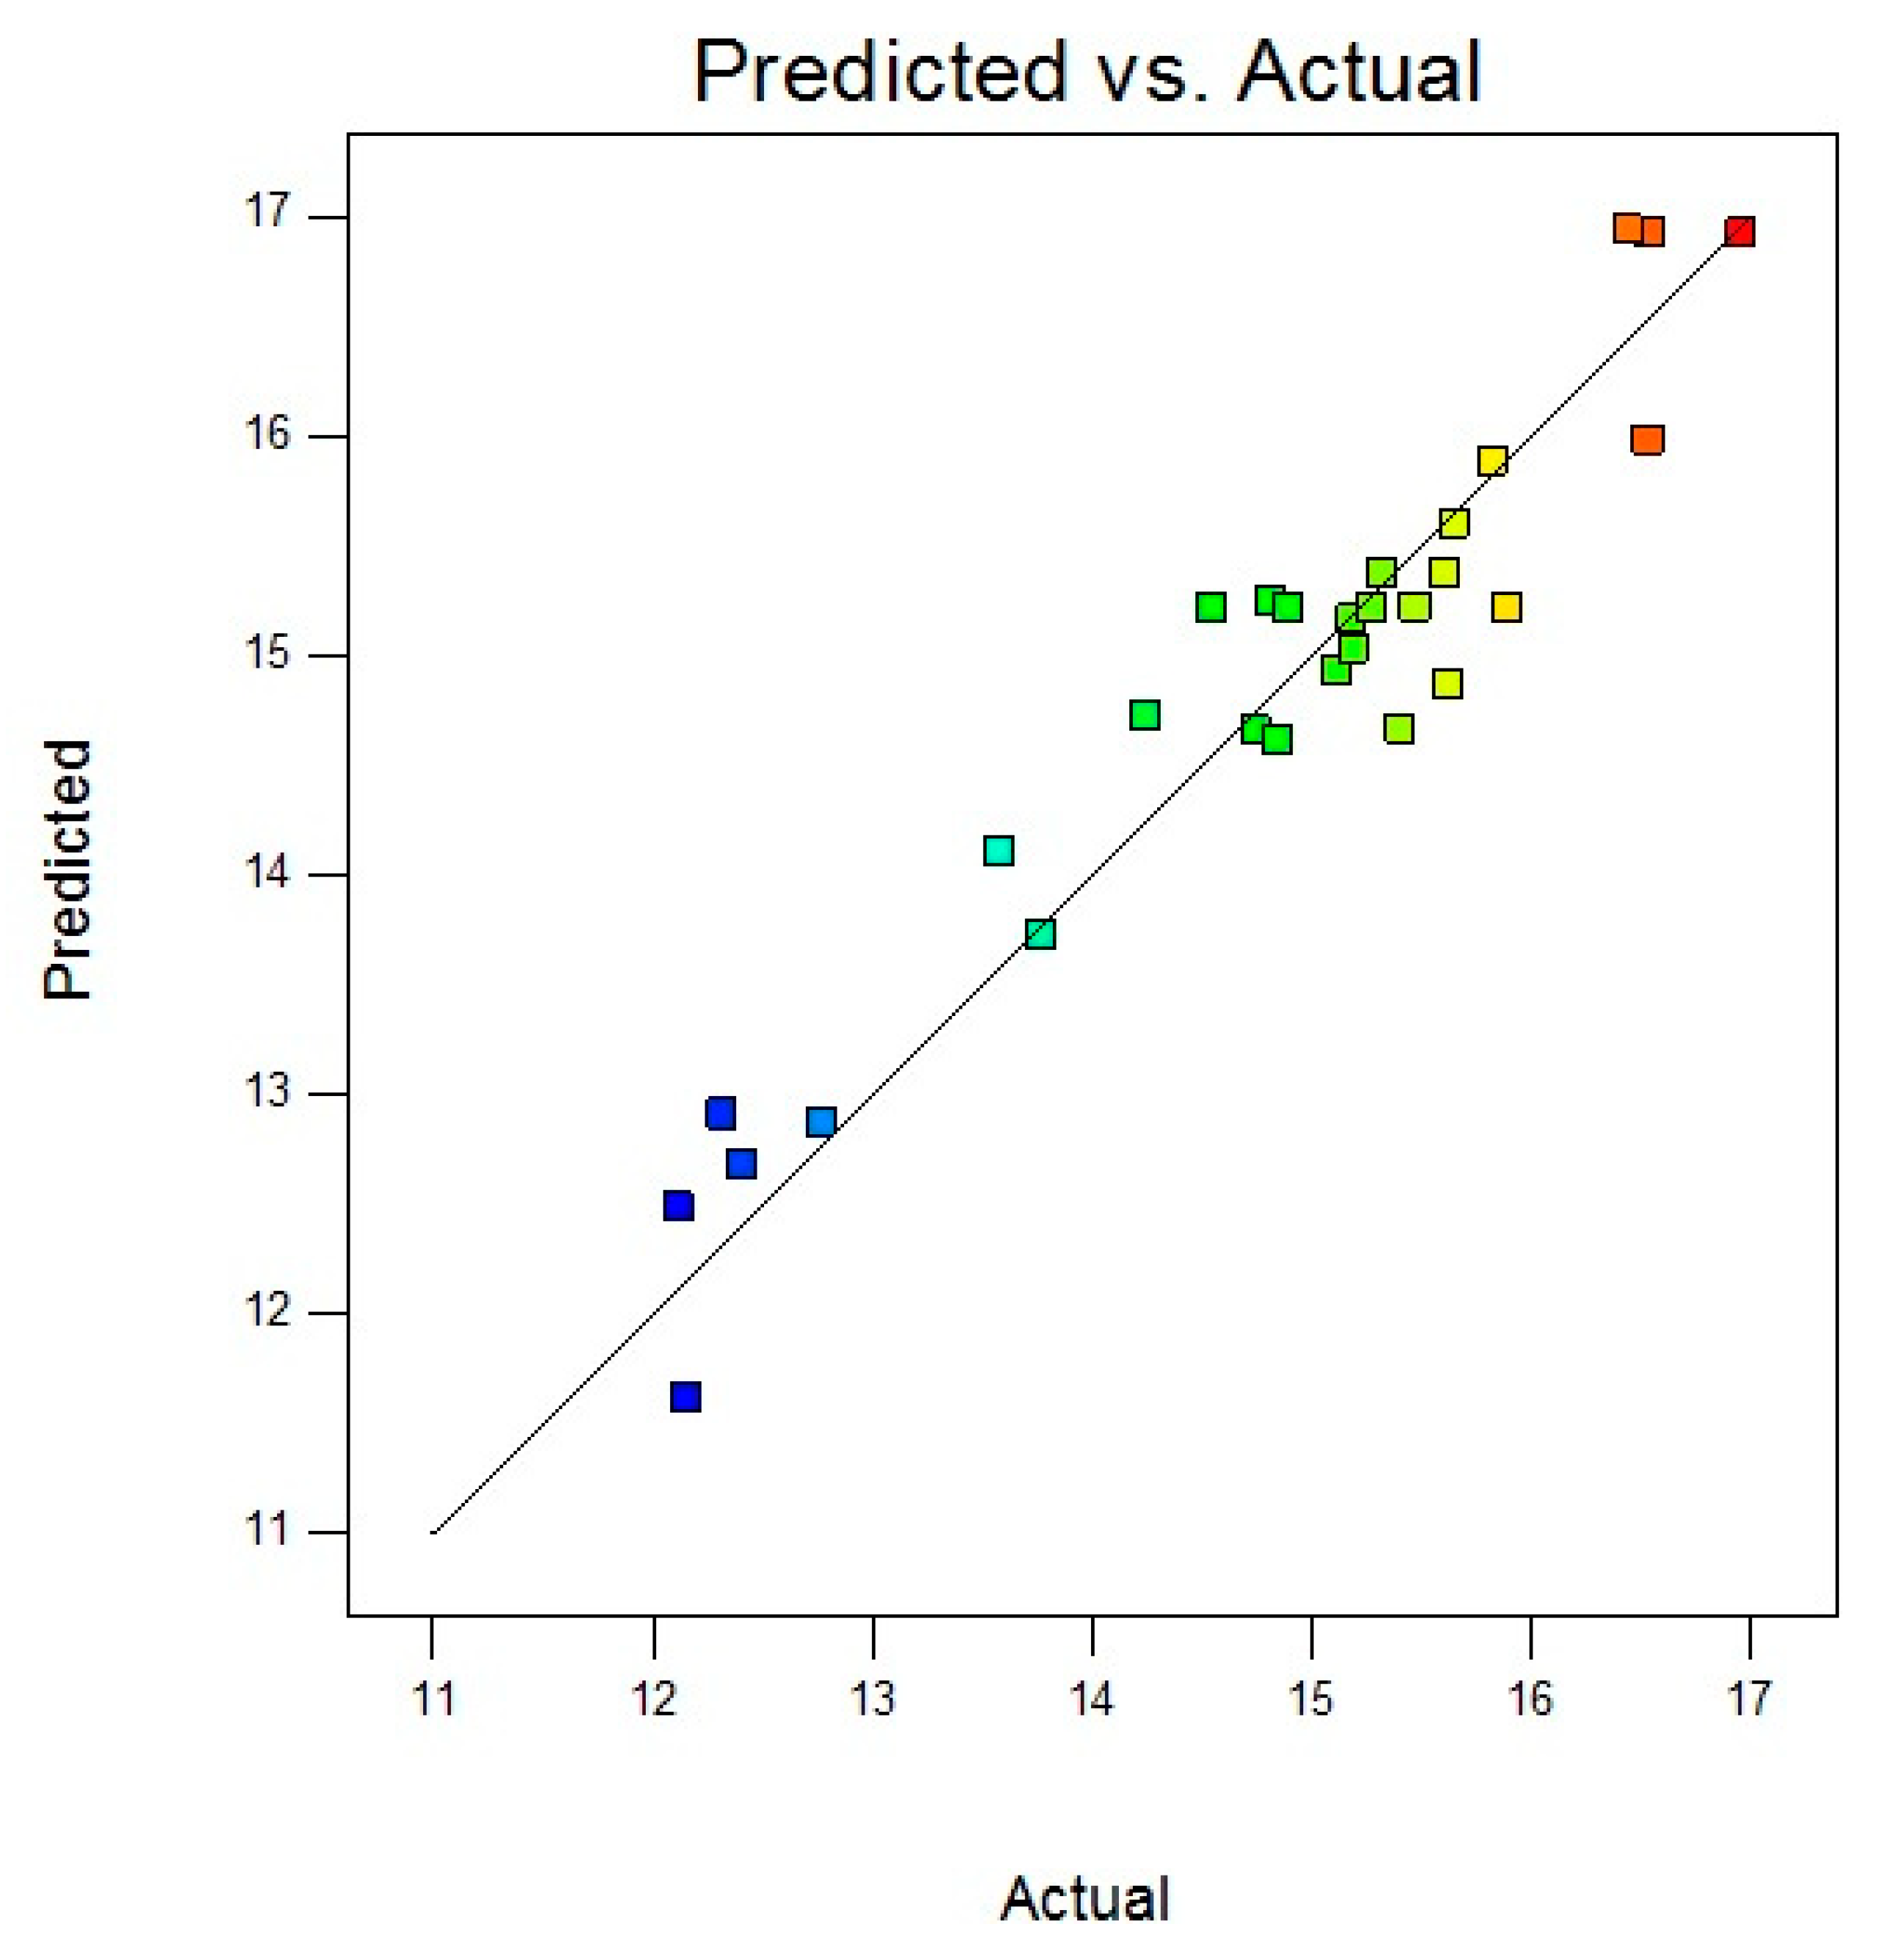
Figure 3.
Correspondence plot of predicted and actual values of CNF yield (%).
Figure 3.
Correspondence plot of predicted and actual values of CNF yield (%).
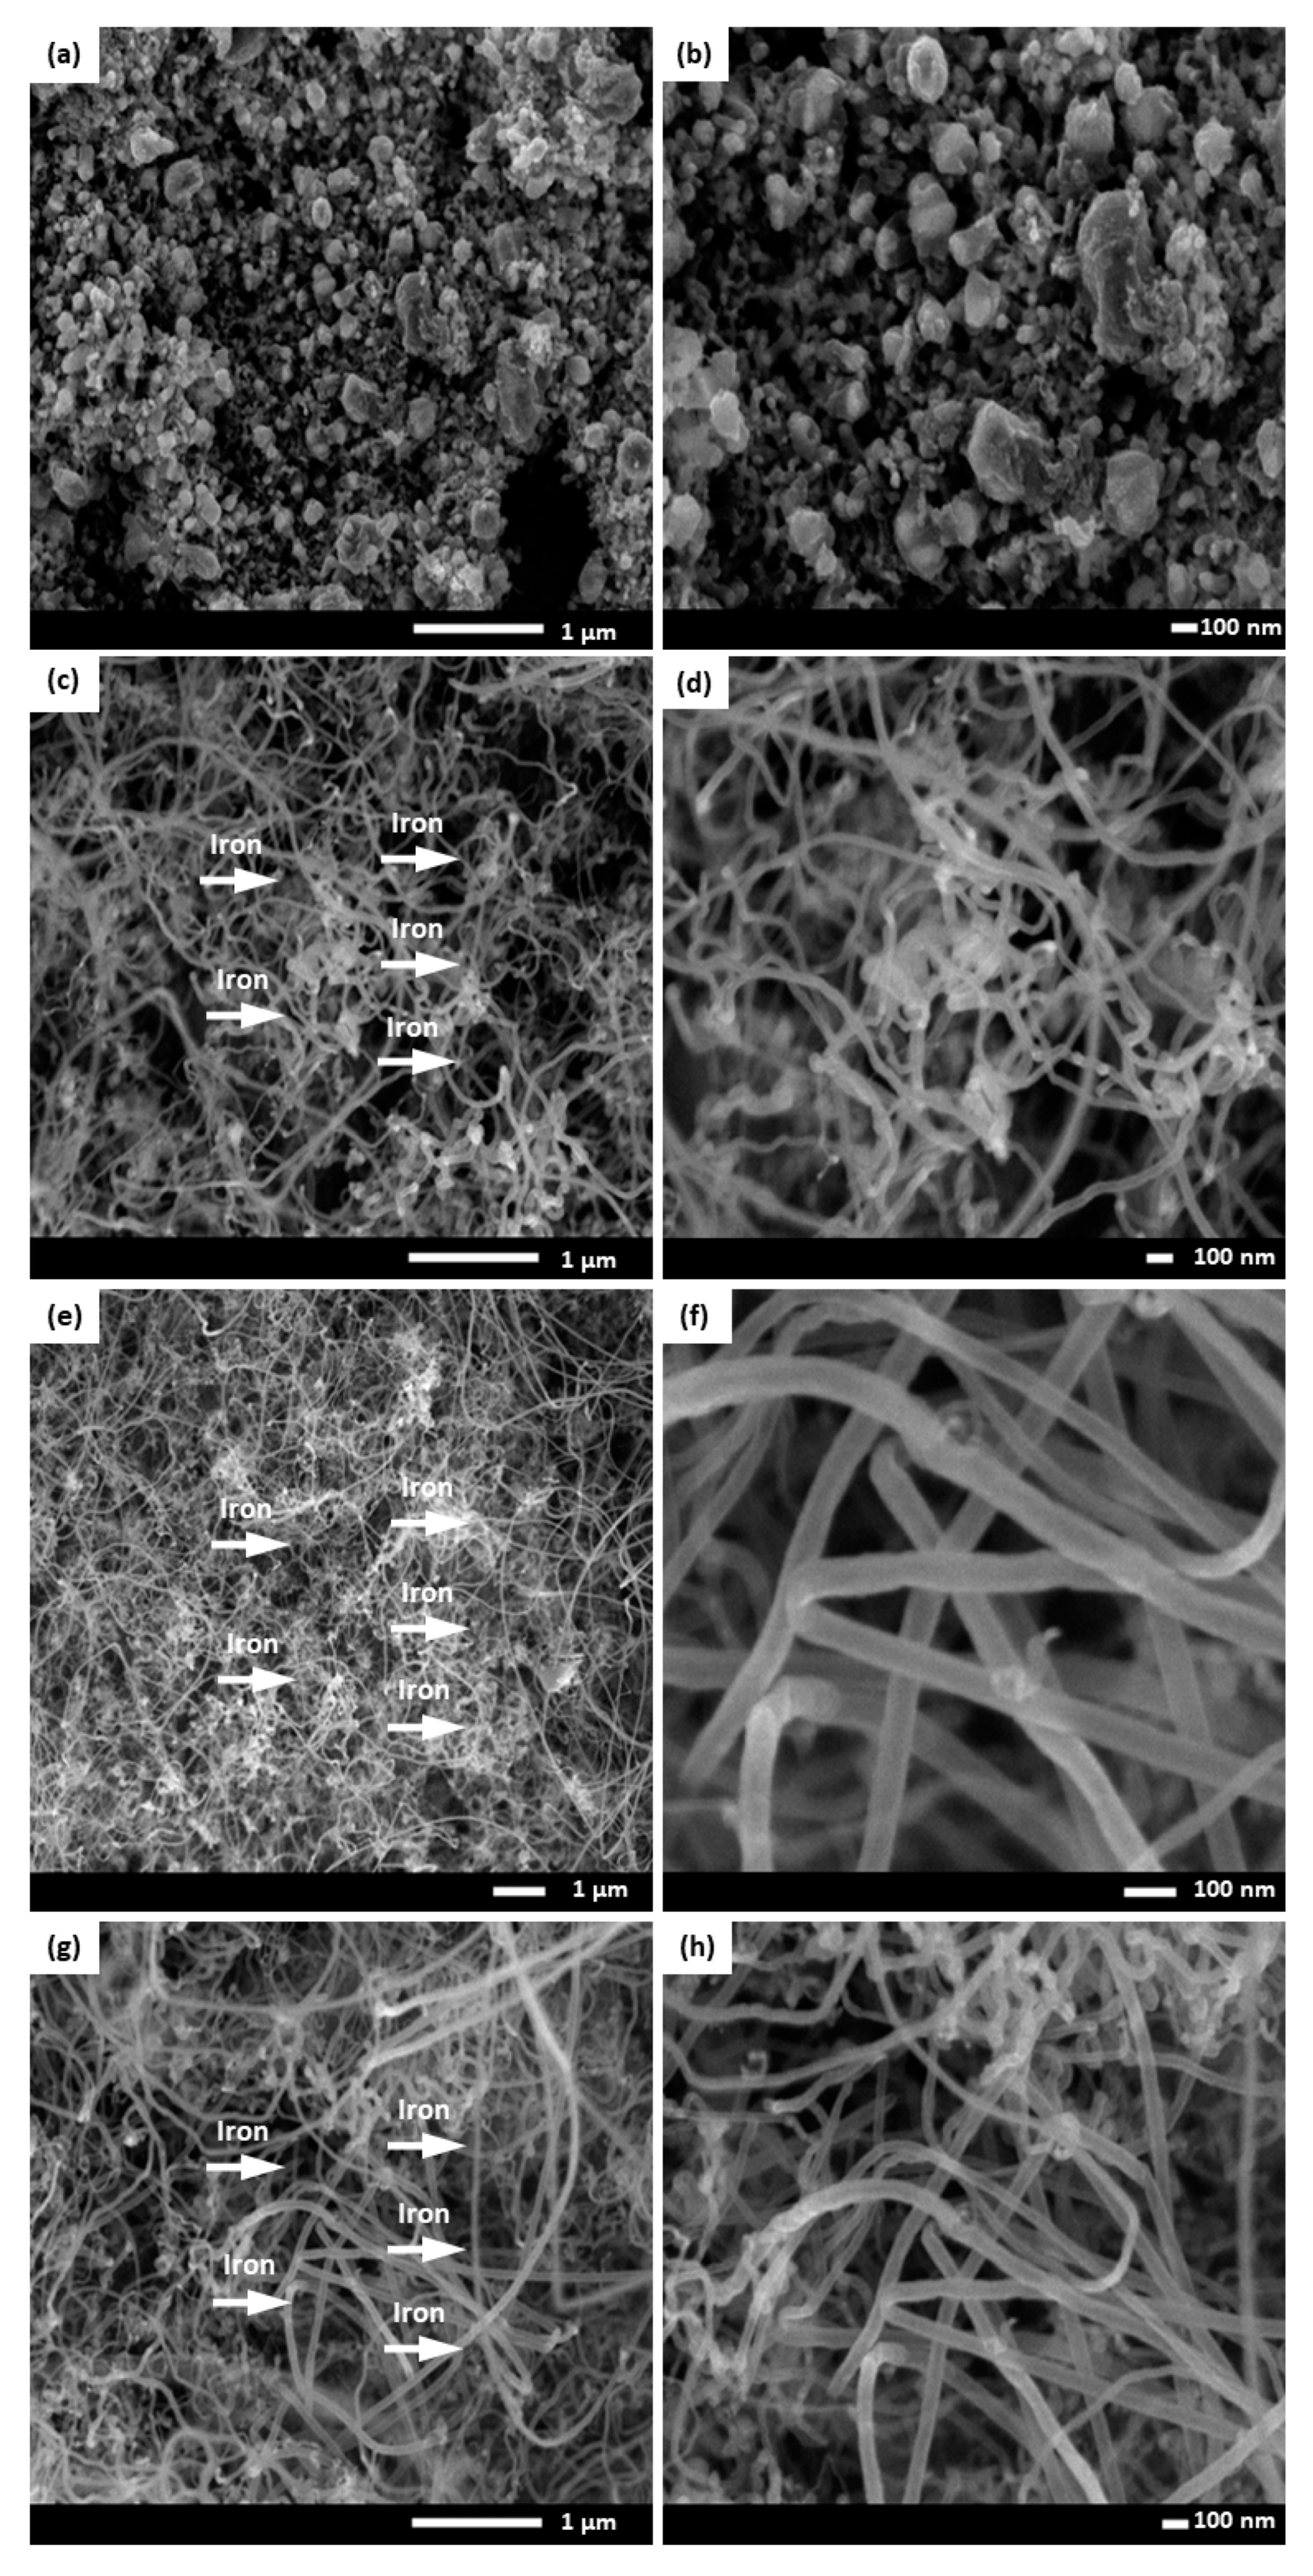
Figure 4.
FE-SEM images of the carbon nanofiber-coated monoliths (CNFCMs) synthesized at various temperatures (a and b) 600 °C, (c and d) 700 °C, (e and f) 800 °C, (g and h) 900 °C. Red arrow: iron catalyst.
Figure 4.
FE-SEM images of the carbon nanofiber-coated monoliths (CNFCMs) synthesized at various temperatures (a and b) 600 °C, (c and d) 700 °C, (e and f) 800 °C, (g and h) 900 °C. Red arrow: iron catalyst.
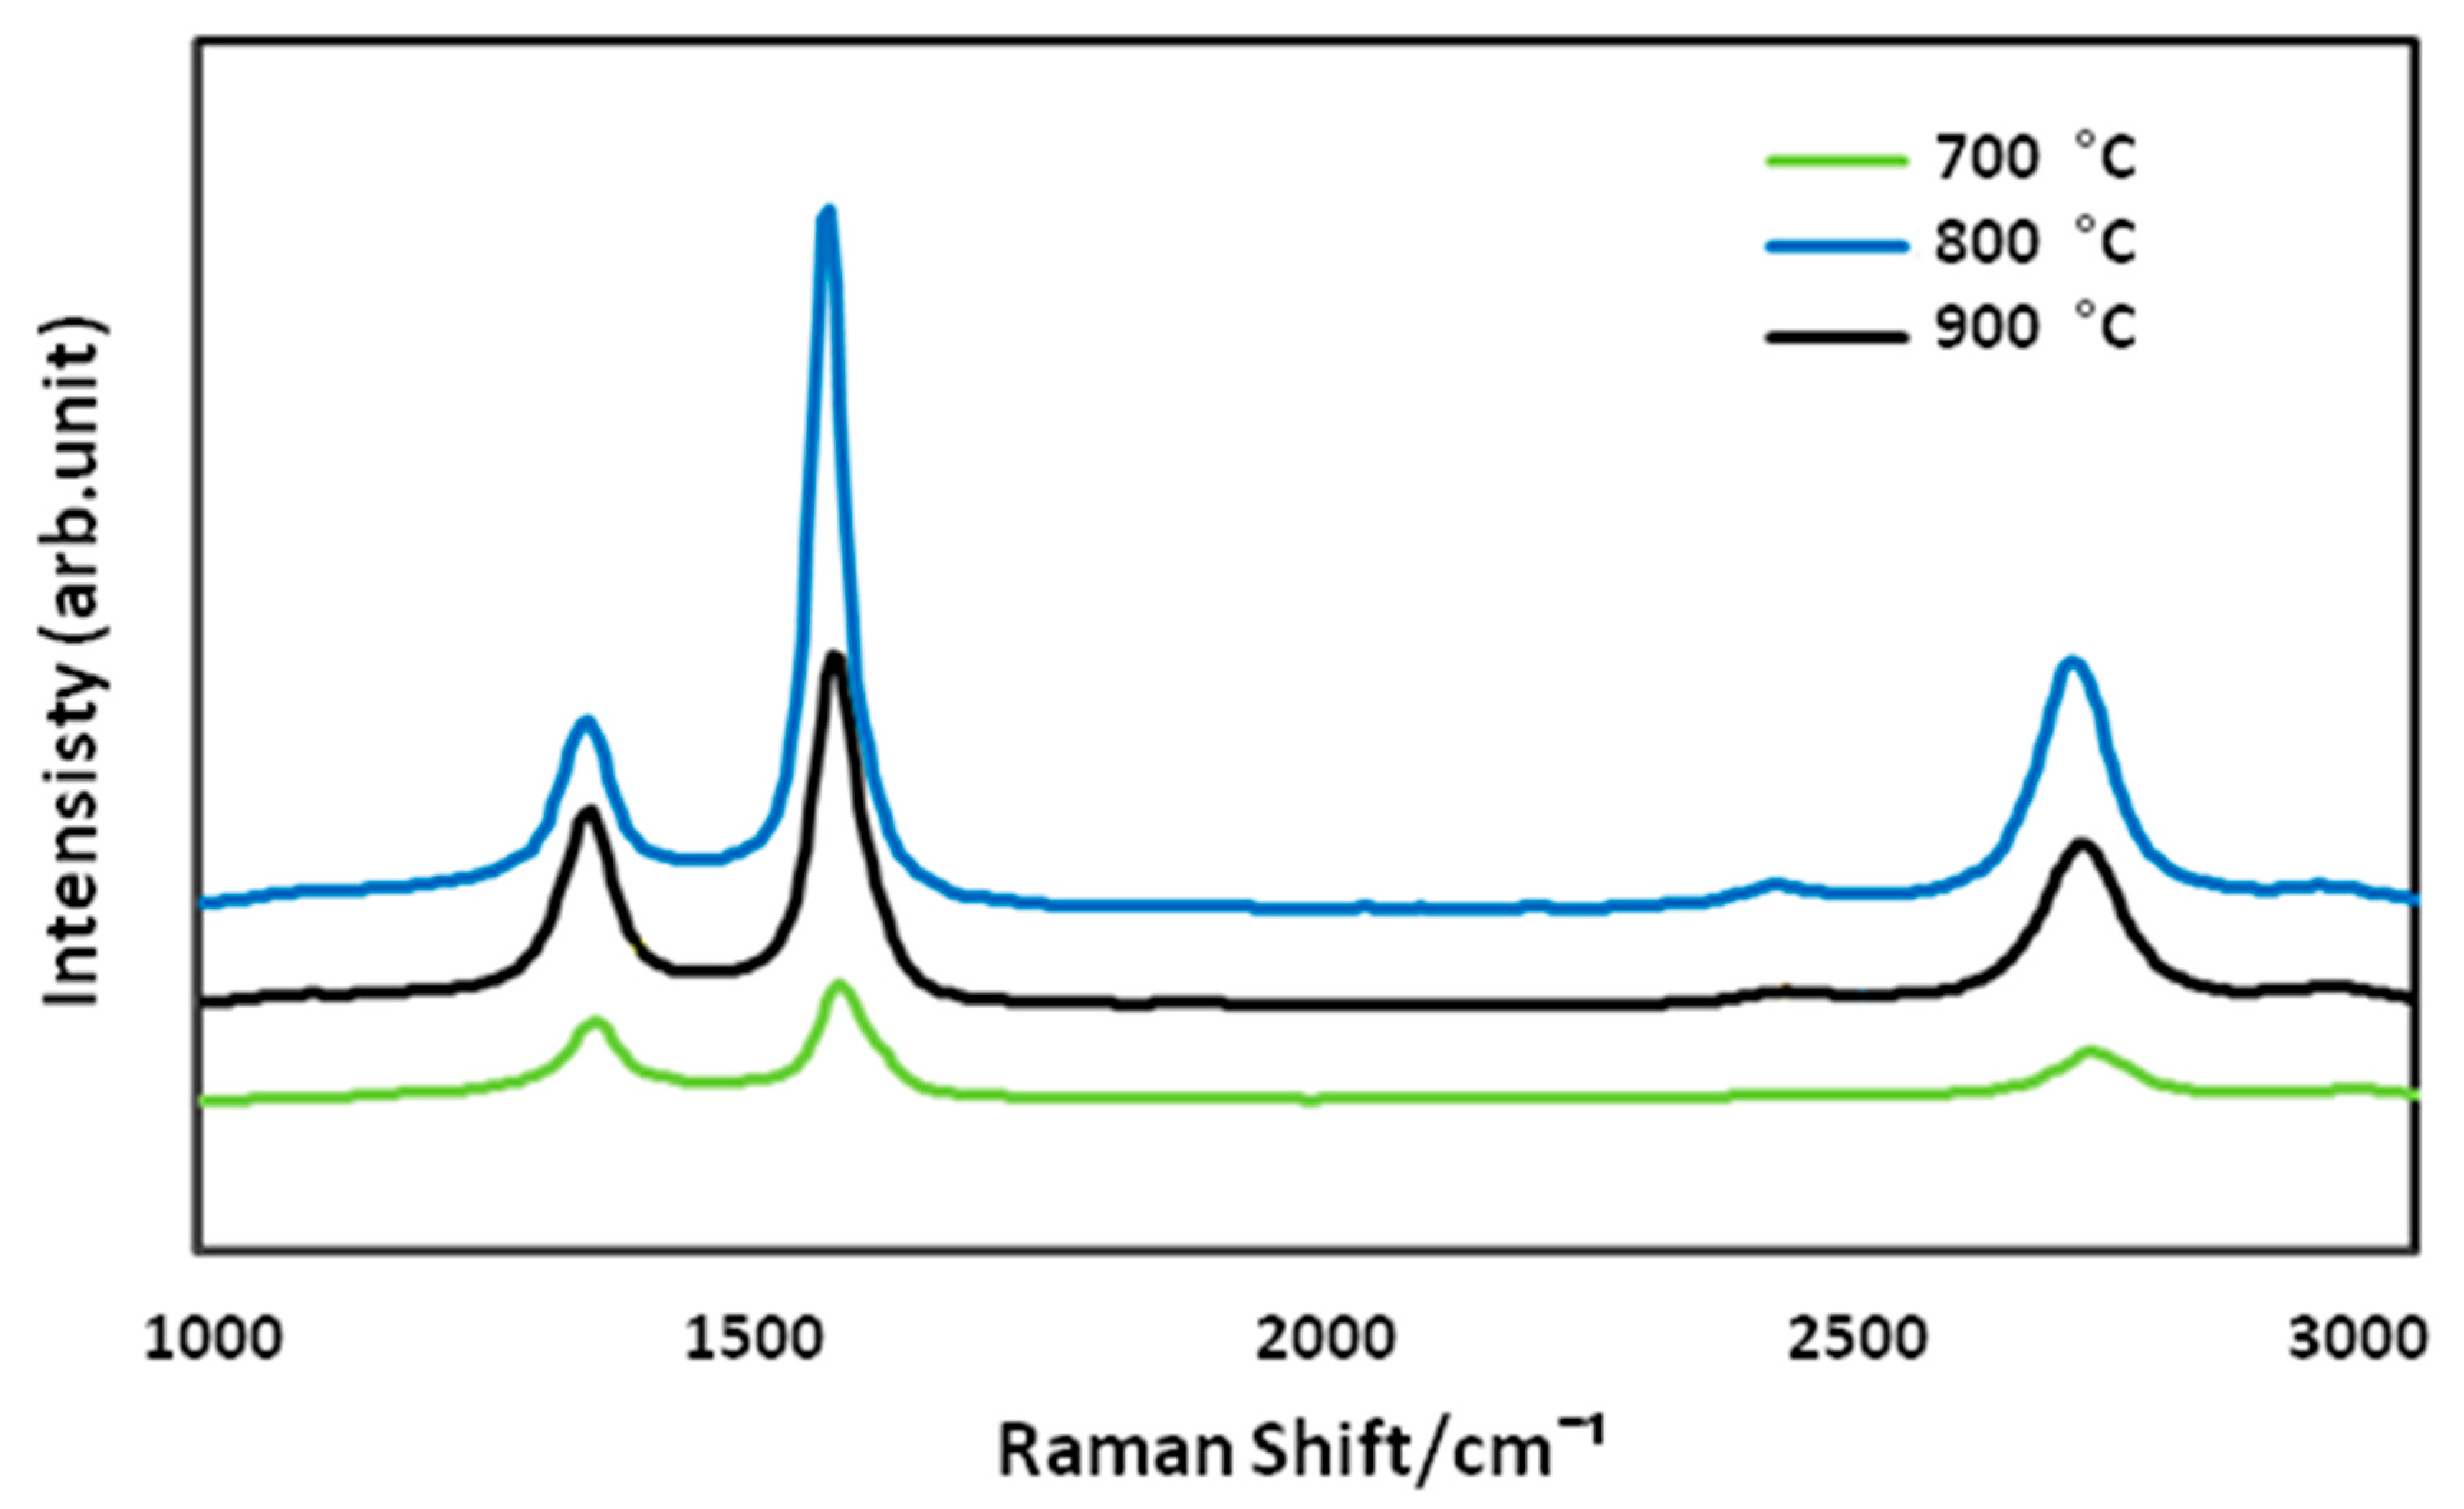
Figure 5.
Raman spectra of the CNFCMs synthesized at various temperatures.
Figure 5.
Raman spectra of the CNFCMs synthesized at various temperatures.
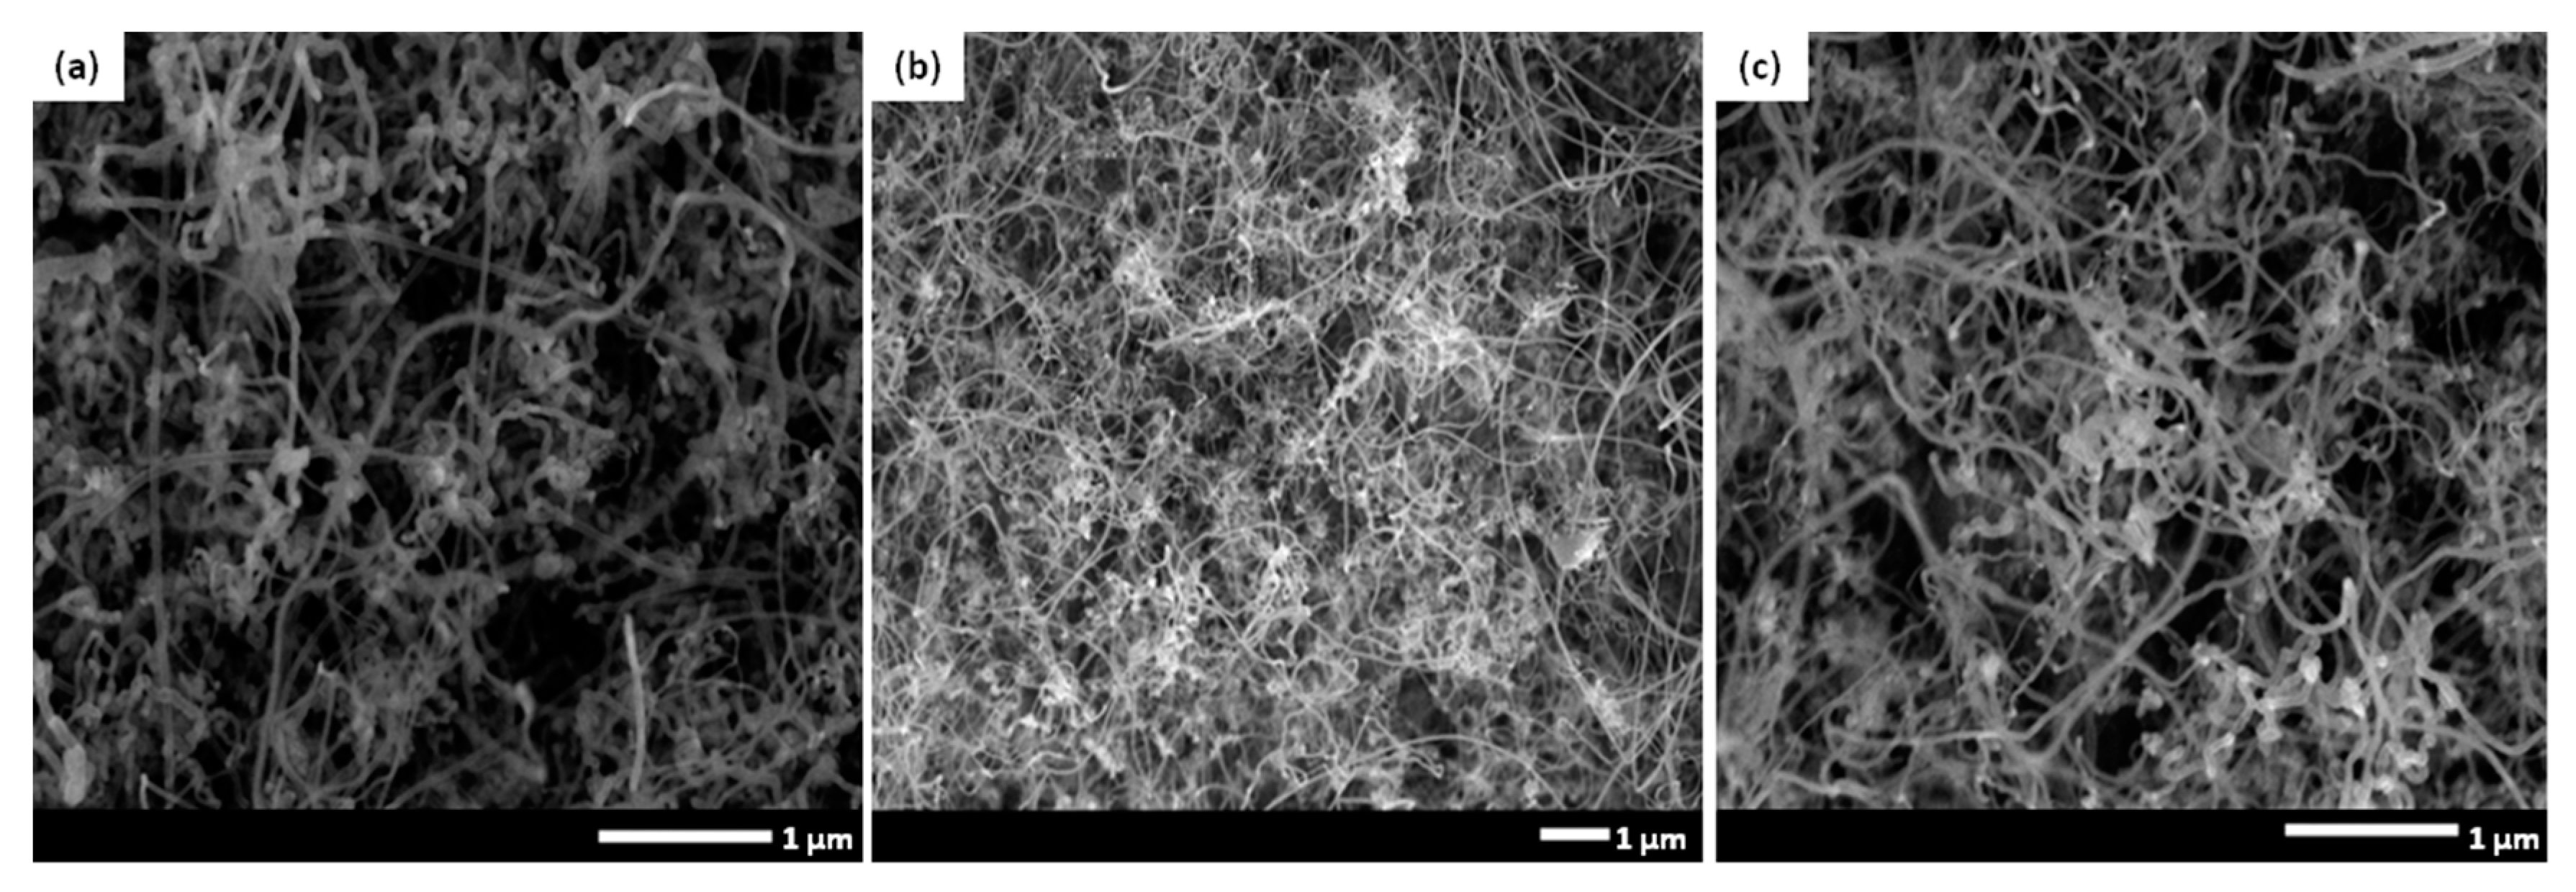
Figure 6.
FE-SEM images of CNFs prepared with different ferrocene concentrations: (a) ferrocene (1.00 g), (b) ferrocene (2.21 g), (c) ferrocene (3.00 g).
Figure 6.
FE-SEM images of CNFs prepared with different ferrocene concentrations: (a) ferrocene (1.00 g), (b) ferrocene (2.21 g), (c) ferrocene (3.00 g).
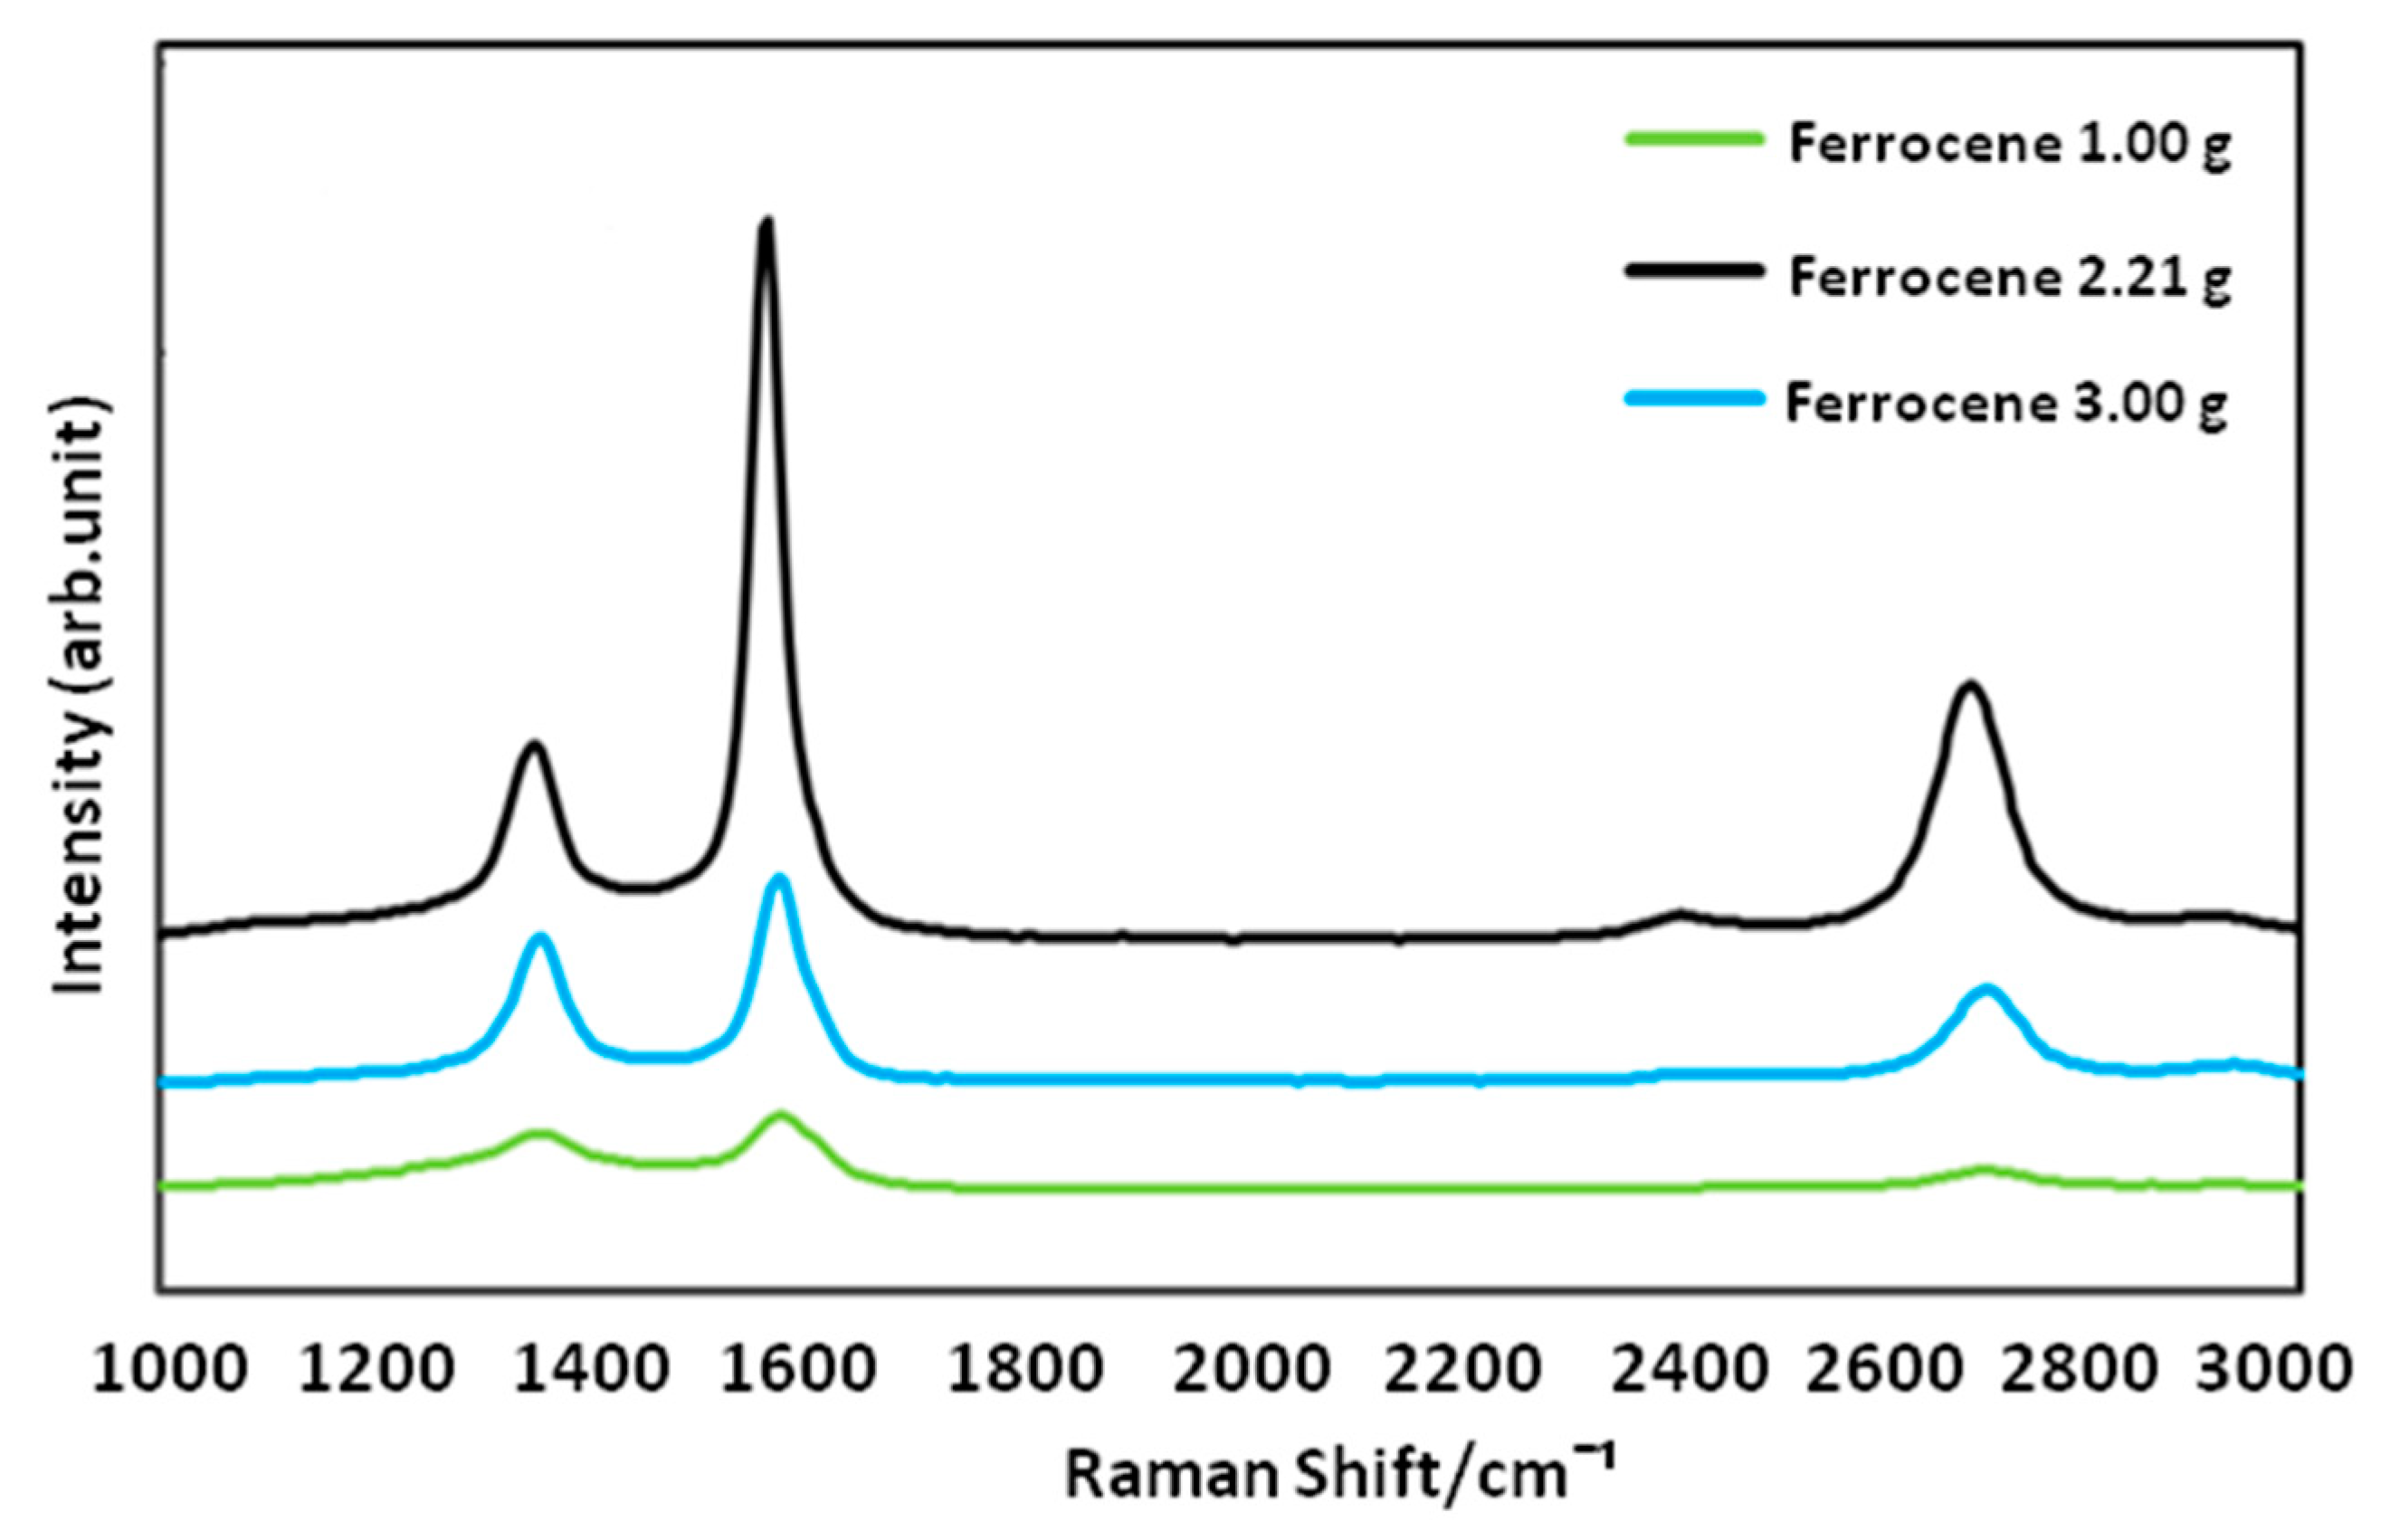
Figure 7.
Raman spectra of CNFs prepared with different ferrocene concentrations.
Figure 7.
Raman spectra of CNFs prepared with different ferrocene concentrations.
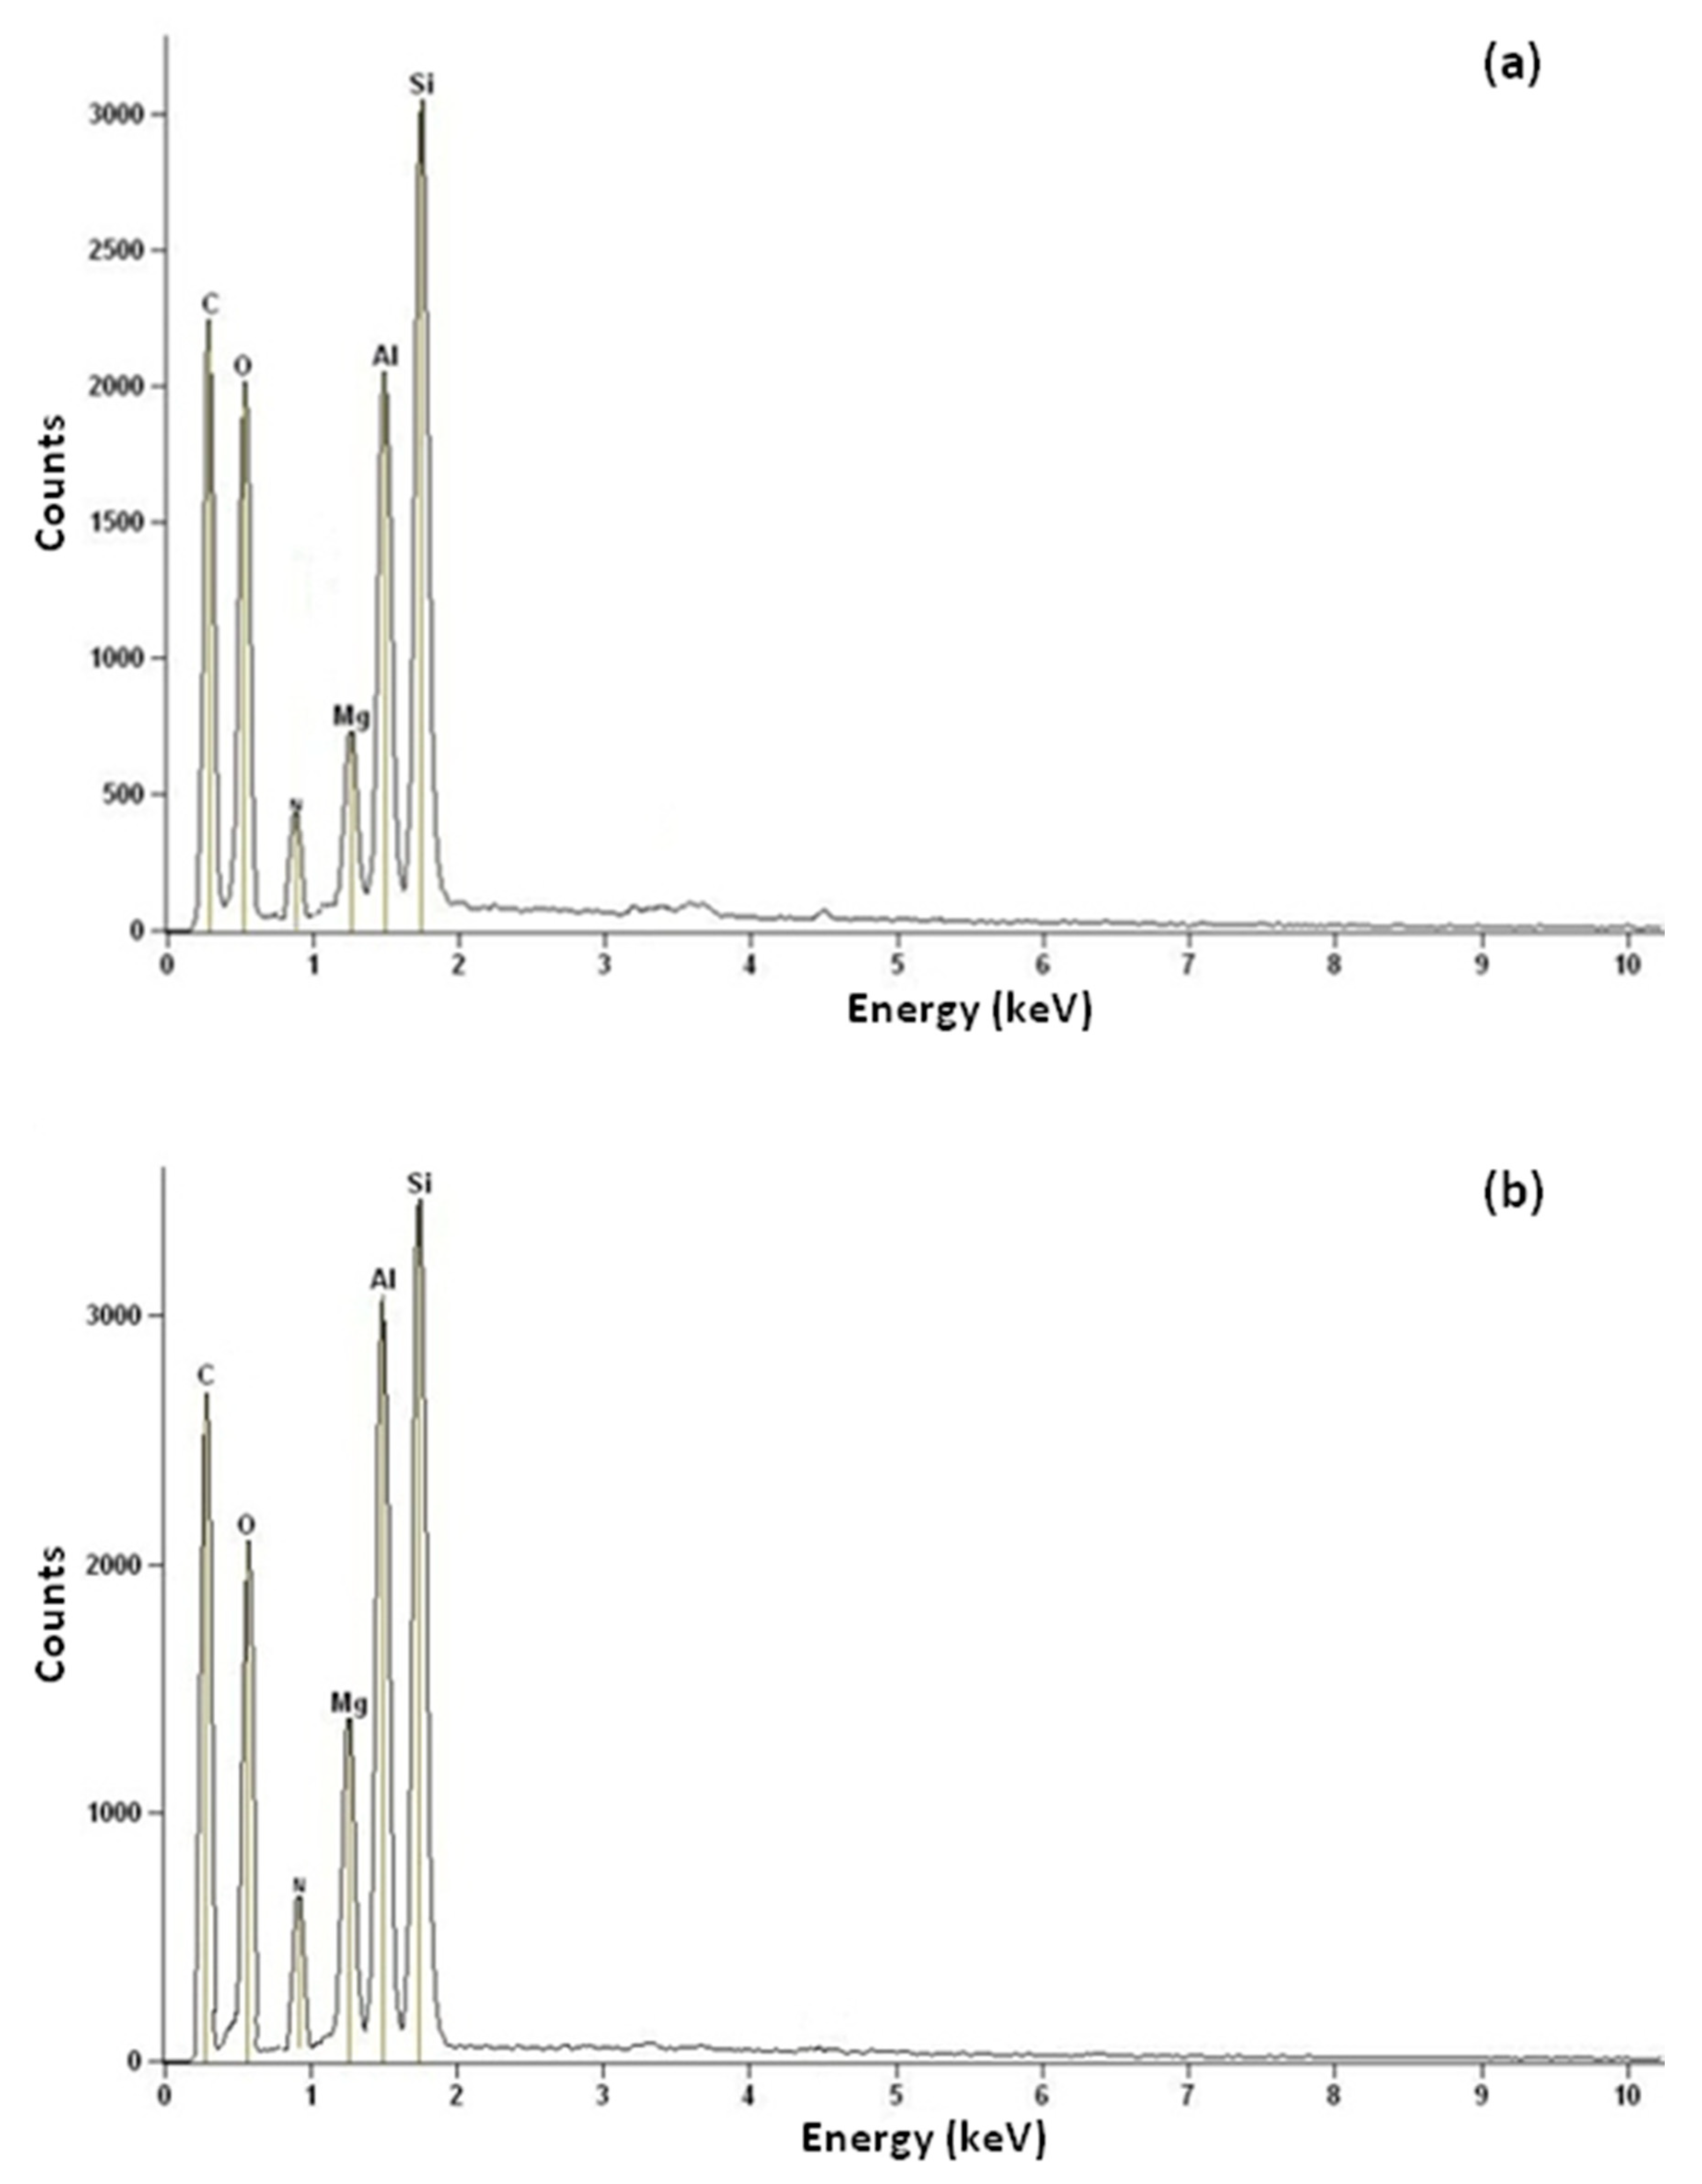
Figure 8.
EDX analysis of (a) CNFCM and (b) modified CNFCM.
Figure 8.
EDX analysis of (a) CNFCM and (b) modified CNFCM.
Figure 9.
N2 ads–des isotherm of CNFCM and modified CNFCM.
Figure 9.
N2 ads–des isotherm of CNFCM and modified CNFCM.
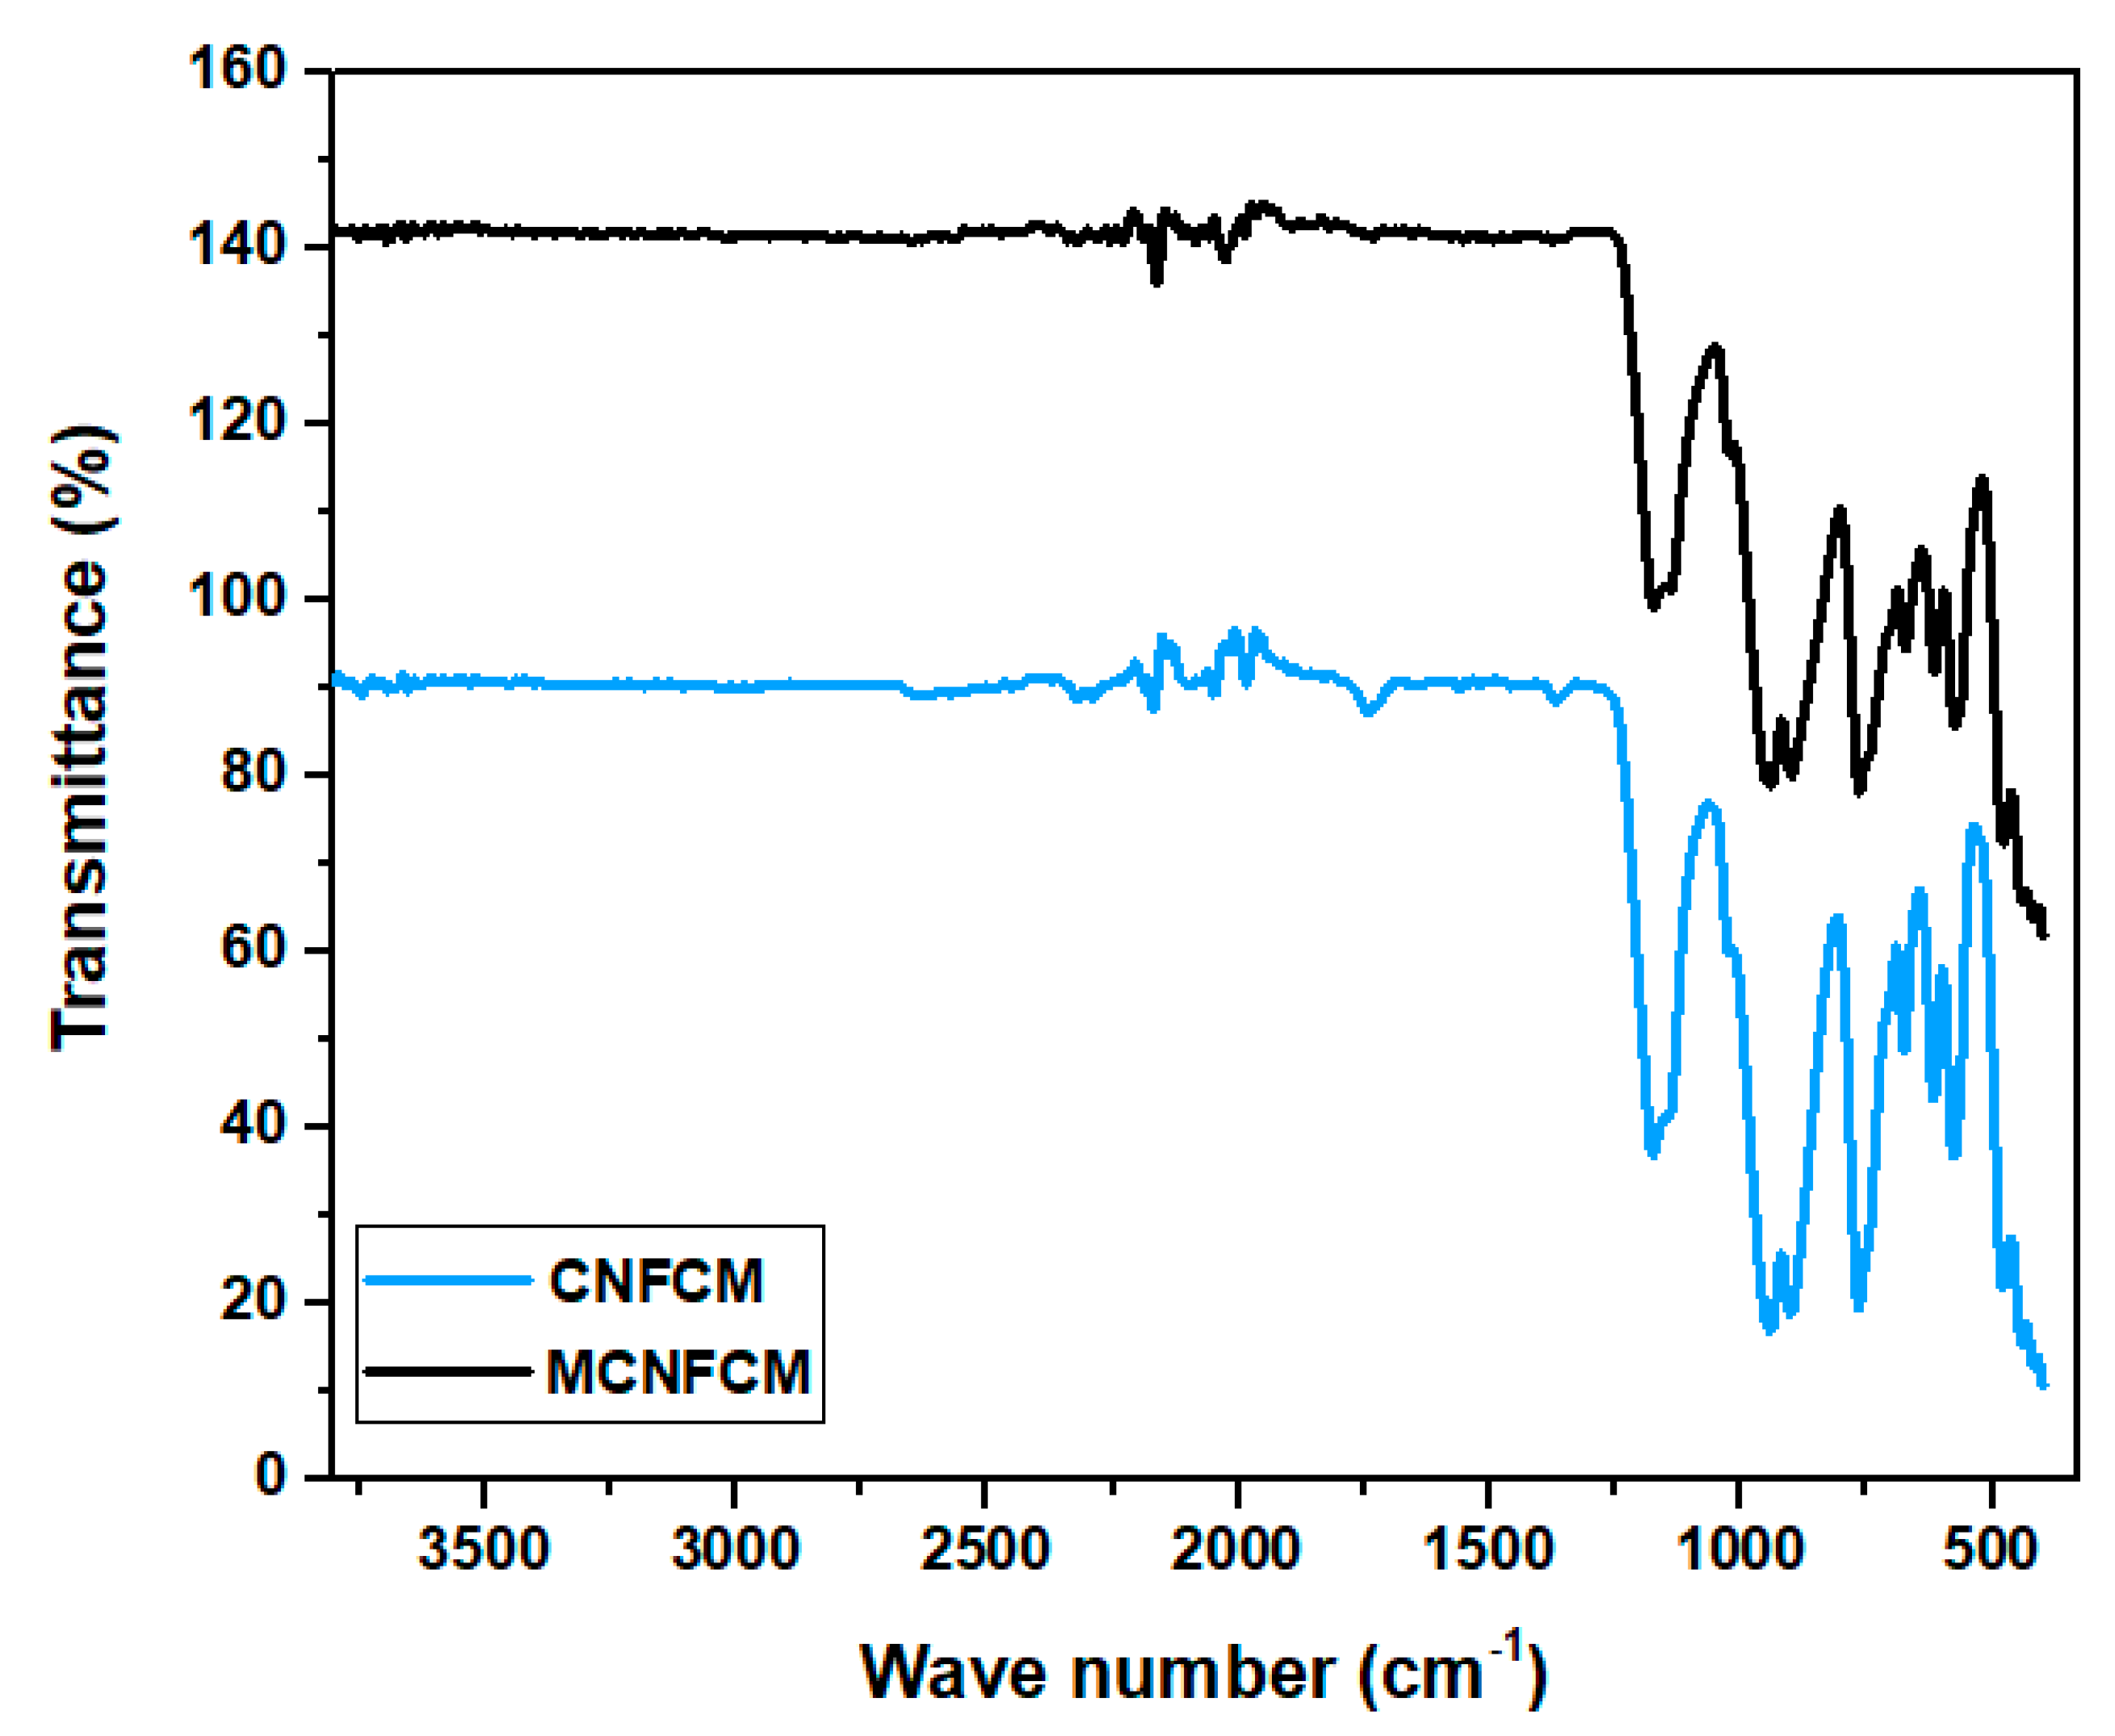
Figure 10.
FTIR spectrums of CNFCM and modified CNFCM prepared over the following reaction conditions: reaction temperature of 800 °C, furfuryl alcohol flow of 0.08525 mL/min, ferrocene catalyst concentration of 2.21 g.
Figure 10.
FTIR spectrums of CNFCM and modified CNFCM prepared over the following reaction conditions: reaction temperature of 800 °C, furfuryl alcohol flow of 0.08525 mL/min, ferrocene catalyst concentration of 2.21 g.
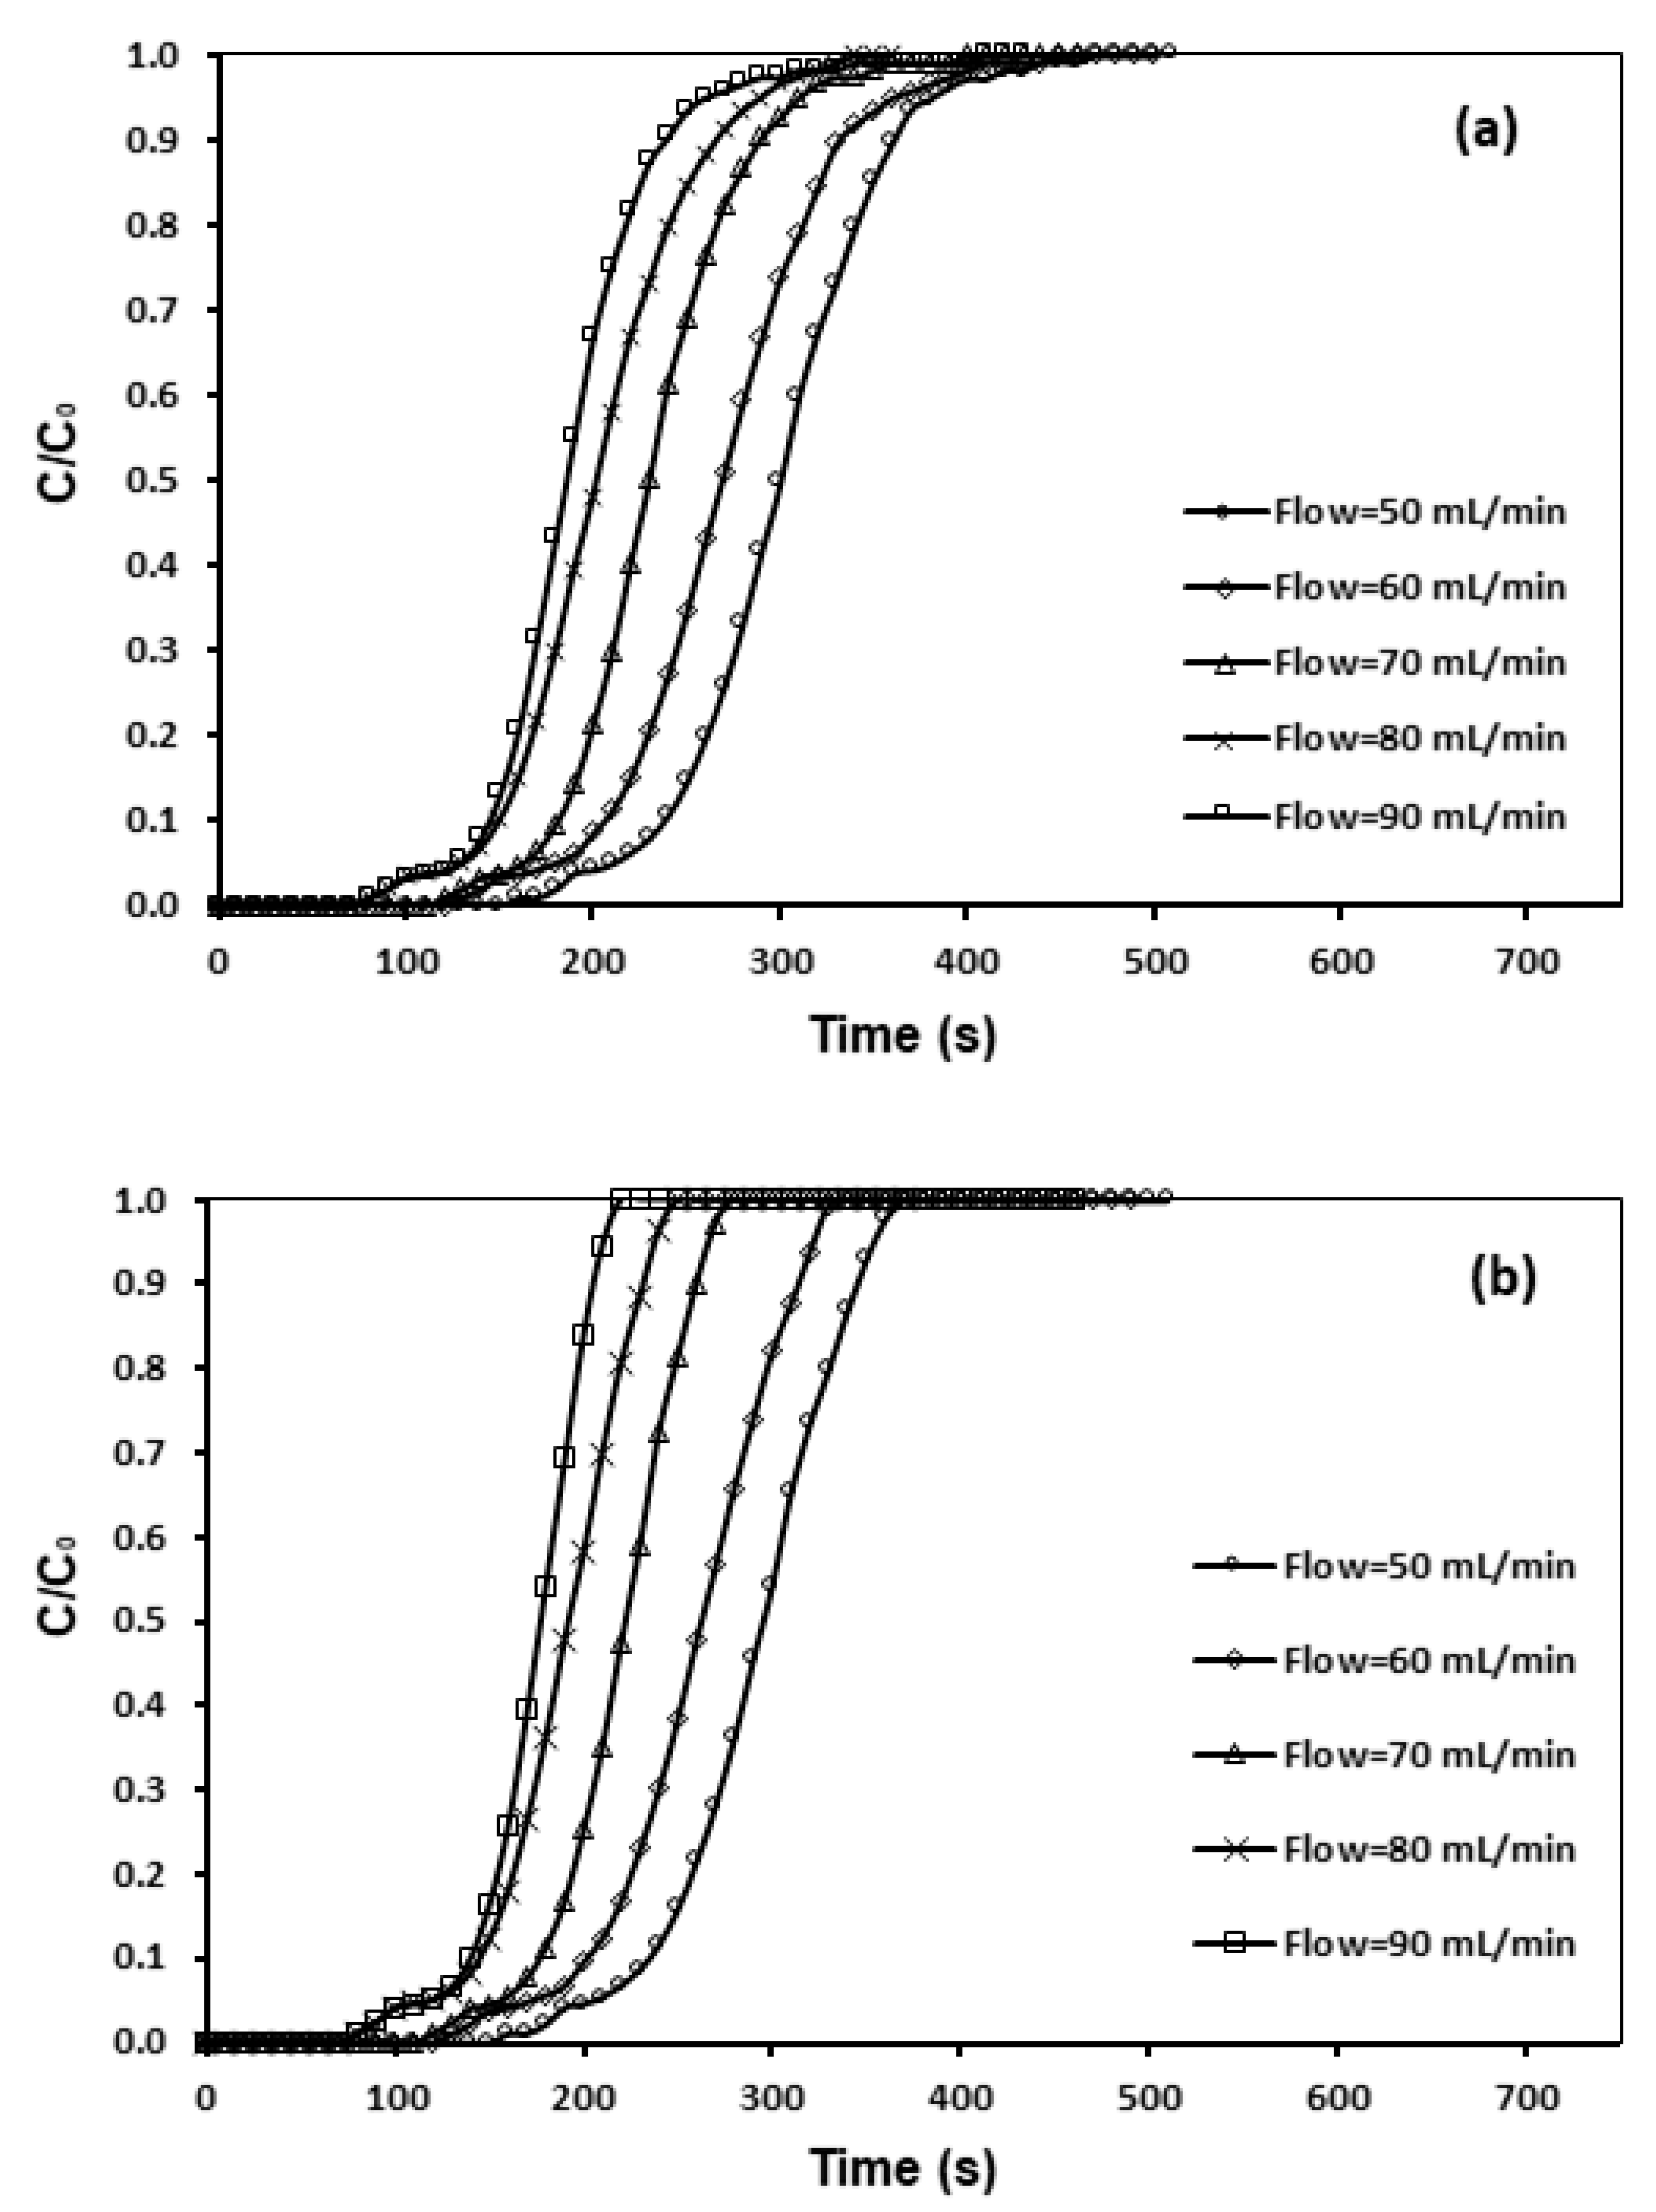
Figure 11.
Breakthrough curve and effect of flow rate of (a) CNFCM and (b) modified CNFCM in constant T = 30 °C, P = 1 bar and 10% CO2.
Figure 11.
Breakthrough curve and effect of flow rate of (a) CNFCM and (b) modified CNFCM in constant T = 30 °C, P = 1 bar and 10% CO2.
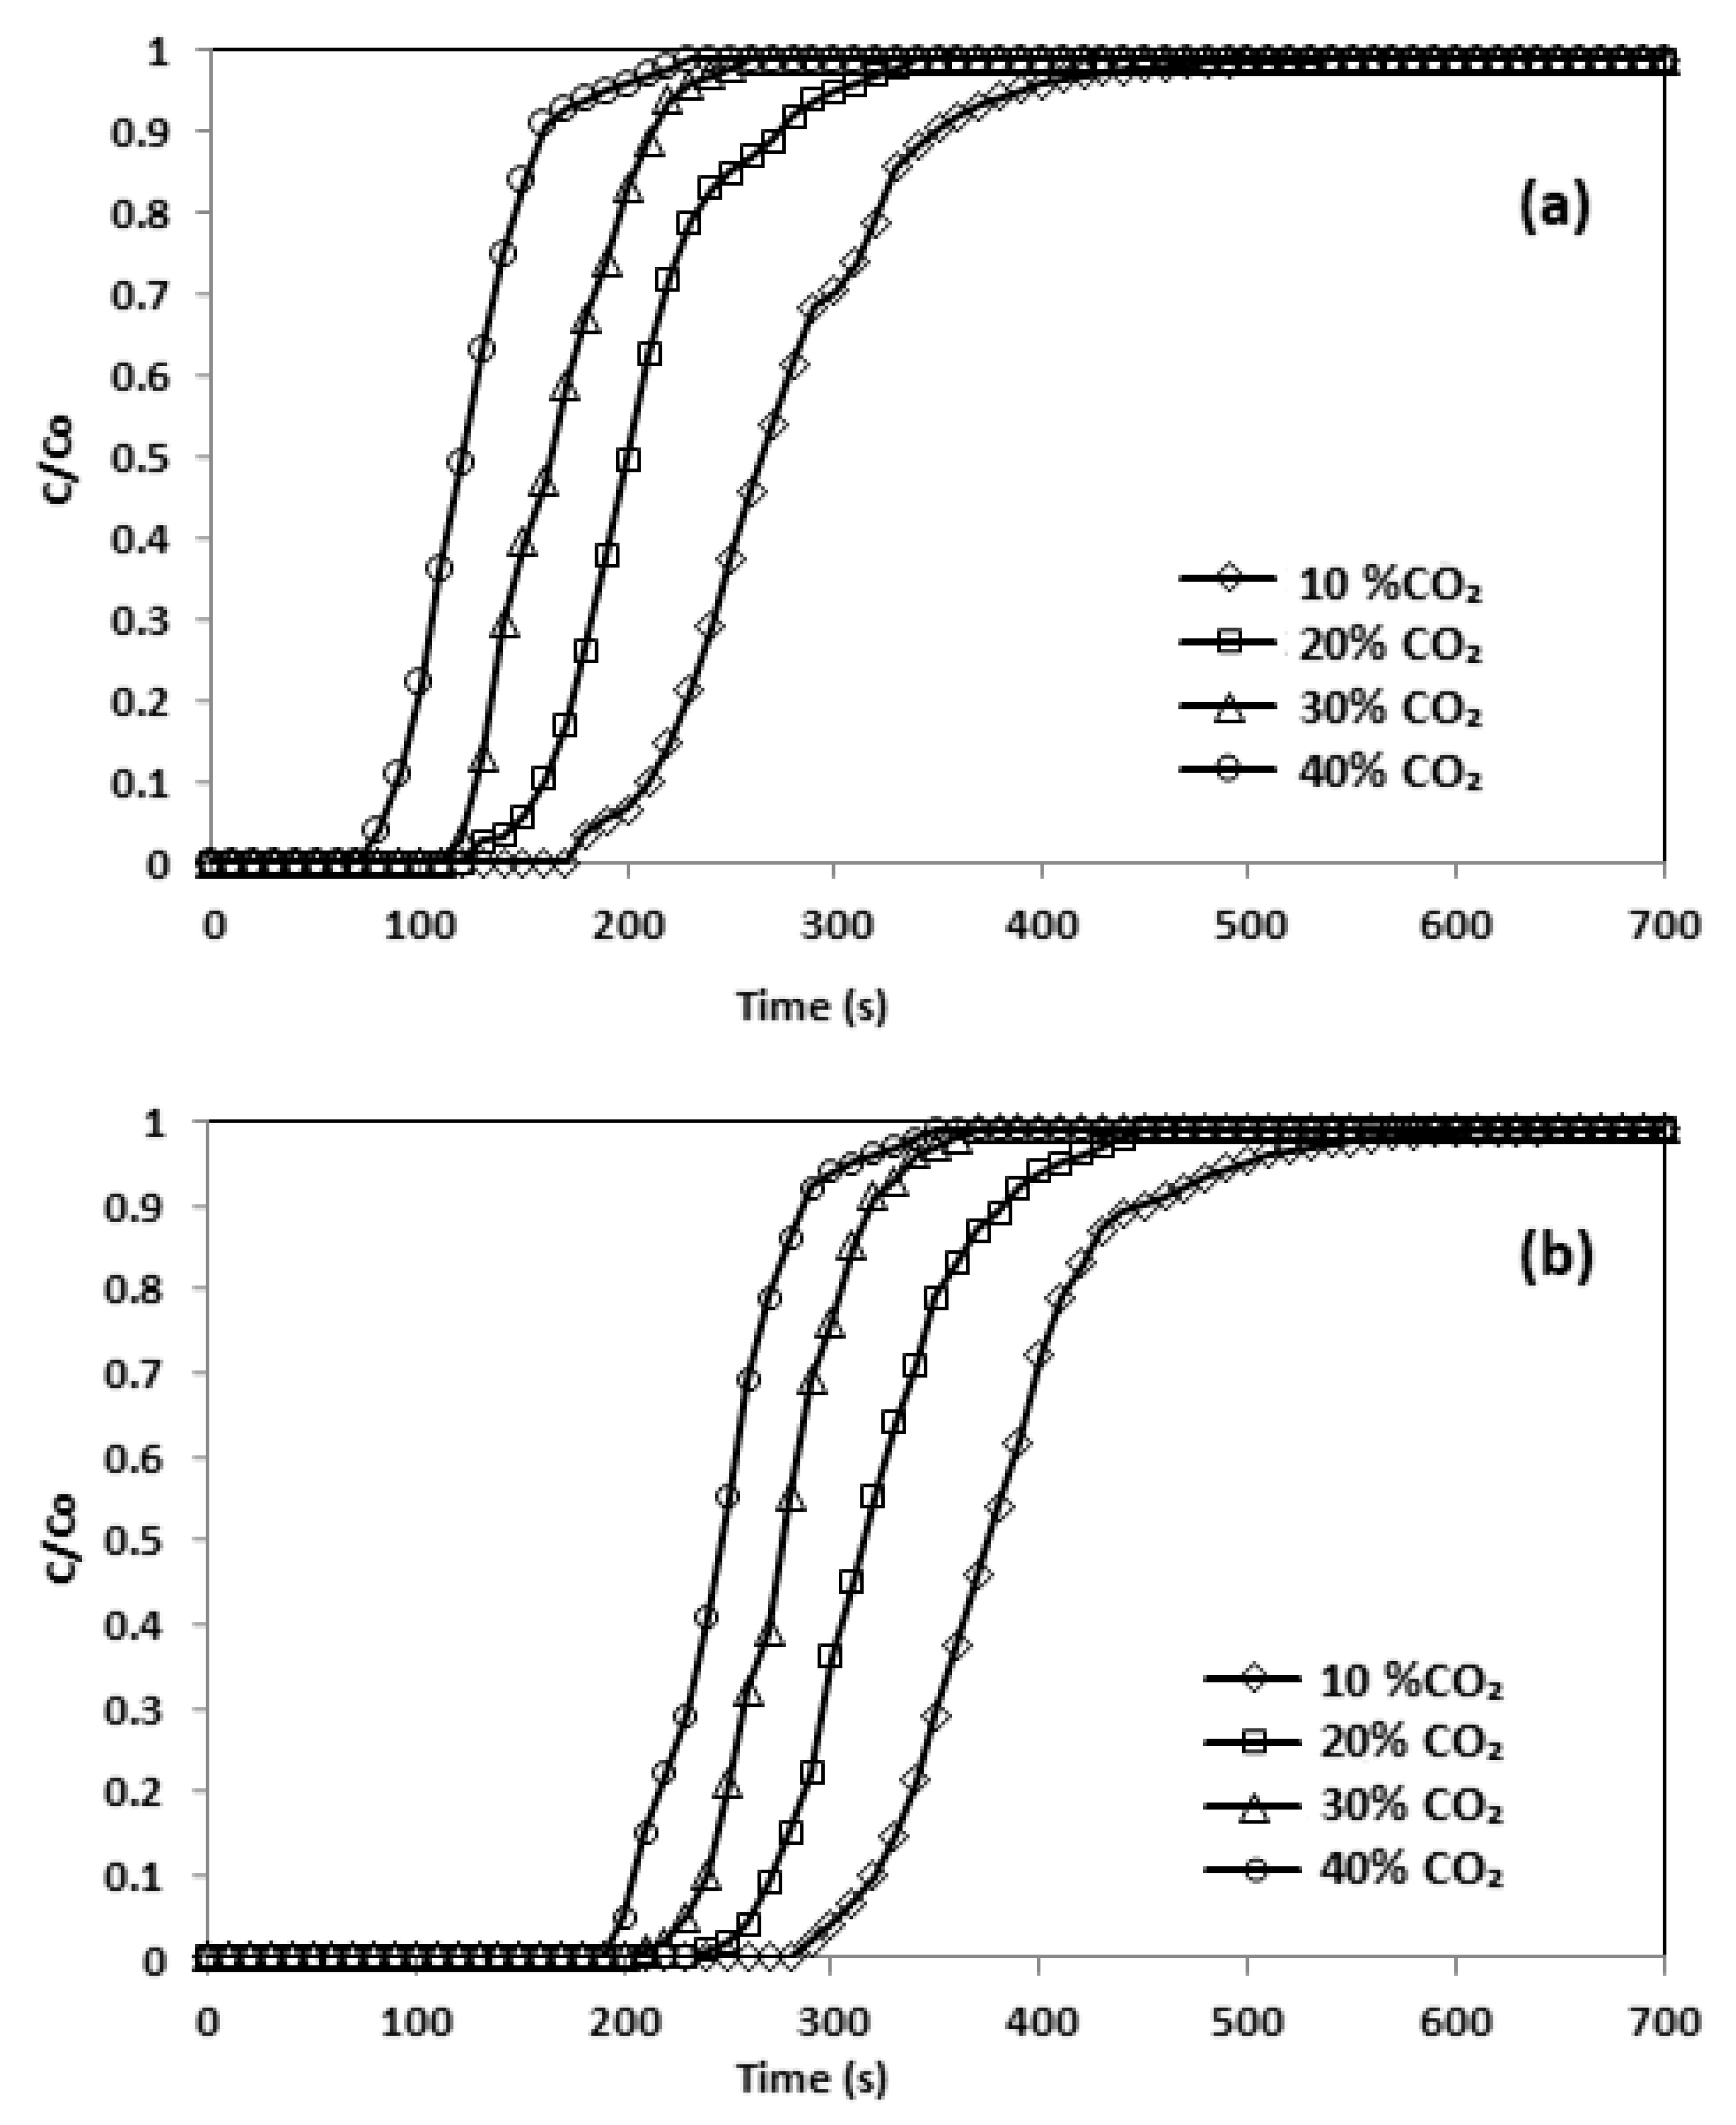
Figure 12.
Breakthrough curve and effect of initial concentration (a) CNFCM and (b) modified CNFCM in constant T = 30 °C, P = 1 bar and Flow = 50 mL/min.
Figure 12.
Breakthrough curve and effect of initial concentration (a) CNFCM and (b) modified CNFCM in constant T = 30 °C, P = 1 bar and Flow = 50 mL/min.
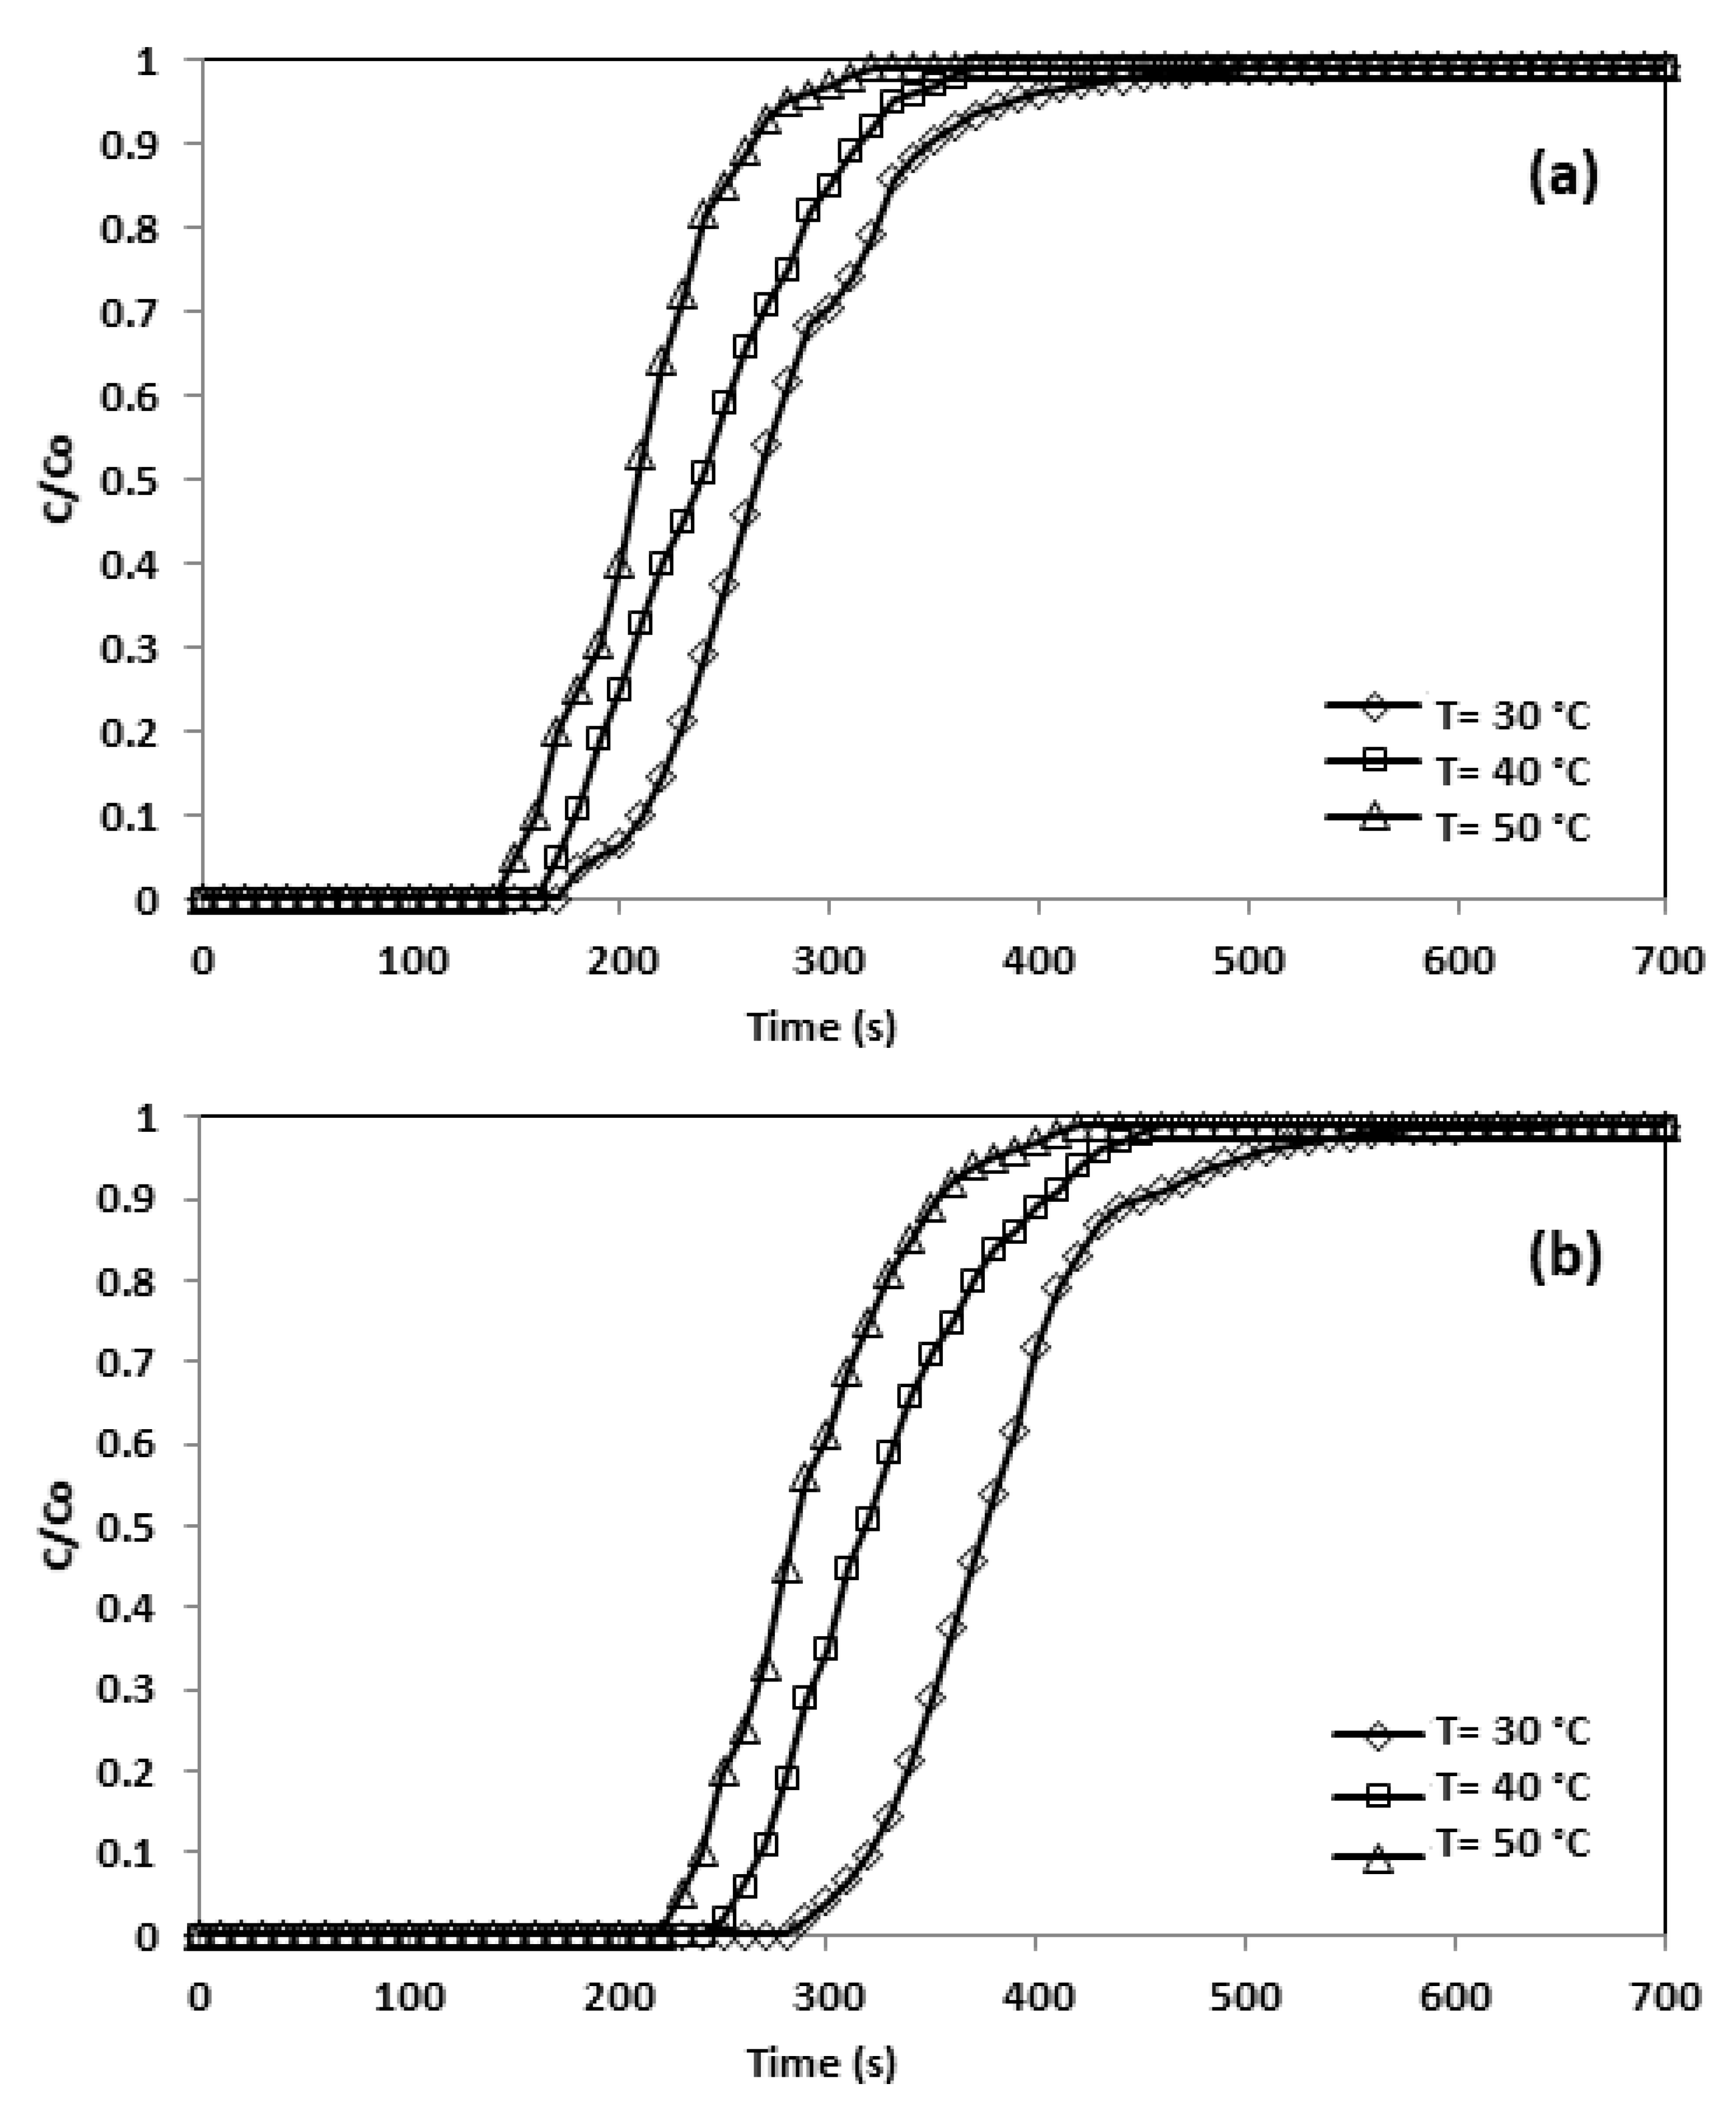
Figure 13.
Breakthrough curve and effect of temperature (a) CNFCM and (b) Modified CNFCM in constant P = 1 bar, and 10% CO2.
Figure 13.
Breakthrough curve and effect of temperature (a) CNFCM and (b) Modified CNFCM in constant P = 1 bar, and 10% CO2.
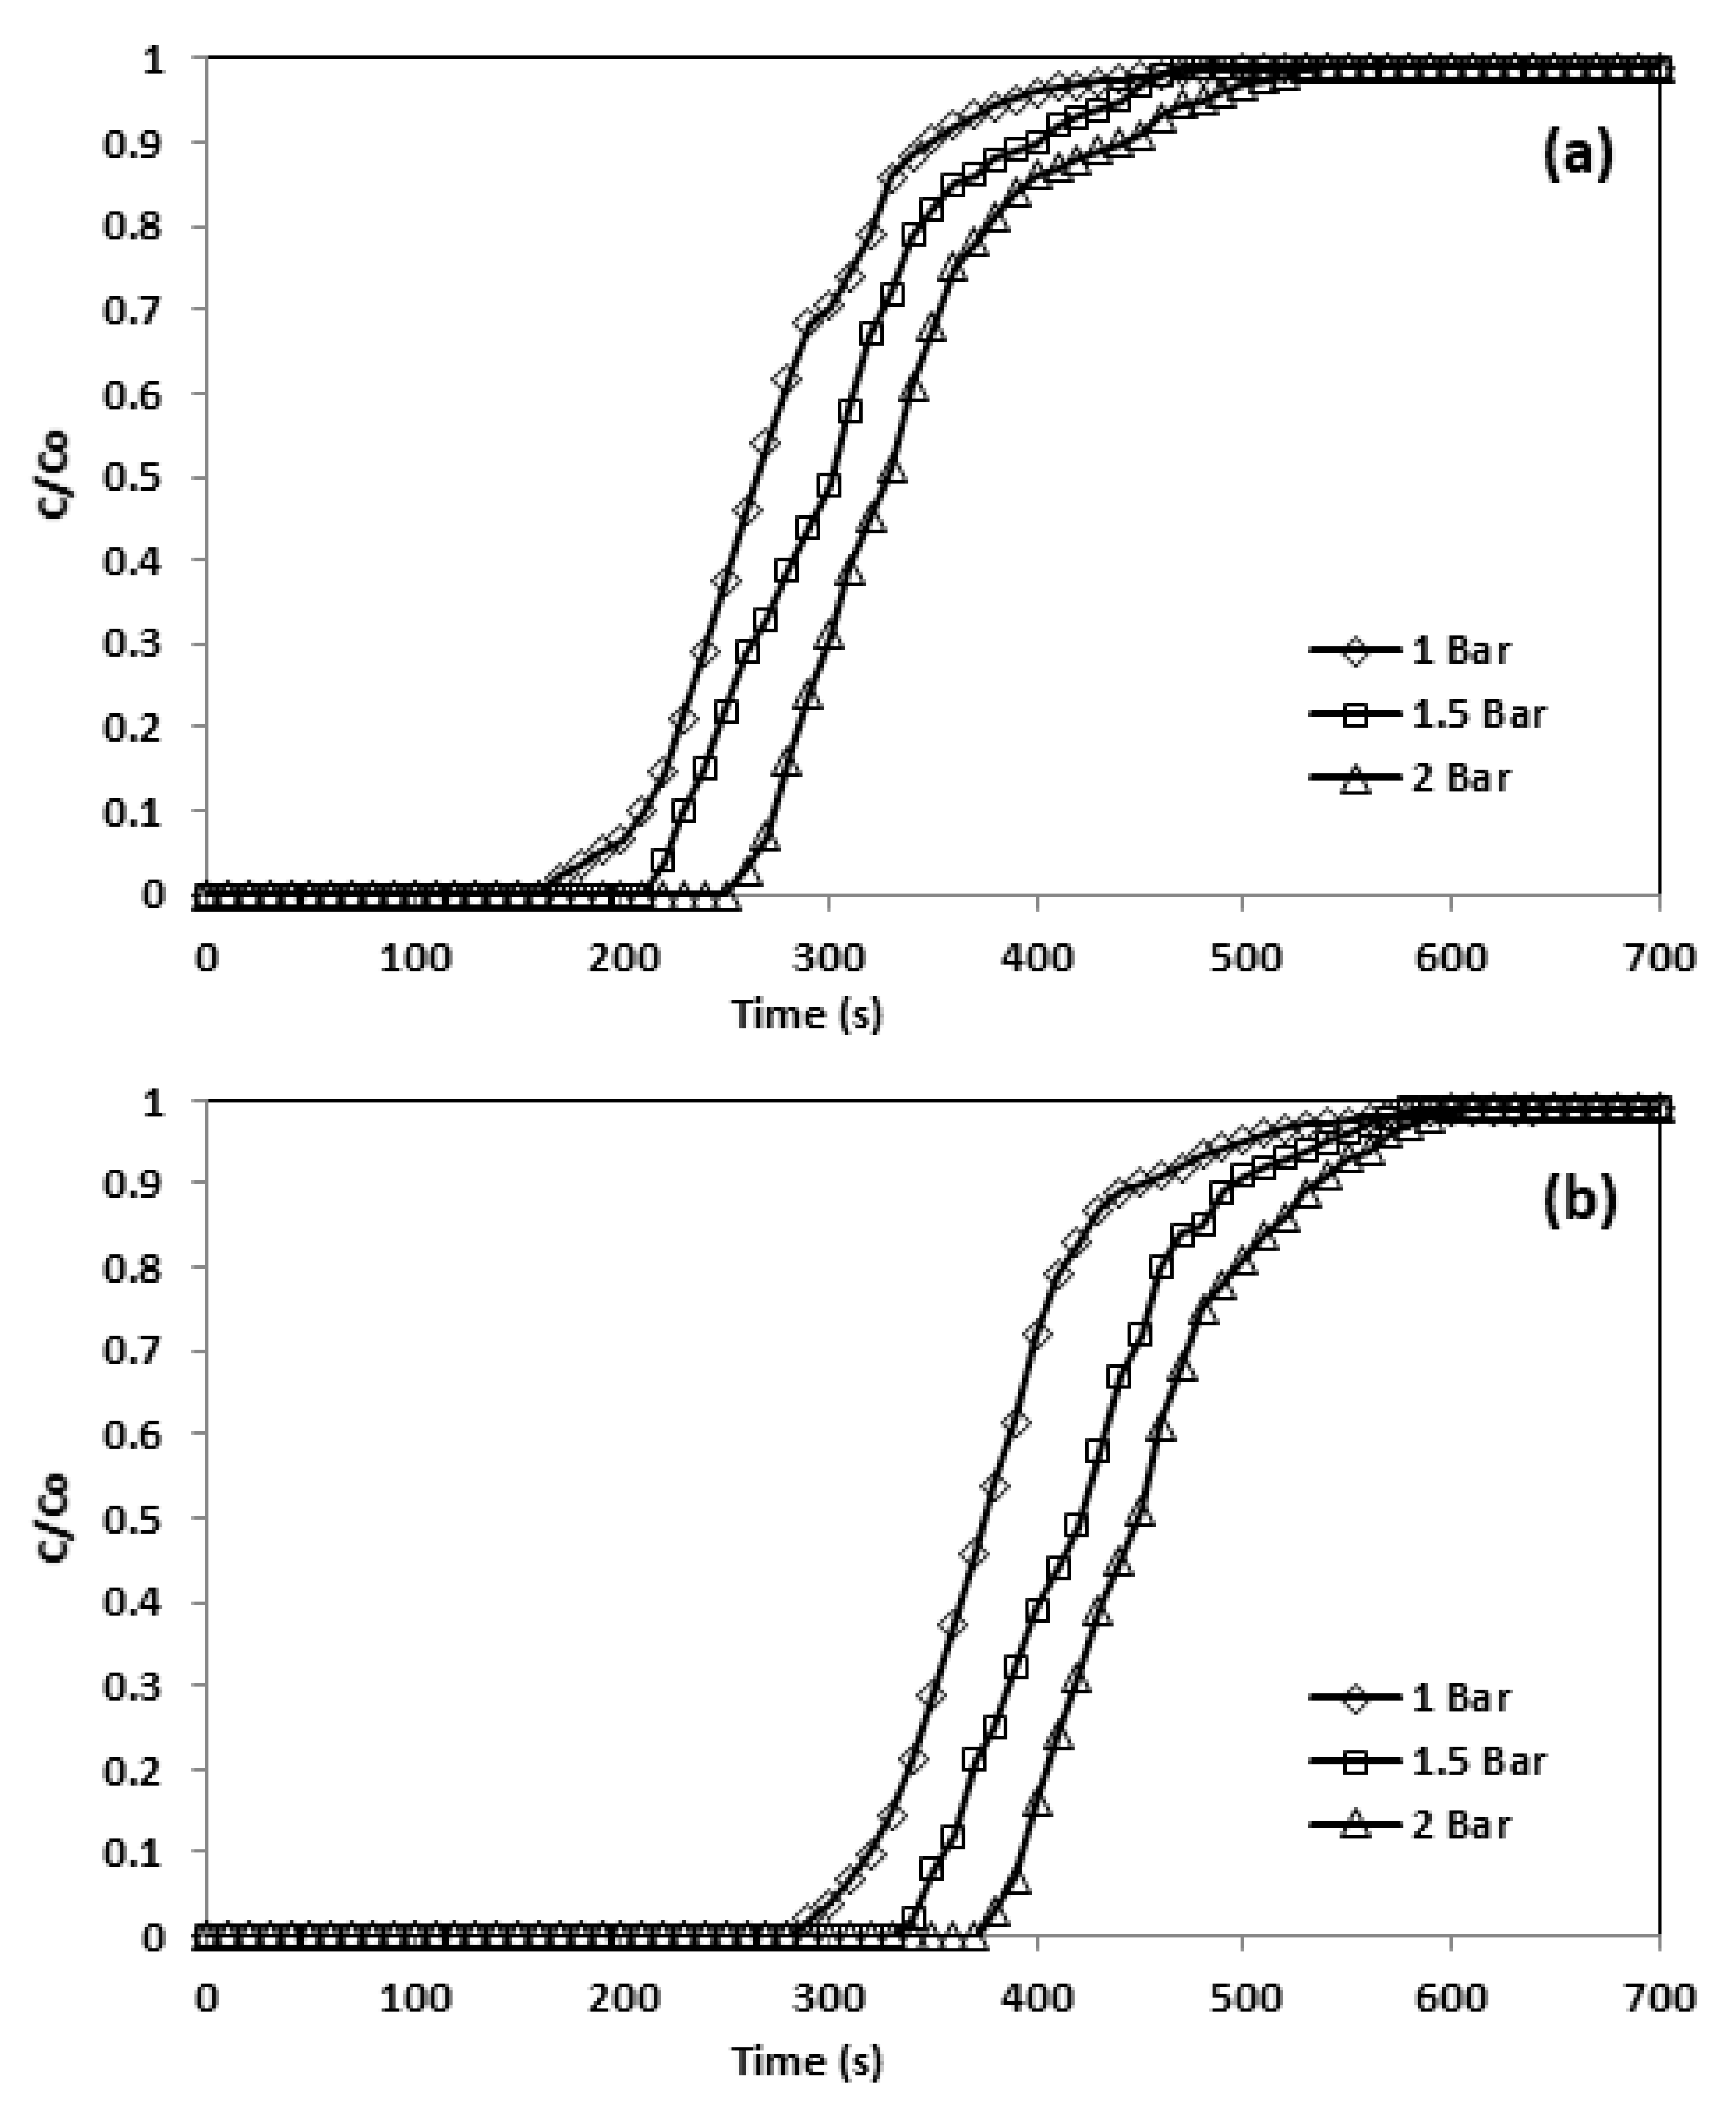
Figure 14.
Breakthrough curve and effect of pressure (a) CNFCM and (b) modified CNFCM in constant T = 30 °C, Flow = 50 mL/min, and 10% CO2.
Figure 14.
Breakthrough curve and effect of pressure (a) CNFCM and (b) modified CNFCM in constant T = 30 °C, Flow = 50 mL/min, and 10% CO2.
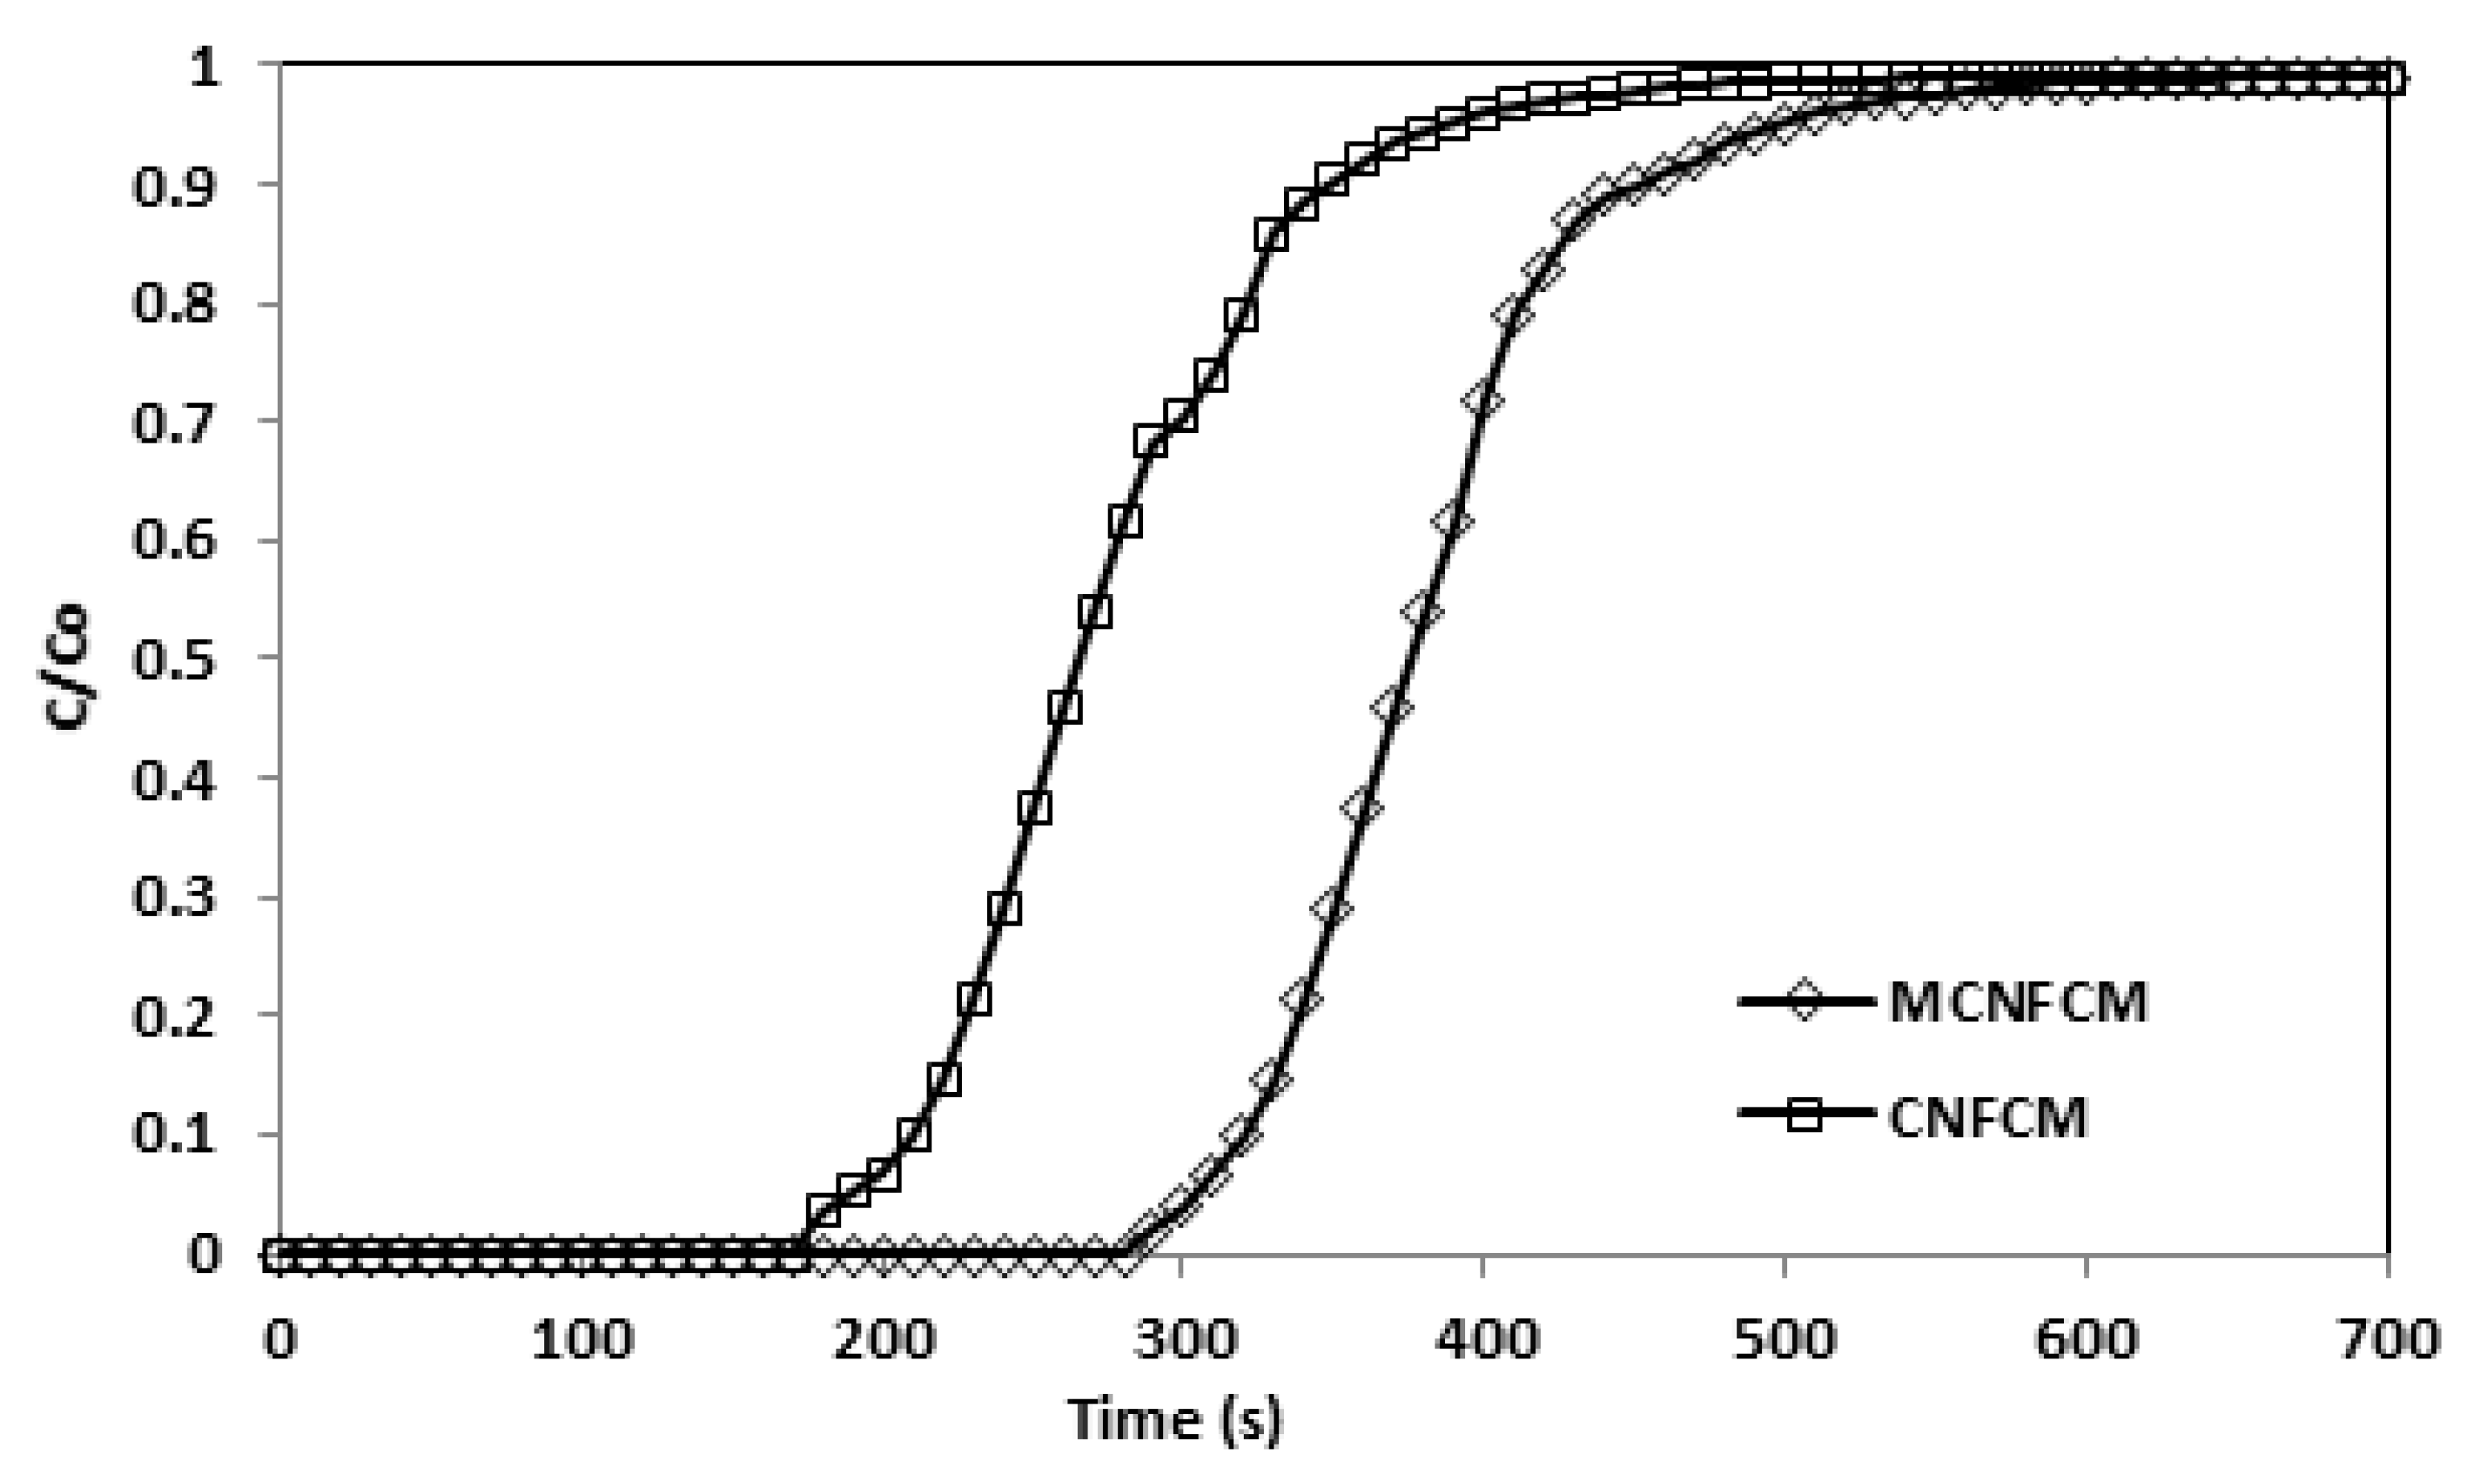
Figure 15.
Breakthrough curves adsorption of CNFCM and modified CNFCM in constant 40% CO2, T = 30 °C, P = 1 Bar.
Figure 15.
Breakthrough curves adsorption of CNFCM and modified CNFCM in constant 40% CO2, T = 30 °C, P = 1 Bar.
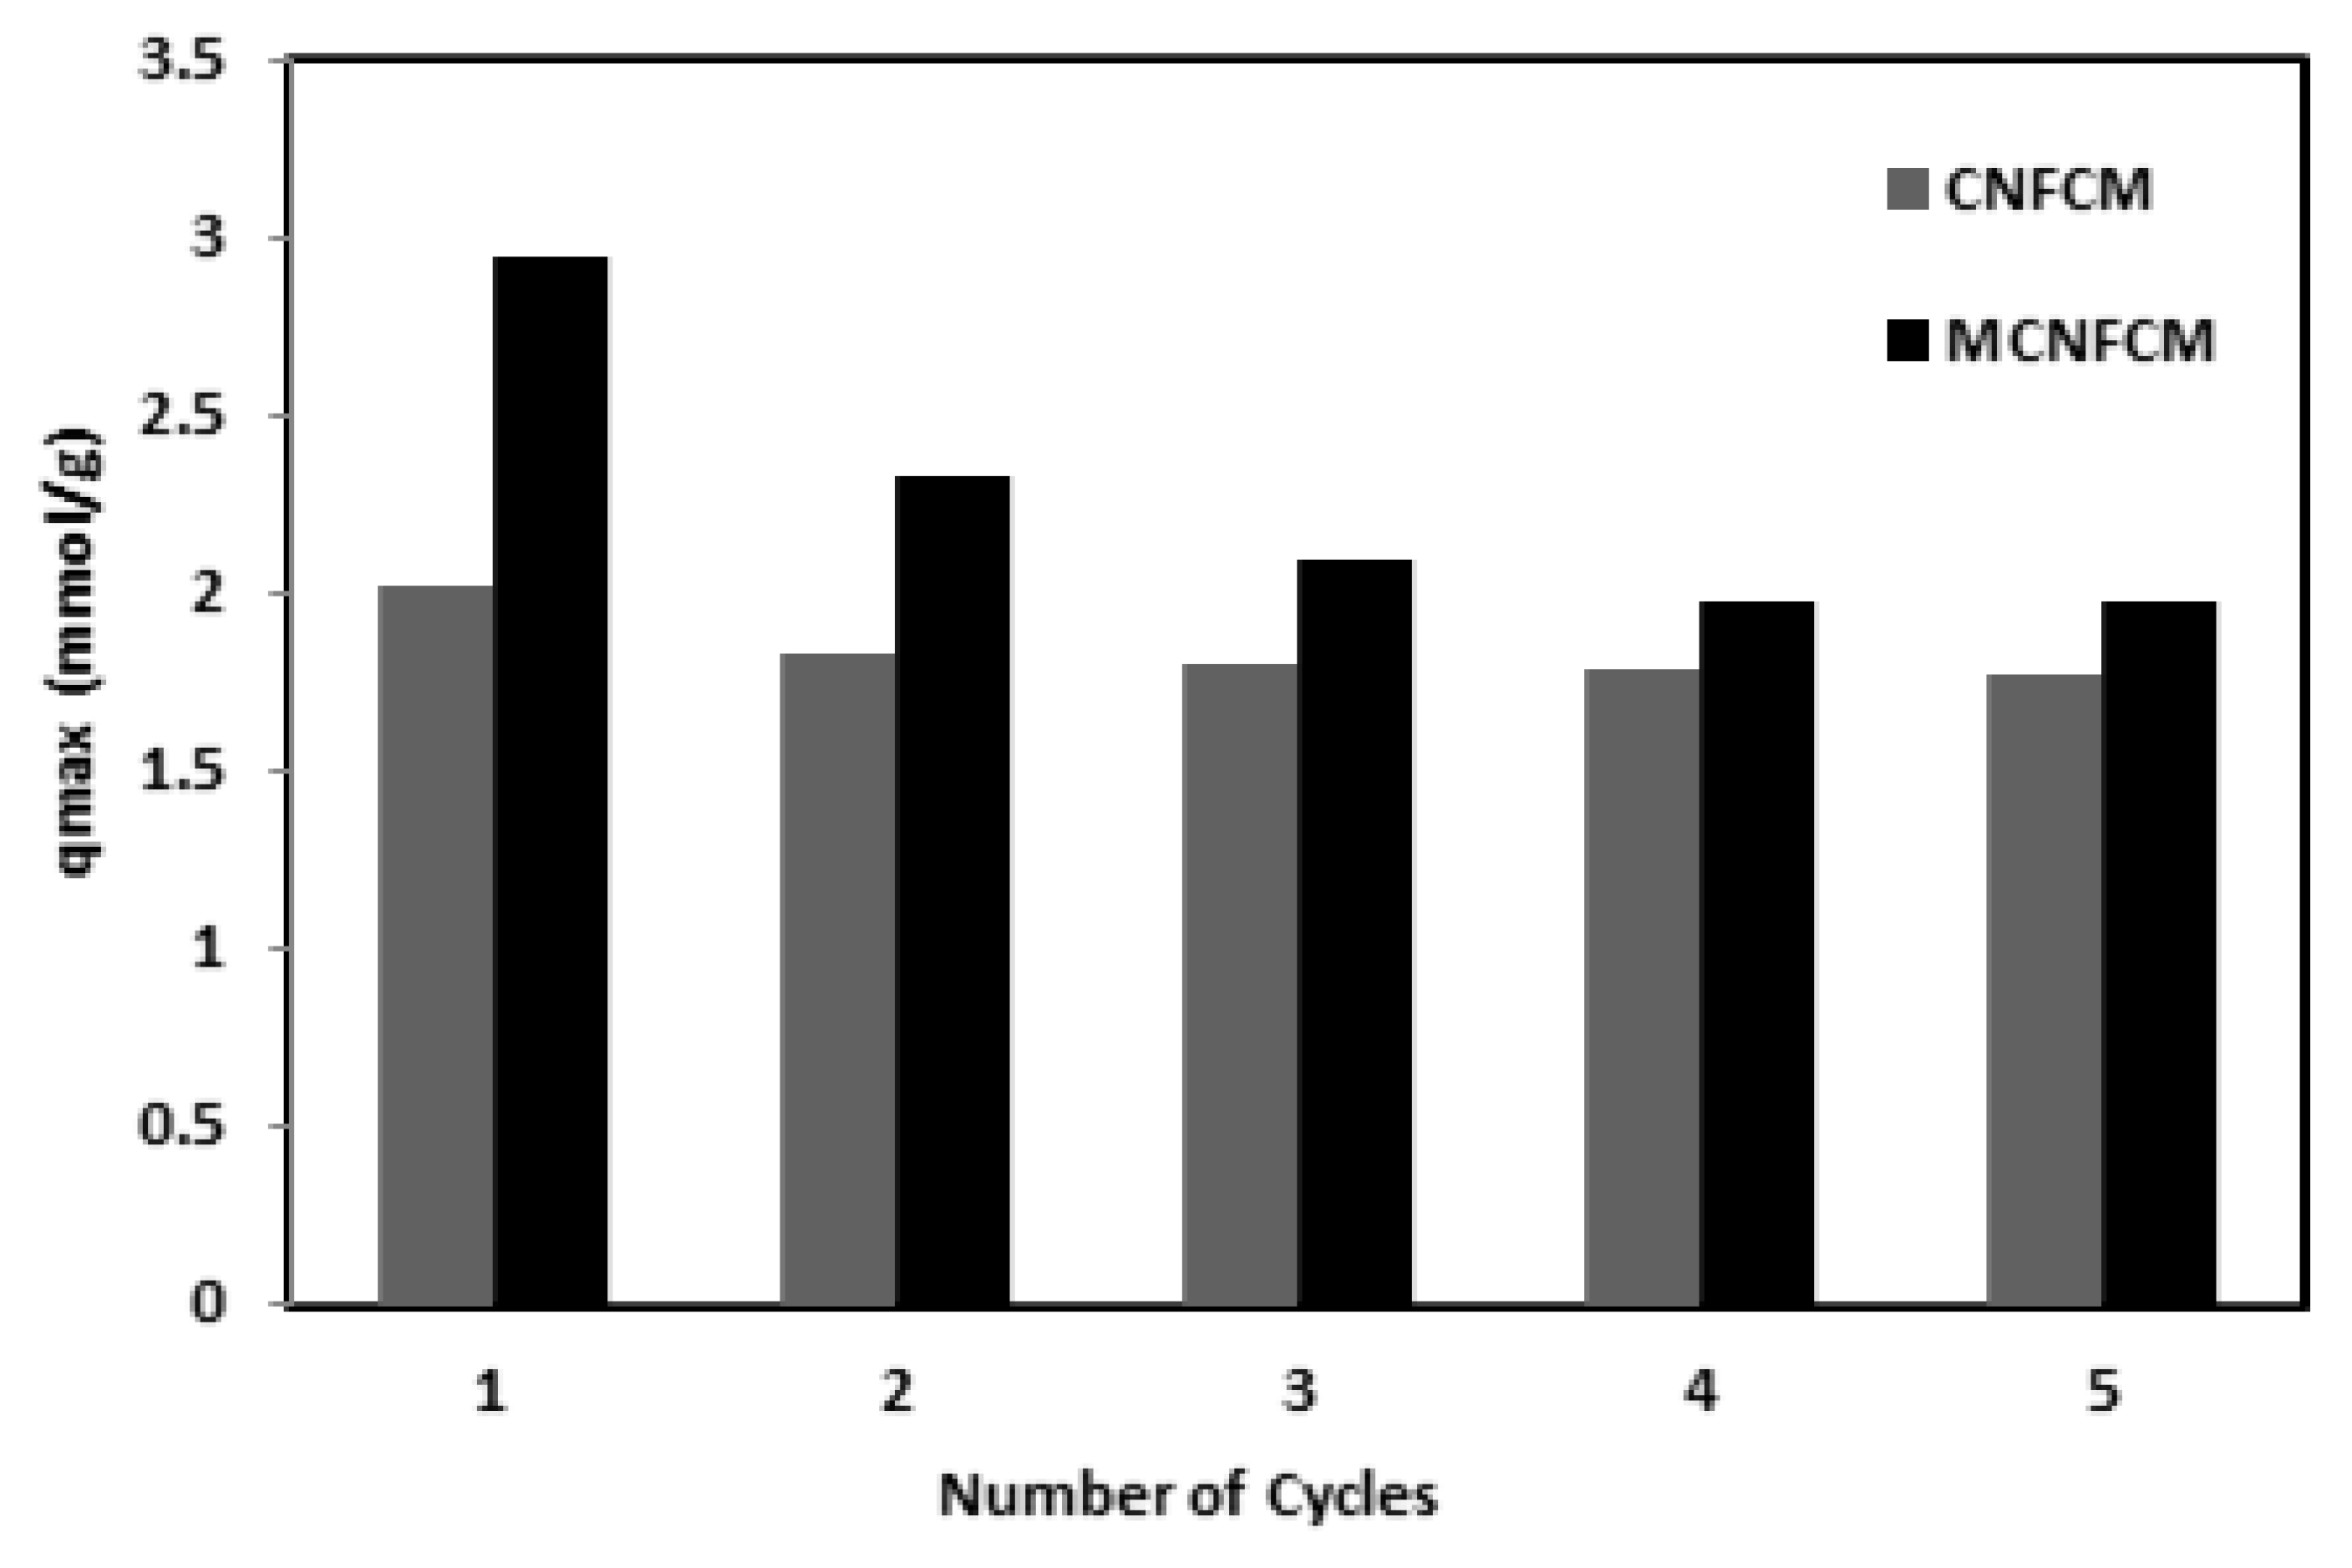
Figure 16.
Cyclic adsorption of CO2 of CNFCM and MCNCM (40% CO2, T = 30 °C, P = 1 Bar).
Figure 16.
Cyclic adsorption of CO2 of CNFCM and MCNCM (40% CO2, T = 30 °C, P = 1 Bar).
Table 1.
Response surface methodology (RSM) experimental factors and levels.
Table 1.
Response surface methodology (RSM) experimental factors and levels.
| Variables | Coded Level of Variables |
|---|
| −1 | 0 | 1 |
|---|
| A: Temperature [°C] | 700 | 800 | 900 |
| B: Catalyst [g] | 1 | 2 | 3 |
| C: Hydrocarbon flow rate [mL/min] | 0.0750 | 0.0875 | 0.100 |
| D: Cat promoter [g/mL] | 0.050 | 0.125 | 0.200 |
Table 2.
Experimental matrix of four-level factorial plan in the RSM system.
Table 2.
Experimental matrix of four-level factorial plan in the RSM system.
| Run | Factors | Response |
|---|
| A | B | C | D | CNF Yield (%) |
|---|
| Temperature [°C] | Catalyst [g] | Hydrocarbon Flow [mL/min] | Catalyst Promoter [g/mL] | Actual | Predicted |
|---|
| 1 | 900 | 2 | 0.0750 | 0.125 | 16.4596 | 16.9256 |
| 2 | 800 | 2 | 0.0875 | 0.125 | 15.2727 | 15.2232 |
| 3 | 800 | 2 | 0.0875 | 0.125 | 14.5475 | 15.2238 |
| 4 | 800 | 2 | 0.0750 | 0.050 | 14.8155 | 15.2464 |
| 5 | 700 | 2 | 0.0750 | 0.125 | 12.1616 | 11.6175 |
| 6 | 800 | 3 | 0.0875 | 0.050 | 16.5361 | 15.9834 |
| 7 | 800 | 2 | 0.1000 | 0.050 | 15.1856 | 15.1619 |
| 8 | 700 | 3 | 0.0875 | 0.125 | 12.3192 | 12.9016 |
| 9 | 800 | 1 | 0.0875 | 0.200 | 14.8515 | 14.6116 |
| 10 | 800 | 3 | 0.1000 | 0.125 | 16.443 | 16.9681 |
| 11 | 700 | 2 | 0.0875 | 0.050 | 12.4124 | 12.6834 |
| 12 | 800 | 1 | 0.0875 | 0.050 | 13.7732 | 13.7227 |
| 13 | 900 | 1 | 0.0875 | 0.125 | 14.7475 | 14.6504 |
| 14 | 700 | 1 | 0.0875 | 0.125 | 12.7677 | 12.8704 |
| 15 | 800 | 2 | 0.1000 | 0.200 | 15.8248 | 15.8858 |
| 16 | 900 | 2 | 0.1000 | 0.125 | 15.6111 | 15.3792 |
| 17 | 900 | 2 | 0.0875 | 0.200 | 15.321 | 15.3705 |
| 18 | 800 | 3 | 0.0875 | 0.200 | 15.4059 | 14.6603 |
| 19 | 800 | 1 | 0.1000 | 0.125 | 14.2424 | 14.7262 |
| 20 | 900 | 3 | 0.0875 | 0.125 | 16.545 | 16.9301 |
| 21 | 800 | 2 | 0.0875 | 0.125 | 14.899 | 15.2237 |
| 22 | 700 | 2 | 0.0875 | 0.200 | 12.1188 | 12.4808 |
| 23 | 800 | 2 | 0.075 | 0.200 | 13.5842 | 14.1089 |
| 24 | 800 | 2 | 0.0875 | 0.125 | 15.4747 | 15.2256 |
| 25 | 700 | 2 | 0.1000 | 0.125 | 15.6263 | 14.8709 |
| 26 | 800 | 3 | 0.0750 | 0.125 | 15.1919 | 15.0338 |
| 27 | 800 | 1 | 0.0750 | 0.125 | 15.115 | 14.9356 |
| 28 | 900 | 2 | 0.0875 | 0.050 | 15.651 | 15.6043 |
| 29 | 800 | 2 | 0.0875 | 0.125 | 15.8899 | 15.2234 |
Table 3.
Chronological model summation of squares.
Table 3.
Chronological model summation of squares.
| Source | Summation of Squares | DF | Mean Square | F Value | Prob > F | R2 |
|---|
| Linear | 31.91415553 | 4 | 7.978539 | 9.550314 | 0.0491 | 0.6026 |
| 2FI | 10.92041913 | 6 | 1.820070 | 3.588426 | 0.0365 | 0.7983 |
| Quadratic | 4.875996848 | 4 | 1.218999 | 4.012031 | 0.0152 | 0.9117 |
| Cubic | 1.429150224 | 8 | 0.178644 | 0.37948 | 0.8817 | 0.9427 |
Table 4.
The analyses of variance (ANOVA) for carbon yield response surface quadratic model.
Table 4.
The analyses of variance (ANOVA) for carbon yield response surface quadratic model.
| Source | Sum of Squares | DF | Mean Square | F Value | Prob > F |
|---|
| A | 25.31 | 1 | 25.31 | 76.46 | < 0.0001 |
| B | 4.02 | 1 | 4.02 | 12.14 | 0.0037 |
| C | 2.17 | 1 | 2.17 | 6.56 | 0.0226 |
| D | 0.13 | 1 | 0.13 | 0.4 | 0.5351 |
| AB | 1.26 | 1 | 1.26 | 3.81 | 0.0713 |
| AC | 5.79 | 1 | 5.79 | 17.49 | 0.0009 |
| AD | 0.032 | 1 | 0.032 | 0.01 | 0.9752 |
| BC | 1.13 | 1 | 1.13 | 3.41 | 0.0862 |
| BD | 1.22 | 1 | 1.22 | 3.68 | 0.0756 |
| CD | 0.87 | 1 | 0.87 | 2.64 | 0.1264 |
| A2 | 4.1 | 1 | 4.1 | 12.39 | 0.0034 |
| B2 | 0.045 | 1 | 0.045 | 0.14 | 0.7182 |
| C2 | 0.47 | 1 | 0.47 | 1.42 | 0.2525 |
| D2 | 0.99 | 1 | 0.99 | 2.99 | 0.1059 |
| Residual | 4.64 | 14 | 0.33 | — | — |
Table 5.
Predicted results by RSM.
Table 5.
Predicted results by RSM.
| Source | Temperature (°C) | Catalyst (g) | Hydrocarbon Flow Rate (mL/min) | Catalyst Promoter (g/mL) | CNF Yield Predicted (%) | CNF Actual Yield (%) | RSE (%) |
|---|
| Condition 1 | 800 | 2.21 | 0.085 | 0.095 | 16.975 | 16.505 | 2.77 |
| Condition 2 | 838 | 2.97 | 0.098 | 1.154 | 16.969 | 16.401 | 3.35 |
| Condition 3 | 889 | 2.30 | 0.077 | 0.092 | 16.965 | 16.411 | 3.27 |
Table 6.
EDX analysis of CNF-coated monolith and the modified CNF-coated monolith.
Table 6.
EDX analysis of CNF-coated monolith and the modified CNF-coated monolith.
| Elements | Weight (%) |
|---|
| CNFCM | MCNFCM |
|---|
| C | 53.24 | 54.46 |
| O | 37.33 | 35.29 |
| Mg | 2.15 | 1.84 |
| Al | 2.56 | 2.99 |
| Si | 3.01 | 3.11 |
| N | 1.71 | 2.31 |
Table 7.
N2 Ads–des analysis of CNFCM and modified CNFCM.
Table 7.
N2 Ads–des analysis of CNFCM and modified CNFCM.
| Sample | SBET (m2/g) | Pore Volume (cm3/g) | Pore Size (nm) |
|---|
| Micropore Volume | Mesopore Volume |
|---|
| CNFCM | 95.38 | 0.023 | 0.164 | 1.95 |
| MCNFCM | 98.70 | 0.023 | 0.160 | 1.98 |
Table 8.
CO2 adsorption over different flow rates.
Table 8.
CO2 adsorption over different flow rates.
| CO2 Flow Rate (mL/min) | qmax (mmol/g) |
|---|
| CNFCM | MCNFCM |
|---|
| 50 | 0.58 | 0.65 |
| 60 | 0.67 | 0.71 |
| 70 | 0.73 | 0.84 |
| 80 | 0.82 | 0.93 |
| 90 | 0.89 | 1.01 |
Table 9.
CO2 adsorption over different initial concentrations.
Table 9.
CO2 adsorption over different initial concentrations.
| CO2 Concentrations (%) | qmax (mmol/g) |
|---|
| CNFCM | MCNFCM |
|---|
| 10 | 0.89 | 1.01 |
| 20 | 1.33 | 1.53 |
| 30 | 1.94 | 2.12 |
| 40 | 2.22 | 2.94 |
Table 10.
CO2 adsorption over different temperatures.
Table 10.
CO2 adsorption over different temperatures.
| Temperature °C | qmax (mmol/g) |
|---|
| CNFCM | MCNFCM |
|---|
| 30 | 2.22 | 2.94 |
| 40 | 1.96 | 2.65 |
| 50 | 1.38 | 2.53 |
Table 11.
CO2 adsorption over different pressures.
Table 11.
CO2 adsorption over different pressures.
| Pressure (bar) | qmax (mmol/g) |
|---|
| CNFCM | MCNFCM |
|---|
| 1.0 | 2.02 | 2.94 |
| 1.5 | 2.69 | 3.05 |
| 2.0 | 2.95 | 3.11 |
Table 12.
CO2 adsorption of CNFCM and modified CNFCM.
Table 12.
CO2 adsorption of CNFCM and modified CNFCM.
| Adsorbent | qmax (mmol/g) |
|---|
| CNCFM | 2.02 |
| MCNFCM | 2.94 |
Table 13.
Deactivation model parameters in 10% CO2 inlet.
Table 13.
Deactivation model parameters in 10% CO2 inlet.
| Adsorbent | F (mL/min) | T (°C) | P (bar) | kd (s) | ksα (-) | R2 |
|---|
| CNFCM | 50 | 30 | 1 | 0.0392 | 10.729 | 0.981 |
| MCNFCM | 50 | 30 | 1 | 0.0398 | 10.812 | 0.991 |

 ,
, 


