3.1. Microstructure and Structural Investigations of the Deposited Coatings
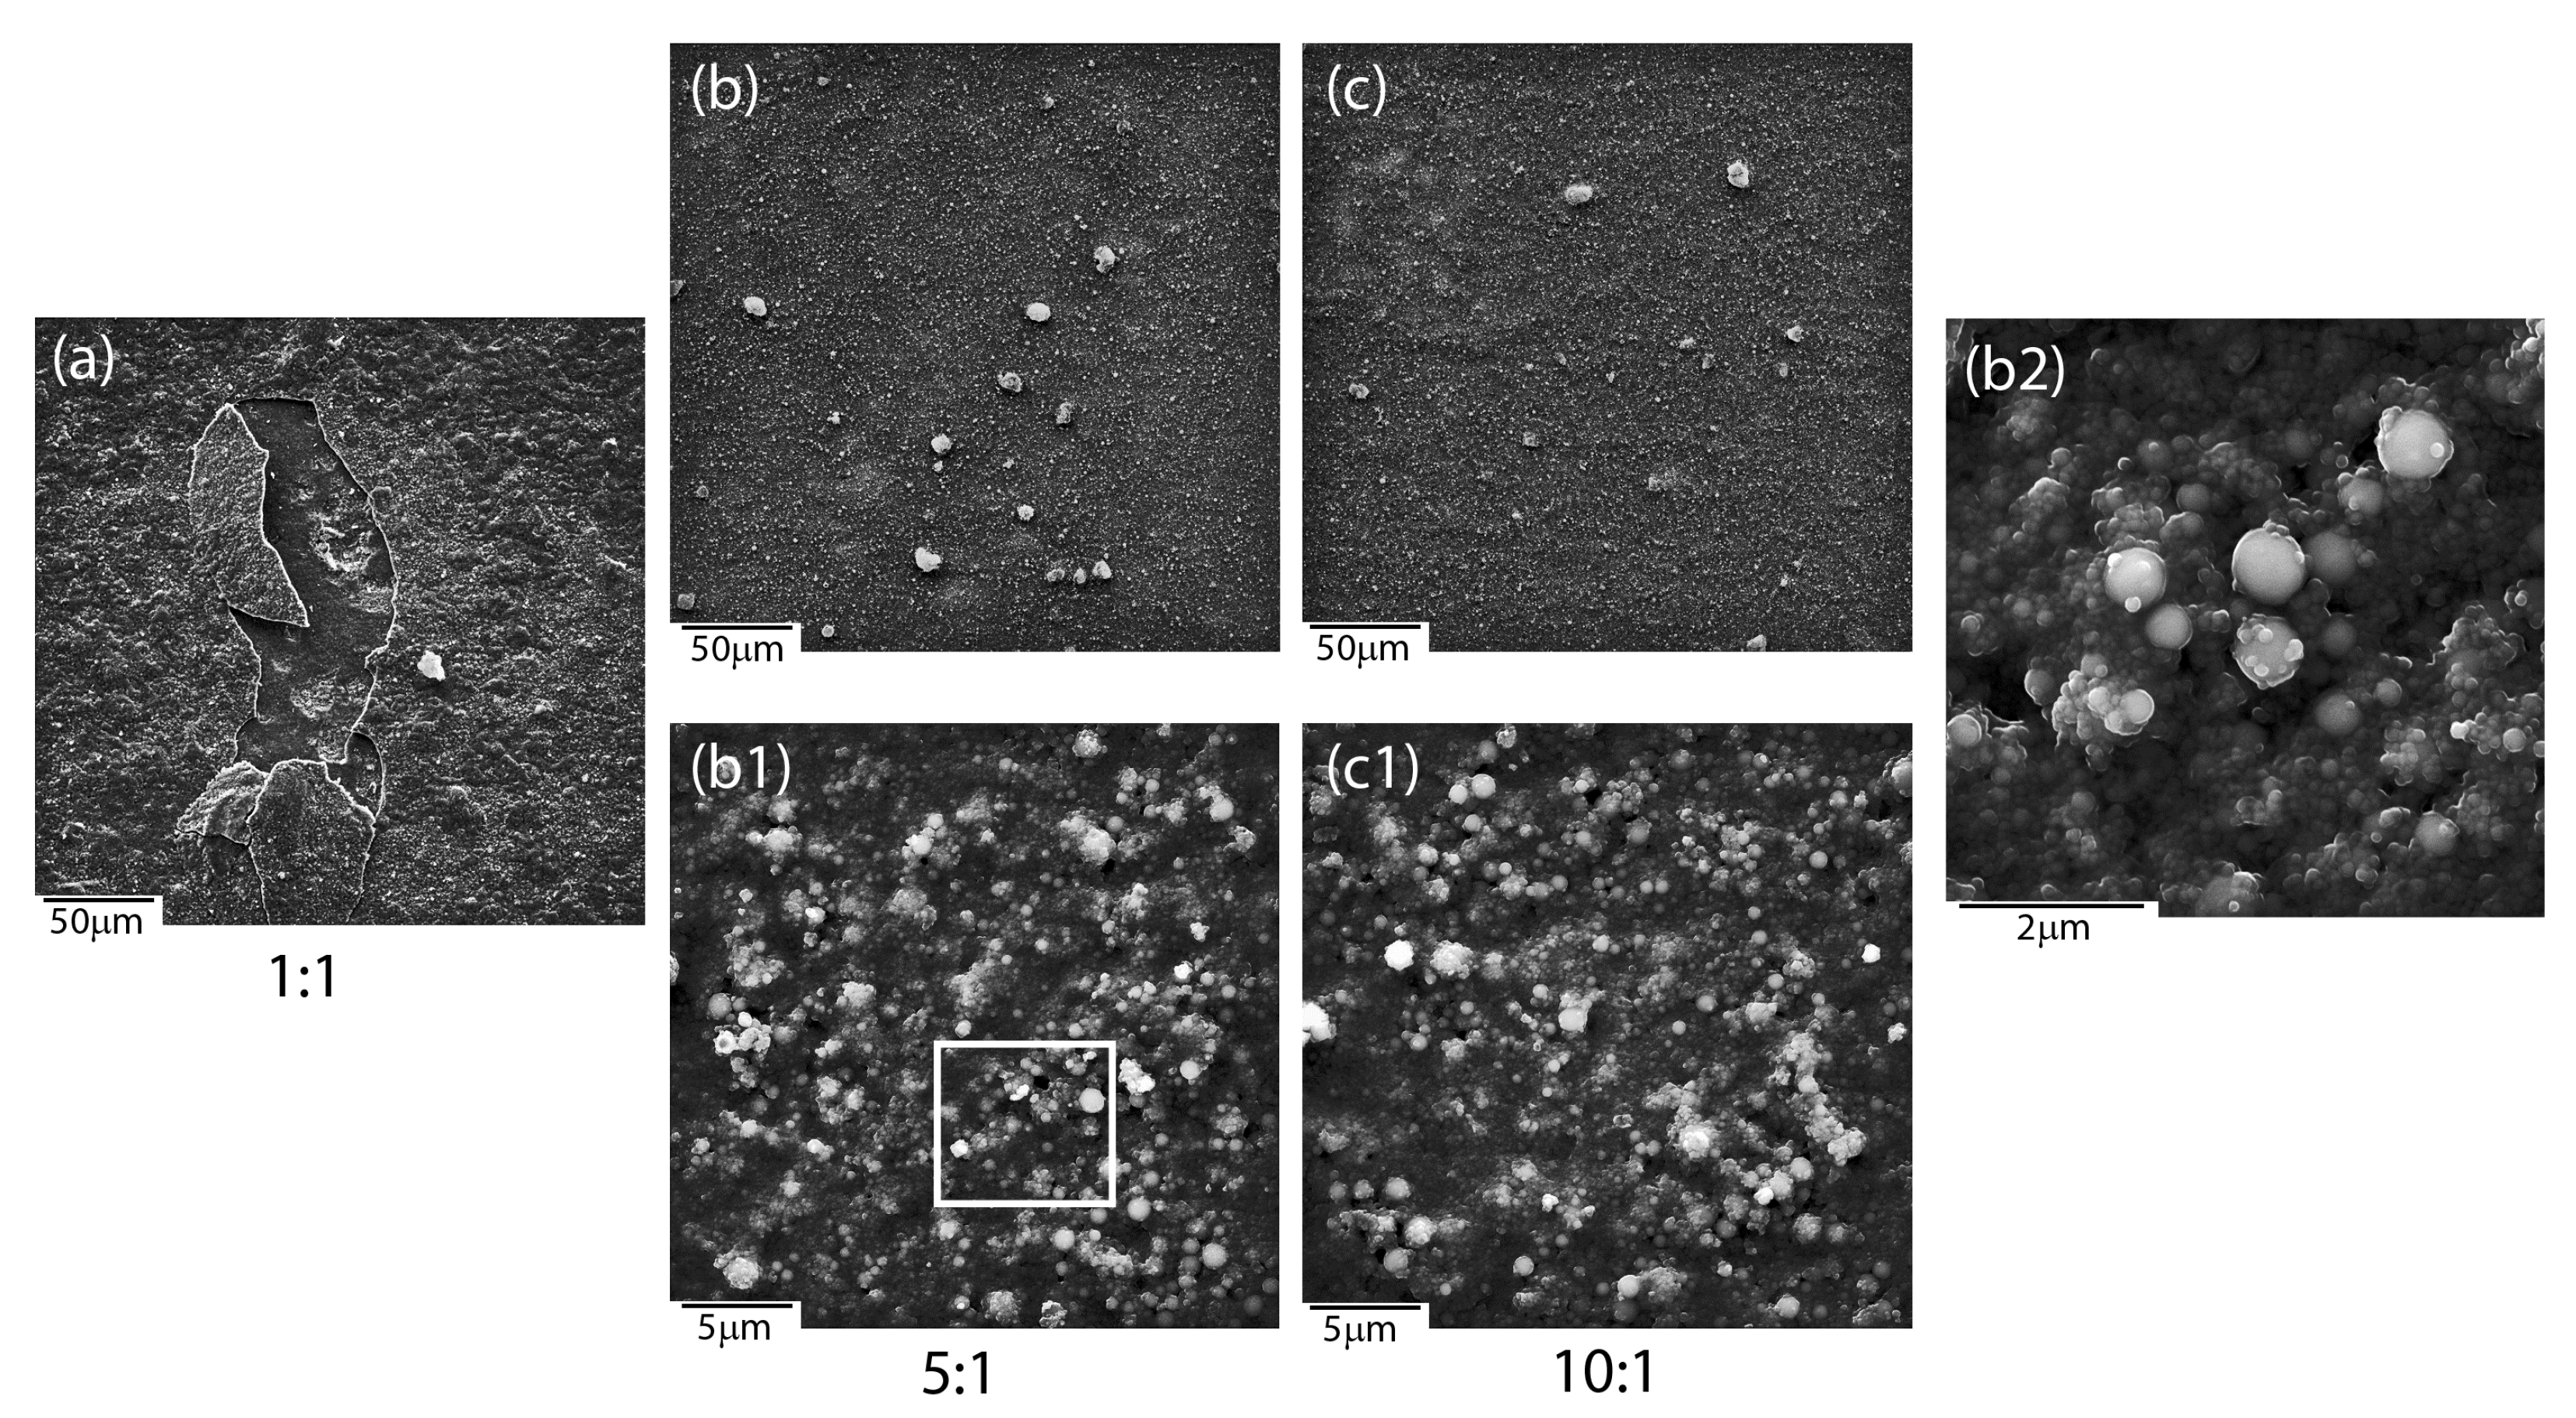
Microscopic observations revealed an influence of the applied deposition parameters on the layers’ quality and enabled selecting optimal conditions for the production of layers with the most suitable material homogeneity. Coat-forming materials were subjected to agglomeration in larger or smaller objects, regardless of the mutual ratio between ceramic materials accessible in a colloidal suspension, according to SEM investigations. Moreover, the morphology of newly formed layers was strongly affected by the deposition conditions and mutual weight ratio between HAp and nSiO
2/Ag (
Figure 1). As a result, hybrid coatings that formed at low voltage (5–30 V) and/or short times (30–90 s) turned to be heterogeneous in terms of the distribution of the ceramic material on the NiTi substrate (
Figure 1a–c). A decrease of hydroxyapatite weights in a colloidal suspension ensured the formation of ever-larger objects with irregular shapes. However, coatings that were prepared at those conditions at higher magnifications were crack-free and continuous in the vicinity of the coat-forming material. Another situation was observed in the case of coatings prepared at higher voltage values (60 V) and a longer deposition time (120 s). Here, the coat-forming material formed continuous layers with heterogeneously distributed agglomerates of irregular shape and variable size. Nevertheless, these layers were affected by cracks that were observed in the vicinity of the aggregates, which might influence coatings’ delaminating as well as provide a way of ion migration from the substrate (
Figure 1g–i). Thus, continuous and crack-free coatings were formed at intermediate voltage values (40–50 V). However, an increase of hydroxyapatite concentration in relation to the concentration of silica-silver nanocomposite influenced the formation of coatings, which become more continuous and homogenous in terms of material distribution. Finally, the use of 50 V and 240 s for 1:1, 50 V and 120 s for 5:1, and 40 V and 90 s for 10:1 resulted in the formation of a relatively homogeneous coatings on the entire surface of the passivated alloy (
Figure 1d–f) having a thickness of approximately 4–5 μm (
Figure 1j–l). These data clearly shows that the increase of hydroxyapatite content in the colloidal suspension was correlated with a shorter time being needed to perform coatings of similar thickness. The estimation of the thickness and most optimal degree of functionalities is extremely crucial for the functionalization of shape memory alloys.
Apart from microstructural observations, SEM + EDS imaging and chemical distribution analysis of individual elements were performed.
Figure 2 presents the exemplary chemical images of coatings composed of HAp and nSiO
2/Ag in 5:1 weight ratio and at 50 V/240 s. Interestingly, the nature of aggregates that were observed during SEM microstructure analysis resulted from a higher concentration of silicon and oxygen. Silver, calcium, and phosphorous were homogeneously distributed in the coating. The signal of titanium most probably came from the passivated layer formed before deposition on the NiTi substrate.
Phase identification that was carried out on the basis of a representative XRD pattern (
Figure 3a) revealed the presence of crystalline hydroxyapatite Ca
5(PO
4)
3OH with a hexagonal crystal system (P6
3/m). The diffraction lines belonging to phase B2 of the NiTi alloy with cubic symmetry (Fd-3m) were also identified. No diffraction lines that belonged to other phases were observed. However, a distinct increase in the background in the range of 14–27 2θ observed for coatings prepared in 1:1 weight ratio and a slight increase in the case of the 5:1 ratio coatings resulted from the existence of the amorphous phase, thus confirming the presence of the silver-silica nanocomposite. The amount of the nSiO
2/Ag nanocomposite was below the detection limit of the X-ray method for 10:1 coating. Crystalline silver peaks were not observed and the applied deposition parameters did not change the starting materials’ structure.
Unfortunately, there was no possibility to explicitly confirm nSiO
2/Ag while using XRD. Therefore, another technique has to be applied to examine this component more precisely. One of the techniques providing more information on the structure of nanocomposites is Raman spectroscopy (
Figure 3b). The Raman spectra were collected from ten points of different parts of the sample, so as to check the local differentiation of the crystal structure of individual components including the coat-forming material. A great similarity between the Raman spectra allows for their averaging and conducting a global analysis for the entire material. A similar analysis was performed for homogenous coatings that were prepared with a different content ratio of calcium phosphates and silica-silver composites (1:1, 5:1, 10:1). In this approach, the strongest bands that are located between 1000–950 cm
−1 may be attributed to symmetric stretching vibrations within ν
1(PO
4)
3− [
51,
52,
53,
54,
55,
56]. Two different tetrahedral surroundings are found in the structure of hydroxyapatite implicate activation of two different modes, which are visible on the Raman spectrum in the form of two bands located at 966 and 955 cm
−1. Interestingly, a small shift towards lower frequencies in comparison to literature data found for the ideal HAp may result from the insignificant modification of the HAp crystal structure. Some explanations may refer to the presence of a mobile ionic form of Ag in the colloidal suspension, which, due to collisions with the calcium phosphate particles, may lead to the formation of a more disordered HAp system [
57]. This effect might intensify due to the local melting of the inorganic materials, especially in the contact zone between nanometer-sized particles. A similar effect was observed in the case of tricalcium phosphate that was deposited with the participation of silver ions or nanoparticles [
35]. The remaining bands located in the regions of 1190–1020 and 635–560 cm
−1 resulted from symmetry-breaking vibrations (ν
3, ν
2) within (PO
4)
3− tetrahedrons, as well as might be affected by the presence of silica modes. An interesting situation was observed in the case of low-frequency regions, ranging from 460–400 cm
−1 (1) and 350–150 cm
−1 (2). According to the literature, the region (1) is connected to the deformational modes of O-P-O within (PO
4)
3− tetrahedrons. However, the shape and intensity of the fitted line in this region might only be explained by the impact of silica with the stretching and deformation vibration of Si-O-Si and O-Si-O [
49]. As a result, the superposition of bands that are attributed to the modes of O-P-O from HAp, Si-O-Si, and O-Si-O of silica enables that reproduction of the real shape observed during the experiment, but makes it impossible to provide a more precise interpretation of the silica component’s nature. The band arrangement of the region (2), similarly to the previous one, is the superposition of the overlapping signal from the vibrations of the entire molecular fragments in Ca(PO
4) i.e., characteristic for O-Ca-O, O-P-O lattice modes of translational or liberational character, as well as modes that are linked to Ag-O [
49]. The low-intensity band that is located at 3573 cm
−1 is characteristic of vibrations related to hydroxyl groups (-OH
−) [
51,
52,
53,
54,
55,
56].
3.3. Microstructure, Structure and Topography of Coatings after Heat Treatment
The microstructure analysis of the initial coatings in relation to the sintered ones, regardless of the mutual weight ratios between ceramic materials (1:1, 5:1, 10:1), revealed the coalescence of ceramics particles, which was particularly well visible at high magnification (
Figure 5b2). Tiny material particles were more prone to coalescence than bigger ones. Melted surfaces were observed around bigger particles. A synergic interaction between coat-forming materials, especially silver nanoparticles, might induce the melting of two different materials, such as silica and HAp, which might form a new type of SiO
2-HAp composite. Unfortunately, it is impossible to provide a clear explanation merely on the basis of microstructure analysis. Another problem that was related to 1:1 ratio coatings after the heat treatment was the appearance of cracks. It turned out that these layers are prone to delamination and chipping, which practically prevents their potential use when developing a functionalized implant material (
Figure 5a). Therefore, the 1:1 ratio coating was not considered during further analysis. The other layers turned to be highly continuous and free of cracks in the entire coating (
Figure 5b,c).
Another problem that was linked to the heat treatment turned out to be the risk of metal evaporation from the coat-forming composite (e.g., silver). The problem of silver evaporation might lead to the deterioration of antimicrobial properties, which belong to the most important potential features of hybrid coatings. According to the literature data, silver (ionic or as nanoparticles) in the similar nSiO
2/Ag material only evaporates after exceeding the temperature of 1080 °C, whereas it should remain unchanged at lower temperatures [
60]. The SEM + EDS data indicate that silver content, both before and after sintering, was similar, reaching (1.5 ± 0.3 wt.%) and (0.7 ± 0.2 wt.%), for 5:1 and 10:1 ratio coatings, respectively. A relatively low silver content should have no, or merely a very low negative impact on the proliferation of fibroblasts according to the previous reports, allowing for the material to preserve its antimicrobial properties [
35]. The elemental distribution analysis that was performed for a sintered NiTi alloy functionalized with a coating composed of HAp and nSiO
2/Ag revealed homogenous silver distribution in the coat-forming material (
Figure 6). The data refers to exemplary 5:1 ratio coating, while similar chemical images were obtained for the 10:1 layer. Interestingly, silver had no tendency to agglomerate and remained uniformly dispersed in the composite hydroxyapatite-silica layer. Other elements, such as calcium, phosphorus, as well as silicon and oxygen, were also homogeneously distributed throughout the coating. These data indicate that HAp and silica were homogenously distributed in the layer and in relation to each other. Titanium from the intermediate titanium oxide layer was also homogeneously distributed in the coating.
An important issue related to the creation of a new type of coatings is the analysis of surface parameters, such as roughness. These parameters determine surface development, mainly in the context of osseointegration studies. The higher the roughness value is, the better is the ability of the cell to proliferate and the shorter healing process, according to the literature [
61]. It is therefore worth looking at the quality and roughness of the coatings prepared as a combination of HAp and a silica-silver nanocomposite. It is known that these features are strictly associated with the deposition parameters and they may be subjected to modification after sintering. In view of the above and the applied method of making coatings that functionalize the NiTi alloy, only the topography of the sintered material was considered. Moreover, SEM investigations revealed the poor quality of 1:1 coatings; therefore, the 3D surface topography visualizations were performed for the 5:1 (
Figure 7a) and 10:1 coatings (
Figure 7b). Interestingly, the coatings’ roughness decreases with a lower nanocomposite content in the colloidal suspension. The average roughness (
Sa) that was estimated for 5:1 and 10:1 reached 0.20(3) μm and 0.14(2) μm, respectively. For biomedical applications, a better solution seems to be the hybrid coating that was obtained in the process of electrophoretic deposition with a slightly higher weight content of silica-silver nanocomposite in relation to hydroxyapatite.
Structural investigation that was based on X-ray measurements revealed the presence of main diffraction lines belonging to crystalline hydroxyapatite (
Figure 8a). Similar diffraction patterns were observed for all coatings with different weight ratios between ceramics, which indicated that the applied heat treatment conditions did not result in the decomposition of the calcium phosphate material. However, the applied heat treatment temperature influenced the crystallization of rutile with a tetragonal lattice (P4
2/mnm) and caused partial decomposition of the NiTi alloy to the equilibrium Ti
2Ni phase with a cubic lattice (Fd-3m). Similar observations were previously quoted in the subject literature [
10,
11]. We can also speculate that an increase in sintering temperature might result in the crystallization of silica in the amount visible in XRD investigations, according to ref. [
60]. Similarly to X-ray patterns after electrophoretic deposition (
Figure 3a), there was no clearly visible evidence regarding the presence of silica and its impact on the coat-forming material. The same problem concerns the determination of silver. However, the lack of diffraction lines from silver might be correlated with its very low content and/or nanometer size, according to SEM + EDS studies.
The Raman spectroscopy approach has provided more information on the structure of the coating that was subjected to heat treatment. Similarly to the initial coatings, ten Raman spectra were collected from different parts of the coating. Their high similarity allowed for their averaging and analyzing as a representative of the whole material. The same spectra were obtained for both coatings that were prepared in 5:1 and 10:1 mutual ratio between HAp and nSiO
2/Ag (
Figure 8b). The point Raman analysis revealed some interesting structural changes after heat treatment, which were completely unexpected, difficult to explain, and invisible in X-ray data. One low-intensity band that centered at around 967 cm
−1 is associated with the symmetric stretching of ν
1 vibration of P-O within the (PO
4)
3− tetrahedra and it is a typical marker band that characterizes hydroxyapatite. The position of this line is very close to the band position of hydroxyapatite in the sample that has not been subjected to heat treatment. Unfortunately, the interpretation of other marker bands of HAp is difficult due to the presence of other strong-intensity bands. As a result, it is not possible to find the ν
4, ν
2, ν
3 modes, which probably overlap other bands. The low intensity of the main HAp band might correspond to the lack of a clearly visible signal of hydroxyl groups, which, in typical calcium phosphates, is represented by a low-intensity band (
Figure 3b) [
57]. A different situation is observed in the case of silica and silver. The strong-intensity band that is centered around 240 cm
−1 is attributed to the Ag-O modes, whereas a significant increase in band intensity in the sintered sample related to the fact that the material was not subjected to heat treatment indicates silver oxidation. At the same time, a relatively low-intensity Ag-O band in the initial material might point to the presence of ionic, metallic, and/or oxidized silver. One of the possible explanations of the silver oxidation might be its binding to silica or calcium phosphate particles. The area around the HAp particles observed in SEM images (
Figure 5b2) might be due to the surface merging of silver with calcium phosphate as a result of HAp surface melting, according to this assumption. Alternatively, a similar hypothesis might be considered with silica carrier, especially that typical silica bands found between 460–400 cm
−1 increase their intensity after coating sintering (
Figure 8b). The other bands that are characterized by very strong intensity are extremely difficult to interpret and there are no literature data highlighting this problem. However, two bands that are centered at around 600 and 450 cm
−1 may be associated with the stretching vibrations of Ti-O, which are typically characteristic of the rutile structure and they correspond to XRD data. Other strong-intensity bands of a relatively high full width at half maximum values may suggest the formation of strongly disordered or even amorphous composite materials. However, to provide a more precise explanation of the nature of such a phase from the structural point of view, it is necessary to correlate the Raman data with SEM + EDS findings (
Figure 6). The main elements (Ca, P, Si, O, Ti) are homogeneously distributed in the coating, indicating that the band arrangement visible on the Raman spectrum might correspond to the formation of titanium-silica-calcium phosphate or titanium-silica disordered structure, according to the chemical composition analysis. However, the first system seems to be relatively less likely due to the thermal stability of calcium phosphate. Consequently, a possible interpretation of the band arrangement ought to be sought in the formation of the TiO
2-SiO
2 system as a result of the synergistic interaction between silver (ionic, metallic, or oxidized form), temperature, and the amorphous nature of titanium and silica. The temperature and the phase diagram of crystalline TiO
2 and SiO
2 indicate that the eutectic point of stable TiO
2-SiO
2 phase formation appeared at temperatures of ca 1400 °C, or even higher, but at a low molar content of silica in the system [
62]. Of course, this temperature is too high in relation to that applied for the HAp/nSiO
2/Ag coating that was deposited on the NiTi alloy, but it could be a starting point for further discussion on the mechanism of the coating formation after sintering. Amorphous materials, such as silica (coat-forming material) and titanium oxide (passivated NiTi layer), due to the disordered structure, may be much more thermally unstable than their crystalline counterparts, according to some hypotheses. Moreover, silver in the system might play the role of a catalyst lowering the temperature of the system formation. There is a likelihood that the applied heat treatment conditions forced the formation of the disordered phase system at a much lower temperature than crystalline systems that formed at considerably higher temperatures. However, this is only a hypothesis, which ought to be proven using another technique.
3.5. In Vitro Corrosion Resistance Tests
One of the challenges faced in the production of medical implants is the use of short-term in vitro tests for assessing the long-term in vivo corrosion behavior of implants. The methodology of the in vitro electrochemical testing of the investigated NiTi shape memory alloy with HAp/nSiO2/Ag hybrid coatings involves measurements of electrical quantities during free corrosion (for open circuit), in potentiodynamic and impedance tests, which allow for faster assessment of material resistance to any corrosive phenomena, mainly pitting corrosion in the living organism environment.
In the measurements that were conducted by the open circuit potential method, the difference was measured and the rate of stabilization of the potential value between the tested electrode and the reference electrode was recorded without applying an external current source to the system. The stabilized
EOC value was considered to be an approximate value of the corrosion potential. The
EOC method made it easy to assess the protective properties of the passive layers that formed on the surface of the NiTi alloy and the corrosion resistance of the hybrid coatings applied.
Figure 10 shows the results that were obtained in the form of
EOC dependence as a function of time for NiTi electrodes before and after surface modification in Ringer’s solution.
The EOC of the electrodes that were immersed in the electrolyte changed significantly over time. The ionic-electron equilibrium on the electrode|electrolyte interface was determined approximately 120 min. after the immersion of the electrodes in the electrolyte. Based on the obtained results, it can be concluded that the lowest corrosion resistance was demonstrated by the S1 electrode made of NiTi alloy after mechanical polishing (EOC = −0.306 V). The application of NiTi electrode surface modification processes in the form of sterilization and deposition of the HAp/nSiO2/Ag hybrid coating after subsequent sintering significantly improved the corrosion resistance of the NiTi alloy. The EOC of so modified NiTi electrodes was −0.082 V for the NiTi alloy after passivation in a steam autoclave (S2), −0.198 V for the NiTi alloy after sterilization with a sintered HAp/nSiO2/Ag coating (10:1, 40 V/90 s) (S3) and −0.107 V for the NiTi alloy after sterilization with a sintered HAp/nSiO2/Ag coating (5:1, 50 V/120 s) (S4). The S2 electrode with an ultra-thin passive oxide film exhibited the strongest barrier properties.
The impedance tests were carried out in order to determine the mechanism and kinetics of corrosive processes occurring on the electrode|electrolyte interface during the exposure of the received materials in the Ringer’s solution. The electrode potential was stabilized until a constant
EOC value was obtained due to the fact that the EIS method is only applicable to electrochemical systems that behave linearly and are in steady-state. For approximation of experimental impedance data that were obtained in the case of S1 and S2 electrodes, the simplest electrical equivalent circuit in the form of the Randles circuit was used [
46,
47,
48]. A solution resistance (
Rs) in series with a parallel connection of a double layer capacitance (
Cdl) and a charge transfer resistance (
Rct) was used to model the AC impedance data. When considering that measured capacitance usually deviates from the pure capacitance due to the electrode surface roughness, the
Cdl was expressed in terms of the constant phase element (CPE), the impedance of which is given by:
where:
T is the capacitance parameter given in F cm
−2 s
ϕ−1 dependent on the electrode potential, and
ϕ relates to the angle of rotation of purely capacitive line on the complex plane plot plots:
α = 90° (1−
ϕ). CPE is associated with a leaking capacitor with non-zero real and imaginary components. For
ϕ = 1, purely capacitive behavior is obtained and
T =
Cdl. In Equation (1), the
T parameter represents pure capacitance for
ϕ = 1, infinite Warburg impedance for
ϕ = 0.5, pure resistance for
ϕ = 0, and pure inductance for
ϕ = −1.
Figure 11a shows the described model that represents the system of the NiTi|oxide layer|Ringer solution. It produces one semicircle on the complex plane plot (
Rs, CPE-
T1, CPE-
ϕ1,
Rct1). Such a model is well-known in the testing of corrosion resistance of NiTi alloy in a simulated human body solution [
46,
47,
48].
In the case of S3 and S4 electrodes, a more complex model that considers the inner compact oxide layer and the outer porous layer in contact with the electrolyte was proposed to study the interfacial properties of the NiTi|oxide layer|composite HAp/nSiO
2/Ag coating|Ringer solution system. This model consists of two Randles circuits in series and it produces two semicircles on the complex plane plot (
Figure 11b). The high frequency (HF) semicircle is related to the composite HAp/nSiO
2/Ag coating|Ringer solution interface and it is described by
Rs, CPE-
T1, CPE-
ϕ1, and
Rct1 parameters, whereas the low frequency (LF) semicircle is associated with the oxide layer|Ringer solution interface and it is described by CPE-
T2, CPE-
ϕ2, and
Rct2 parameters.
Figure 12a,b show Bode plots showing the dependence of the impedance module logarithm and phase angle (
φ) as a function of the frequency logarithm, respectively. One can observe a very good fit of the experimental impedance data and theoretical models shown in
Figure 11 for the NiTi alloy before and after surface modification in Ringer’s solution. In the case of S1 and S2 electrodes that are covered with an oxide film, only one semicircle was observed on the complex plane plots with one time constant. For S3 and S4 electrodes with a composite HAp/nSiO
2/Ag coating, two semicircles were visible on the complex plane plots with two-time constants, where the diameter of the LF semicircle was higher. The value of the slope in the form of the impedance module in the medium frequency range was about −1, according to theoretical predictions. The measured high values of |
Z|
f→0 and
φ close to −90° confirm the capacitive behavior of the material that was characterized by high corrosion resistance. The obtained impedance values are in good compliance with the experimental impedance that was determined for passivated metallic materials in solutions containing aggressive Cl
− ions, which cause pitting corrosion [
46,
47,
48]. One can also observe an increase in the value of log|
Z| at the lowest frequency of 2 mHz for S2, S3, and S4 electrodes in comparison with that determined for S1 electrode, which indicates that the methods that are used to modify the surface of the NiTi electrode increase its corrosion resistance in Ringer’s solution (
Figure 12). The highest corrosion resistance can be confirmed for the NiTi alloy after autoclaving (S2).
Table 2 presents the summary of the parameters that were obtained as a result of approximating the experimental EIS data for the NiTi alloy before and after surface modification using the proposed models of equivalent electrical circuits in the pitting corrosion process.
The error of the particular parameter determination was below 25%. It can be clearly seen that there are evident changes between the characteristics of the oxide film and the HAp/nSiO
2/Ag composite coating. The
Rct1 parameter that corresponds to the oxide layer|electrolyte interface is characterized by the highest value of 5.9 × 10
7 Ω cm
2 for S2 electrode and it indicates its strongest protective properties. The obtained result is consistent with the
EOC measurements (
Figure 10). The
Rct1 values for S3 and S4 electrodes related to the HAp/nSiO
2/Ag composite coating|electrolyte interface are lower by 10
4 Ω cm
2. However, it should be noted that the sub-surface oxide layer is still present and it retains its effective barrier properties (
Rct2). A significant deviation of CPE-
ϕ2 from 1 for S3 and S4 electrodes indicates a change in the CPE2 behavior, which can be associated with the presence of a porous HAp/nSiO
2/Ag composite coating having different physical, chemical, and geometrical factors when compared to the smooth oxide barrier layer that is represented by CPE-
ϕ1. The values of CPE-
ϕ2 of 0.831 to 0.825 were obtained for S3 and S4 electrode, respectively. The presence of Ni was not detected on the surface of the tested electrodes after the corrosion tests.
The susceptibility of the tested materials to pitting corrosion in the biological environment was determined on the basis of recorded cyclic anode polarization curves that were obtained by the potentiodynamic method The measurement was based on a continuous change of the electrode potential at a sweep rate of 1 mV s
−1 with simultaneous recording of the current flowing through the interface of electrode|Ringer solution. The anodic potentiodynamic curves were prepared on a semi-logarithmic scale log
j = f(E) and are shown in
Figure 13.
Table 3 shows the key electrochemical parameters for the NiTi alloy before and after surface modification determined on the basis of potentiodynamic measurements.
It can be stated that after the applied surface modifications of the NiTi alloy, a shift of the minimum value corresponding to
Ecor towards the anode potentials is observed in
Figure 13 for S2, S3 and S4 as compared to
Ecor on log
j = f(E) curve for the NiTi electrode after mechanical polishing (S1), based on the obtained potentiodynamic characteristics in a wide range of potentials. Corrosion potential is widely recognized as a parameter that allows for a preliminary assessment of the corrosive properties of metals and alloys. This parameter makes it possible to predict when destructive processes will begin in the tested material that is exposed to a corrosive environment. The corrosion current density (
jcor) value is directly proportional to the rate of the electrochemical corrosion process. However, it cannot be used as a kinetic parameter to compare the corrosion resistance of the studied materials. The NiTi alloy has the ability to self-passivate in the presence of an oxygen carrier, so the corrosion potential of the NiTi electrode after the mechanical polishing process (S1) is in the passive region of the obtained potentiodynamic characteristics. The corrosion resistance of the tested electrodes mainly depends on the structure and thickness of the passive layer. The oxide layer in the form of a nanometric TiO
2 layer is formed on the NiTi alloy surface as a result of its contact with air. This reaction occurs spontaneously. The highest value of
Ecor = 0.195 V was determined for the S2 electrode after forced passivation in an autoclave.
The deterioration of the tested materials’ corrosion resistance is associated with chloride ions that are present in the solution responsible for pitting. Pitting is caused by the interaction of halide ions, such as Cl
−, on the surface of the passive layer, which have the ability to destroy it locally. Chloride ions accumulate on the surface of the passive layer and penetrate deep into the material where it is the weakest, e.g., at grain boundaries or in the place of mechanical damage. The Okamoto model describes the phenomenon of pitting initiation and propagation. It was discussed in our earlier work [
48]. It is assumed that the water molecules on the metal surface are replaced with chloride ions. By bonding with metal, these ions hinder the incorporation of metal ions into the passive layer, making it easier for them to go into the solution and, thus, inhibit the repassivation phenomenon. A corrosive cell forms at the pitting site. The surrounding surface is the cathode, where oxygen reduction occurs, whereas the inside of the pitting is the anode, and this is where the digestion of metal takes place, as a result of which the pitting grows.
In the range of potentials from
Ecor up to the breakdown potential, the tested electrodes are in the passive area and they have various values of anode current densities, which result from the phase composition, chemical composition, and the thickness of the layers. For all of the recorded anode polarization curves at
Eb, an increase in the density of the measured current is observed, which is due to the initiation of pitting corrosion (
Figure 13).
Table 3 presents the determined
Eb values, together with the corresponding values of the breakdown current density (
jb) for NiTi electrodes before and after surface modification. It is worth emphasizing that the highest value of the breakdown potential in Ringer’s solution containing aggressive chloride ions was determined for the NiTi electrode after autoclaving (
Eb = 1.675 V), which confirms its highest corrosion protection among the tested electrode materials. Above the
Eb value, a rapid increase in the current density value can be observed, which is caused by an effective oxygen release and anodic dissolution of the electrodes. The hysteresis loops that are presented in
Figure 13 for S1, S2, S3, and S4 electrodes occurred at the reverse polarization of the width that was dependent on the type of the layer coating the NiTi electrode surface. Their appearance indicates the development of formed pits. The potential at which the return curves of log
j = f(E) intersect the primary polarization characteristics is treated as a protection potential (
Ep). Below the E
p, the existing pits are repassivated and new pits are not formed.
Table 3 shows the key parameters, such as
Eb and
Ep for the studied electrodes in Ringer’s solution. The large width of the hysteresis loop (
Eb − Ep) in
Figure 13 for S3 and S4 electrodes indicates that the HAp/nSiO
2/Ag composite coatings exhibit much higher susceptibility to pitting corrosion in Ringer’s solution when compared to the NiTi electrode after mechanical polishing (S1) and autoclaving (S2). The lowest key electrochemical parameters were observed for the NiTi alloy after sterilization with the HAp/nSiO
2/Ag coating (5:1, 50 V/120 s) that was sintered at 700 °C in argon, probably due to the fact that it has the most developed surface among all of the tested electrodes (
Table 3).


