Effects of UV Stabilizers on Polypropylene Outdoors


Abstract
1. Introduction
2. Experimental
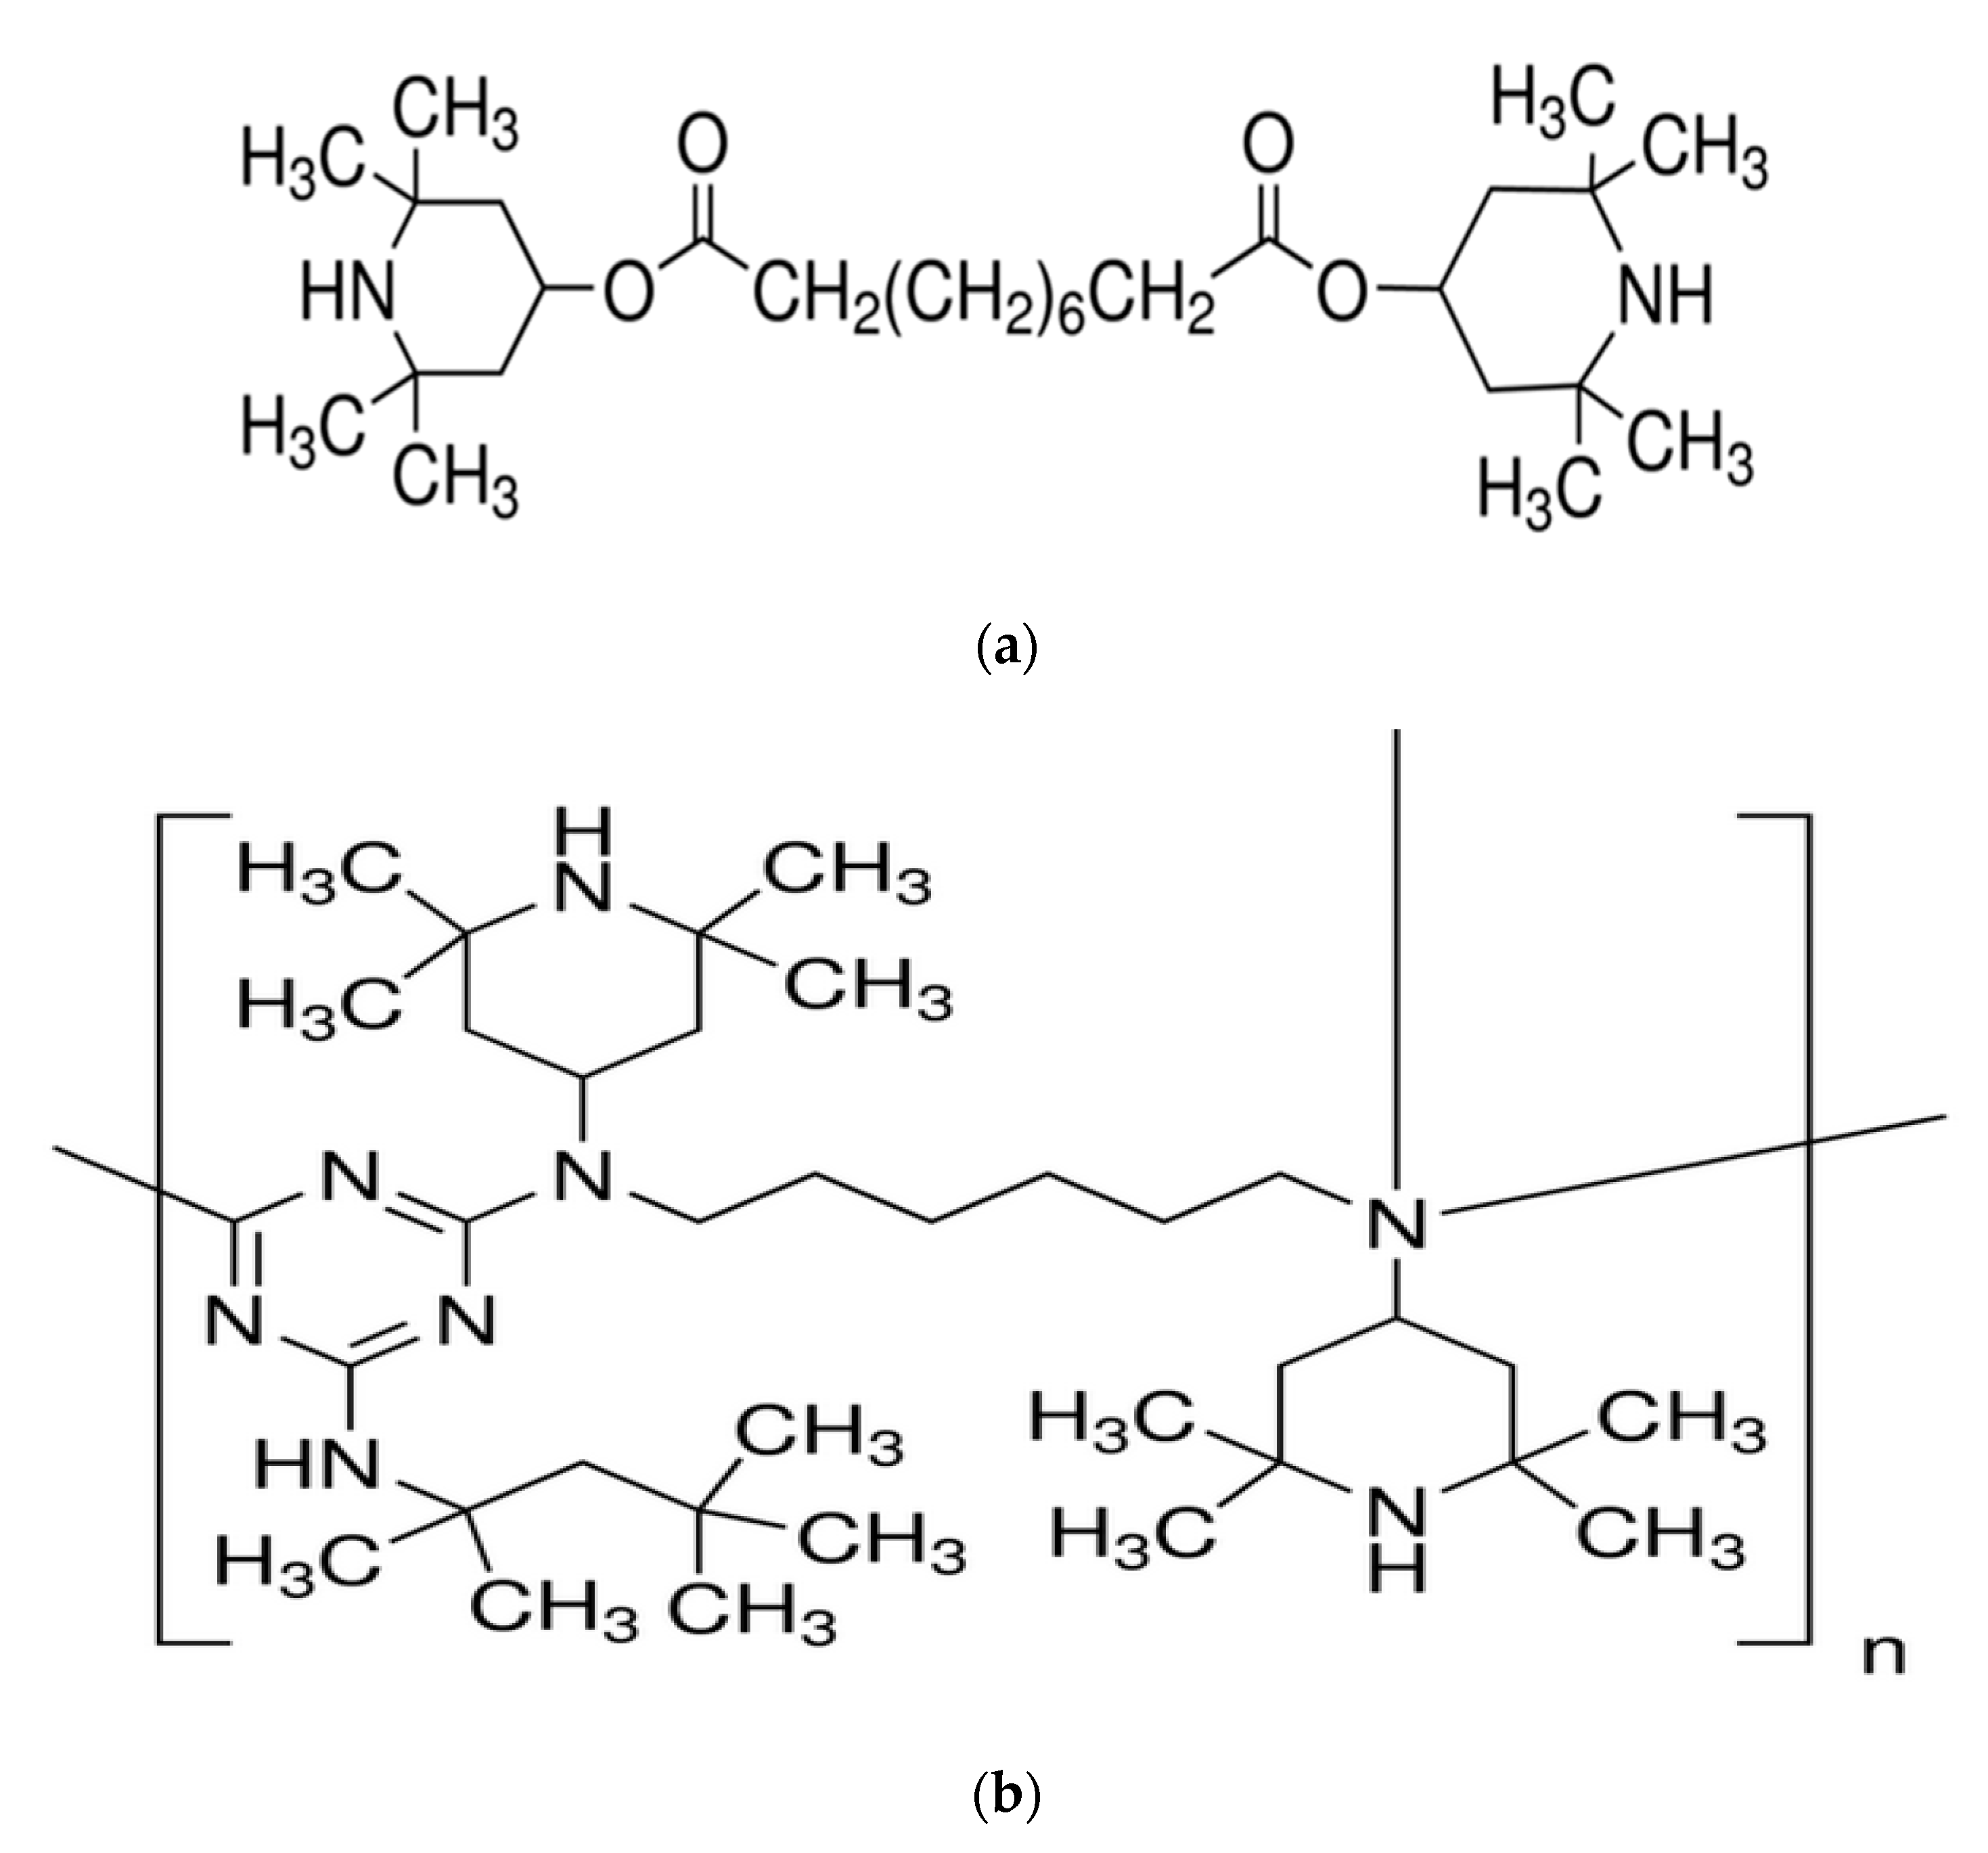
2.1. Materials
2.2. Sample Preparation
2.3. Film Characterization
2.4. UV Dose Calculation
2.5. Tensile Properties
2.6. Thermogravimetric Analysis (TGA)
2.7. Dynamic Friction Analysis
2.8. Morphology of Film Surface (SEM)
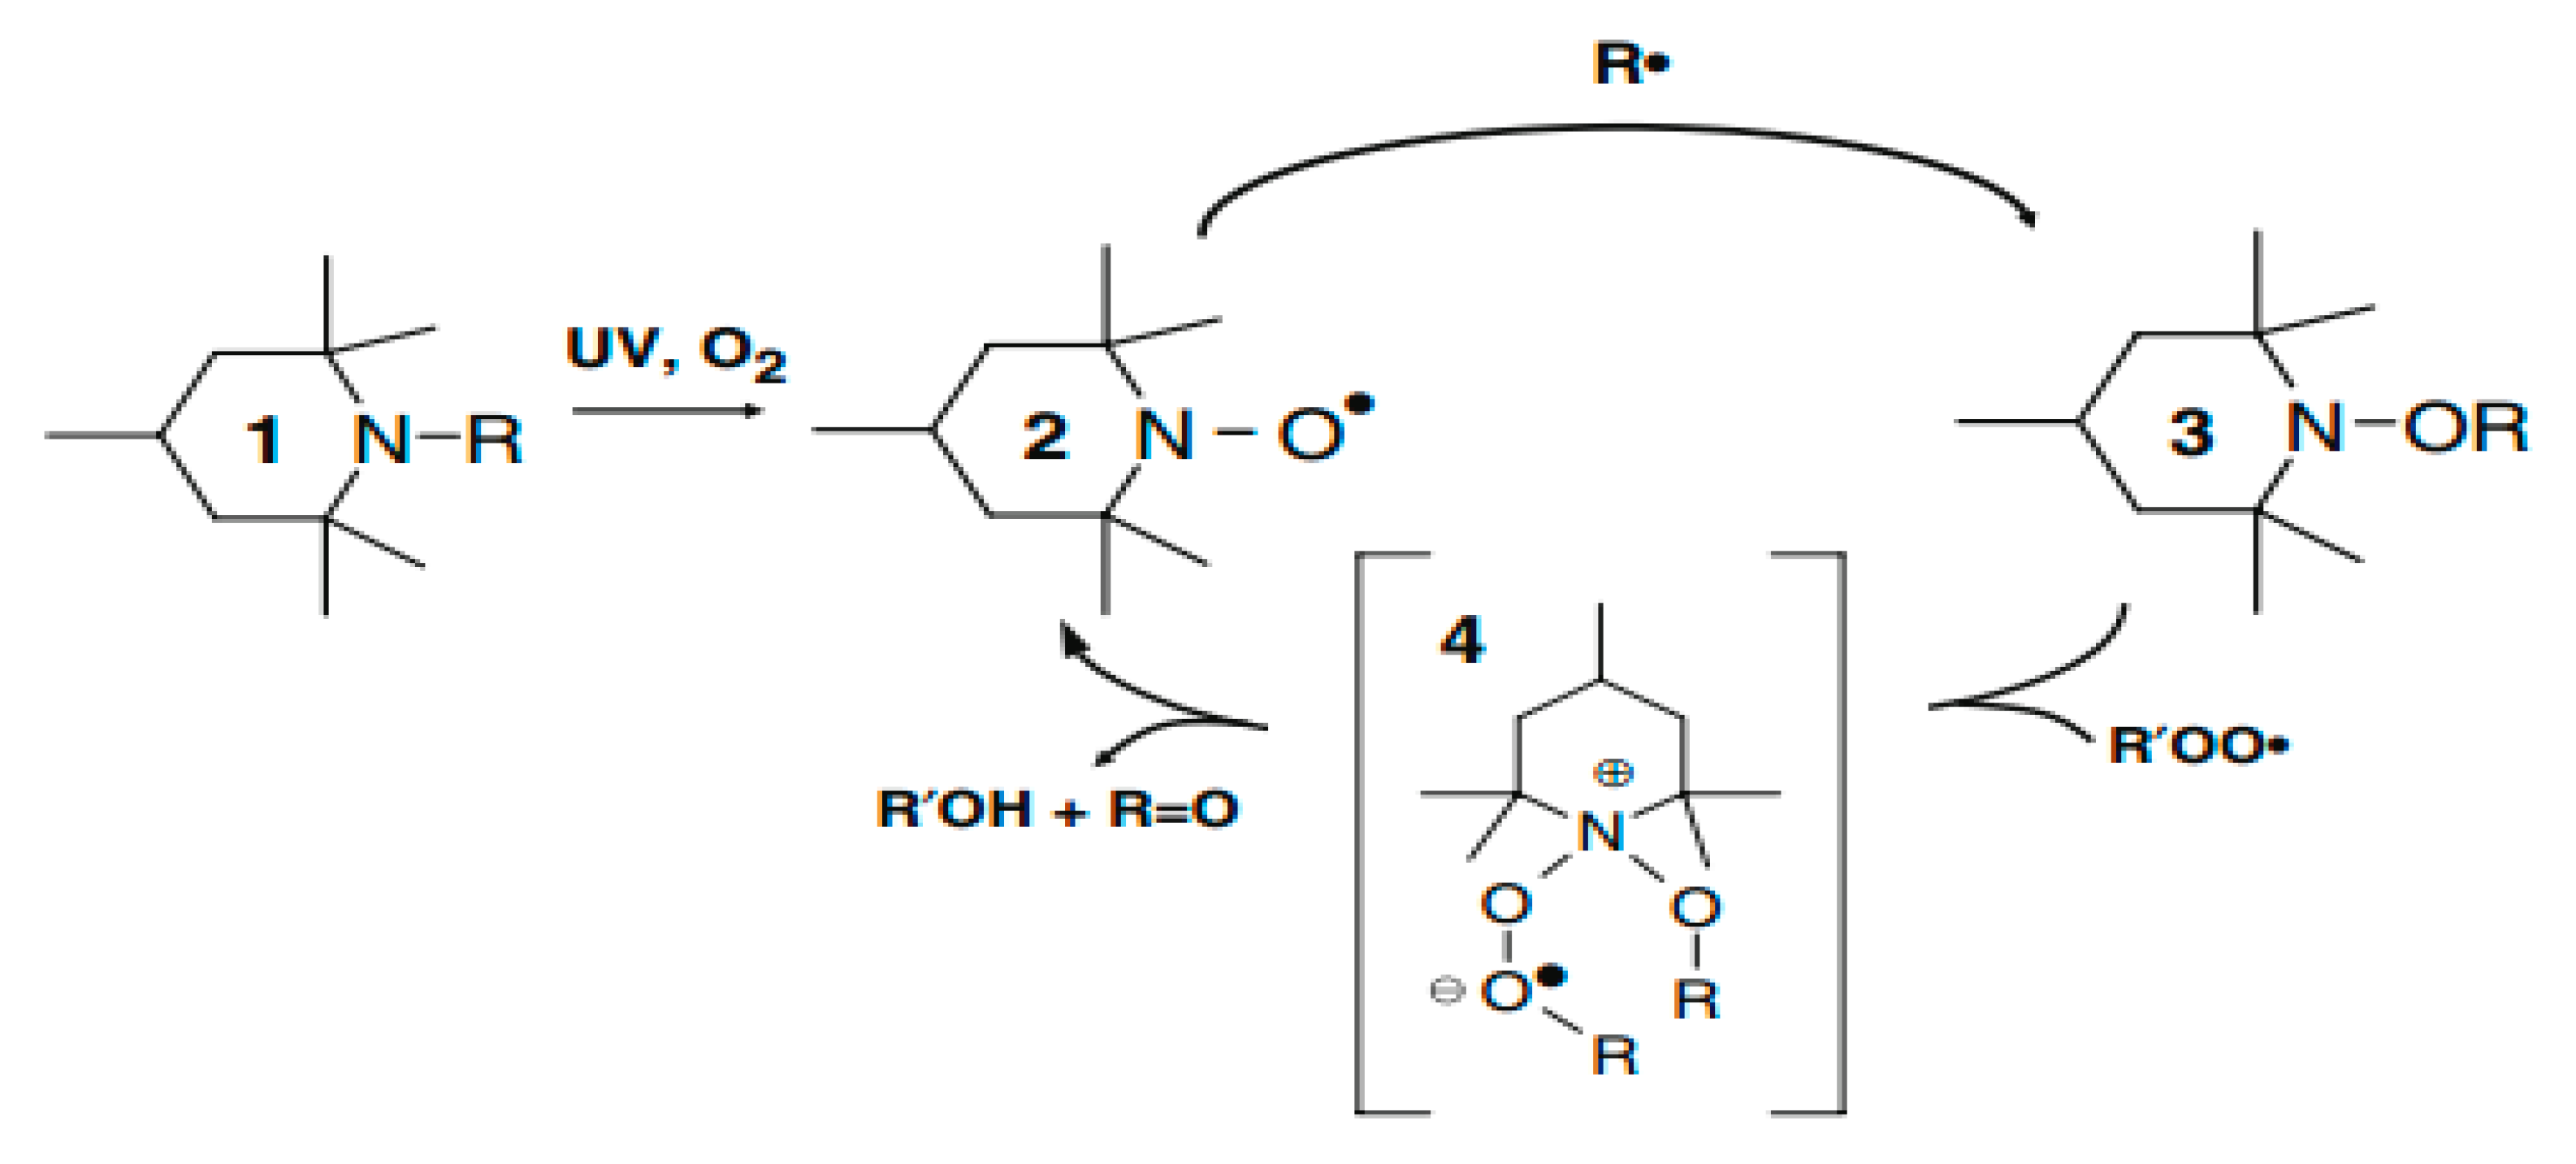
3. Results and Discussion
3.1. UV Transmittance
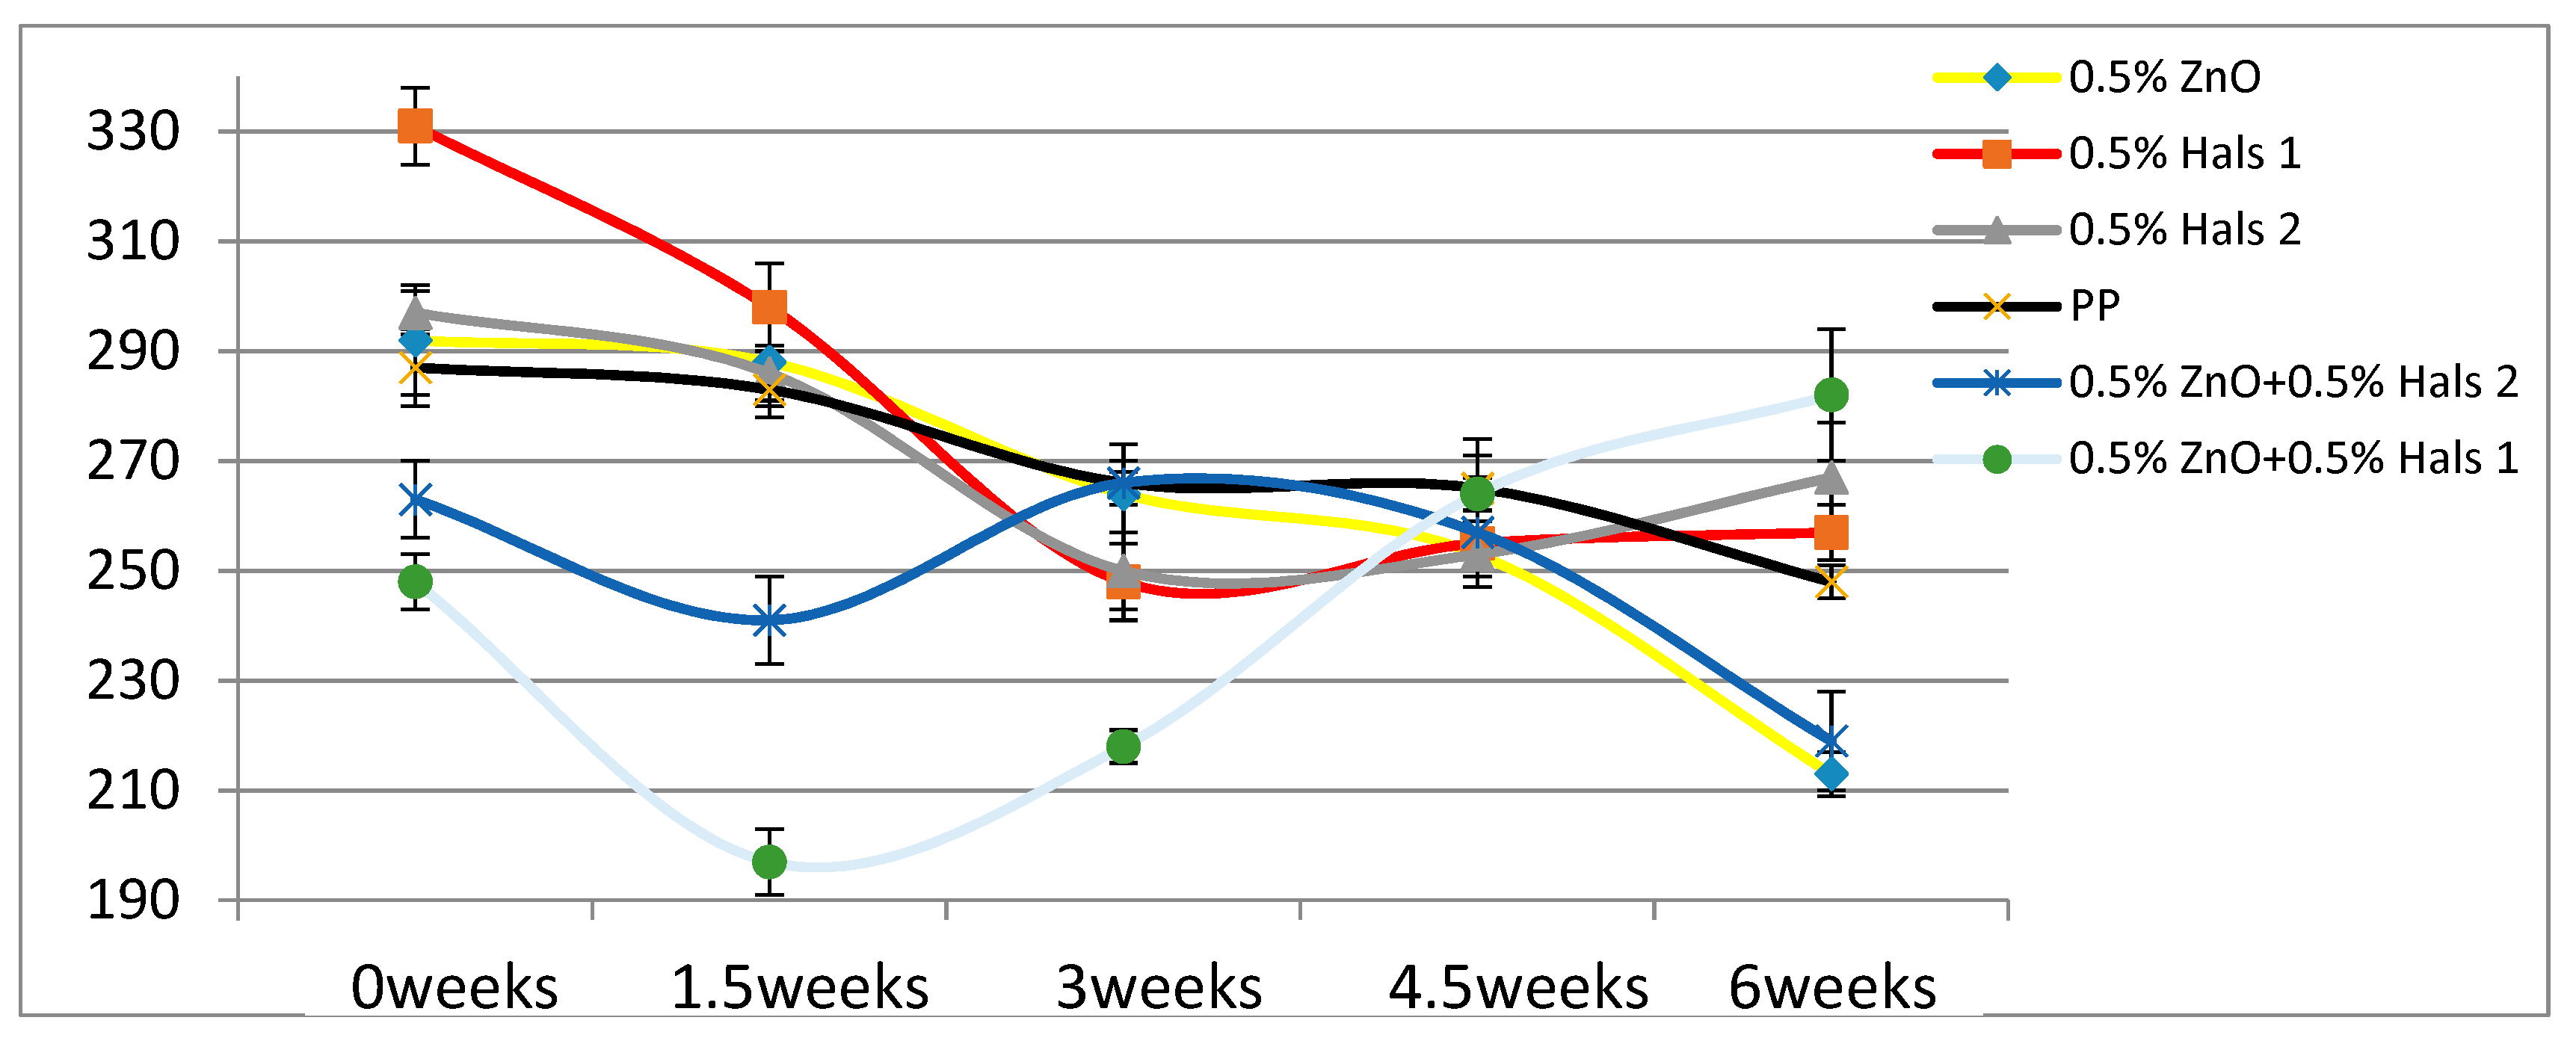
3.2. Tensile Properties
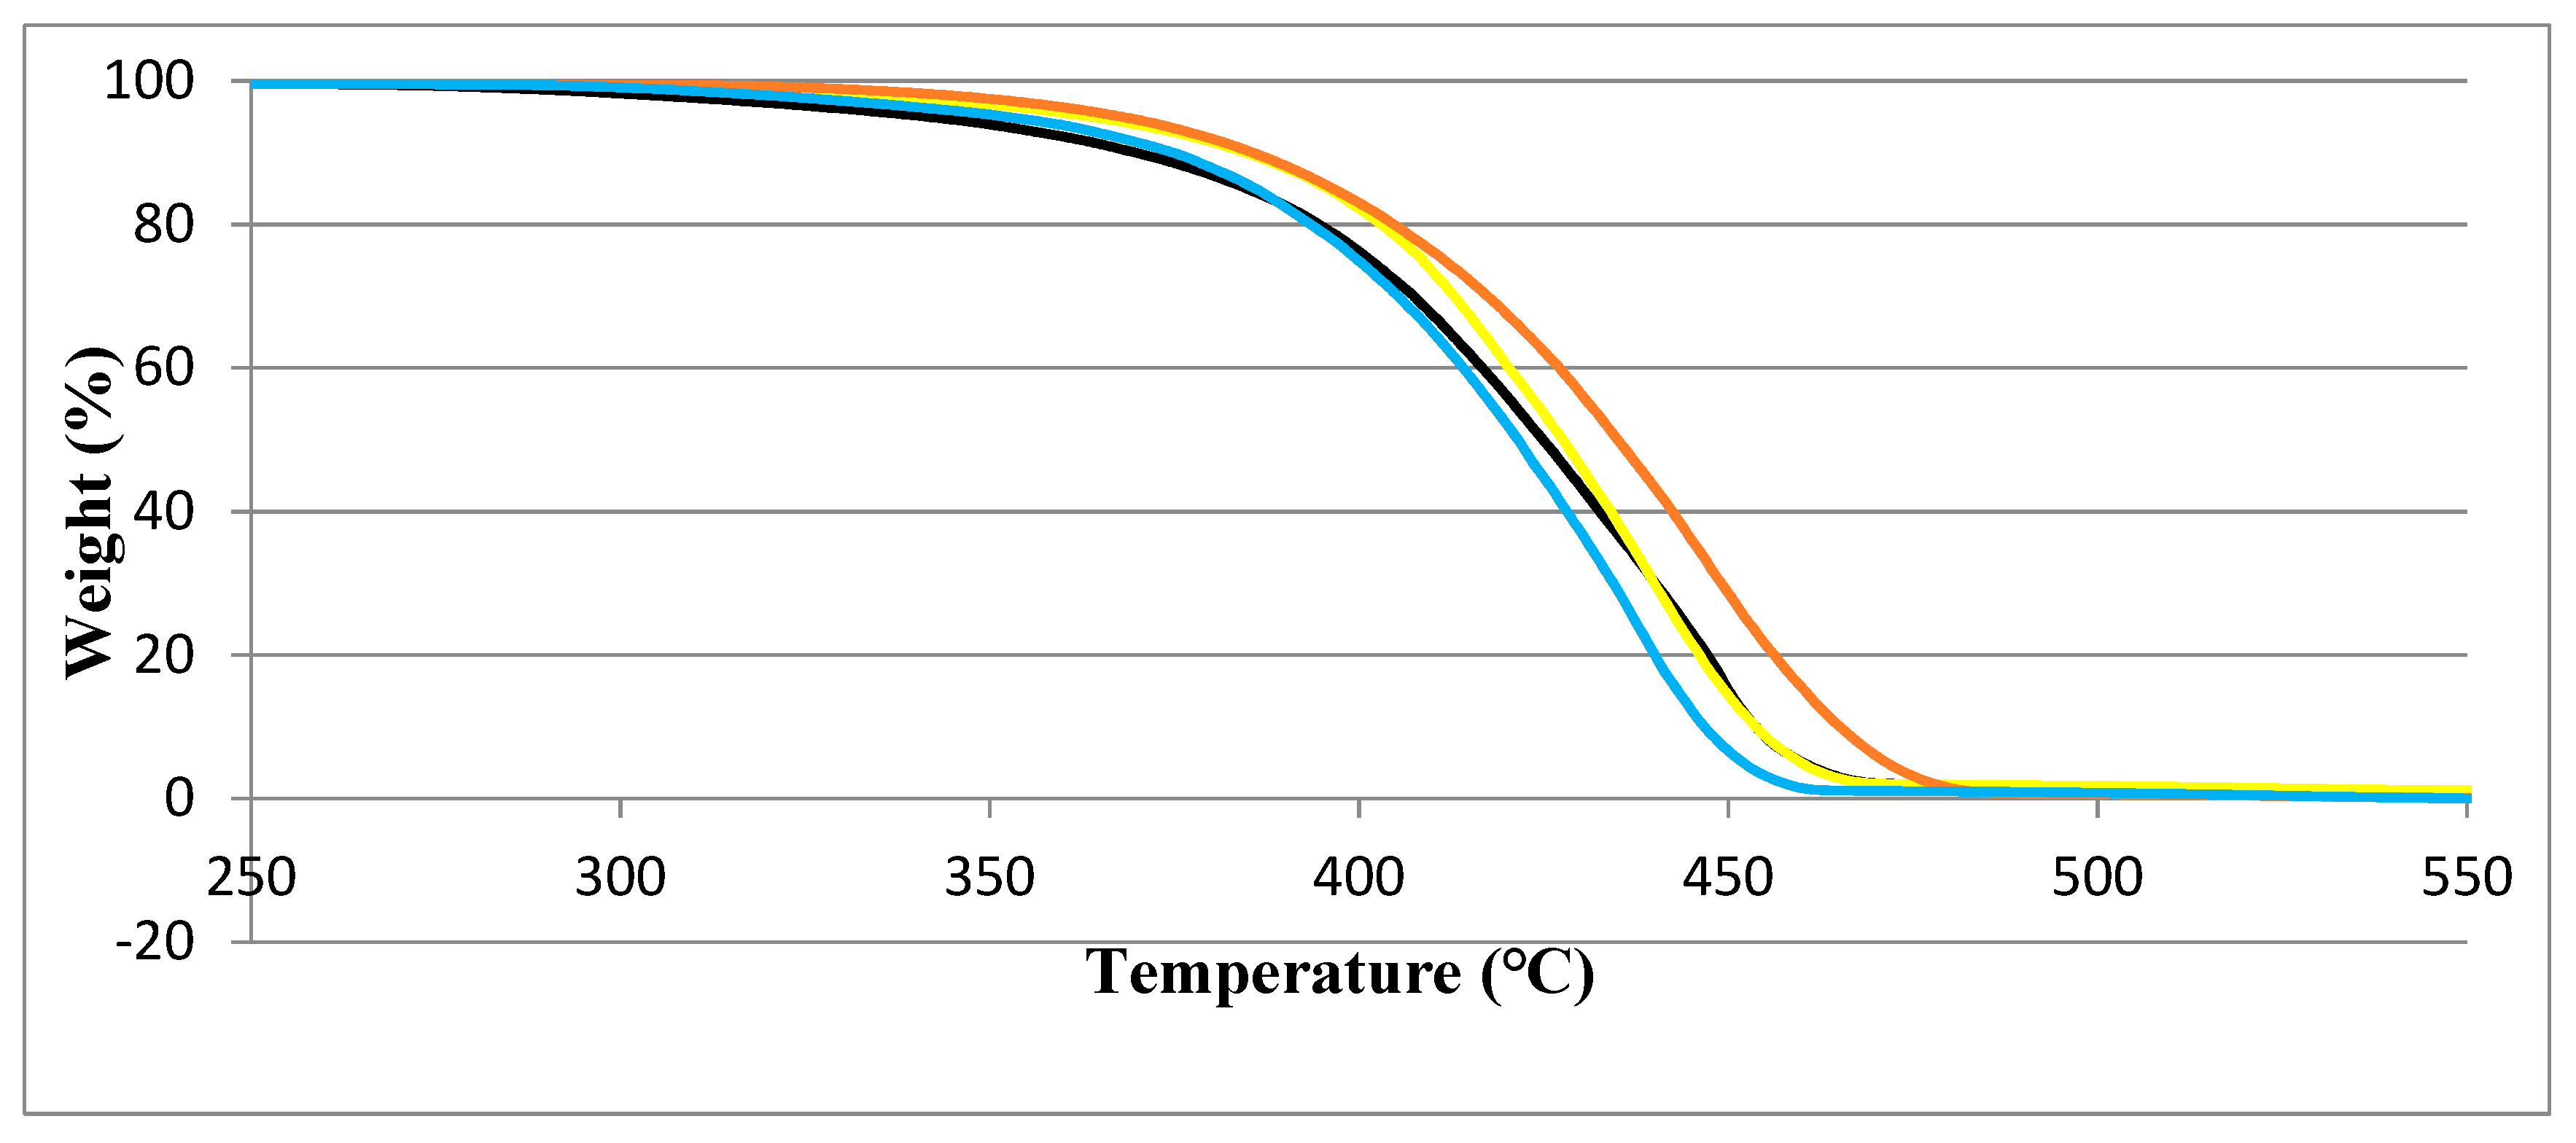
3.3. TGA Results
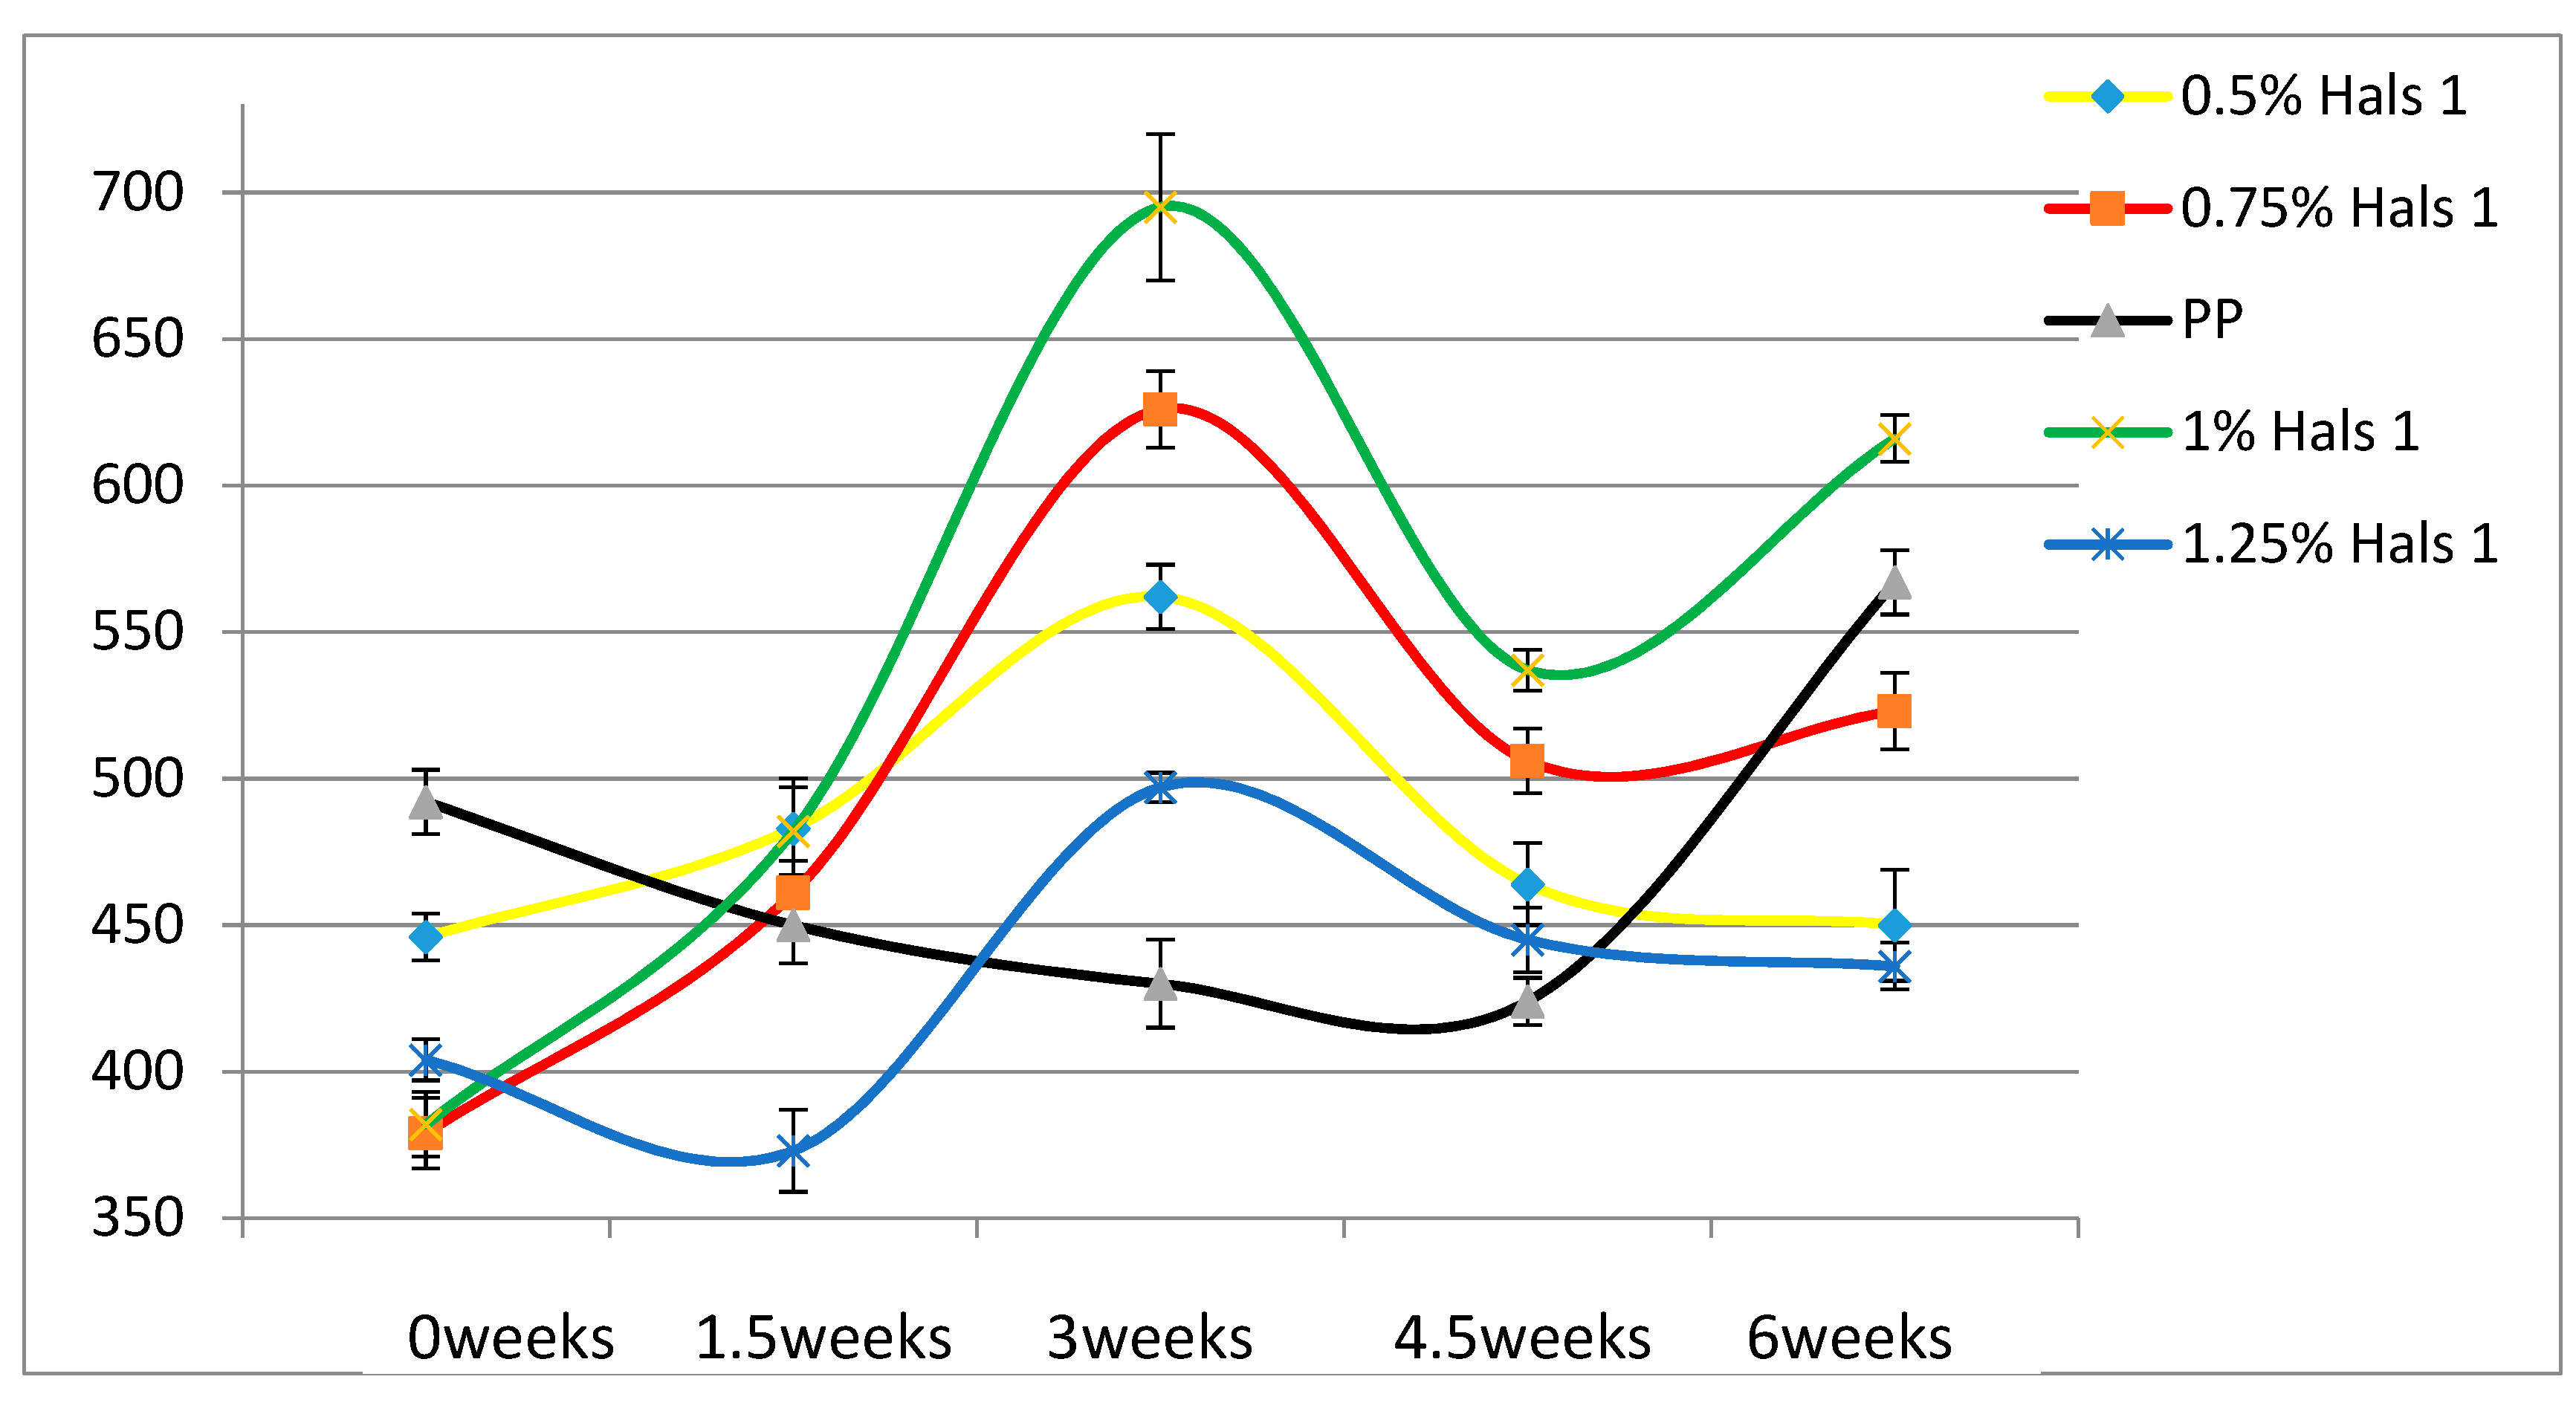
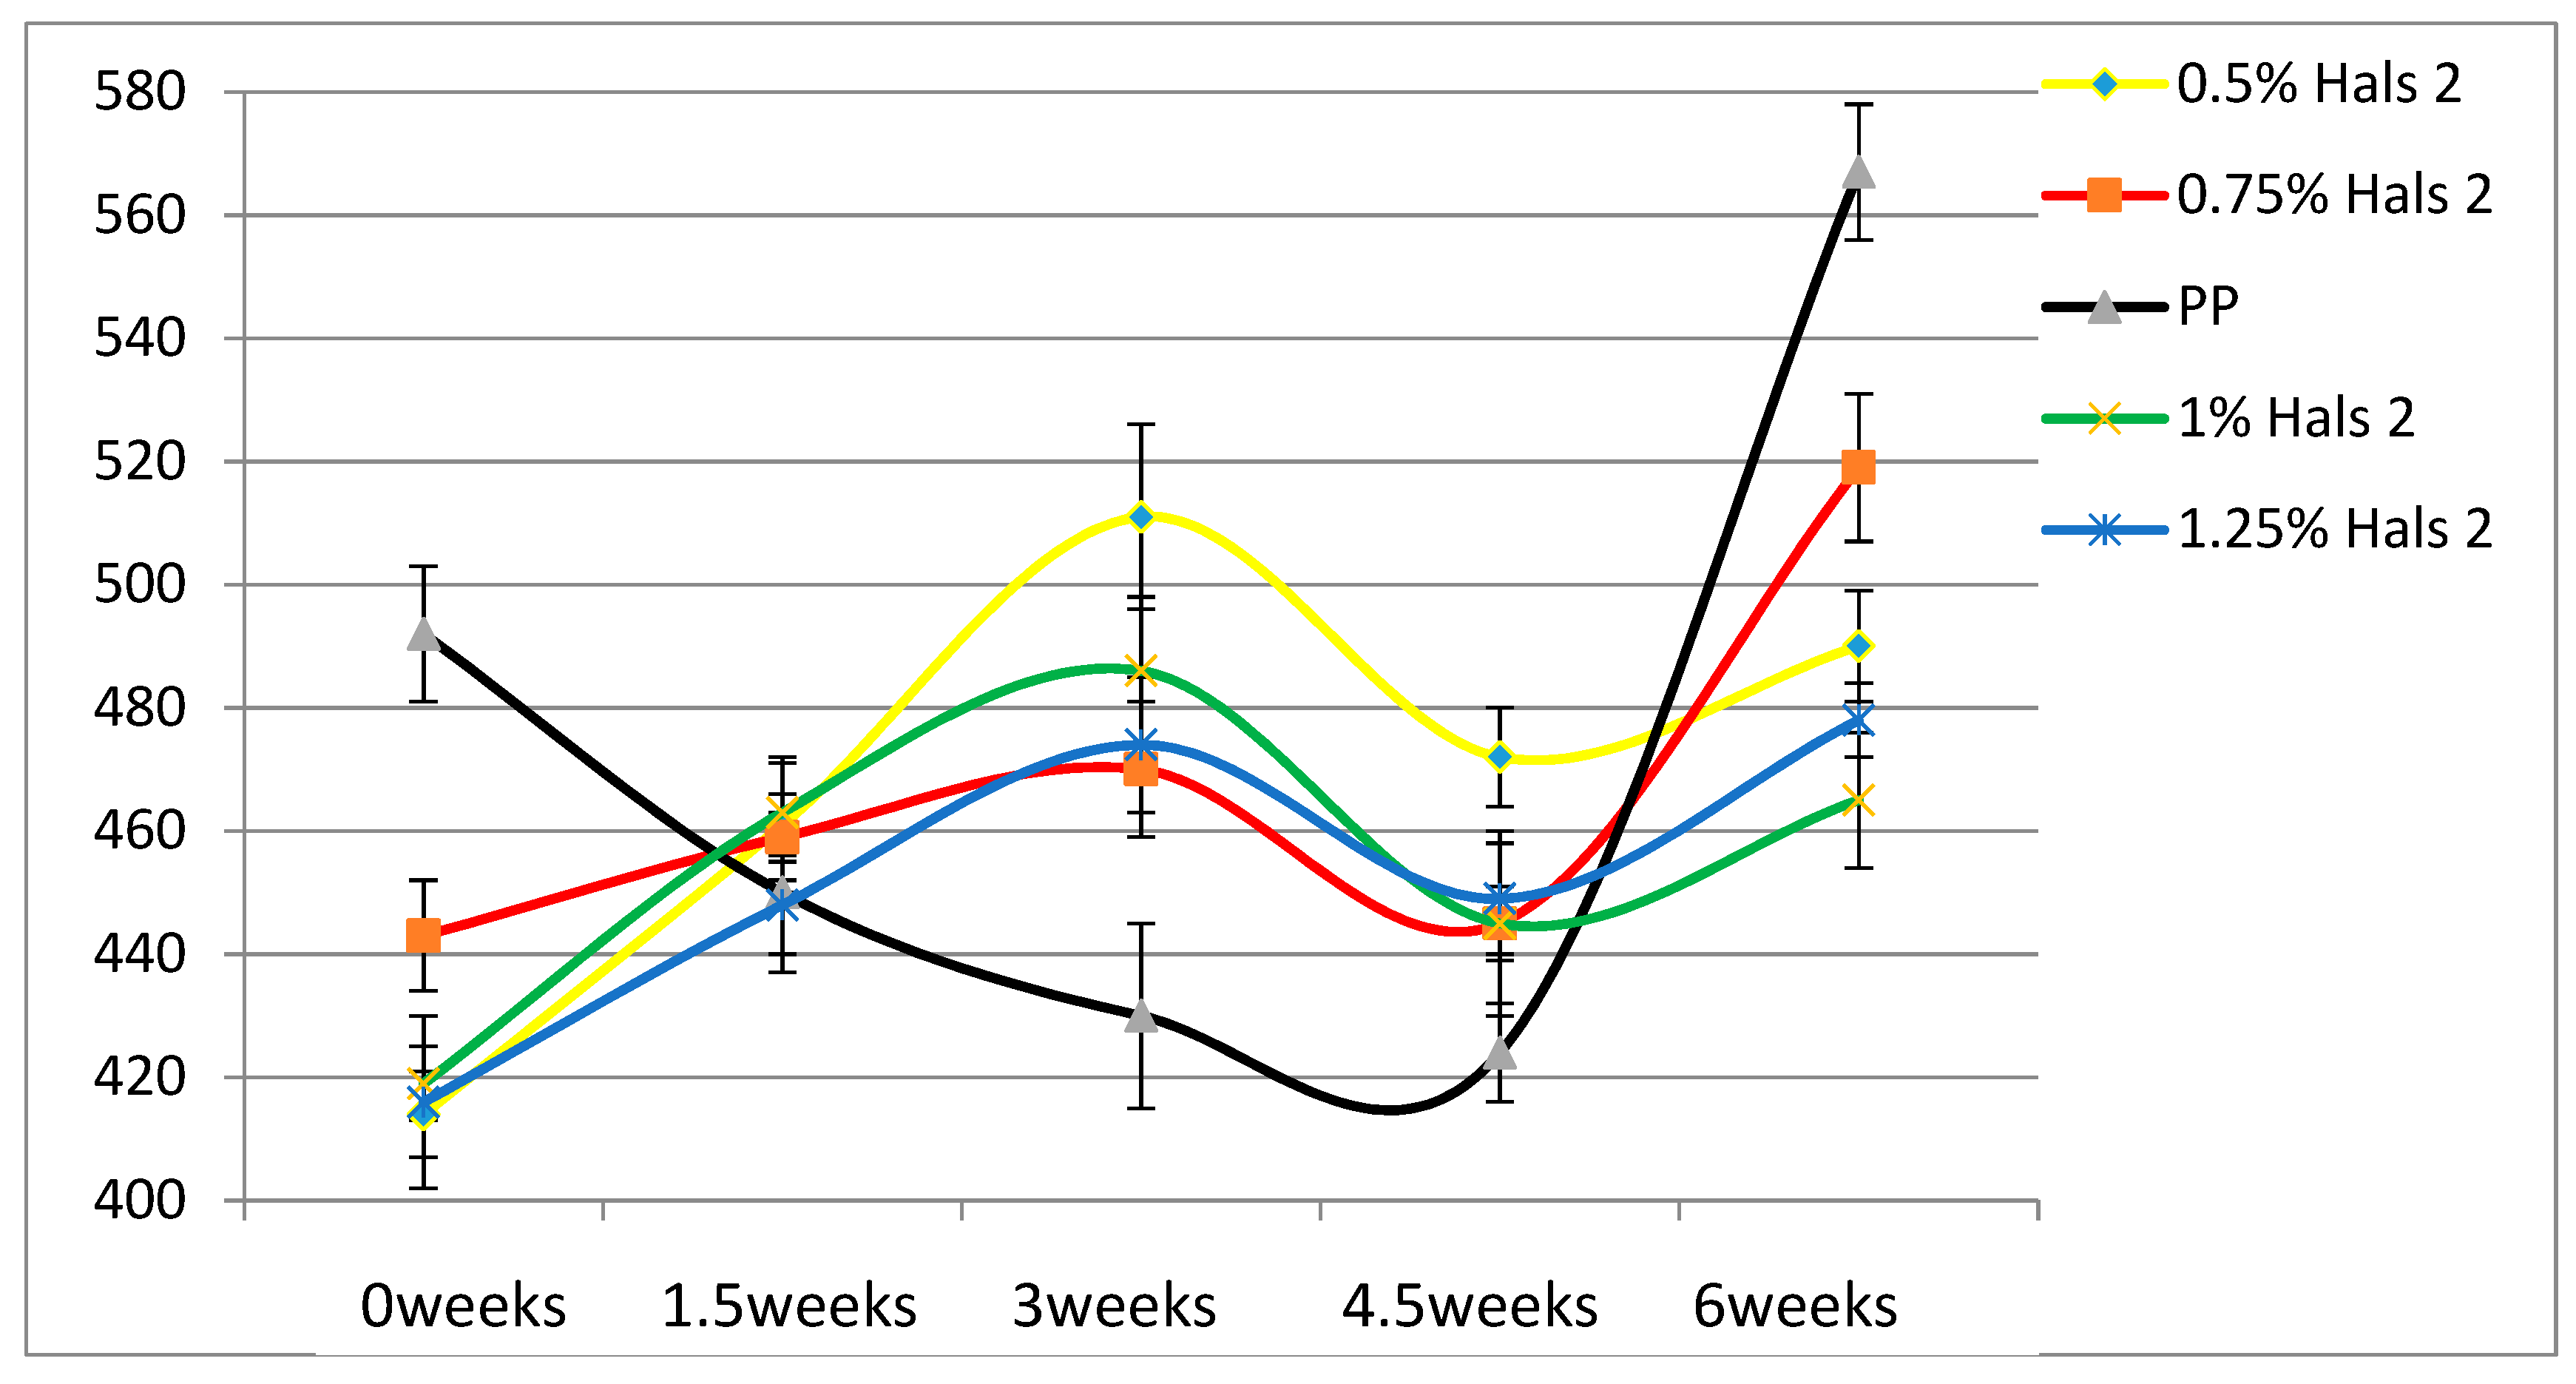
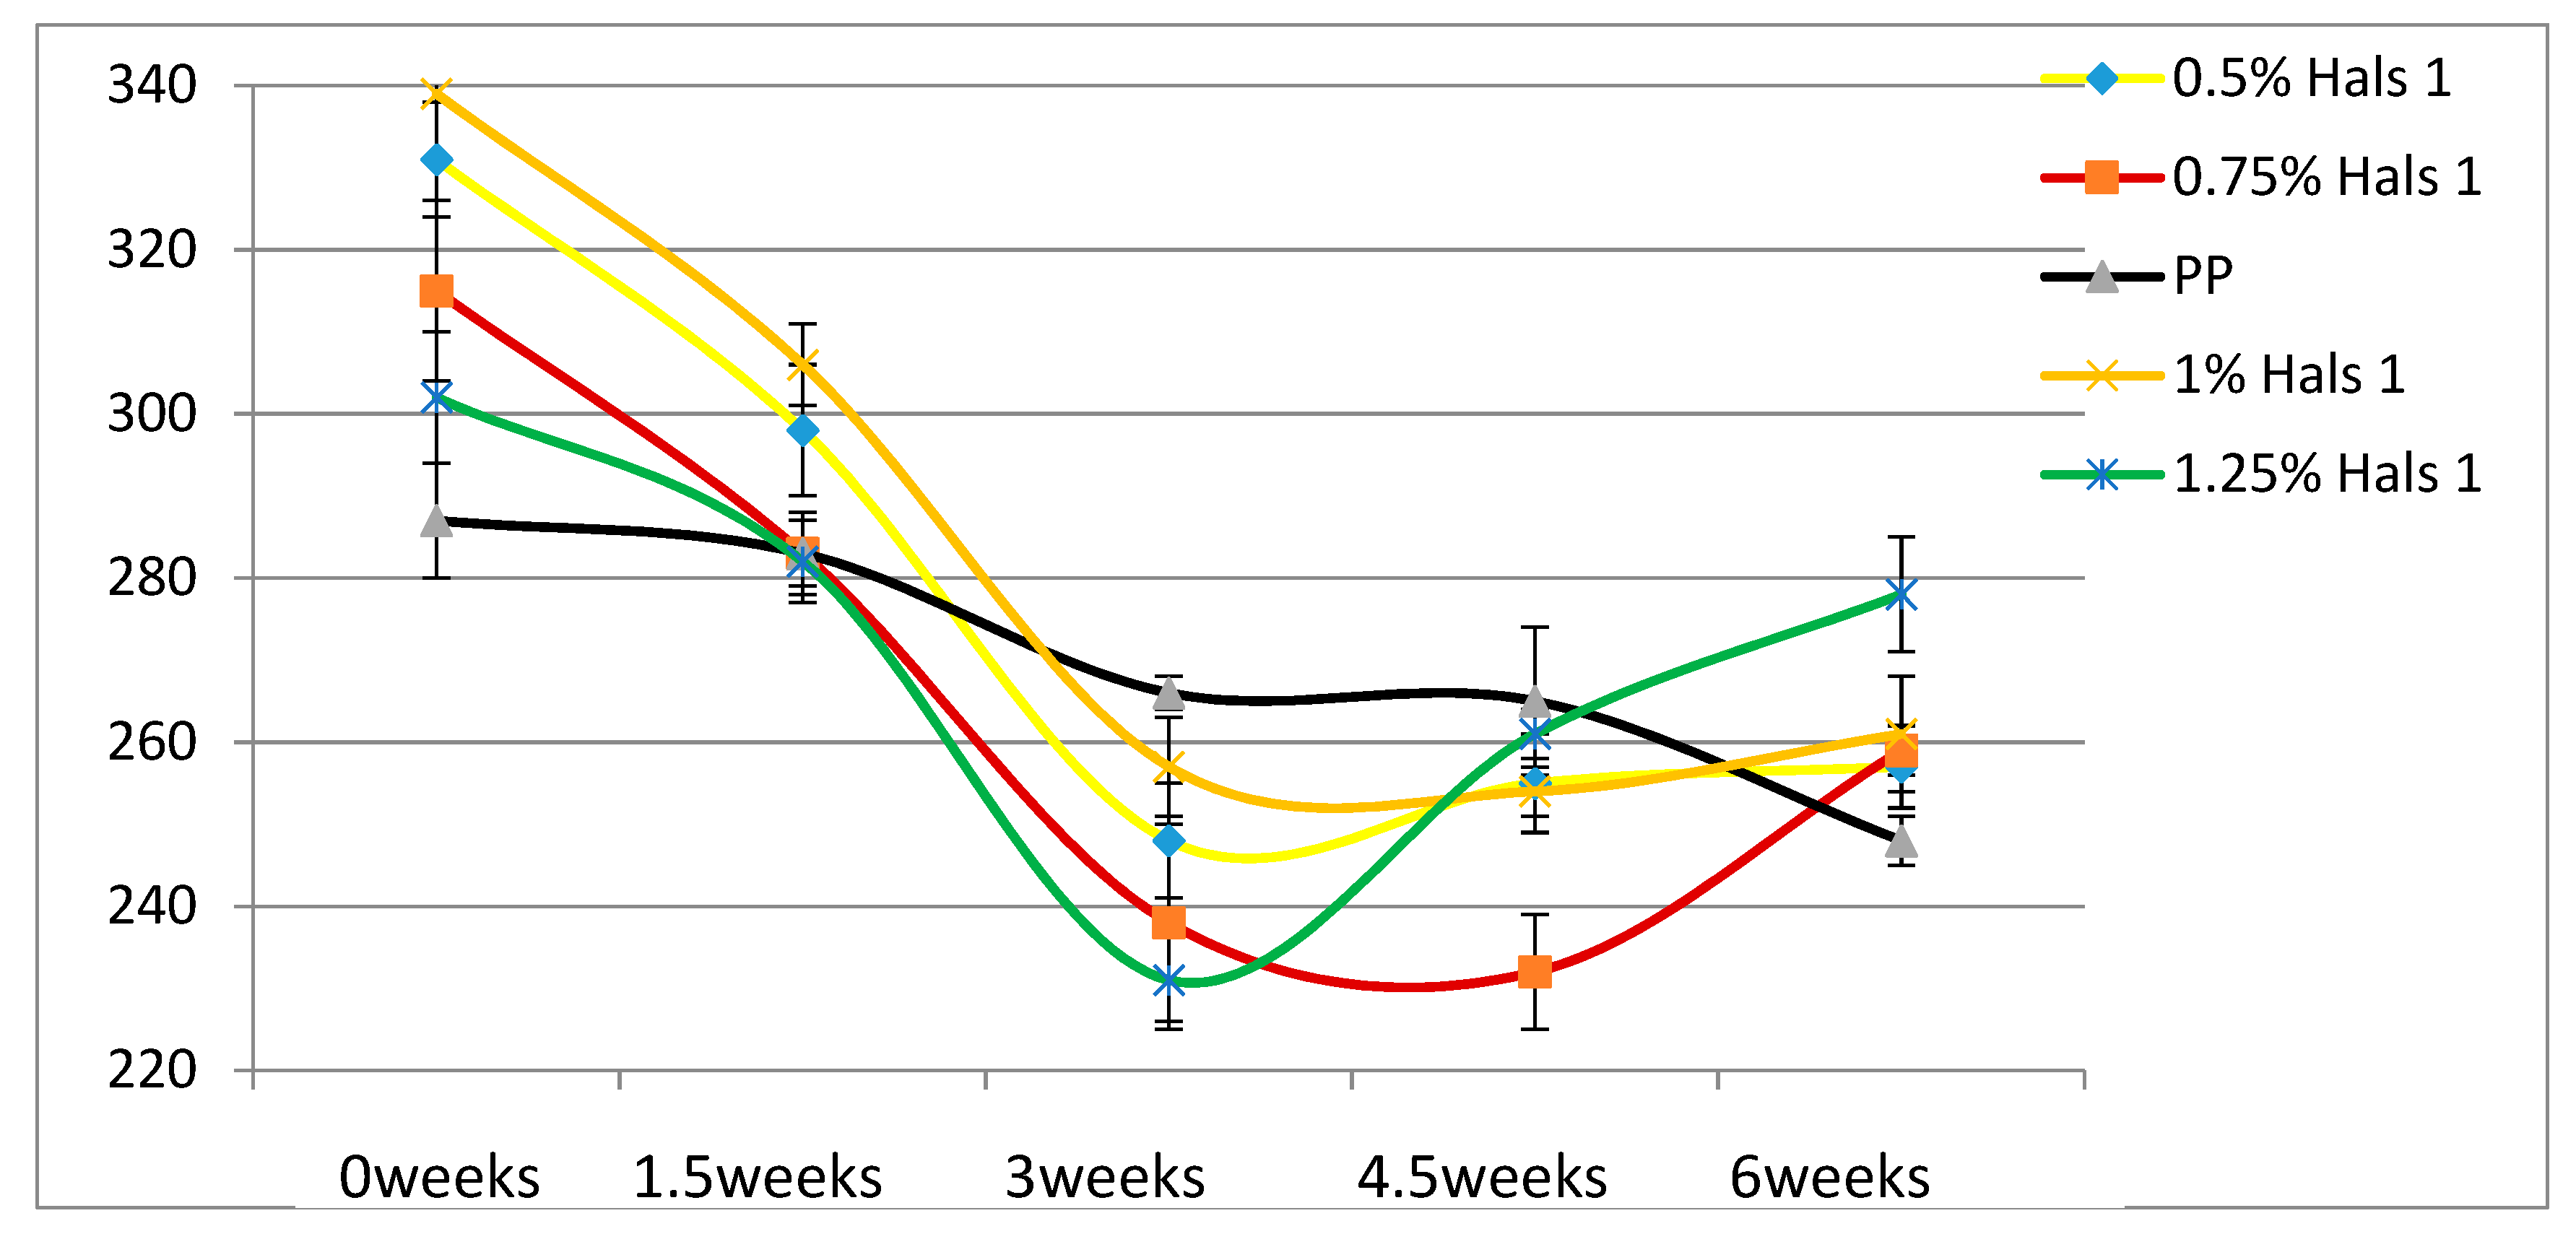
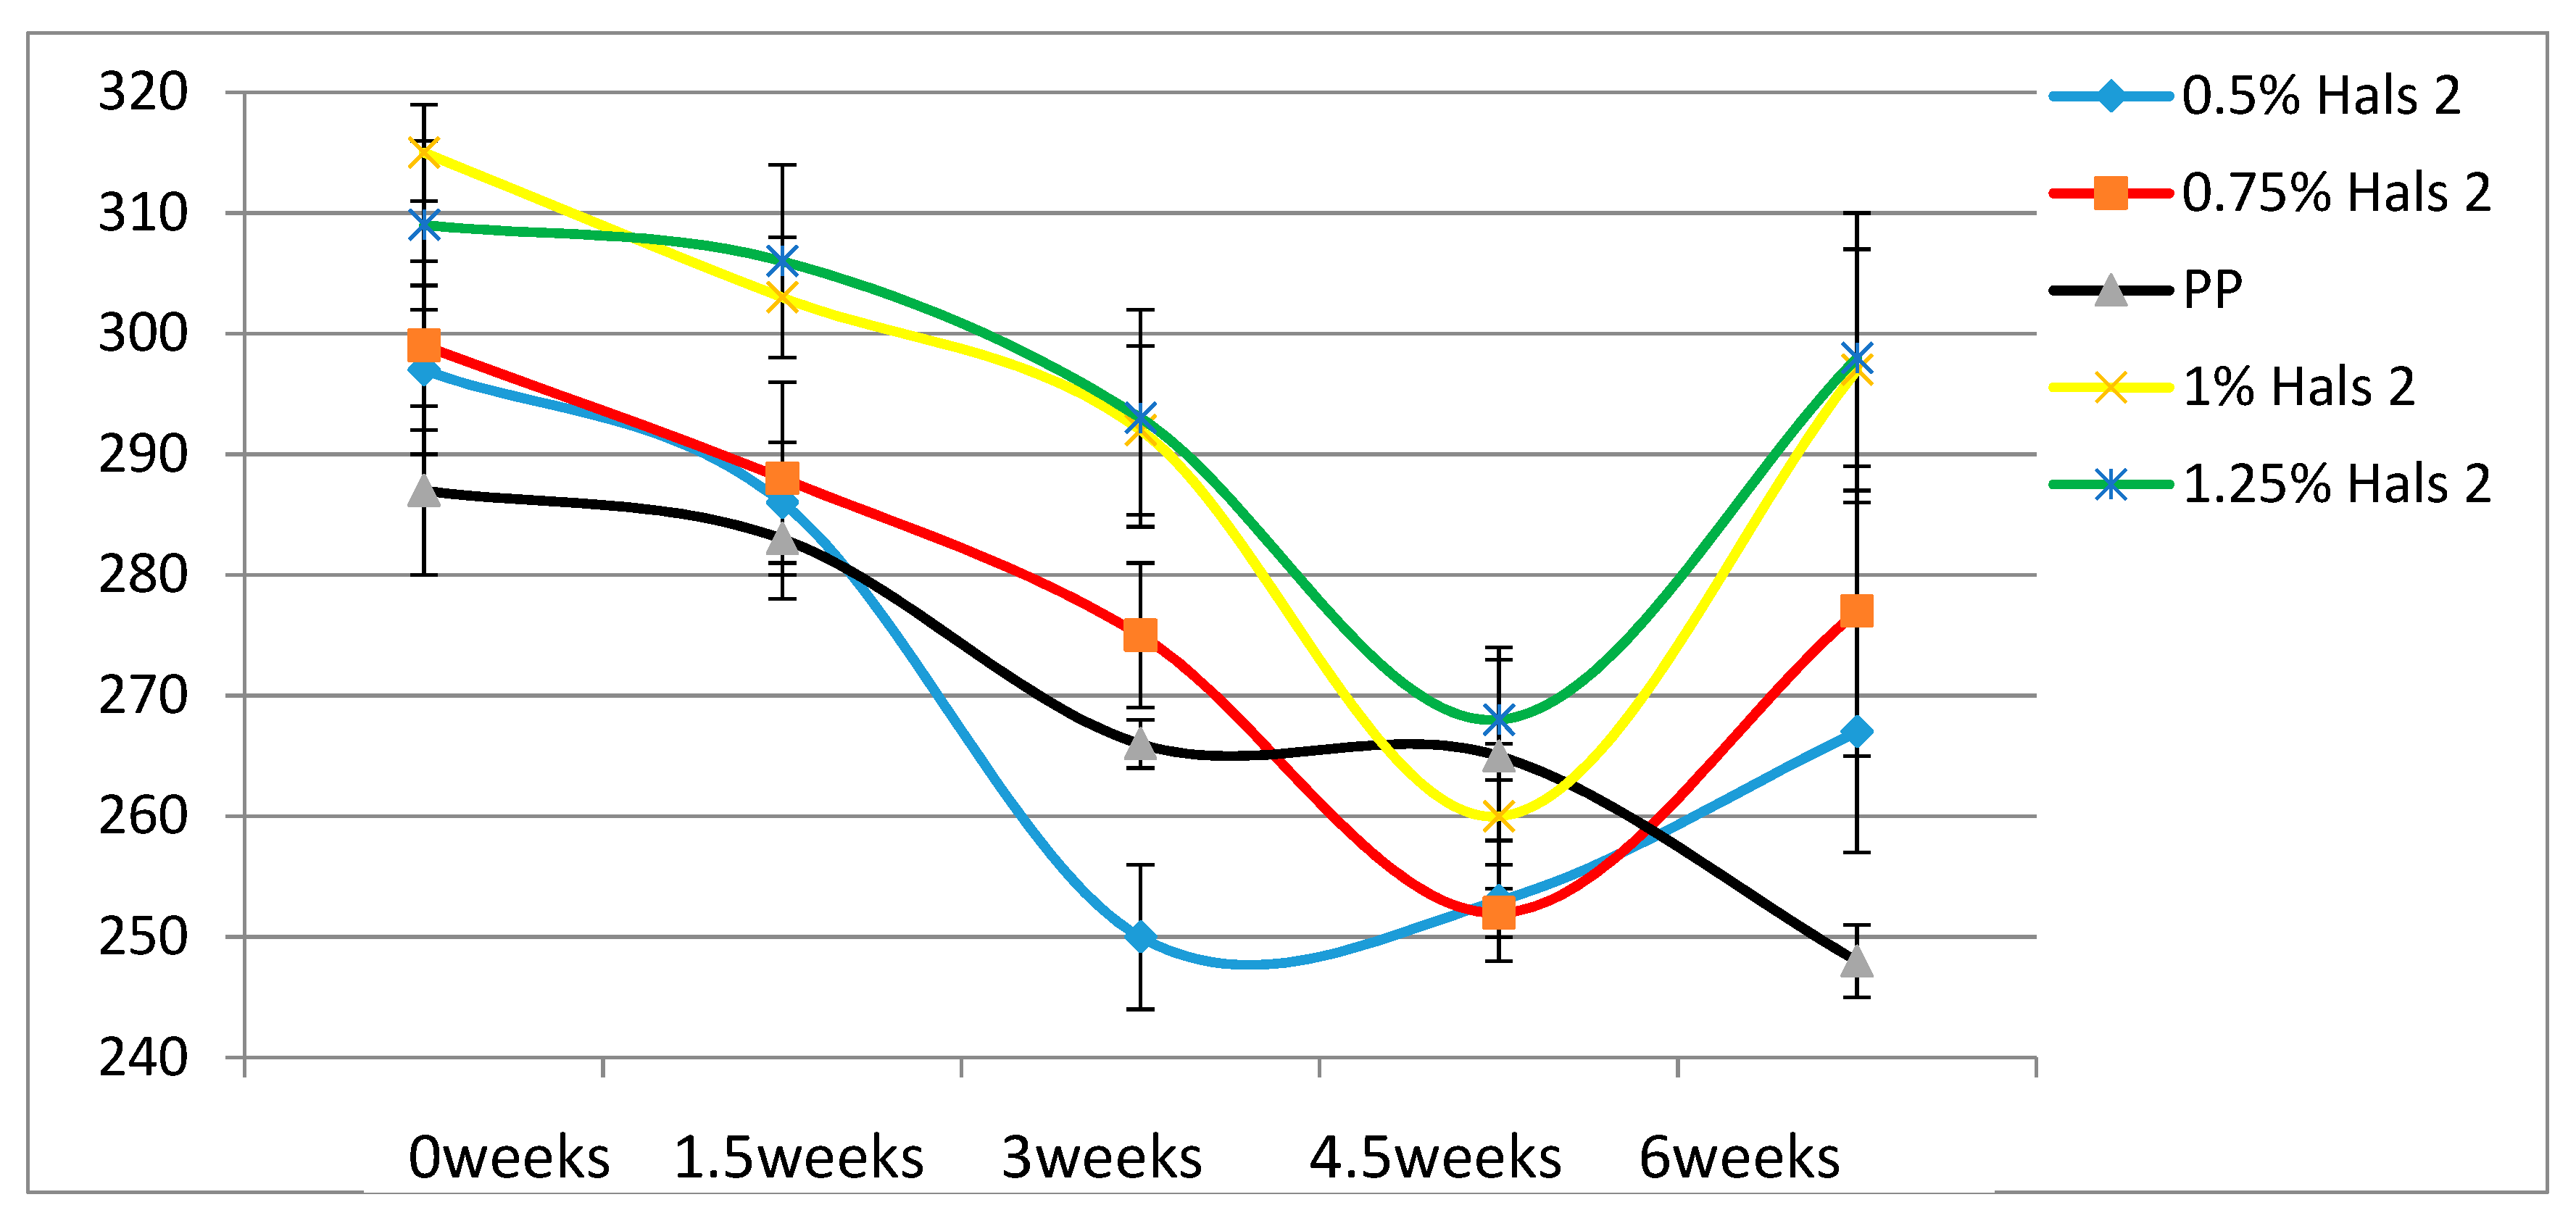
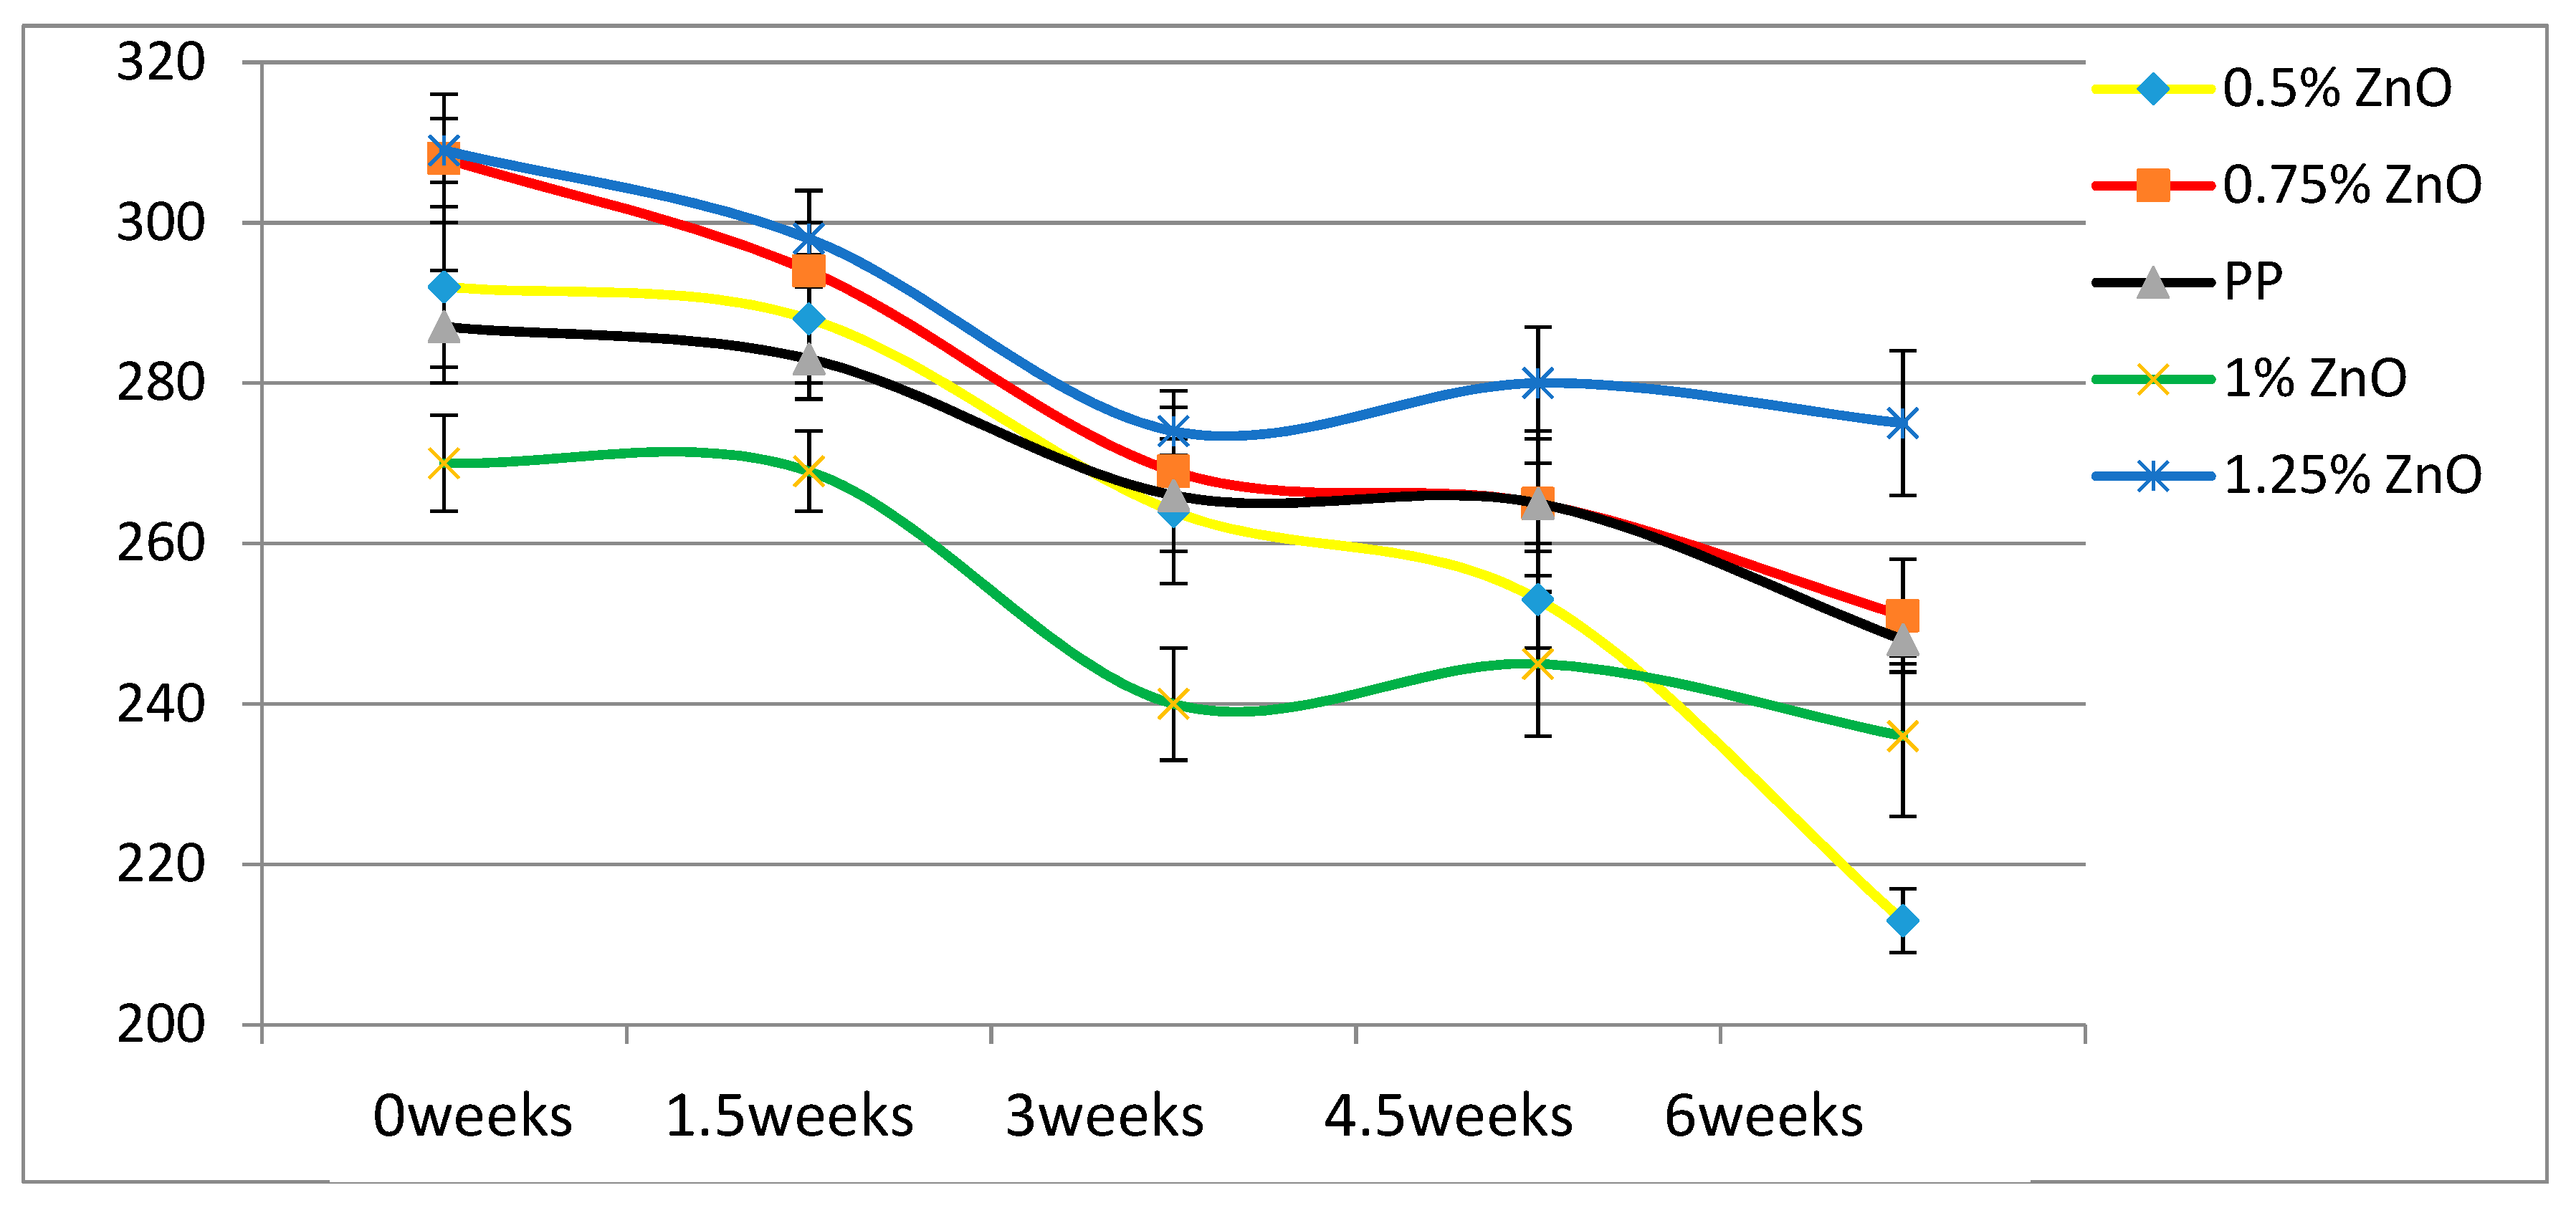
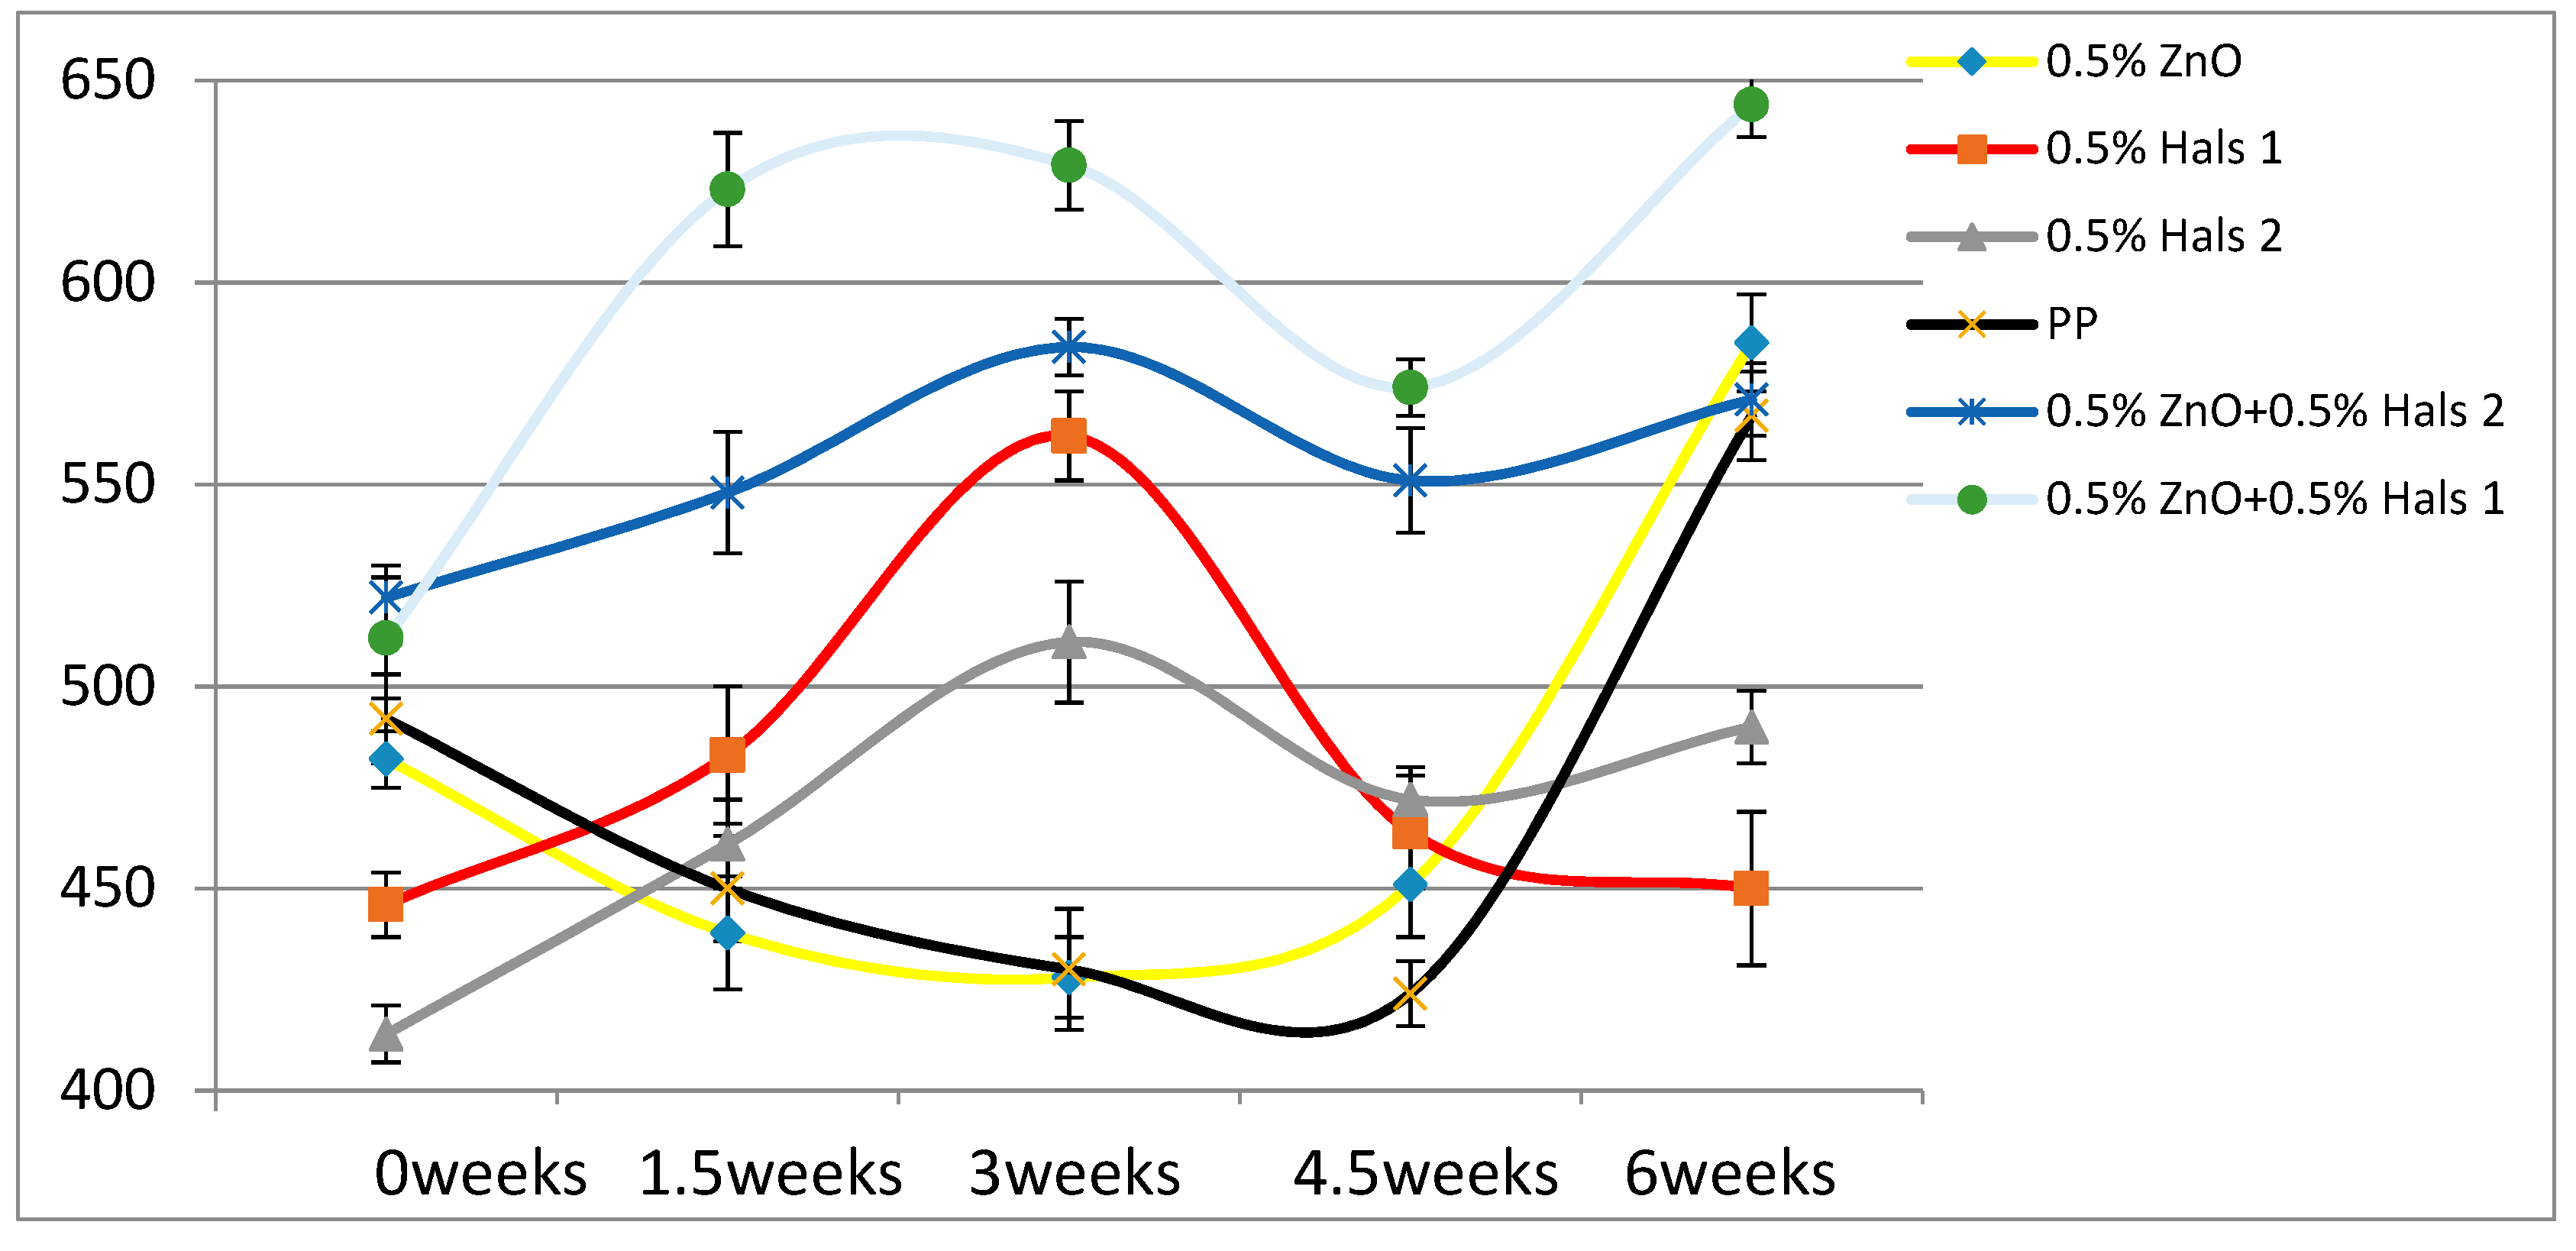
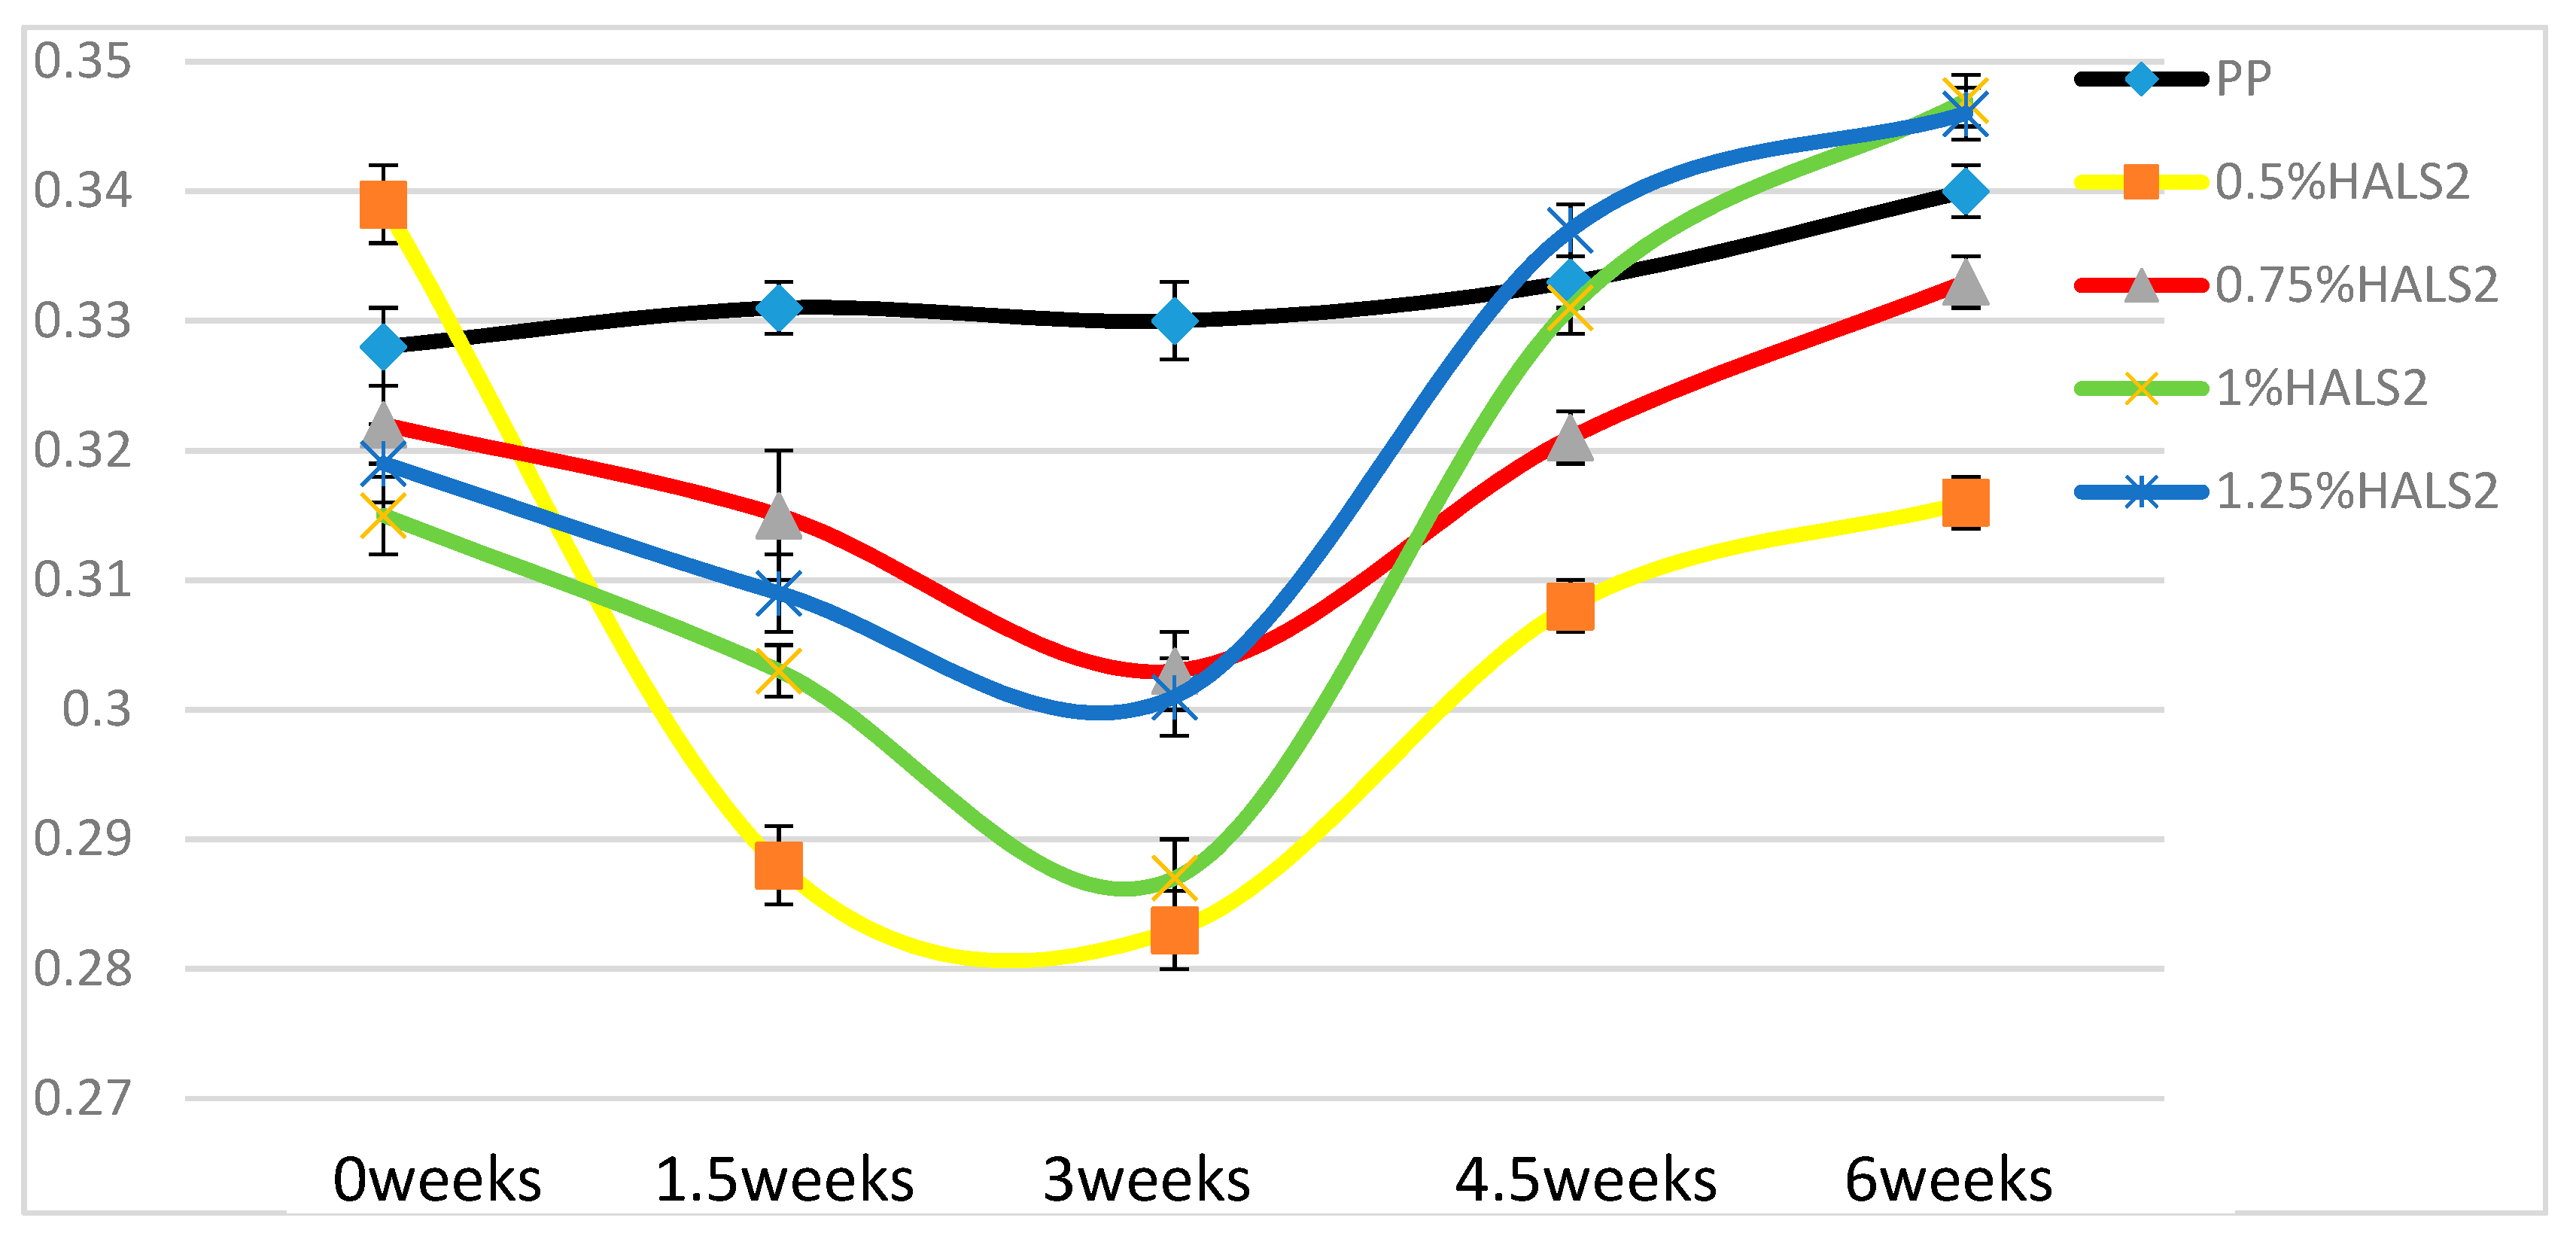
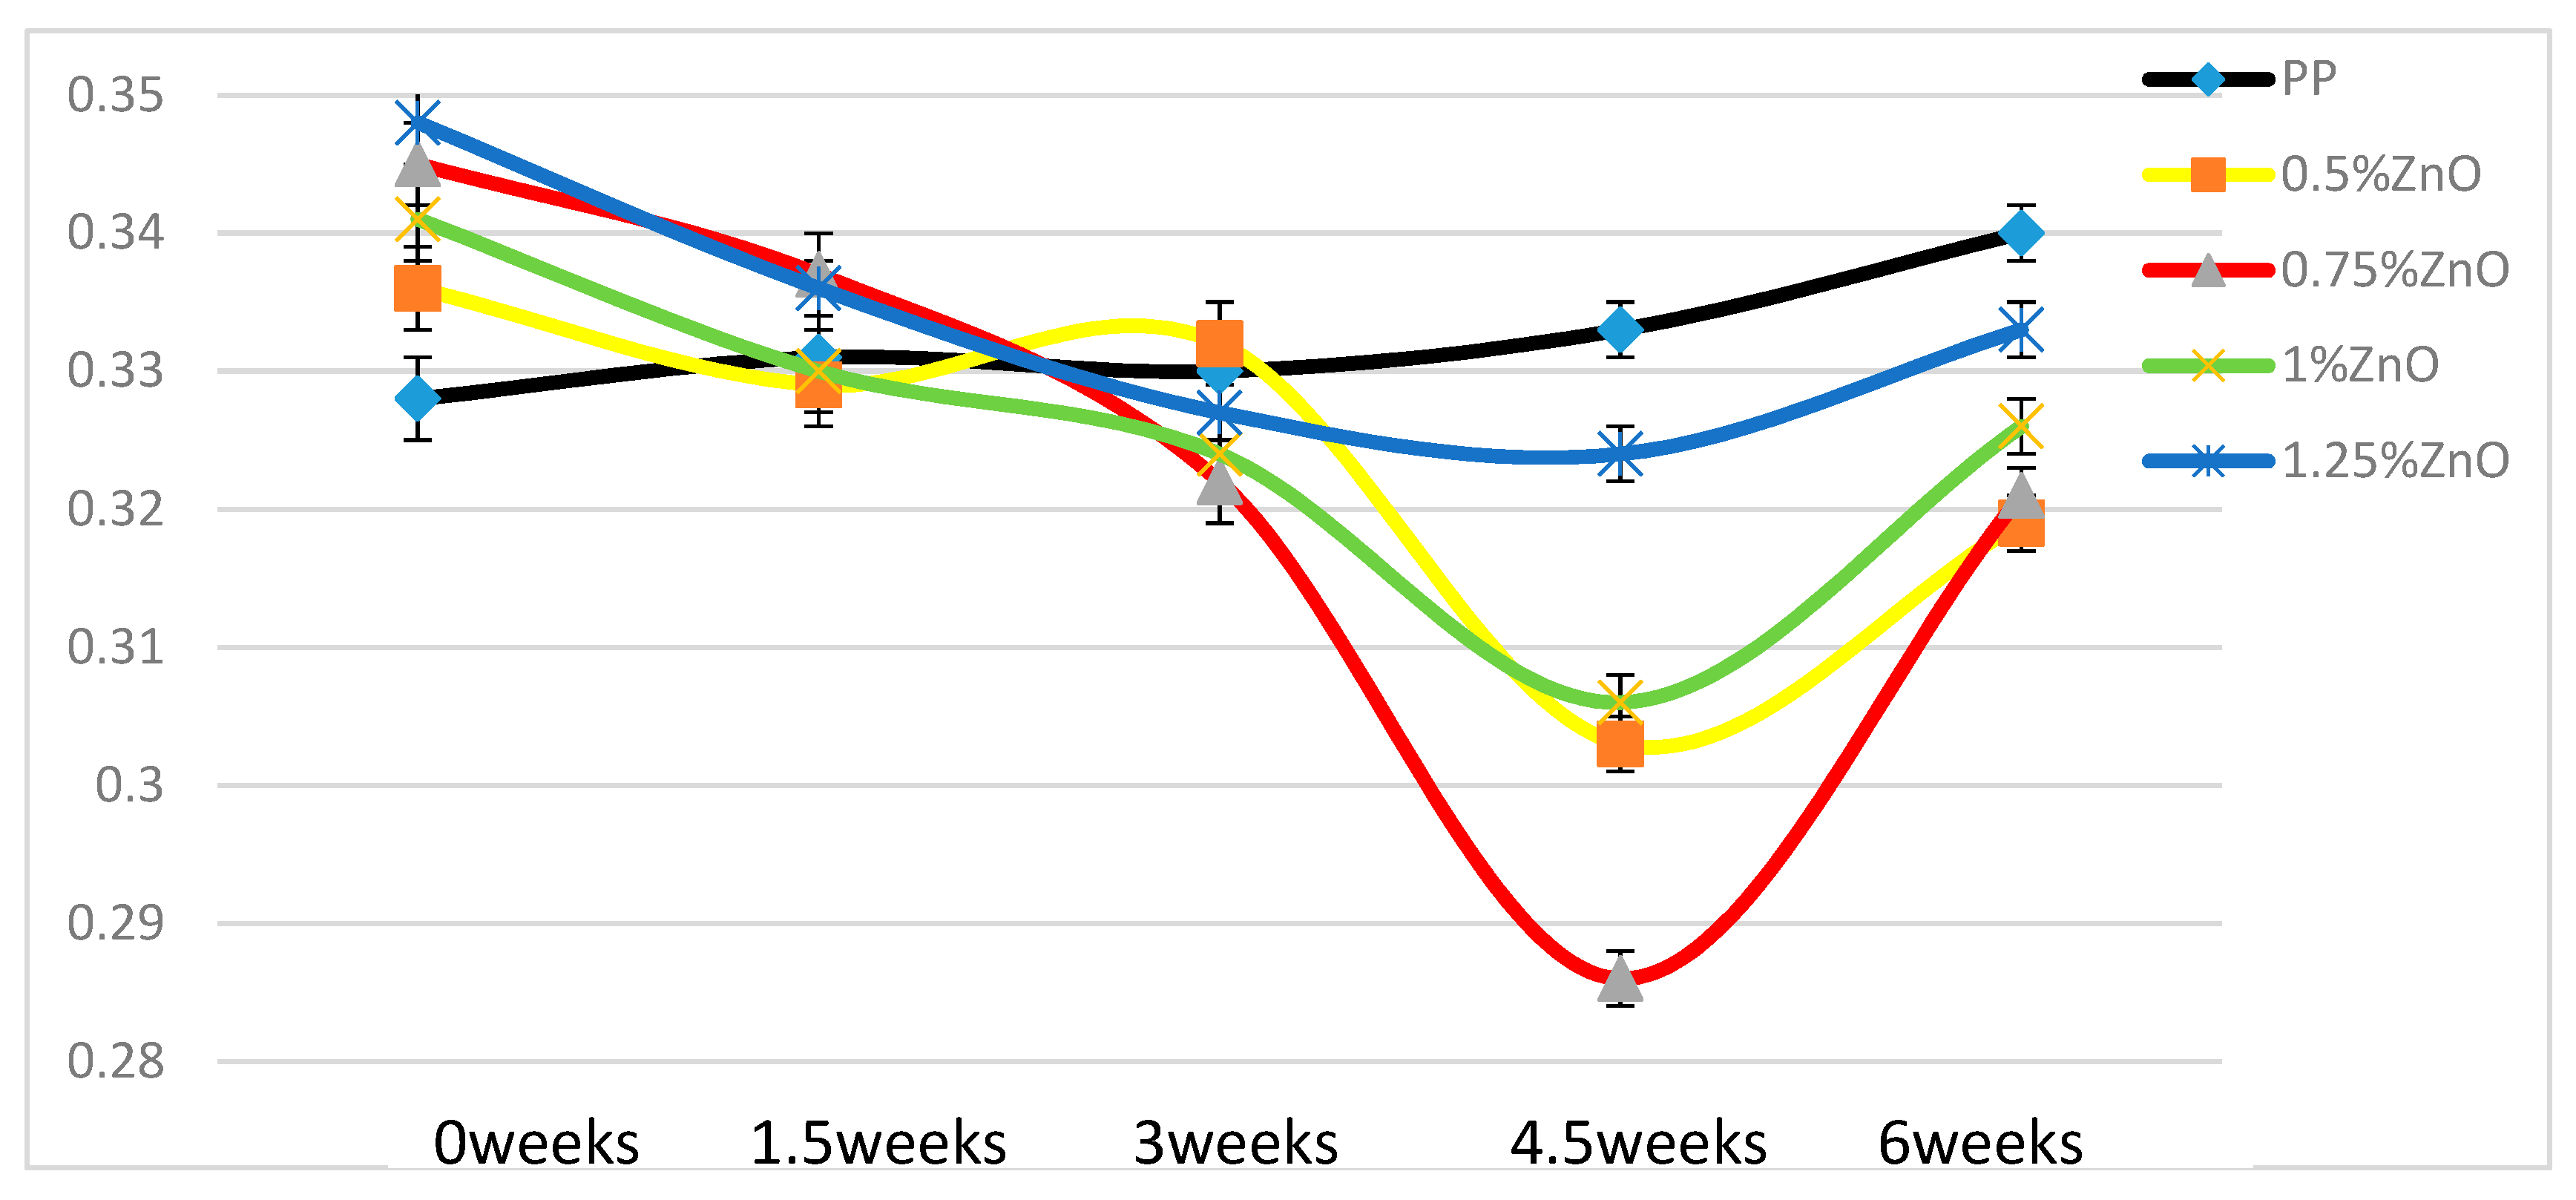
3.4. Dynamic Friction Results
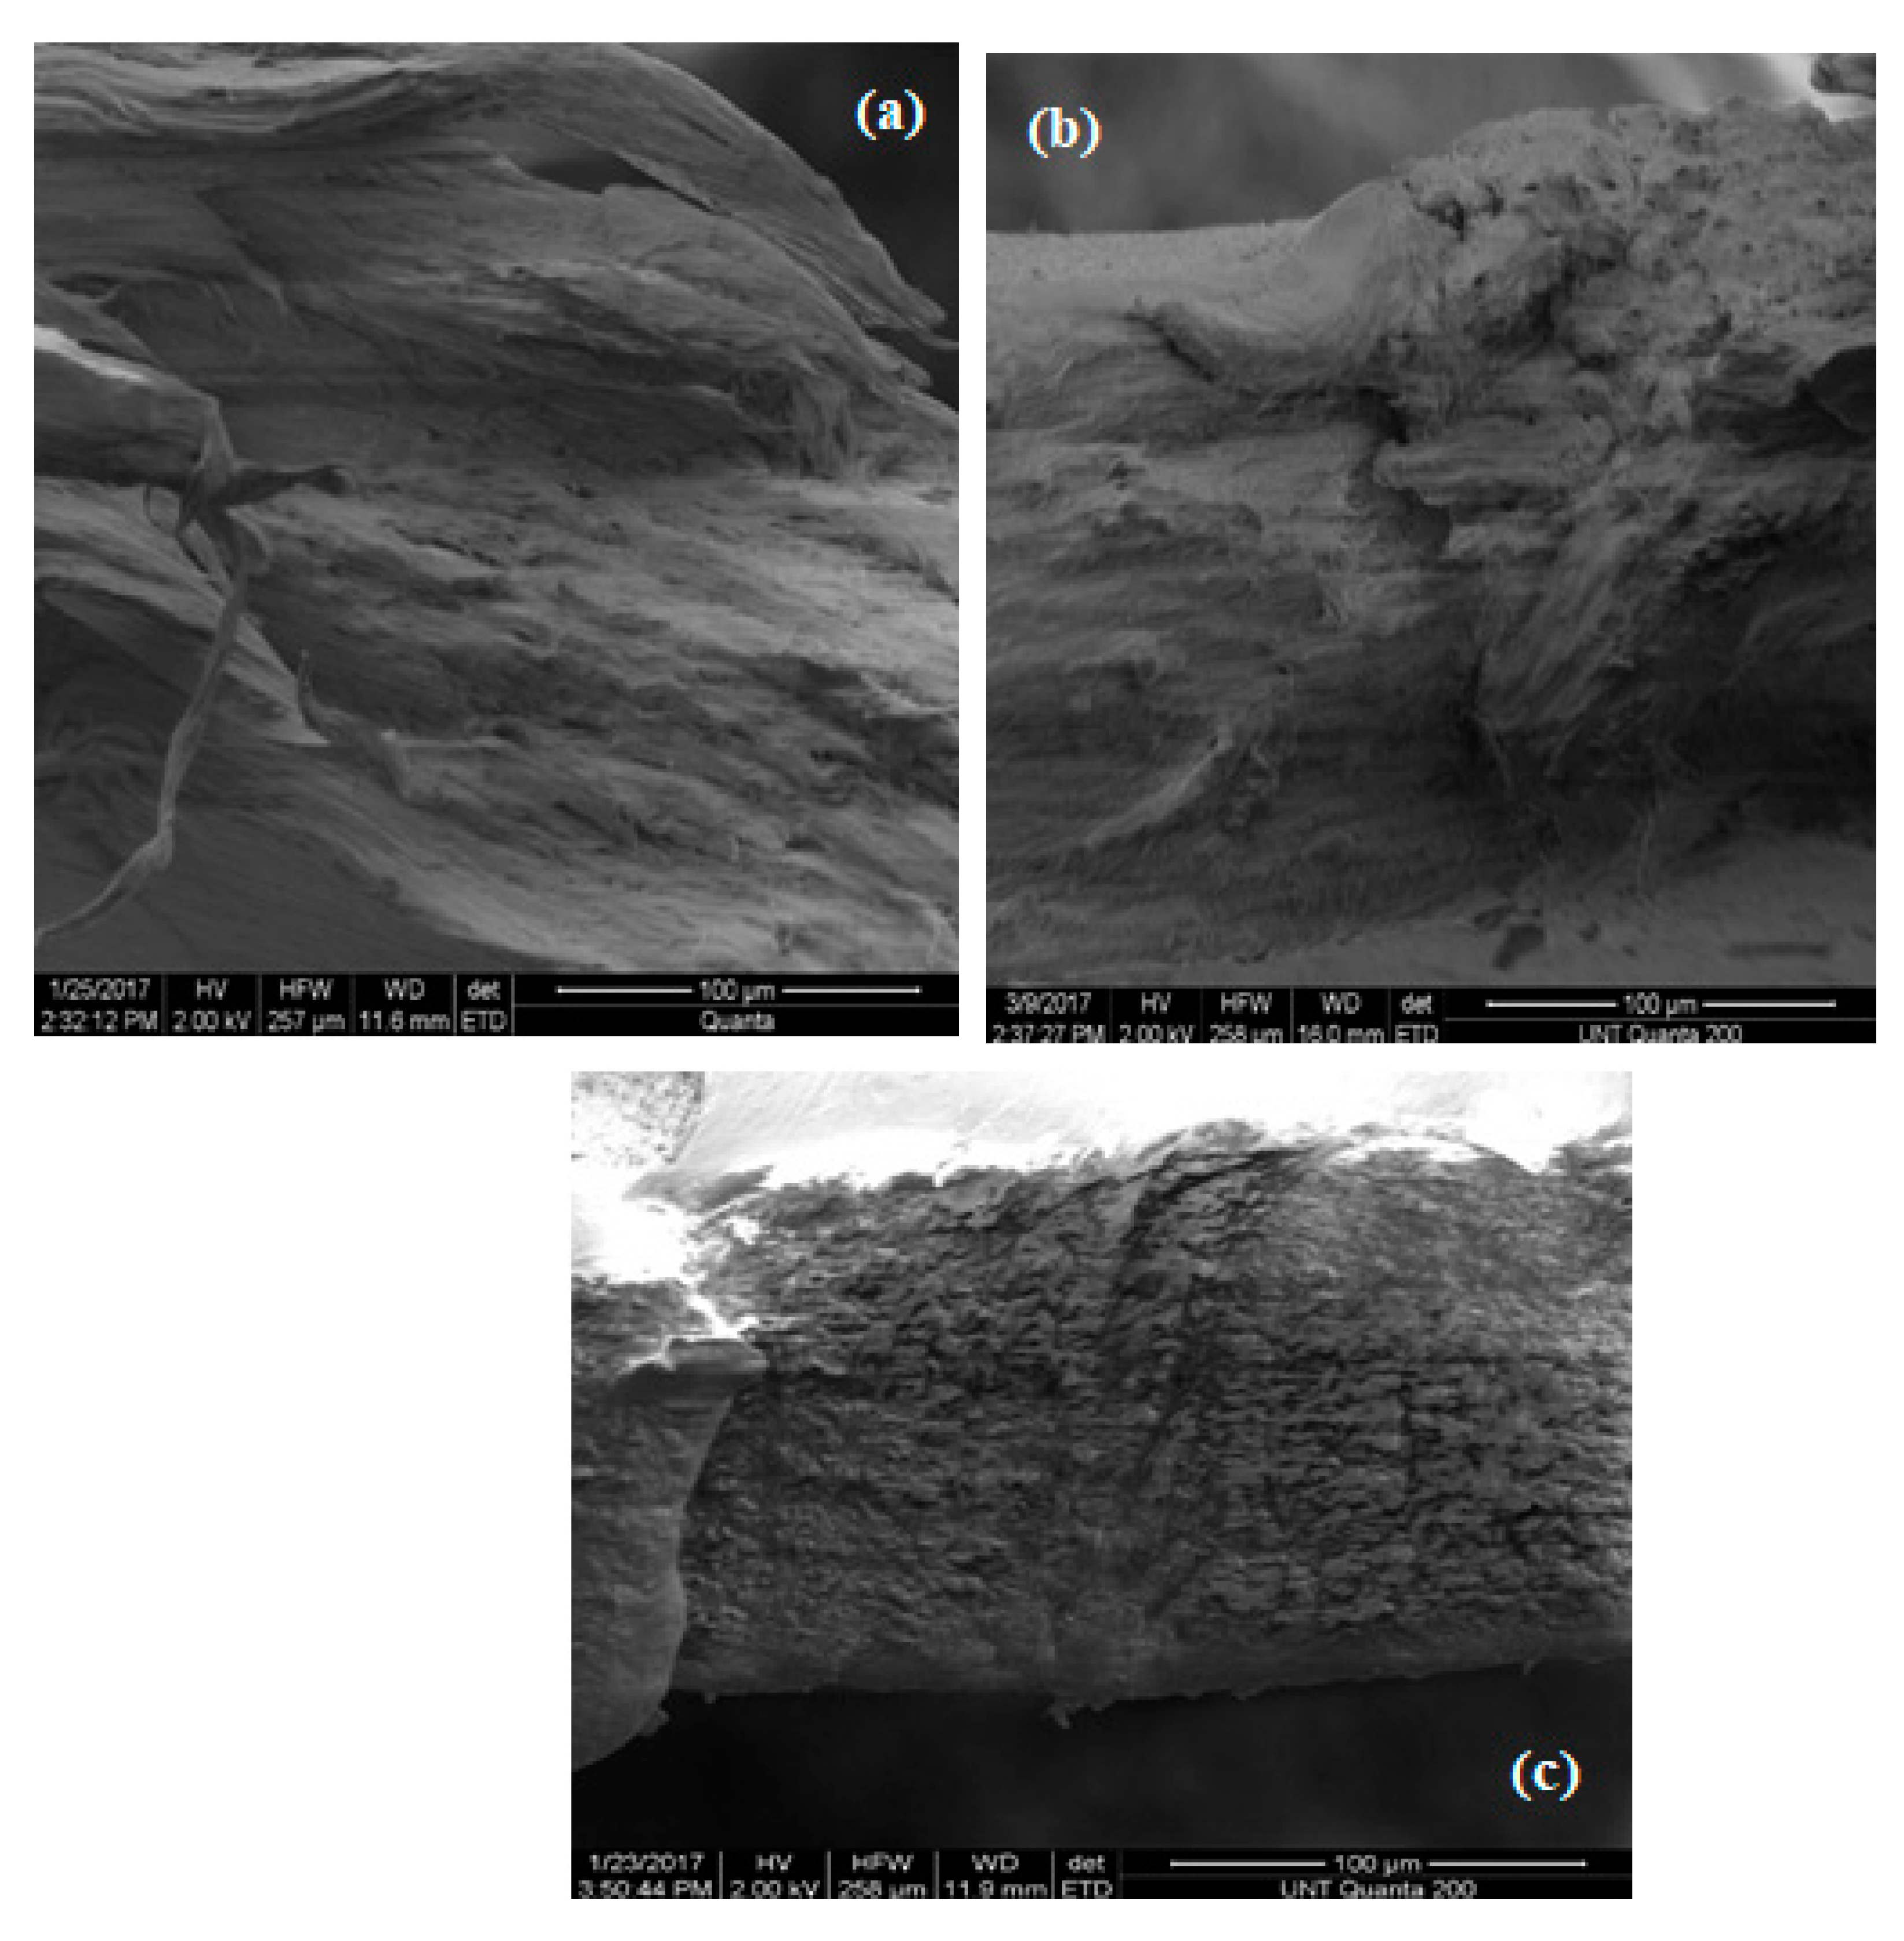
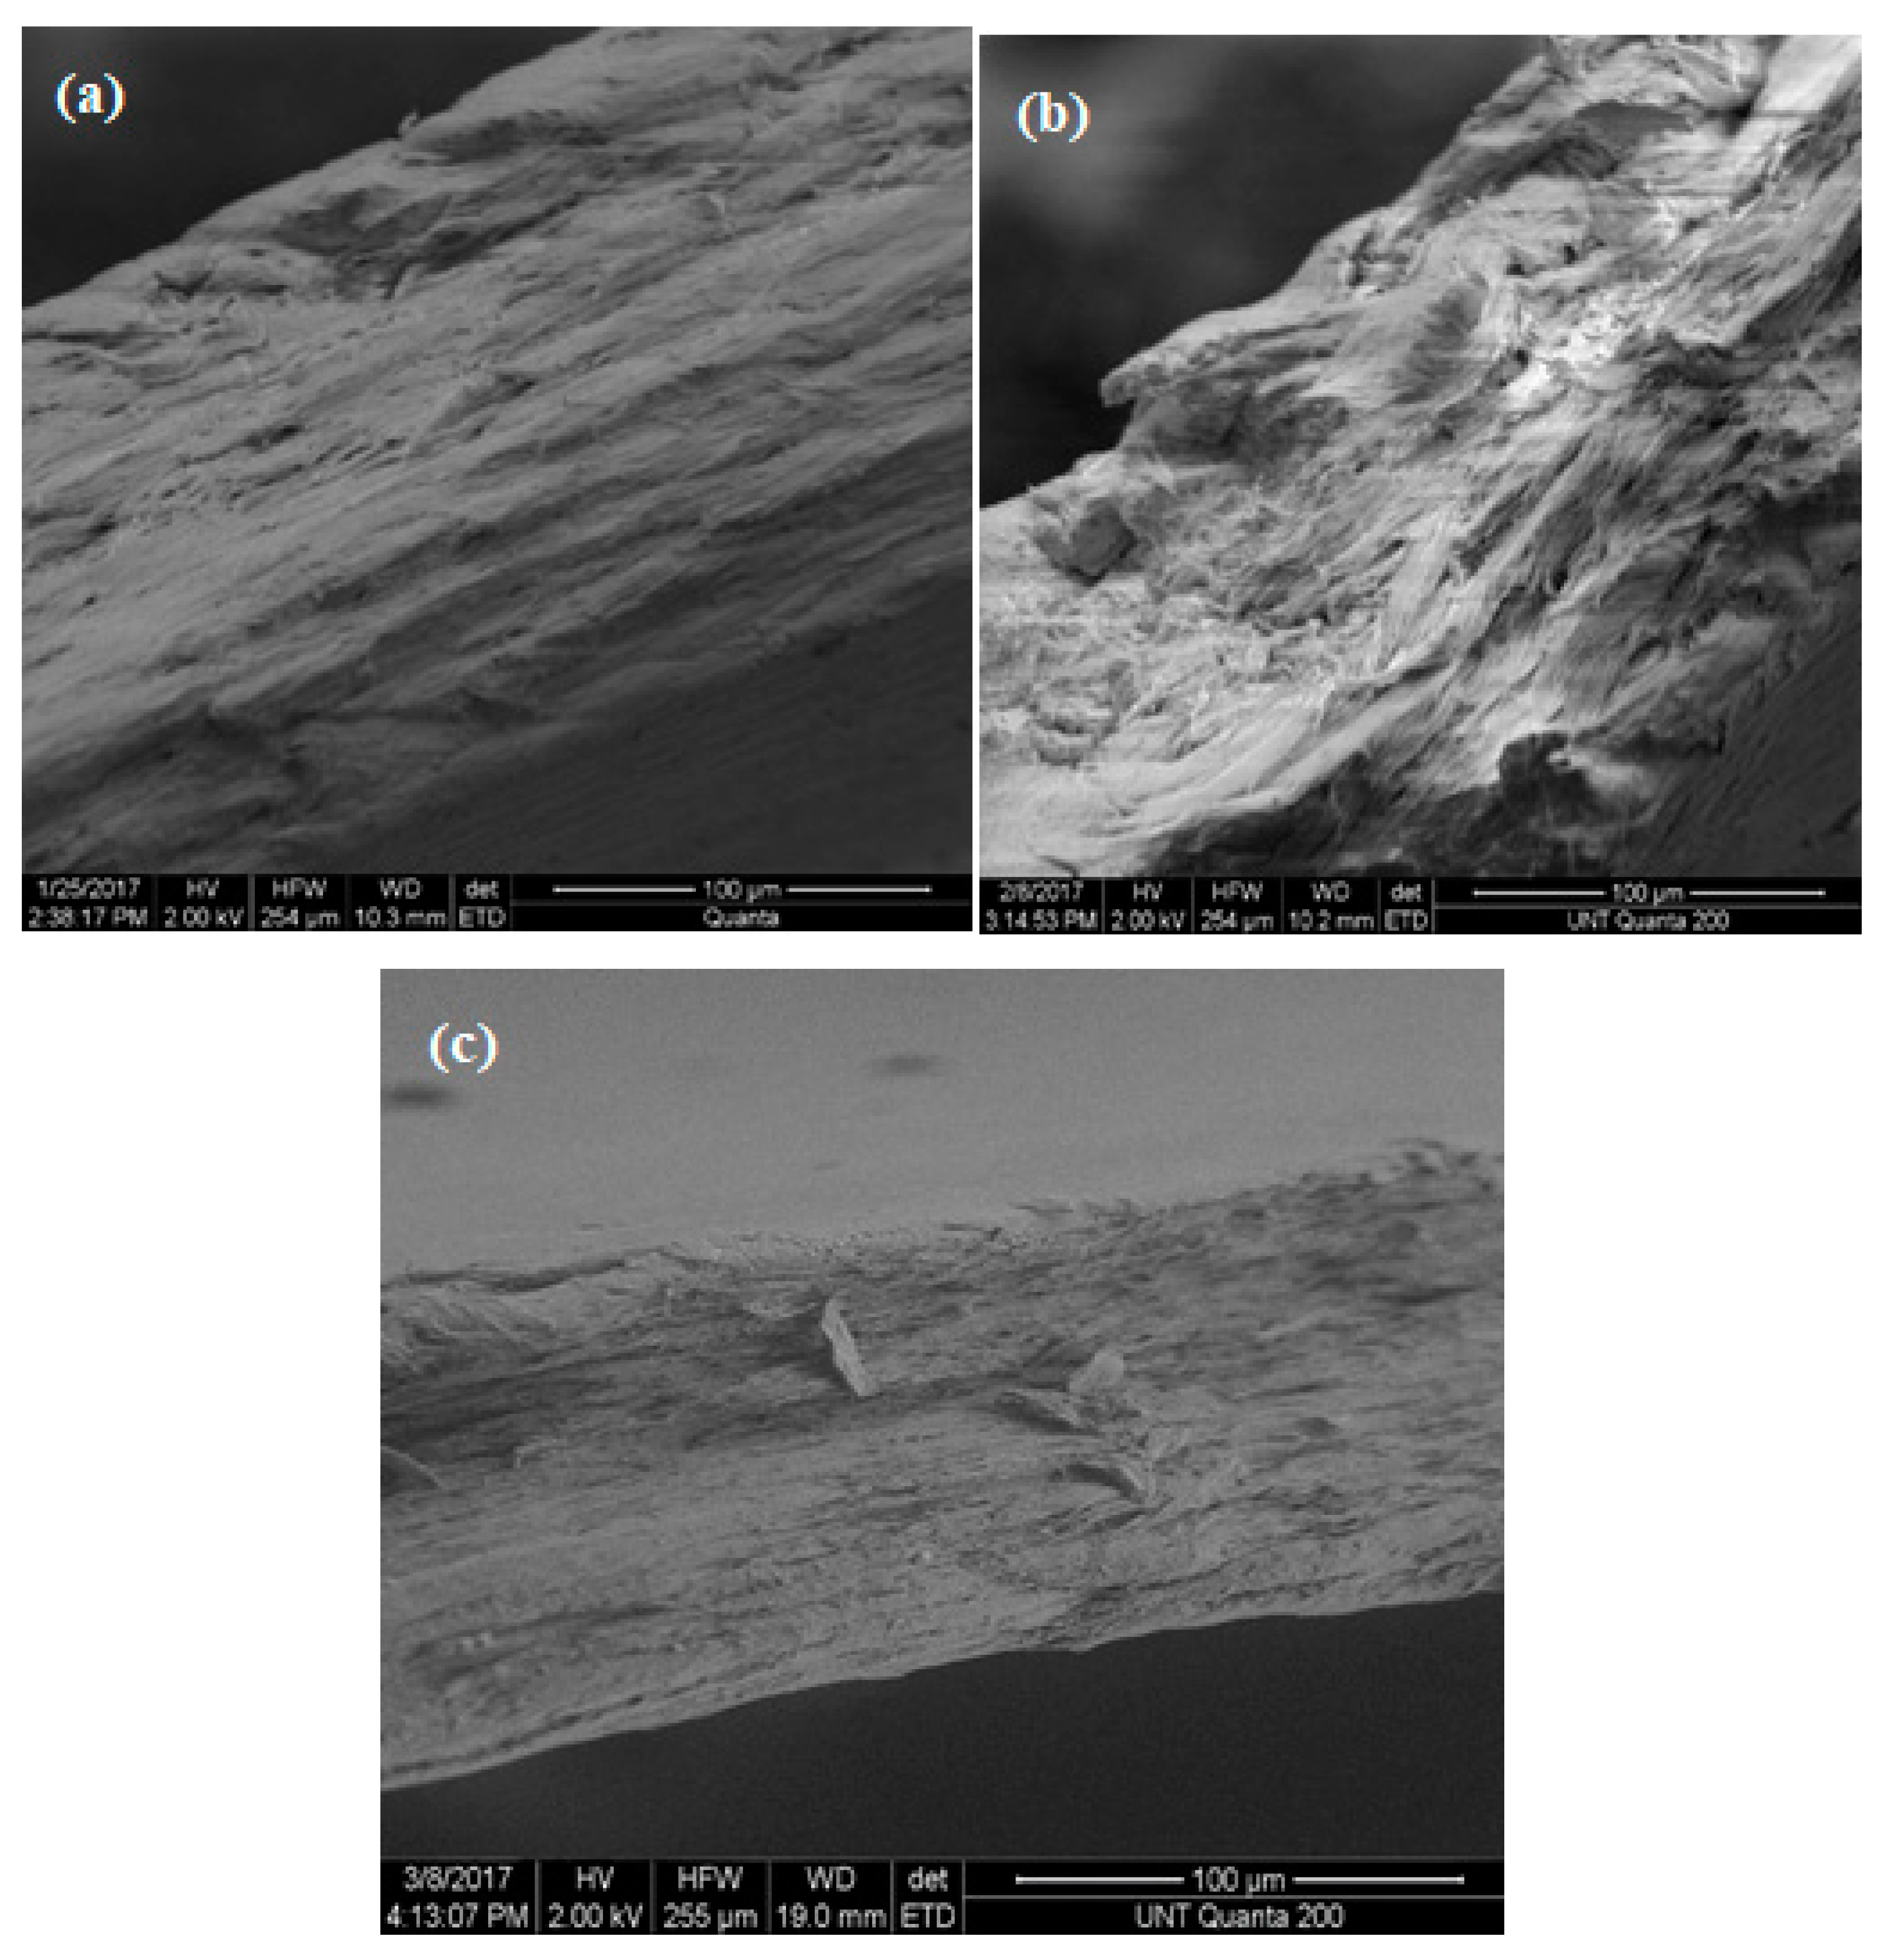
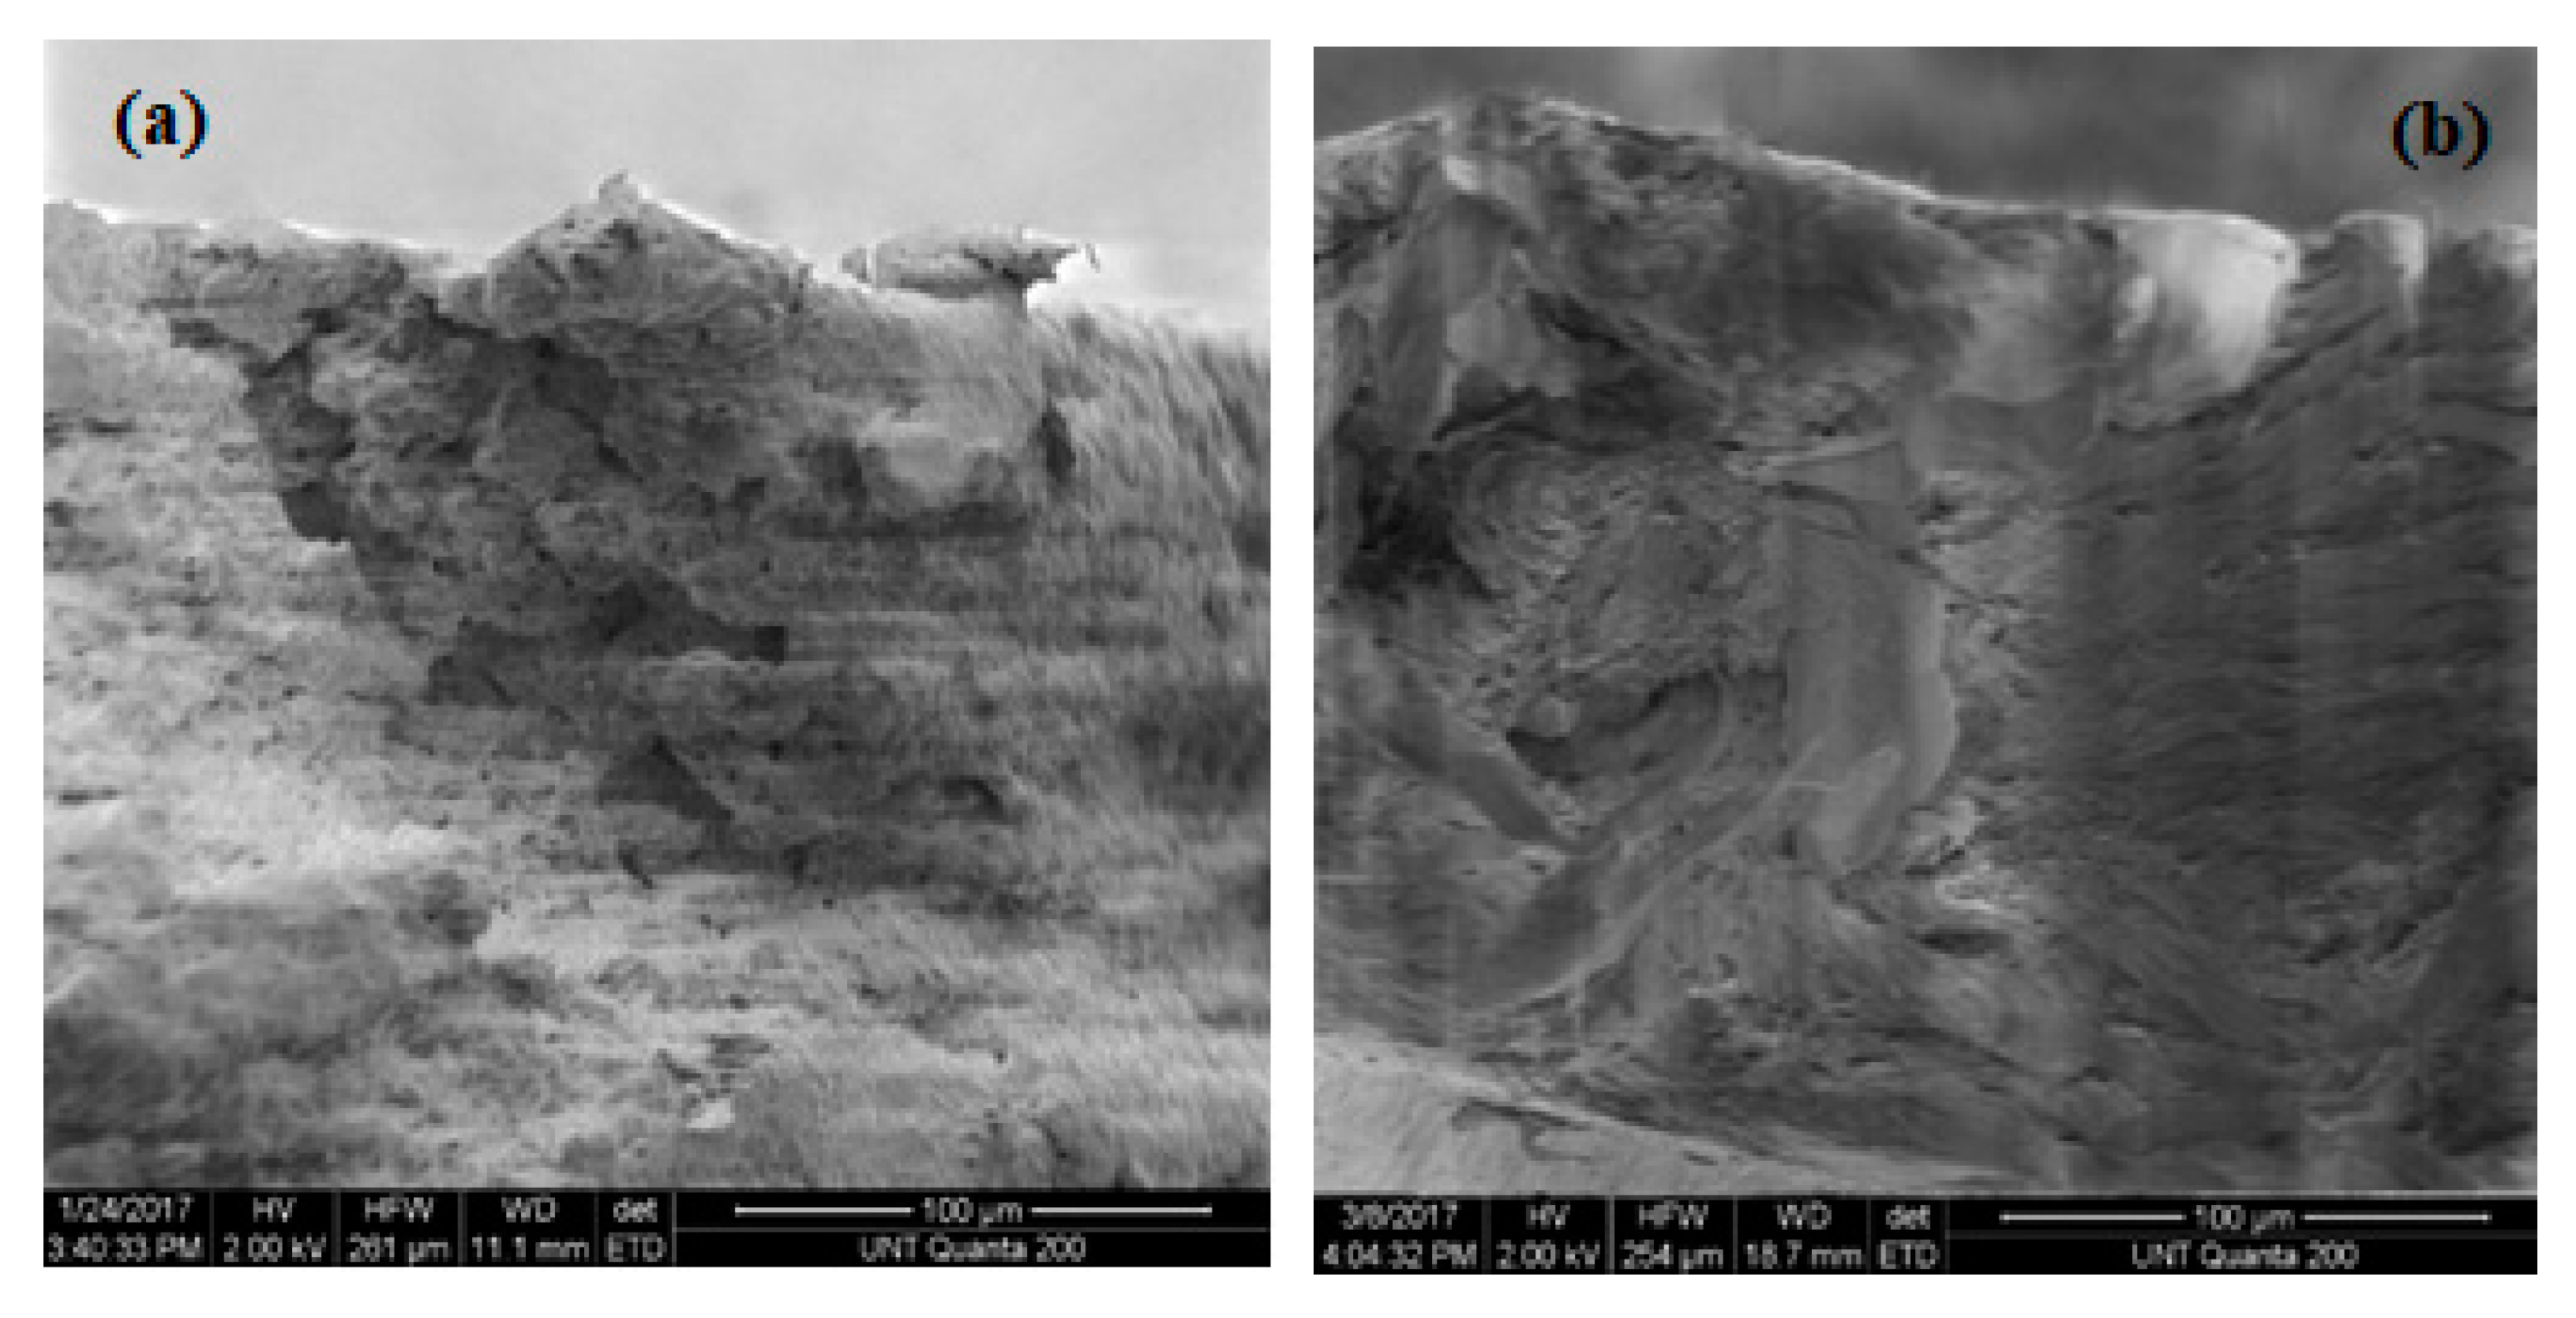
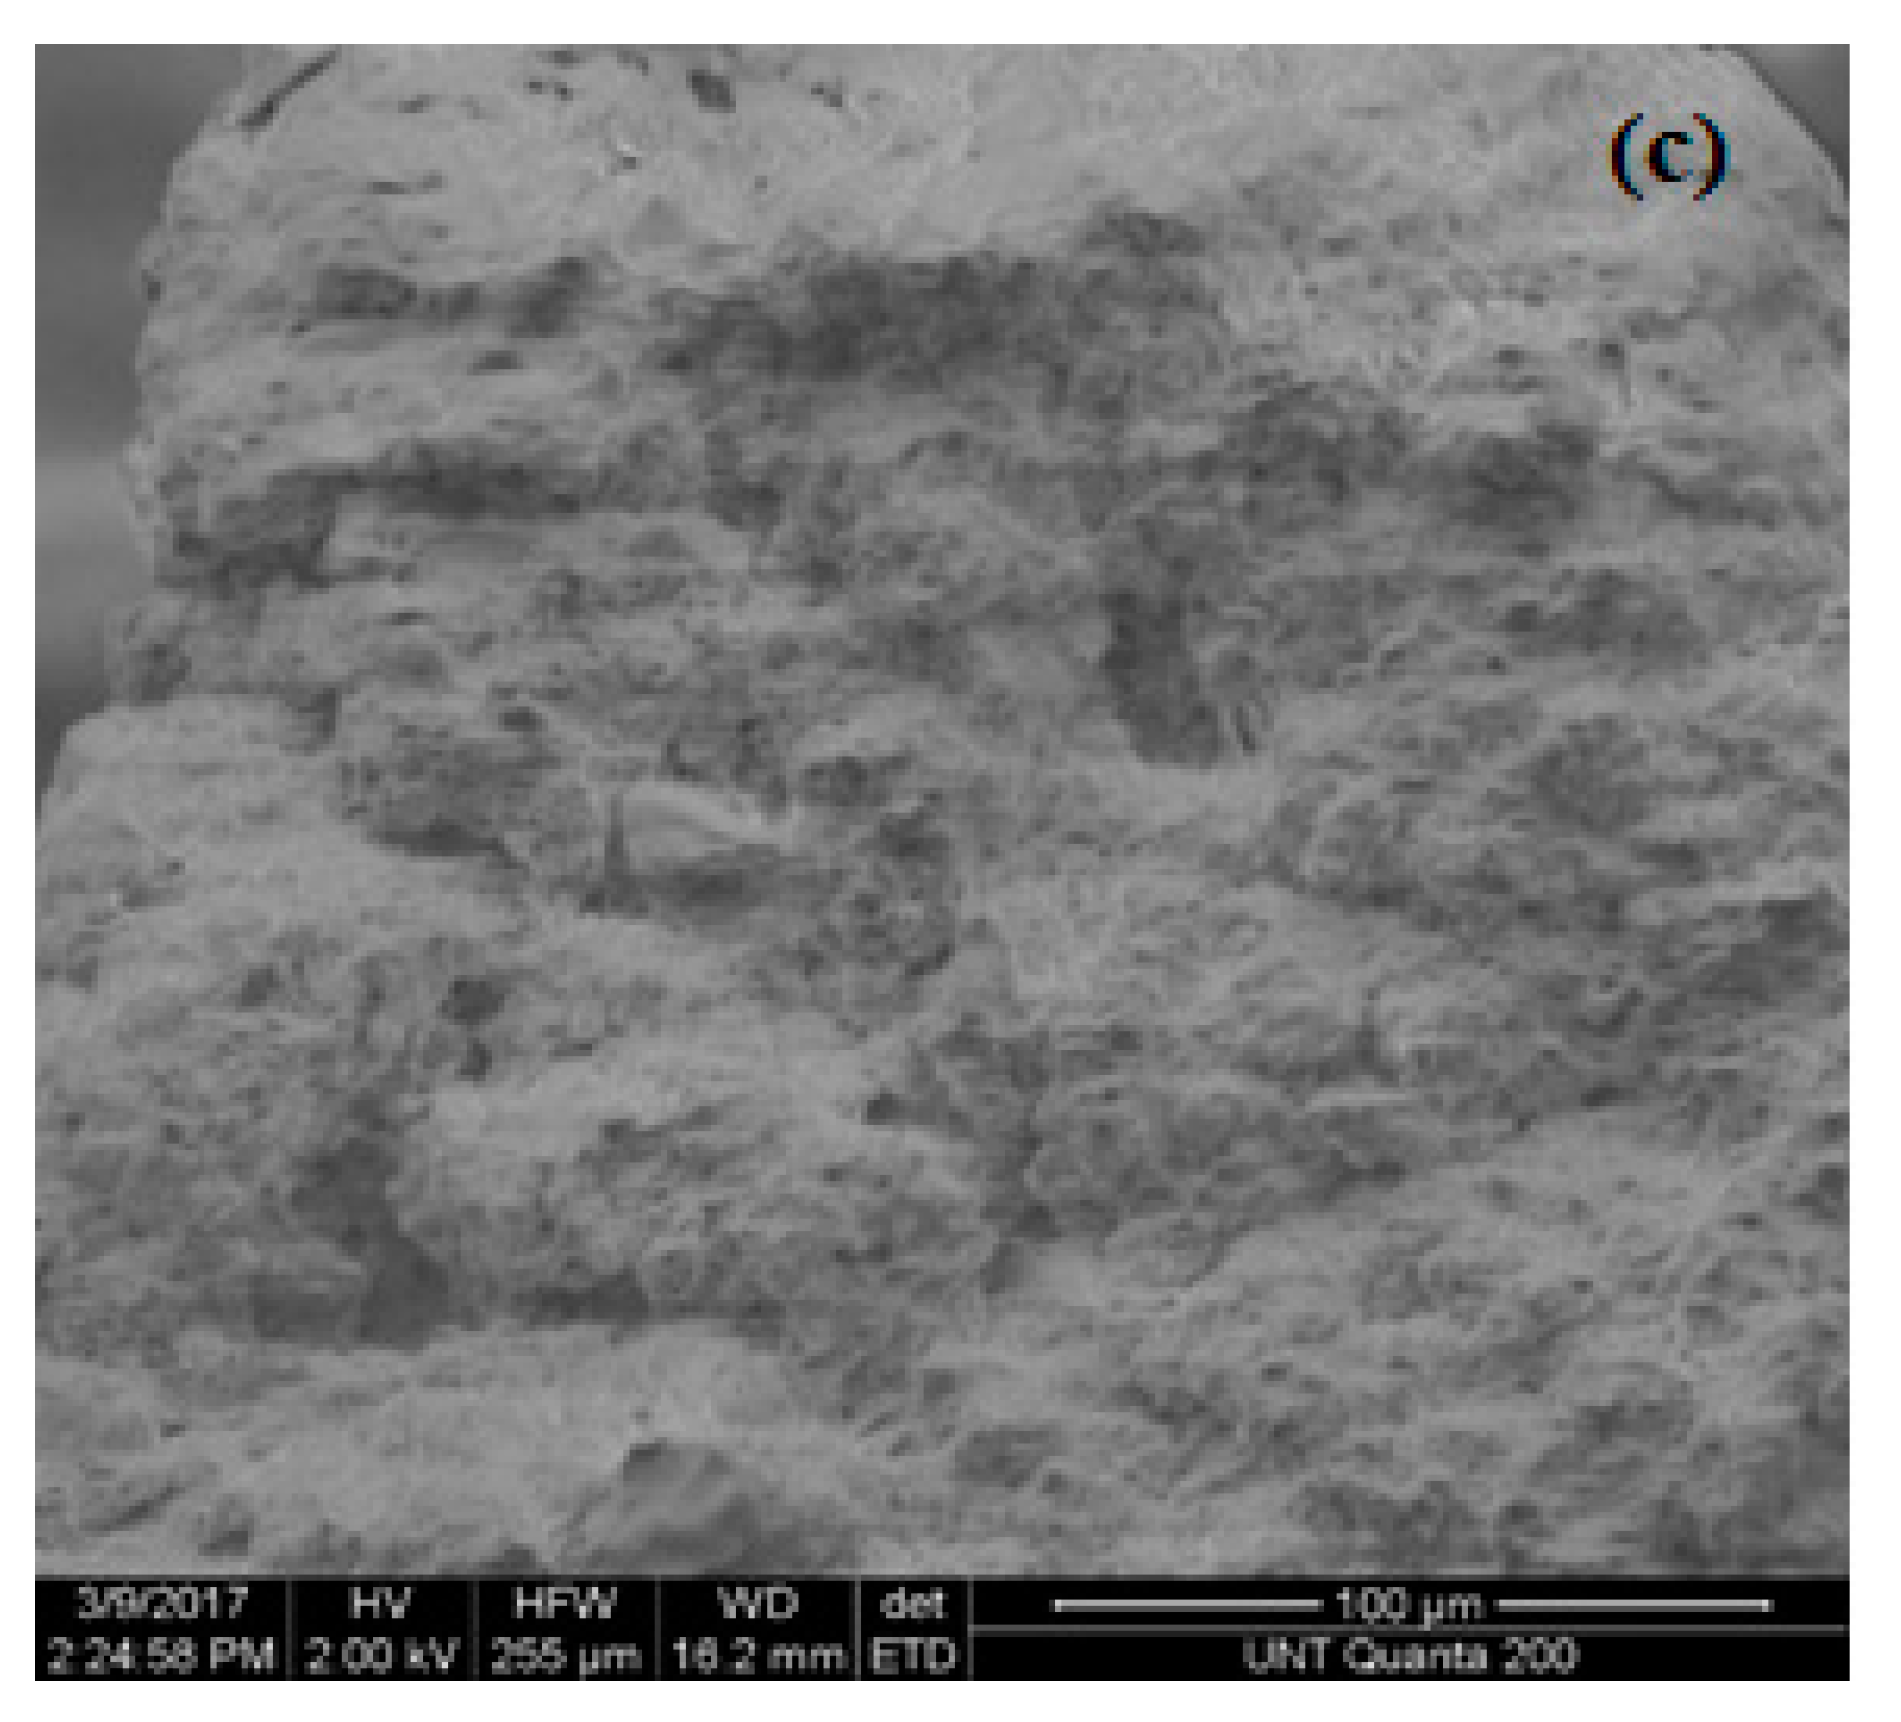
3.5. SEM Results
4. Concluding Remarks
Author Contributions
Funding
Acknowledgments
Conflicts of Interest
References
- Alariqi, A.S.; Kumar, A.P.; Rao, B.S.M.; Singh, R.P. Stabilization of γ-sterilized biomedical polyolefins by synergistic mixtures of oligomeric stabilizers. Part II. Polypropylene matrix. Polym. Degrad. Stab. 2007, 92, 299–309. [Google Scholar] [CrossRef]
- Schaller, C.; Rogez, D.; Braig, A. Hindered amine light stabilizers in pigmented coatings. J. Coat. Technol. Res. 2009, 6, 81–88. [Google Scholar] [CrossRef]
- Yang, Y.C.; Cheng, J.; Cheng, C.M.; He, J.; Guo, B.H.; Zhao, Y.F. Design, synthesis and anti-oxidative evaluation of novel anti-oxidant molecules in polyolefin. Chem. J. Chin. Univ. 2011, 32, 286–291. [Google Scholar]
- Chen, W.; An, P.; Chen, Y.X.; Li, Y.; Yan, X.L.; Chen, L.G. Synthesis and light-stabilizing ability of a series of hindered piperidine derivatives. Synth. Commun. 2012, 42, 1419–1425. [Google Scholar] [CrossRef]
- Hussain, I.; Redhwi, H.H. Development of polypropylene-based ultraviolet-stabilized formulations for harsh environments. J. Mater. Eng. Perform. 2002, 11, 317–321. [Google Scholar] [CrossRef]
- Hollingbery, L.A.; Hull, R. The Fire Retardant Behaviour of Huntite and Hydromagnesite—A Review. Polym. Degrad. Stab. 2010, 95, 2213–2225. [Google Scholar] [CrossRef]
- Sigma Aldrich. Available online: https://www.sigmaaldrich.com/catalog/product/aldrich/535834?lang=en®ion=US (accessed on 22 March 2020).
- Trones, R.; Andersen, T.; Greibrokk, T.; Hegna, D.R. Hindered amine stabilizers investigated by the use of packed capillary temperature-programmed liquid chromatography: I. Poly((6-((1,1,3,3-tetramethylbutyl)-amino)-1,3,5-triazine-2,4-diyl)(2,2,6,6- tetramethyl-4-piperidyl)imino)-1,6-hexanediyl((2,2,6,6-tetramethyl-4-piperidyl)imino)). J. Chromatogr. A 2000, 874, 65–71. [Google Scholar]
- Malik, J.; Tuan, D.Q.; Sprik, E. Lifetime prediction for HALS-stabilized LDPE and PP. Polym. Degrad. Stab. 1995, 47, 1–8. [Google Scholar] [CrossRef]
- Step, N.E.; Turro, N.J.; Gande, M.E.; Klemchuk, P.P. Flash photolysis and time-resolved electron spin resonance studies of triplet benzophenone quenching by hindered amine light stabilizers (HALS). A comparison of HALS amines and aminoethers as electron and hydrogen atom donors. J. Photochem. Photobiol. A 1993, 74, 203–210. [Google Scholar] [CrossRef]
- Schaller, C. Synergy in the sunlight. Eur. Coatings J. 2010, 1, 1–11. [Google Scholar]
- Hernandez, B.A.; Gonzalez, R.; Viesca, J.L.; Fernandez, J.E.; Diaz Fernandez, J.M.; MacHado, A.; Chou, R.; Riba, J. CuO, ZrO2 and ZnO nanoparticles as antiwear additive in oil lubricants. Citeulike 2008, 265, 422–428. [Google Scholar] [CrossRef]
- Özgür, Ü.; Alivov, Y.A.I.; Liu, C.; Teke, A.; Reshchikov, M.A.; Doğan, S.; Avrutin, V.; Cho, S.-J.; Morkoç, H. A comprehensive review of ZnO materials and devices. J. Appl. Phys. 2005, 98, 041301. [Google Scholar] [CrossRef]
- Smijs, T.G.; Pavel, S. Titanium Dioxide and Zinc Oxide Nanoparticles in Sunscreens: Focus on Their Safety and Effectiveness. Nanotechnol. Sci. Appl. 2011, 4, 95–112. [Google Scholar] [CrossRef] [PubMed]
- Hollingbery, L.A.; Hull, T.R. The Fire Retardant Effects of Huntite in Natural Mixtures with Hydromagnesite. Polym. Degrad. Stab. 2012, 97, 504–512. [Google Scholar] [CrossRef]
- Wright, H.B. Comparison and validation of UV dose calculations for low- and medium- pressure mercury arc lamps. Water Environ. Res. 2000, 72, 439. [Google Scholar] [CrossRef]
- Brostow, W.; Hagg Lobland, H.E. Materials: Introduction and Applications; John Wiley & Sons: Hoboken, NJ, USA, 2017. [Google Scholar]
- ASTM D882-18: Standard Test Method for Tensile Properties of Thin Plastic Sheeting; ASTM International: West Conshohocken, PA, USA, 2018.
- Brostow, W.; Deborde, J.-L.; Jaklewicz, M.; Olszynski, P. Tribology with emphasis on polymers: Friction, scratch resistance and wear. J. Mater. Educ. 2003, 25, 119–132. [Google Scholar]
- Bermudez, M.D.; Brostow, W.; Carrion-Vilches, F.J.; Sanes, J. Scratch resistance of polycarbonate containing ZnO nanoparticles: Effects of sliding direction. J. Nanosci. Nanotechnol. 2010, 10, 6683. [Google Scholar] [CrossRef]
- Brostow, W.; Hagg Lobland, H.E.; Hnatchuk, N.; Perez, J.M. Improvement of Scratch and Wear Resistance of Polymers by Fillers Including Nanofillers. Nanomaterials 2017, 7, 66. [Google Scholar] [CrossRef]
- Brostow, W.; Hnatchuk, N.; Prazuch, J. Scratch testing of hard ceramics: Manifestation of viscoelasticity. J. Mater. Sci. Res. 2019, 8, 18–22. [Google Scholar] [CrossRef]
- Brostow, W.; Hagg Lobland, H.E.; Narkis, M. Sliding wear, viscoelasticity and brittleness of polymers. J. Mater. Res. 2006, 21, 2422–2428. [Google Scholar] [CrossRef]
- Brostow, W.; Hagg Lobland, H.E.; Hong, H.J.; Lohse, S.; Osmanson, A.T. Flexibility of polymers defined and related to dynamic friction. J. Mater. Sci. Res. 2019, 8, 31–35. [Google Scholar] [CrossRef]
- Brostow, W.; Zhang, D. Tensile Elongation at Break for Polymers Related to Vickers Hardness. Tribol. Int. 2020. submitted for publication. [Google Scholar]
- La Mantia, F.P.; Morreale, M.; Botta, L.; Mistretta, M.C.; Ceraulo, M.; Scaffaro, R. Degradation of polymer blends: A brief review. Polym. Degrad. Stab. 2017, 145, 79–92. [Google Scholar] [CrossRef]
- Desai, R.C.; Kapral, R. Dynamics of Self-Organized and Self-Assembled Structures; Cambridge University Press: Cambridge, UK, 2009. [Google Scholar]
- Andreotti, S.; Franzoni, E.; Degli Esposti, M.; Fabbri, P. Poly(hydroxyalkanoate)s- based hydrophobic coatings for the protection of stone in cultural heritage. Materials 2018, 11, 511. [Google Scholar] [CrossRef] [PubMed]
- Gorejova, R.; Orinakova, R.; Orsagova Kralova, Z.; Baláž, M.; Kupková, M.; Hrubovčáková, M.; Haverová, L.; Džupon, M.; Oriňak, A.; Kaľavský, F.; et al. In vitro corrosion behavior of biodegradable iron foams with polymeric coating. Materials 2020, 13, 184. [Google Scholar] [CrossRef]


| Samples | |||||||
| Components | Control | Ⅰ | Ⅱ | Ⅲ | Ⅳ | Ⅴ | Ⅵ |
| PP | 40 phr | 40 phr | 40 phr | 40 phr | 40 phr | 40 phr | 40 phr |
| HALS1 | N/A | 0.50% | N/A | N/A | 0.75% | N/A | N/A |
| HALS2 | N/A | N/A | 0.50% | N/A | N/A | 0.75% | N/A |
| Nano-ZnO | N/A | N/A | N/A | 0.50% | N/A | N/A | 0.75% |
| Samples | |||||||
| Components | Control | Ⅶ | Ⅷ | Ⅸ | Ⅹ | Ⅺ | Ⅻ |
| PP | 40 phr | 40 phr | 40 phr | 40 phr | 40 phr | 40 phr | 40 phr |
| HALS1 | N/A | 1% | N/A | N/A | 1.25 | N/A | N/A |
| HALS2 | N/A | N/A | 1% | N/A | N/A | 1.25 | N/A |
| Nano-ZnO | N/A | N/A | N/A | 1% | N/A | N/A | 1.25 |
| Components | 0.5 wt.% HALS1 | 0.75 wt.% HALS1 | 1 wt.% HALS1 | 1.25 wt. % HALS1 |
| Thickness (mm) | 0.5 ± 0.01 | 0.4 ± 0.03 | 0.4 ± 0.05 | 0.5 ± 0.02 |
| Components | 0.5wt.%HALS2 | 0.75 wt.% HALS2 | 1 wt.%HALS2 | 1.25 wt.% HALS2 |
| Thickness (mm) | 0.5 ± 0.03 | 0.5 ± 0.04 | 0.5 ± 0.05 | 0.5 ± 0.01 |
| Components | 0.5 wt.% ZnO | 0.75 wt.% ZnO | 1 wt.% ZnO | 1.25 wt.% ZnO |
| Thickness (mm) | 0.5 ± 0.03 | 0.5 ± 0.01 | 0.4 ± 0.03 | 0.4 ± 0.02 |
| UV Transmittance | ||||
|---|---|---|---|---|
| PP | ZnO | HALS1 | HALS2 | |
| Pure | 49% | 0.10% | 91% | 83% |
| 0.50% | 28% | 49% | 49% | |
| 0.75% | 19% | 49% | 49% | |
| 1% | 14% | 50% | 50% | |
| 1.25% | 11% | 50% | 50% | |
| Concentration | Mechanical Properties | HALS1 | HALS2 | nano-ZnO |
|---|---|---|---|---|
| 0.5 wt.% | Young's modulus (MPa) | 374 ± 31 | 364 ± 64 | 429 ± 65 |
| Elongation at break(mm) | 288 ± 47 | 290 ± 36 | 279 ± 13 | |
| Tensile toughness (N·m) | 9 ± 1 | 13 ± 2 | 10 ± 3 | |
| 0.75 wt.% | Young's modulus (MPa) | 379 ± 20 | 317 ± 57 | 414 ± 39 |
| Elongation at break(mm) | 295 ± 50 | 310 ± 64 | 289 ± 32 | |
| Tensile toughness (N·m) | 11 ± 2 | 14 ± 3 | 11 ± 2 | |
| 1 wt.% | Young's modulus (MPa) | 382 ± 54 | 419 ± 23 | 402 ± 44 |
| Elongation at break(mm) | 321 ± 31 | 312 ± 28 | 270 ± 38 | |
| Tensile toughness (N·m) | 13 ± 1 | 12 ± 2 | 12 ± 2 | |
| 1.25 wt.% | Young's modulus (MPa) | 404 ± 82 | 444 ± 30 | 466 ± 70 |
| Elongation at break(mm) | 286 ± 31 | 276 ± 18 | 299 ± 50 | |
| Tensile toughness (N·m) | 12 ± 2 | 14 ± 1 | 12 ± 3 |
© 2020 by the authors. Licensee MDPI, Basel, Switzerland. This article is an open access article distributed under the terms and conditions of the Creative Commons Attribution (CC BY) license (http://creativecommons.org/licenses/by/4.0/).
Share and Cite
Brostow, W.; Lu, X.; Gencel, O.; Osmanson, A.T. Effects of UV Stabilizers on Polypropylene Outdoors. Materials 2020, 13, 1626. https://doi.org/10.3390/ma13071626
Brostow W, Lu X, Gencel O, Osmanson AT. Effects of UV Stabilizers on Polypropylene Outdoors. Materials. 2020; 13(7):1626. https://doi.org/10.3390/ma13071626
Chicago/Turabian StyleBrostow, Witold, Xinyao Lu, Osman Gencel, and Allison T. Osmanson. 2020. "Effects of UV Stabilizers on Polypropylene Outdoors" Materials 13, no. 7: 1626. https://doi.org/10.3390/ma13071626
APA StyleBrostow, W., Lu, X., Gencel, O., & Osmanson, A. T. (2020). Effects of UV Stabilizers on Polypropylene Outdoors. Materials, 13(7), 1626. https://doi.org/10.3390/ma13071626