Article

Detailed Molecular and Structural Analysis of Dual Emitter IrQ(ppy)2 Complex

1
National Institute of Materials Physics, Atomistilor 405A, 077125 Magurele, Romania
2
Slovenian NMR Center, National Institute of Chemistry, Hajdrihova 19, Ljubljana SI-1000, Slovenia
*
Authors to whom correspondence should be addressed.
Materials 2020, 13(7), 1617; https://doi.org/10.3390/ma13071617
Submission received: 12 February 2020 / Revised: 30 March 2020 / Accepted: 31 March 2020 / Published: 1 April 2020

Abstract

:
The molecular structure of the 8-hydroxyquinoline–bis (2-phenylpyridyl) iridium (IrQ(ppy)2) dual emitter organometallic compound is determined based on detailed 1D and 2D nuclear magnetic resonance (NMR), to identify metal-ligands coordination, isomerization and chemical yield of the desired compound. Meanwhile, the extended X-ray absorption fine structure (EXAFS) was used to determine the interatomic distances around the iridium ion. From the NMR results, this compound IrQ(ppy)2 exhibits a trans isomerization with a distribution of coordinated N-atoms in a similar way to facial Ir(ppy)3. The EXAFS measurements confirm the structural model of the IrQ(ppy)2 compound where the oxygen atoms from the quinoline ligands induce the splitting of the next-nearest neighboring C in the second shell of the Ir3+ ions. The high-performance liquid chromatography (HPLC), as a part of the detailed molecular analysis, confirms the purity of the desired IrQ(ppy)2 organometallic compound as being more than 95%, together with the progress of the chemical reactions towards the final compound. The theoretical model of the IrQ(ppy)2, concerning the expected bond lengths, is compared with the structural model from the EXAFS and XRD measurements.

Graphical Abstract

1. Introduction

The use of organometallic compounds in new technologies such as organic light-emitting diodes (OLED) [1,2,3,4,5,6,7,8], photovoltaic applications [9] or catalysis [10], requires different approaches during the chemical synthesis of these compounds, going from the photoluminescence, electroluminescence and internal quantum efficiency to the charge transport and the amorphous-crystalline interplay between these organometallic molecules [11,12,13,14,15,16,17,18].
Starting with classical monoligand compounds containing quinoline (q) and phenylpyridine (ppy) derivatives, such as Alq3 and Ir(ppy)3, which give single color electroluminescence [1,19], the architecture of these organometallics evolves towards more complex structures. These structures enable multicolor electroluminescence such as in the case of 8-hydroxyquinoline–bis (2-phenylpyridyl) iridium, known as IrQ(ppy)2, with a general formula C31H22IrN3O, or better external quantum efficiency in the OLED structures.
Depending on the desired organometallic compound, the chemical synthesis requires one, two or multiple reaction steps, following the Nogoyama procedure [20,21,22,23,24]. Generally, these syntheses are characterized by incomplete reactions and the formation of by-products. Therefore, the resulting compounds could form different molecular configurations close or far from the targeted structure. For example, in the case of IrQ(ppy)2 the chemical synthesis is done in two steps in which the [(C^N)2Ir-µ-Cl]2 intermediate compound from the first step reaction with phenylpiridine ligands is used in the second step reaction with quinoline ligands. The second step could lead to three different structures like IrQ(ppy)2, IrQ2(ppy) or even IrQ3 with different photophysical properties. The first structure yields dual green-red electroluminescence [25], while the last one gives pure red color in the OLED structures [26]. The red electroluminescent OLED represents a special class due to their low bandgap, which can lead to non-radiative emissions [27,28,29].
High-performance liquid chromatography (HPLC) and nuclear magnetic resonance spectroscopy (NMR) are the best techniques used to investigate the progress of the chemical reactions, the final products and their purity.
Regarding organometallic compounds, NMR spectroscopy measurements allow the identification of parameters related to the metal–ligand coordination, isomerization or even the ratio between ligands. All of these parameters are closely related to each other and describe a way to obtain a pure compound [30,31,32,33]. Furthermore, NMR spectroscopy measurements can determine the chemical yield of these reactions through the assignment of the off-structure peaks [34].
Complementarily, the enhanced X-ray absorption fine structure (EXAFS) measurements allow identification of interatomic distances for a complete view of the molecular structure of the organometallic compounds. The Ir-L3 EXAFS absorptions allow us to accurately determine the metal environment in the Ir(III) organic complexes with efficient phosphorescence emission. Such knowledge enables the validation of the preparation stages of these compounds by comparison with the crystallographic data. The EXAFS measurements were already applied to other organometallic compounds like [IrCp*(OH)2(Me2-NHC)] (final compound from the second step of reaction, prepared from the bis-Cl intermediate compound; Me2-NHC = N-dimethylimidazolin-2-ylidene, Cp* = pentamethy-lcyclopentadienyl), used as a catalyst for water oxidation at the electrode surface [35]. This method allows us to investigate the oxidation processes of the iridium complex, possibly towards IrO3, which is also catalytically active [36], and/or the iridium coordination in different chemical compounds.
This paper proposes a complete investigation by HPLC, NMR, EXAFS and XRD techniques, to identify the chemical structure of IrQ(ppy)2 organometallic compound. It is focused on the molecular structure, resulting from the chemical synthesis, the ratio between phenylpyridine and quinoline ligands, the modality of coordination (C^N), the photochemical isomerization (cis, trans). The bonding between the metal and ligands (Ir-N, Ir-C, Ir-O) was also determined and compared with the interatomic distances obtained from XRD of an existing crystallographic structure.

2. Materials and Methods

The IrQ(ppy)2 synthesis implies a few additional steps which can influence the efficiency of the chemical reaction and the crystallization process of the obtained powder. For example, a faster crystallization from dichloromethane can reduce the physical oxidation of the organometallic compound but influences the isomerization and crystallography of the obtained powder.
Ir(III) complex 8-hydroxyquinoline–bis (2-phenylpyridyl) iridium (IrQ(ppy)2) organometallic compound was chemically synthesized with two types of ligand: 2-phenylpyridine and quinoline, in a standard two-step reaction procedure, described previously [7]. Briefly, a mixture of iridium chloride hexahydrate and 2-phenylpyridine in 2-ethoxyethanol was refluxed in an argon atmosphere for 12 h at 150 °C. The yellow precipitate was cooled at room temperature and washed with ethanol and then dried in vacuum forming a [(C^N)2Ir-μ-Cl]2 bridged dimer. The reaction of the resulting dimer with 8-hydroxyquinoline, in the second step, led to the formation of the final complex, IrQ(ppy)2. The obtained mixture was heated to reflux under a nitrogen atmosphere for 8 h at 140 °C. The crude product, obtained after filtration, was dissolved in CH2Cl2 and concentrated in a vacuum. All chemicals were taken from Sigma Aldrich (St. Louis, MO, USA) and used without further purification.
Iridium coordination with the quinoline and phenylpiridine ligands in the IrQ(ppy)2 compound was investigated by Extended X-ray Absorption Fine Structure (EXAFS) spectroscopy using the Ir-L3 absorption band (11,215 eV). The Ir-L3 absorption line was recorded in transmission mode by using the X-ray absorption spectrometer (Rigaku R-XAS Looper, Rigaku, Tokyo, Japan, Country) [37,38]. The continuous radiation was obtained from an X-ray tube with molybdenum target and LaB6 filament and the monochromatic light was obtained with a curved Ge (220) single-crystal monochromator. A scintillation detector measured the transmitted intensities. The EXAFS analysis was done as a standard procedure, using the REX2000 package [39]. The refinement procedure involves the subtraction of pre-edge and post-edge backgrounds from the experimental spectra. The EXAFS χ(k) functions were calculated from the post-edge oscillations of the Ir-L3 band normalized through the smooth atomic absorption (post-edge background). The spectral conversion from the k-space into physical r-space was done with the Fourier transformed procedure. The radial functions exhibit several maxima assigned to the atomic distances around the neighboring iridium absorbing atoms. The first main maxima correspond to the first shell atoms which surround the central Ir and were isolated by Hanning-function windows. The fitting procedure gives the coordination numbers and interatomic distances between the iridium absorbing atoms and the atoms from the first and second shells of coordination. The theoretical EXAFS spectra concerning electron backscattering amplitudes, phases, and inelastic mean free path were obtained with the FEFF6 code [40].
HPLC spectra were recorded with a Thermo Scientific Ultimate 3000 UHPLC+ (Thermo Fisher Scientific, Waltham, MA USA), with a DIONEX binary RS PUMP, RS Autosampler, RS Column Compartment equipped with RS Diode Array Detector, RS Fluorescence Detector. The equipment was fitted with a Varian Pursuit 5 C18 column (250 × 4.6 mm2). Samples were analyzed using an isocratic method, with acetonitrile as the eluent at 20 °C with a flow rate of 1 mL min−1.
NMR data were obtained using an Agilent Technologies DD2 600 MHz NMR spectrometer (Bruker BioSpin GmbH, Rheinstetten, Germany) having a 5 mm PFG Triple Resonance Cold probe at 25 °C. 1H and 13C chemical shifts (δ) are referenced to the signal of deuterated chloroform. The organometallic compound, IrQ(ppy)2 (0.28 wt/v %), was characterized by 1H, 13C, and 15N-NMR spectroscopy. The assignments of proton and carbon atoms were based on heteronuclear multiple-bond correlation spectroscopy (1H-13C-HMBC), heteronuclear single quantum coherence spectroscopy (1H-13C-HSQC), correlation spectroscopy(1H-1H−COSY), total correlation spectroscopy (1H-1H-TOCSY) and nuclear Overhauser effect spectroscopy (1H-1H-NOESY) experiments. NMR spectra were processed using M-Nova software (version 14.1.1).
The X-ray diffraction (XRD) measurements were made on IrQ(ppy)2 powder using a Bruker D8 Advance type X-ray diffractometer (Bruker AXS GmbH, Karlsruhe, Germany) with copper target X-ray tube and LynxEye one-dimensional detector. The X-ray tube parameters were fixed at 40 kV and 40 mA. CuKα1 radiation (λ = 1.54056 Å) was used as an X-ray source. Crystal Sleuth software (2006) was used for the analysis of XRD data.

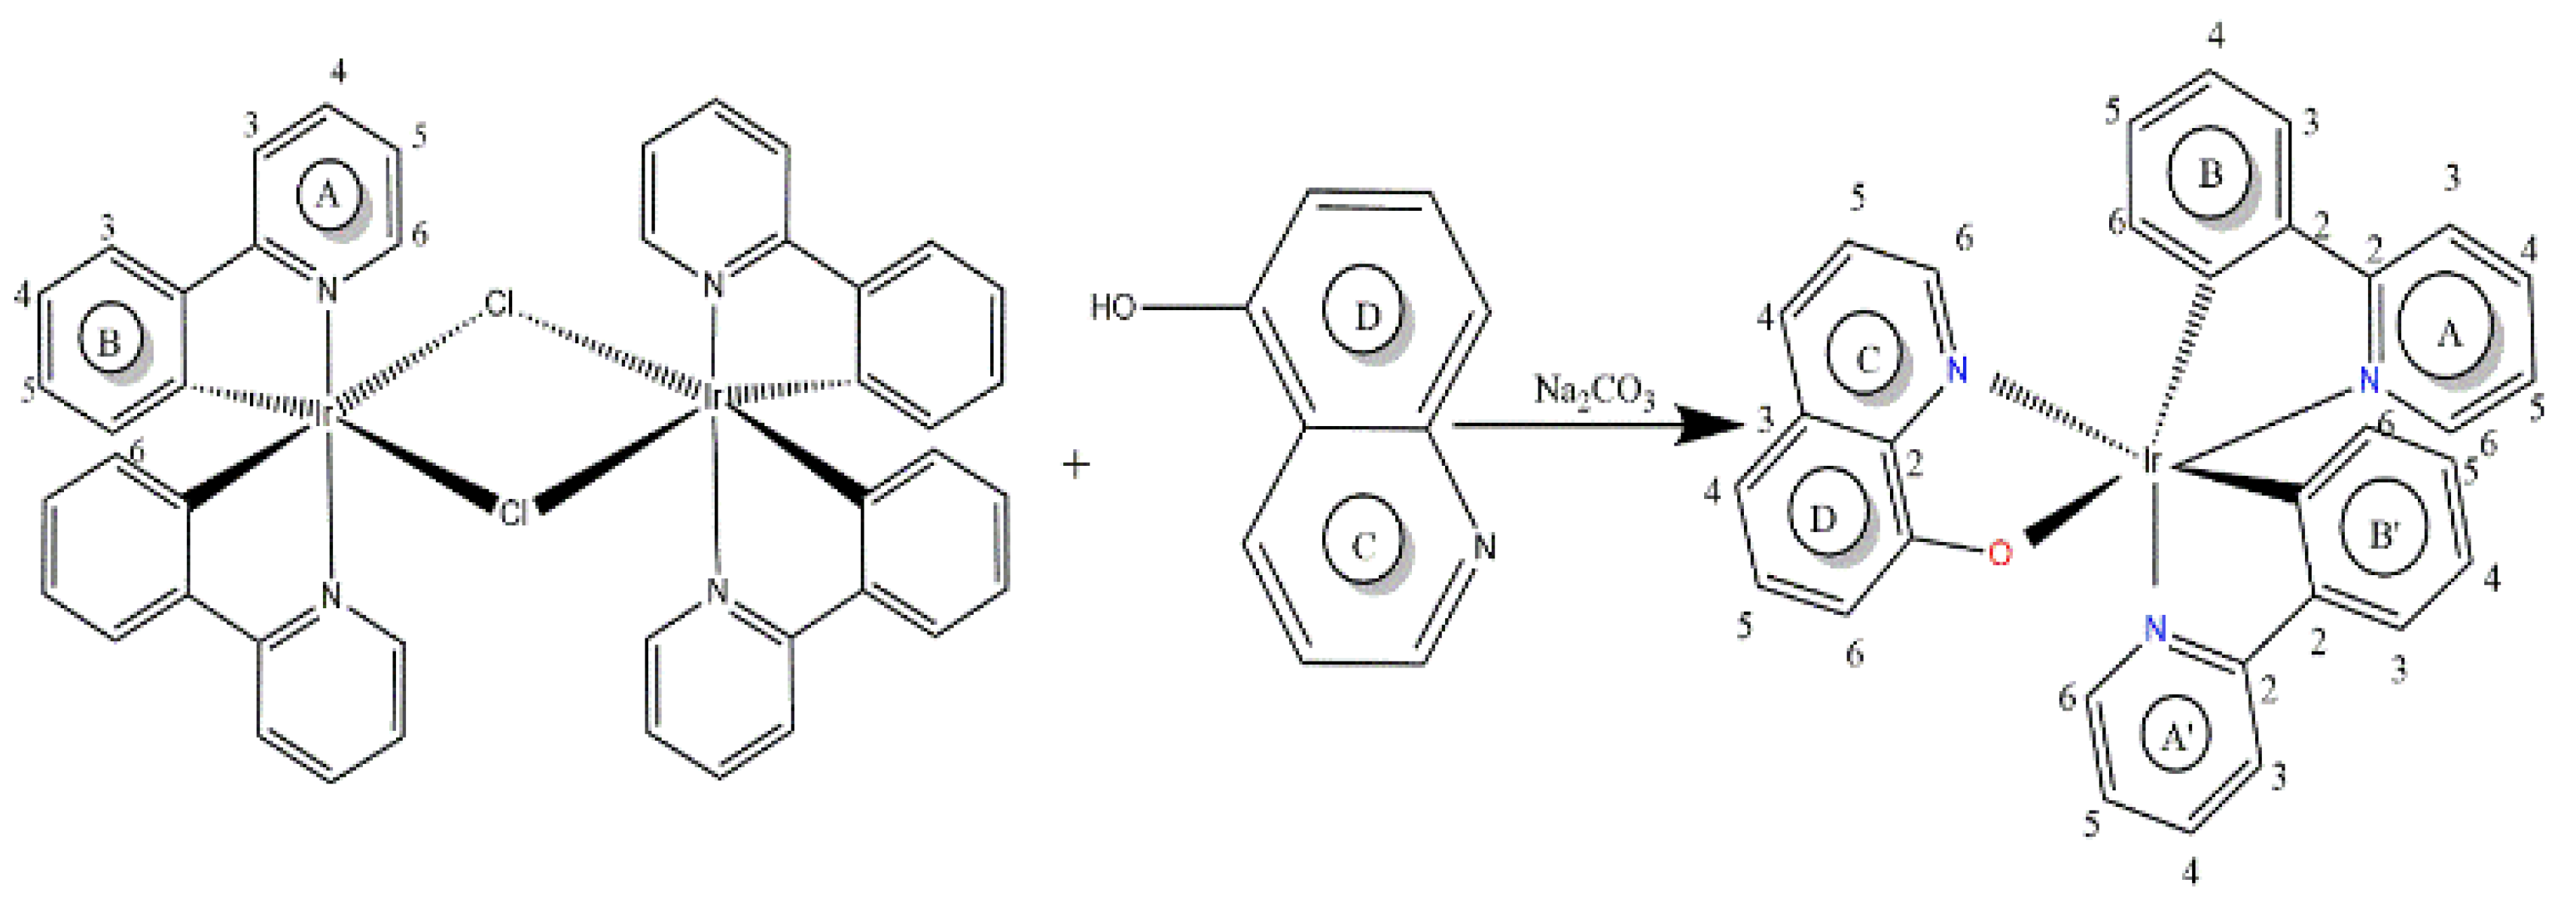
3. Results and Discussion

The earlier papers containing the X-ray crystal structures of the similar organometallic compounds reported a significant trans-effect of the Ir-C, which induces the formation of the Ir-Cl bridge bonds trans to the Ir-C bonds. Based on this trans-effect, the structure illustrated in Figure 1, leads to an isomer with the C- and N-donor atoms having a trans position to each other [41,42,43].
The synthetic route to IrQ(ppy)2 implies the reaction between the [(C^N)2Ir-µ-Cl]2 dimers and 8-hydroxyquinoline ligand in the presence of Na2CO3 catalyst. In this reaction, cleavage of the chlorine bridge and binding of the quinoline ligand occurs, by N^O coordination mode.

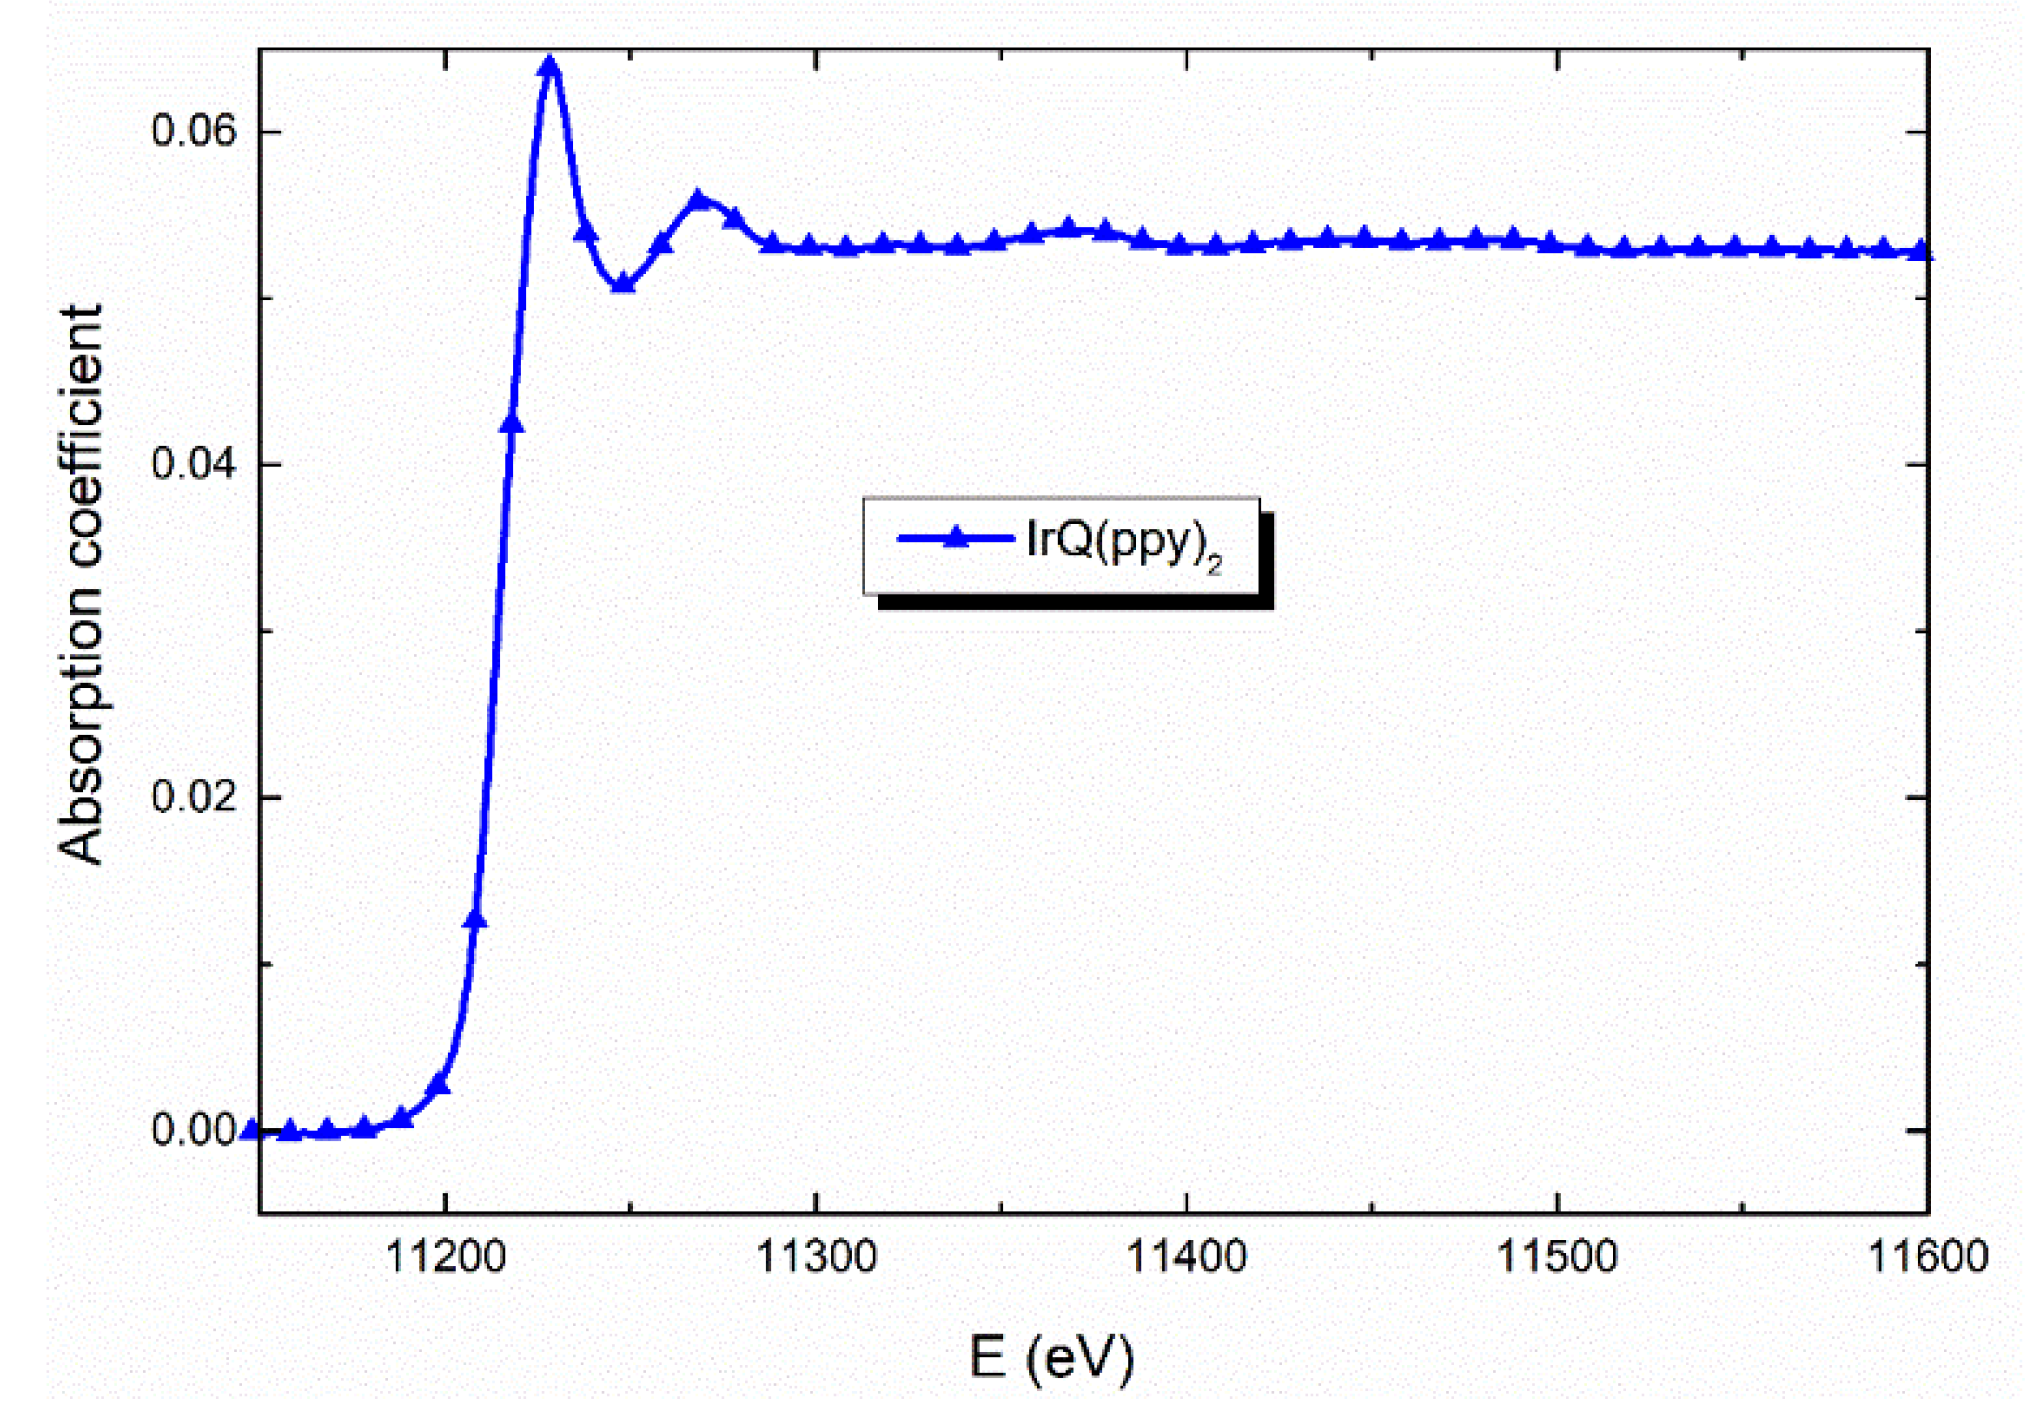
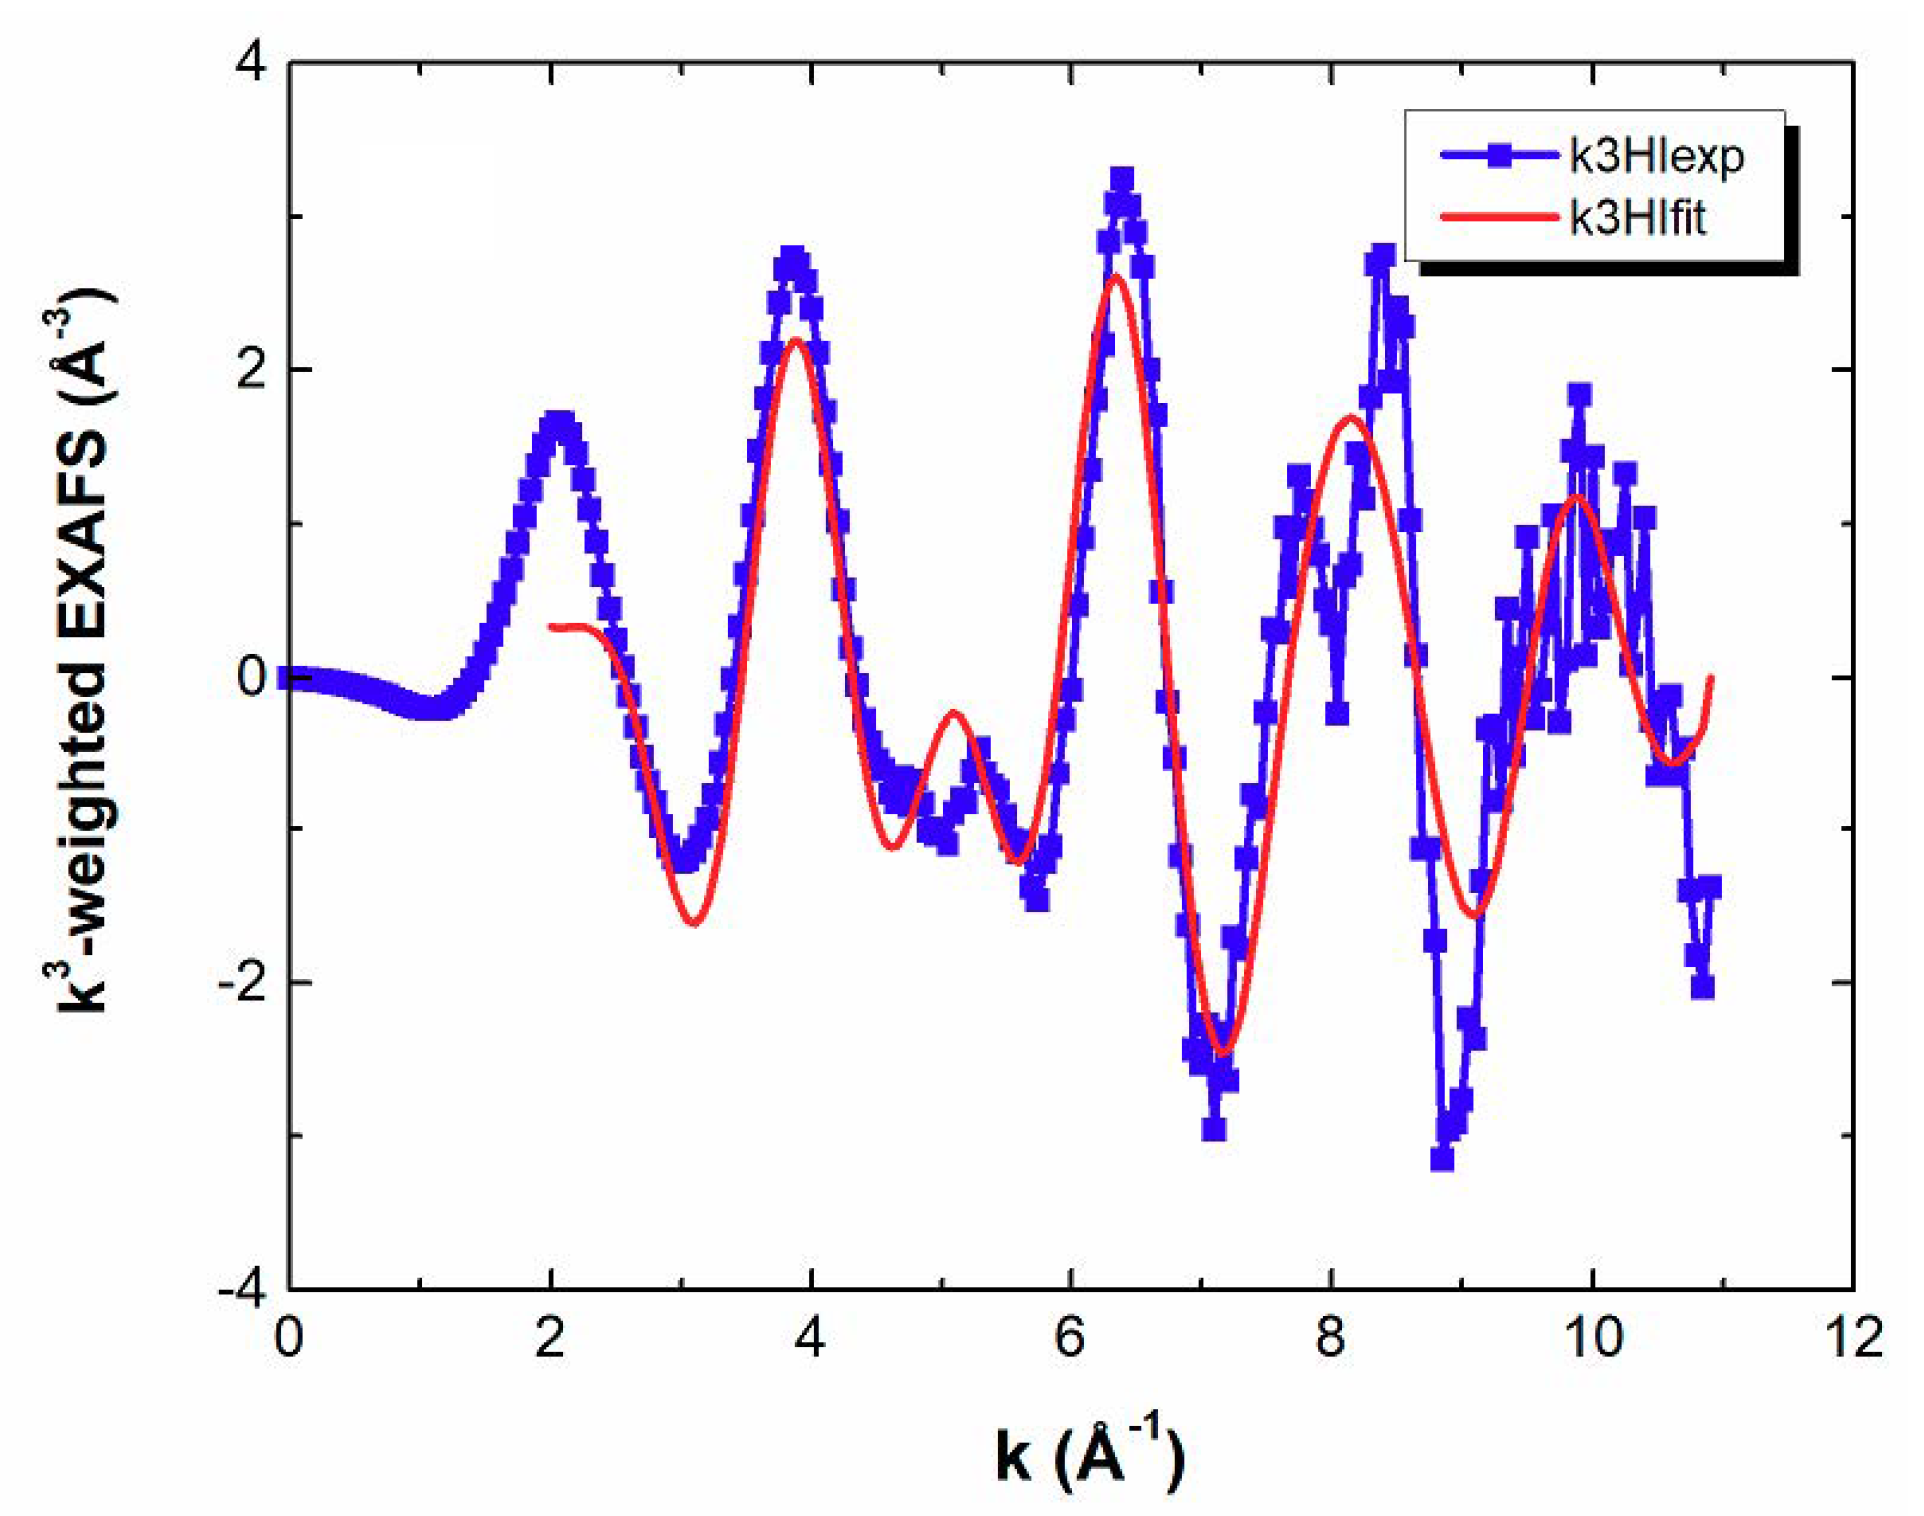
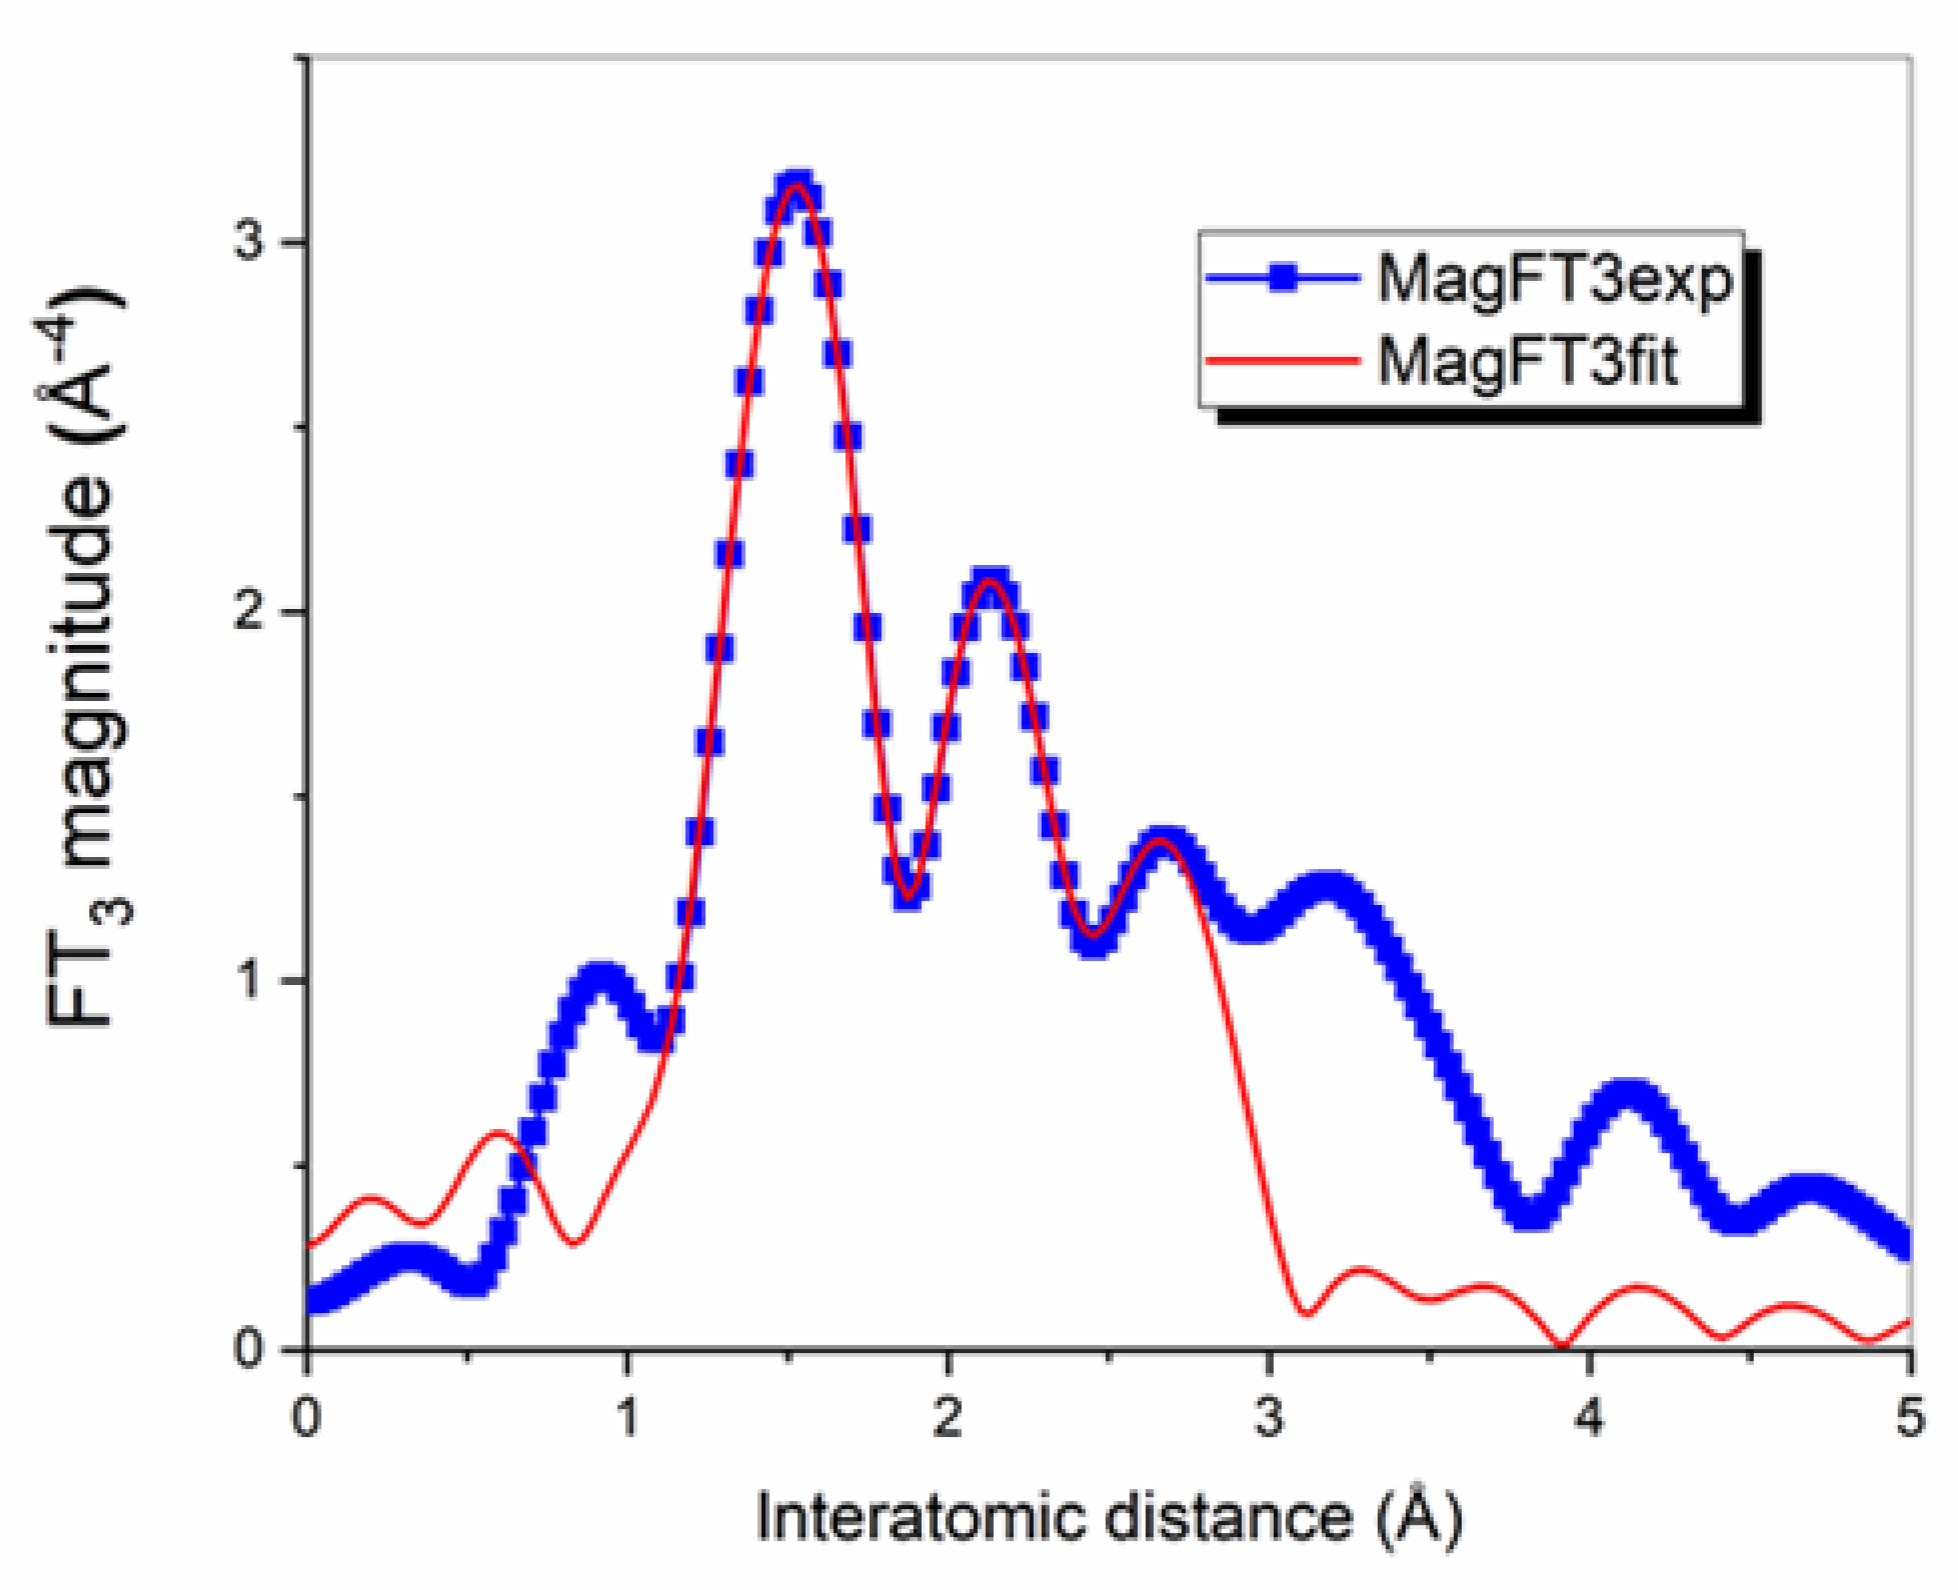
3.1. EXAFS Measurements

To verify the molecular structure of IrQ(ppy)2, we performed the EXAFS spectroscopy to determine the Ir coordinations by using a Rigaku X-ray spectrometer.
The Ir-L3 EXAFS measurements allow us to accurately determine the metal environment in the Ir(III) organic complexes with efficient phosphorescence emission. Such knowledge will enable us to verify the correctness of the preparation stages of these compounds, by comparison with the molecular structure experimentally derived by XRD.
Figure 2 has shown the X-ray absorption coefficient for the Ir-L3 edge after refinement and normalization with the sample thickness. The oscillations around the Ir-L3 edge allows the calculations for the bonding between the metal and ligands (Ir-N, Ir-C, Ir-O), in the first and second shell but also the interatomic distances in both shells. The photoelectron transitions between Ir 2p3/2 and the upper states 5d3/2,5/2 give the line absorption for the Ir-L3. Between 11.20 and 11.28 keV, the line is quite intense, suggesting an efficient 2p3/2-5d electron transfer to Ir unoccupied.
The EXAFS of IrQ(ppy)2 (Figure 3) has sharp and intense features for the k between 0 to 6 and weakens between 7 to 11. This fact allows better calculation for distances in the first and the second shell but with some errors for the third shell.
Figure 4 shows the magnitude of the Fourier transforms of the Ir L3-EXAFS spectra of the intermediate and final compounds, over the k-range 2–11 Å−1. The results of the fit (coordination numbers and interatomic Ir-neighbour distances) were compared with molecular bonds from experimentally derived X-ray diffraction on powder, for IrQ(ppy)2 final compound [26].
In the IrQ(ppy)2 compound, the Ir environment from the XRD measurements consists of 2 C, 3 N and 1 O nearest neighbors (first shell) at the average distances 2.03, 2.08 and 2.15 Å, respectively, and 11 C next-nearest neighbors at an average distance of 2.98 Å (Table 1). EXAFS provides for this compound 4 (C, N, O) nearest neighbors at 1.97 Å and a split next-nearest neighboring C shell, with 5 C at 2.63 Å and 6 C at 2.96 Å.
The EXAFS results for the first shell indicate a mean value of 1.97 Å because all three species, C, N, O, are seen as mean elements corroborated with their coordination number and cannot be individually assigned. The mean coordination number represents a superimposed contribution with distances varying between 1.82 to 2.04 Å, which induces a decrease in the oscillations in amplitude. This fact was observed in other iridium-based compounds where the contributions of the atoms from the first shell of Ir are not resolved and give a single shell [43].
Two main discrepancies are therefore noticeable between EXAFS and the model obtained from XRD analysis: a contraction of the interatomic distances between Ir and its nearest neighbors and a split of the next-nearest neighboring C shell, for IrQ(ppy)2. The splitting was also observed by Feiters et al. detected by EXAFS as a weakening of contribution, and adequately simulated with a split shell, but different distances [44]. A possible explanation in our case is related to the lower electronegativity of oxygen which tightens the rings of quinoline ligand moving the carbon atoms towards iridium. Concerning the contraction of the interatomic distances between Ir and its nearest neighbors, this might be related to the π–π stacking between molecules in the crystalline structures, as can also be seen in the XRD measurements.

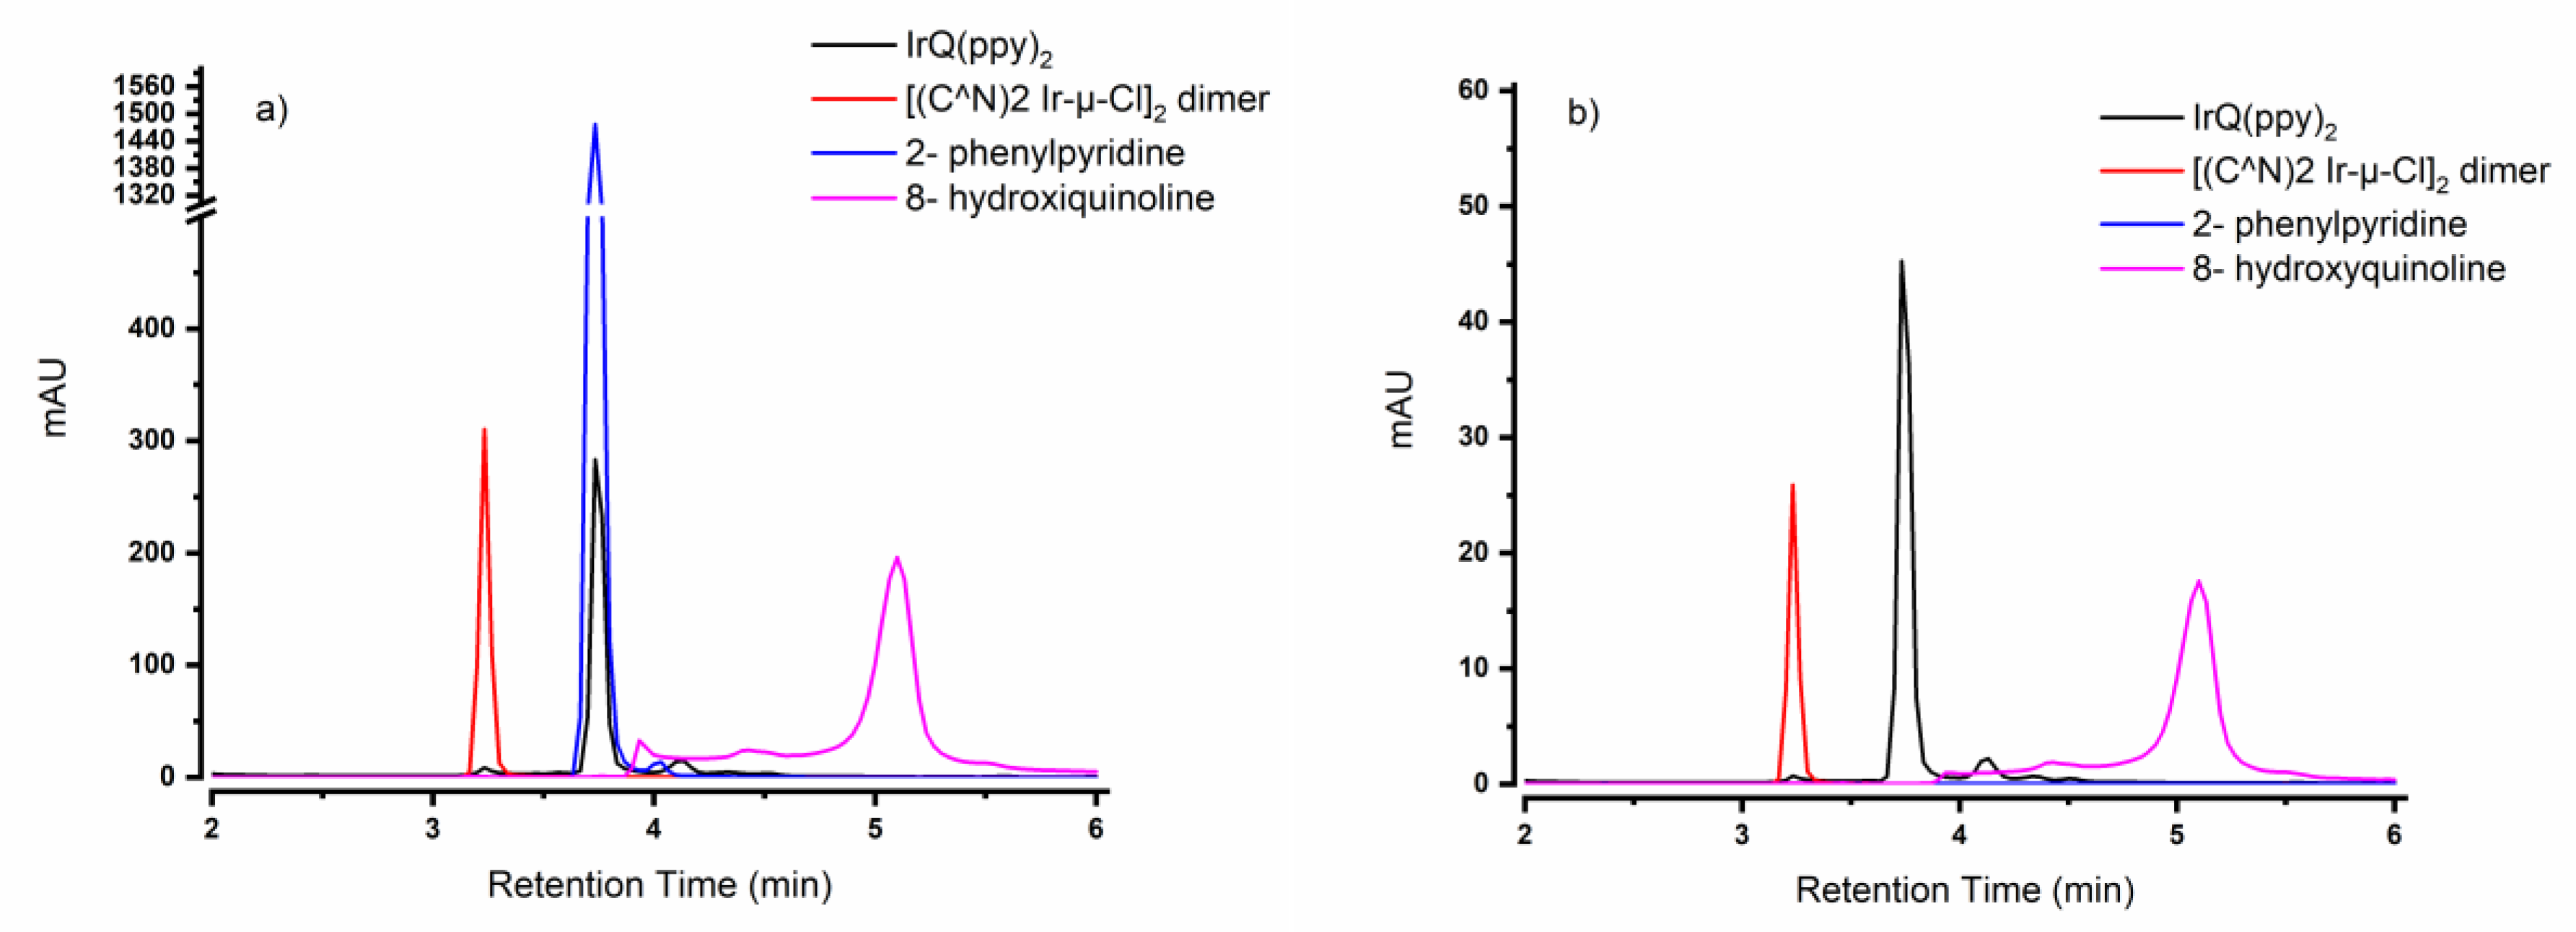
3.2. High-Performance Liquid Chromatography

The reaction between the [(C^N)2Ir-µ-Cl]2 intermediate dimers and 8-hydroxyquinoline (Q) was investigated by HPLC to prove the conversion from the dimer to the desired IrQ(ppy)2 and to analyze the purity of the end-product. Solutions of dimers, quinoline and end-product, as well as 2-phenylpyridine (ppy), in acetonitrile AcCN, were independently injected into an HPLC system equipped with a diode array detector.
The chromatograms (Figure 5a,b) obtained showed distinct retention times between the dimer (3.23 min), end-product (3.73 min) and quinoline (5.10 min). However, the retention time for 2-phenylpyridine was similar to that of the end-product (i.e., 3.73 min). To distinguish between the two peaks, the chromatograms at four distinct wavelengths (261, 340, 403 and 450 nm) were analyzed. 2-phenylpyrdine has a peak with strong absorbance at 261 nm, but the absorbance at the other three wavelengths is negligible, whereas the absorbance for IrQ(ppy)2 is evident at all four wavelengths. The broader absorbance spectrum is expected due to the presence of the MLCT bands. The differences in the peaks of IrQ(ppy)2 and 2-phenylpyridine can also be observed in the 3D field spectra. In addition to confirming the presence of distinct species and the formation of the end-product, HPLC suggested a purity of more than 95% according to peak integration.

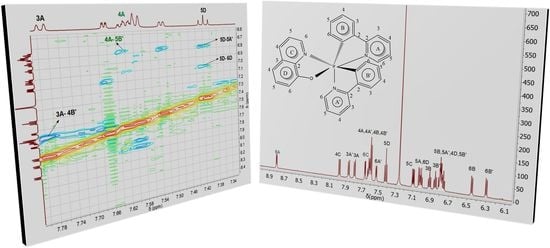
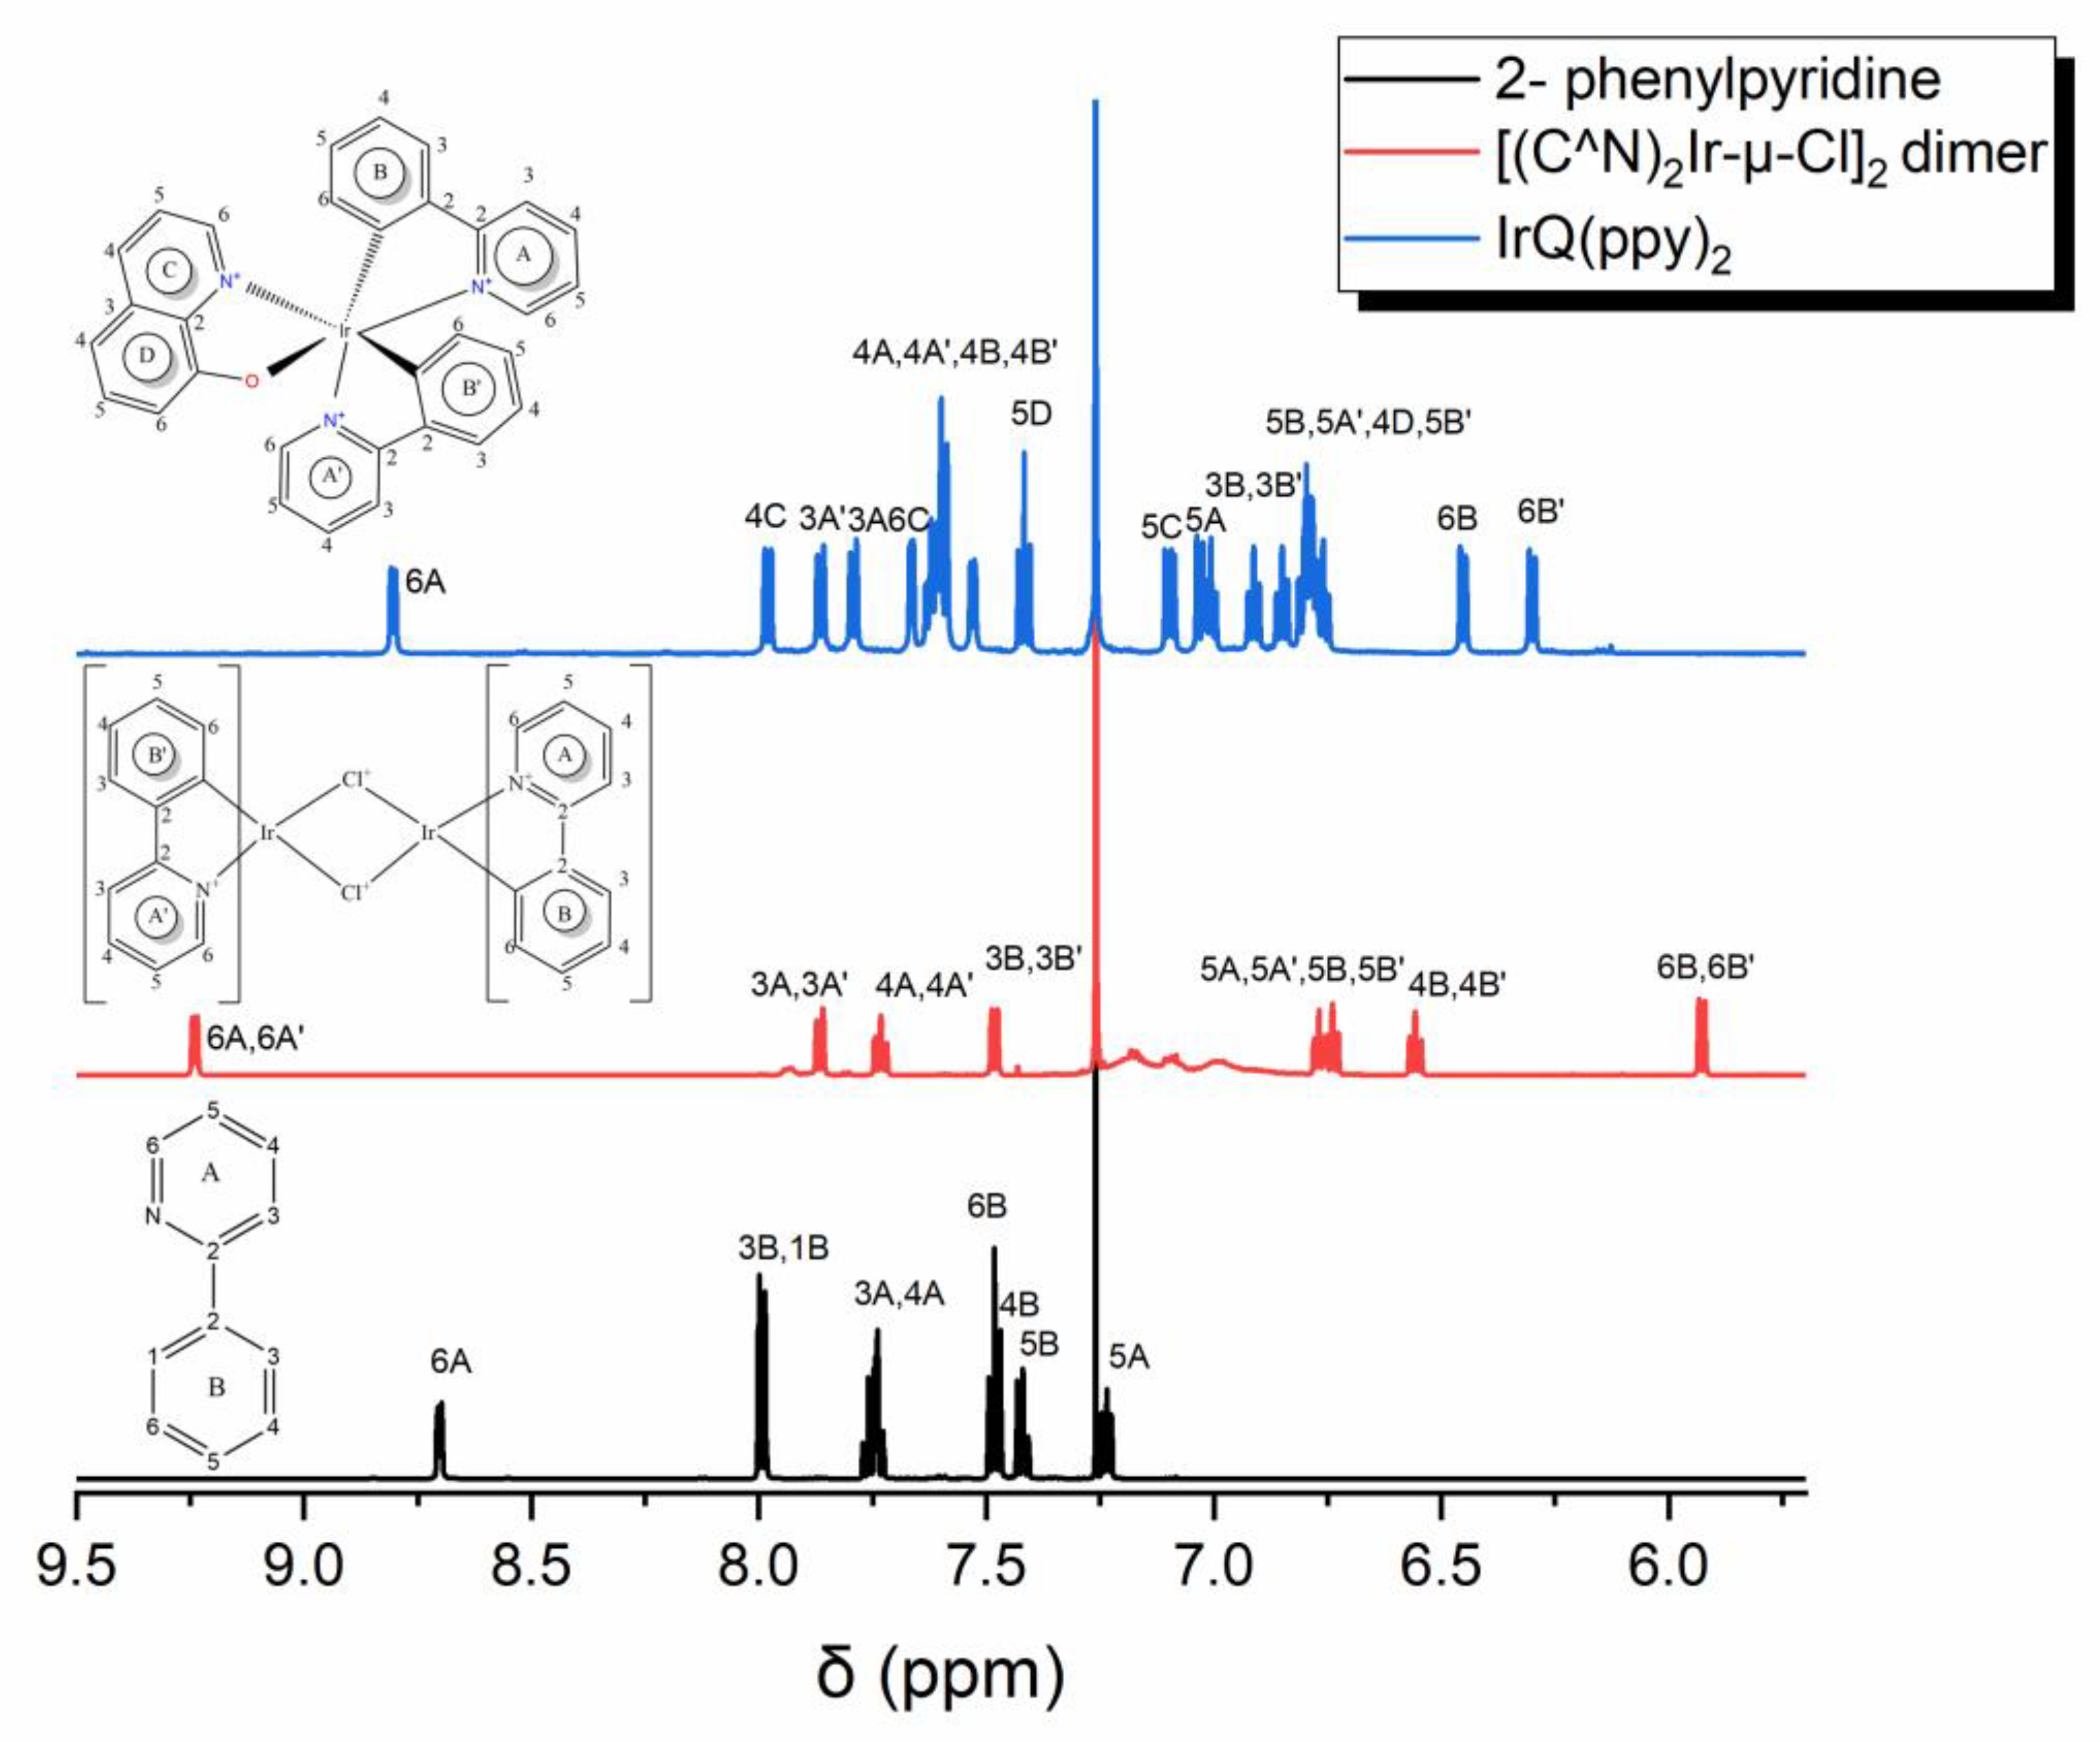
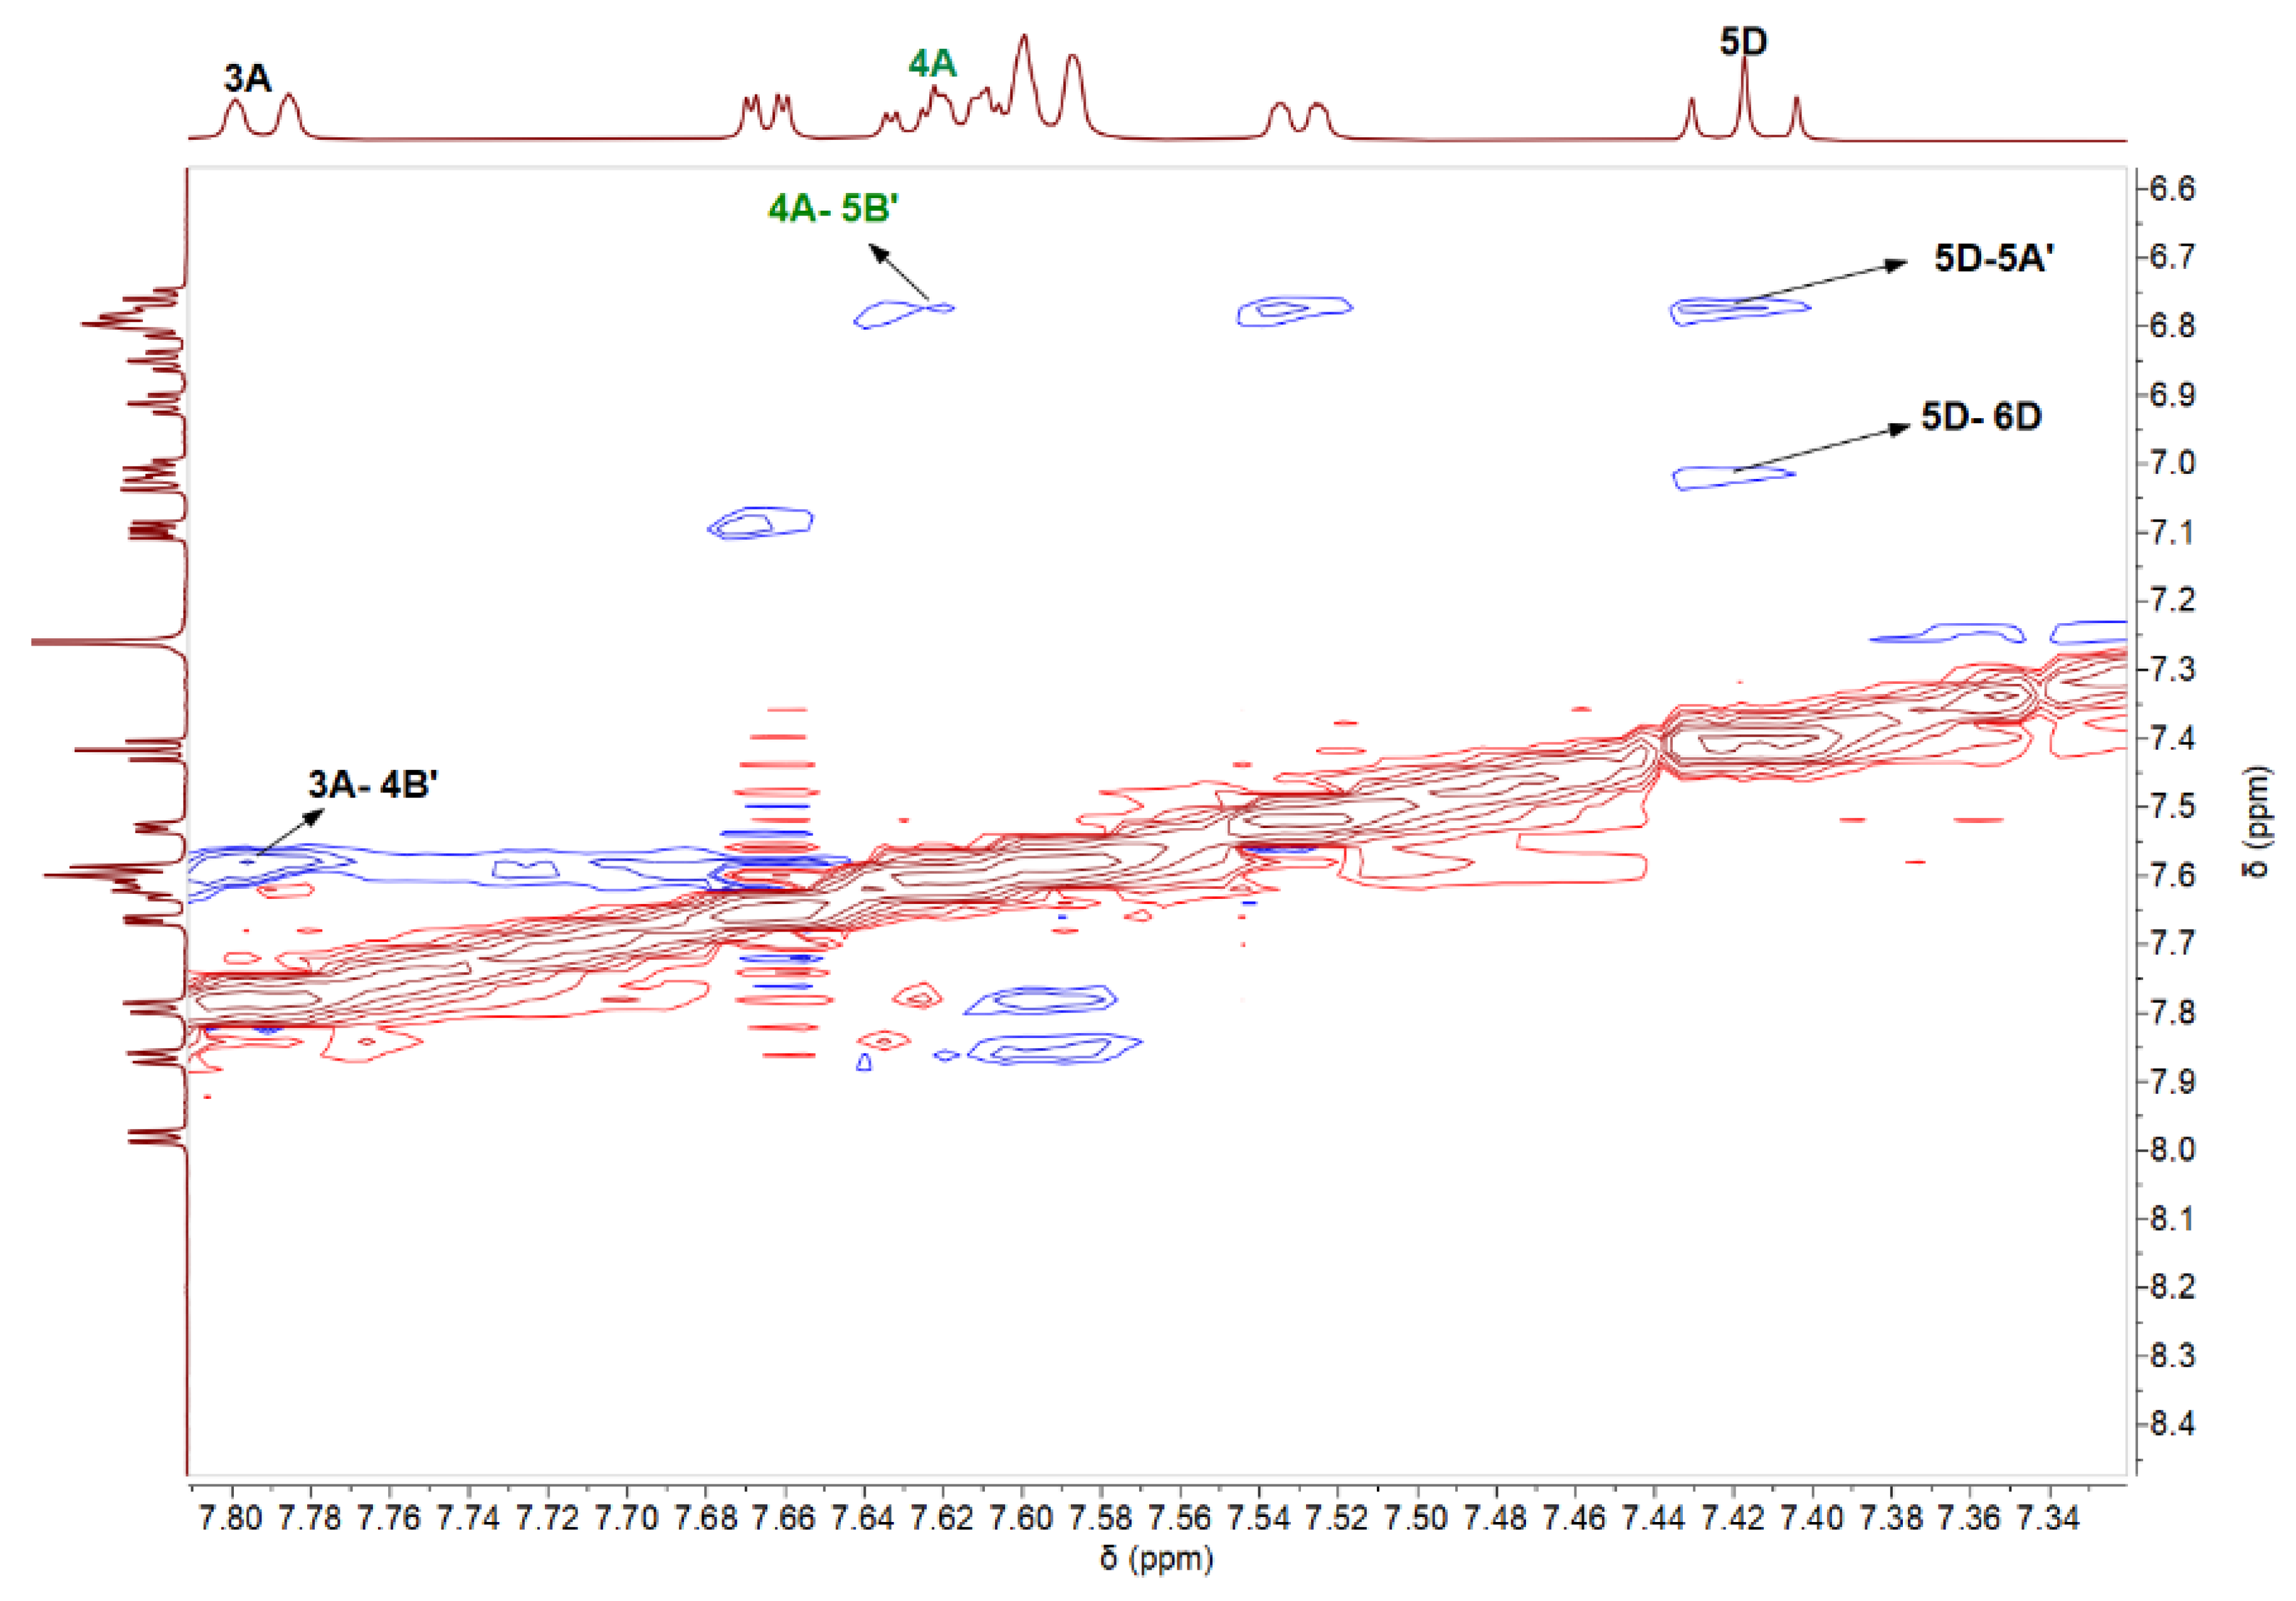
3.3. Nuclear Magnetic Resonance

In addition to HPLC, the reaction was analyzed by 1H NMR and 13C NMR spectroscopy. The 1H NMR spectra of the 2-phenylpyridine ligand, [(C^N)2Ir-µ-Cl]2 dimers and IrQ(ppy)2 compounds (Figure 6) illustrate the presence of one compound in solution. The proton H6B of the 2-phenylpyridine ligand is chemically shifted from δ 7.48 to 5.93 and 6.45 ppm, upon coordination to the metal, in comparison with the iridium dimer and IrQ(ppy)2, respectively, which implies the expected effect of cyclometalation at C1B (C1B′).
Interestingly, the most downfield proton H6A, neighboring the N atom, in the free 2-phenylpyridine ligand, exhibits a low-field shift from δ 8.70 ppm in the ligand to δ 9.24 ppm in the dimer, owing to deshielding by the proximal electronegative nitrogen. In the IrQ(ppy)2 molecules, the first proton H6A shifts further (from δ 9.24 ppm in the dimer to δ 8.80 ppm in the complex) upon the cyclometalation process with the 8-hydroxyquinoline ligand. This shift can be used as a diagnostic method to prove the coordination processes [45].
Full 1H and 13C NMR spectroscopy characterization and assignment were carried out using 2D techniques including 1H-1H COSY, 1H-13C HMBC, 1H-13C HSQC, 1H-1H TOCSY and 1H-1H NOESY.
The signals in the 1D 1H and 13C NMR spectra of the IrQ(ppy)2 organometallic compound showed the expected number of protons: 22 protons (16 protons belonging to two phenylpyridine and six protons to quinoline ring) and the expected 31 carbon atoms (11 × 2 = 22 from phenylpyridine and nine from quinoline ligands) from which nine carbon atoms are quaternary. TOCSY spectra of the IrQ(ppy)2 organometallic compound show six distinct groups of protons that were assigned to the six aromatic rings in the structure. (ESI, Figure S1)
There are two groups with three protons connected through bonds only in the quinoline ligand (Table 2), therefore the groups with three protons described before come from the quinoline ligand. The complete assignment of all the quinoline protons thus requires a thorough analysis of its 1H-1H COSY and 1H-1H TOCSY spectra.
From those two groups of 3three protons (H4C, H5C, H6C; H4D, H5D, H6D), we aim to identify the location of each proton in the pyridine and benzene rings in the quinoline ligand. In the COSY spectra of pyridine and benzene rings of quinoline ligand (see ESI, Figure S2), the proton at δ 7.98 ppm shows strong interaction with a proton (δ 7.11 ppm) and weak interaction with a proton at δ 7.67 ppm. In the 1H-1H COSY spectrum (ESI, Figure S3), the proton at δ 8.80 ppm shows strong interaction with the proton at δ 7.00 ppm, which may be a vicinal coupled, and weak coupling with protons at δ 7.79 and 7.62 ppm (see ESI, Figure S3). The proton at δ 7.79 ppm shows strong coupling with the proton at δ 7.62 ppm (vicinal coupling) and weak couplings with protons at δ 8.80 and 7.00 ppm. The proton at δ 7.00 ppm shows coupling with the proton at δ = 7.62 ppm. Similarly, the right order of the protons in the next aromatic rings in phenylpyridine ligands was identified based on 1H-1H COSY (Table 3). In the 15N-HMBC spectrum (ESI, Figure S4), the only proton at δ 7.67 ppm shows a signal. Thus, it follows that the proton at δ 7.67 ppm could be attributed to H6C because the corresponding carbon is bound to N. This proton at δ 7.67 ppm shows in the COSY spectrum a weak interaction with δ 7.98 ppm proton and we can distinguish between the signals at δ 7.11 and 7.98 ppm that correspond to H5C and H4C protons. The strong interaction in the COSY spectrum between the protons at δ 7.98 and δ 7.11 ppm completes this assumption. In this way, we assigned the protons from the pyridine ring of the quinoline ligand. The rest of the protons (δ 7.03, δ 6.80, and δ 7.42 ppm) could be assigned to the benzene ring. From the COSY spectrum of the benzene ring, the proton at 7.03 ppm shows strong interaction with the proton at 7.42 ppm and weak interaction with the proton at 6.80 ppm. These coupling interactions were not enough to distinguish the position of each proton in the benzene ring.
The strong correlation between δ 6.80 and δ 7.42 ppm in the 1H-1H COSY spectrum allows the assignment of the proton at δ 7.42 ppm to H5D. Next, the last proton from the benzene ring at δ 7.03 ppm could be assigned to H6D. In the 1H-1H COSY spectrum, the proton at δ 7.03 ppm (H6D) shows a signal at 7.11 ppm (H5C), which confirms the assignments in the benzene ring (H4D, H5D, H6D) of the quinoline ligand.
Regarding phenylpyridine ligand, from TOCSY maps we found four sets with four protons, as assigned in Table 3. (ESI, Figure S1).
In the 1H-15N-HMBC spectrum (ESI, Figure S4), the protons at δ 8.80 and 7.53 ppm show strong signals, which enable us to assign these protons and their groups with the pyridine ring from phenylpyridine ligand. Moreover, these protons are located proximal to the N atom in pyridine rings. Therefore, the protons at δ 8.80 and 7.53 ppm could be attributed to H6A and H6A’. Based on previously observed correlations in 1H-1H COSY spectrum, the signals at δ 8.80, 7.00, 7.62, and 7.79 ppm can be assigned to H6A, H5A, H4A and H3A, respectively (ESI, Figure S4).
The relative orientation of ligands was determined by acquiring the 1H-1H NOESY spectra (Figure 7). In the 1H-1H NOESY spectrum, the signals appear because the protons are close together in space and not through bonds. Proton H5D (δ 7.42 ppm) from the benzene ring of quinoline ligand shows a strong correlation in the 1H-1H NOESY spectrum with H6D (δ 7.03 ppm), which is its neighbor, and H5A’ (δ 6.79 ppm) from pyridine ring of phenylpyridine ligand. In this way, we can confirm the position of the pyridine ring from phenylpyridine ligand in the IrQ(ppy)2 structure. More interesting was the observation of the correlations between H4A (δ 7.62 ppm) and H5B’ (δ 6.77 ppm) and between H3A (δ 7.79 ppm) and H4B’ (δ 7.60 ppm), which determined the orientation of phenylpyridine ligands to each other. NOESY experiment has shown that in the structure of IrQ(ppy)2 molecule the pyridine ring A and phenyl ring B are tilled.
The coordination of bidentate nitrogen from the quinoline ligand to the IrQ(ppy)2 core preserves a trans configuration of the pyridine groups similar to the one in the precursor [(C^N)2Ir-µ-Cl]2 dimers and this observation have been confirmed both by 1H-1H COSY and 1H-1H NOESY experiments. These results are similar to the literature for mononuclear iridium(III) complexes displaying the IrN4C2 coordination [44].
Kappaun et al. described a similar compound, ppy2Irq, together with other quinolinolate complexes, but from the NMR measurements, the authors concluded a cis disposition for the two carbon ligands and the trans position for the 2-phenylpyridine nitrogen atoms [46]. Their organometallic molecule was not found to be luminescent, even in degassed solvents, the explanation being connected with an unfavorable mixing of singlet and triplet excited states for this compound. Our compound exhibits dual emission, green and red and similar electroluminescence with orange all over color [25].
For a correct assignment, these results might be compared with those obtained from 1H-13C-HSQC and 1H-13C-HMBC (ESI, Figures S5 and S6). The 1H-13C-HSQC experiment was used to determine chemical shifts of individual carbon atoms, which directly bound protons. All nine quaternary carbons (see Table S1, rows in red from ESI) in the IrQ(ppy)2 organometallic compound were assigned based on correlations in 1H-13C-HSQC (ESI, Figure S5)
These spectra reveal correlations between carbons and protons that are separated by two, three and sometimes four bonds. These results agree with the 1H-1H COSY and 1H-1H NOESY results. Briefly, in the pyridine ring of phenylpyridine ligand, correlations between the proton H6A and carbons 2A, 4A, 5A can be identified. The proton H5B shows correlations with carbons 4B and 3B. The proton H5B′ shows a correlation with quaternary carbon 1B′. In the 1H-13C-HMBC spectrum, the proton H5D shows a strong correlation with carbon 1D, and proton 6A′ shows a strong correlation with the carbon 5A′. (ESI, Figure S6).
All NMR measurements reveal a trans isomerization of the IrQ(ppy)2 similar to the Ir(ppy)3 organometallic and the chemical yield of this compound was estimated to be 85%–90%.

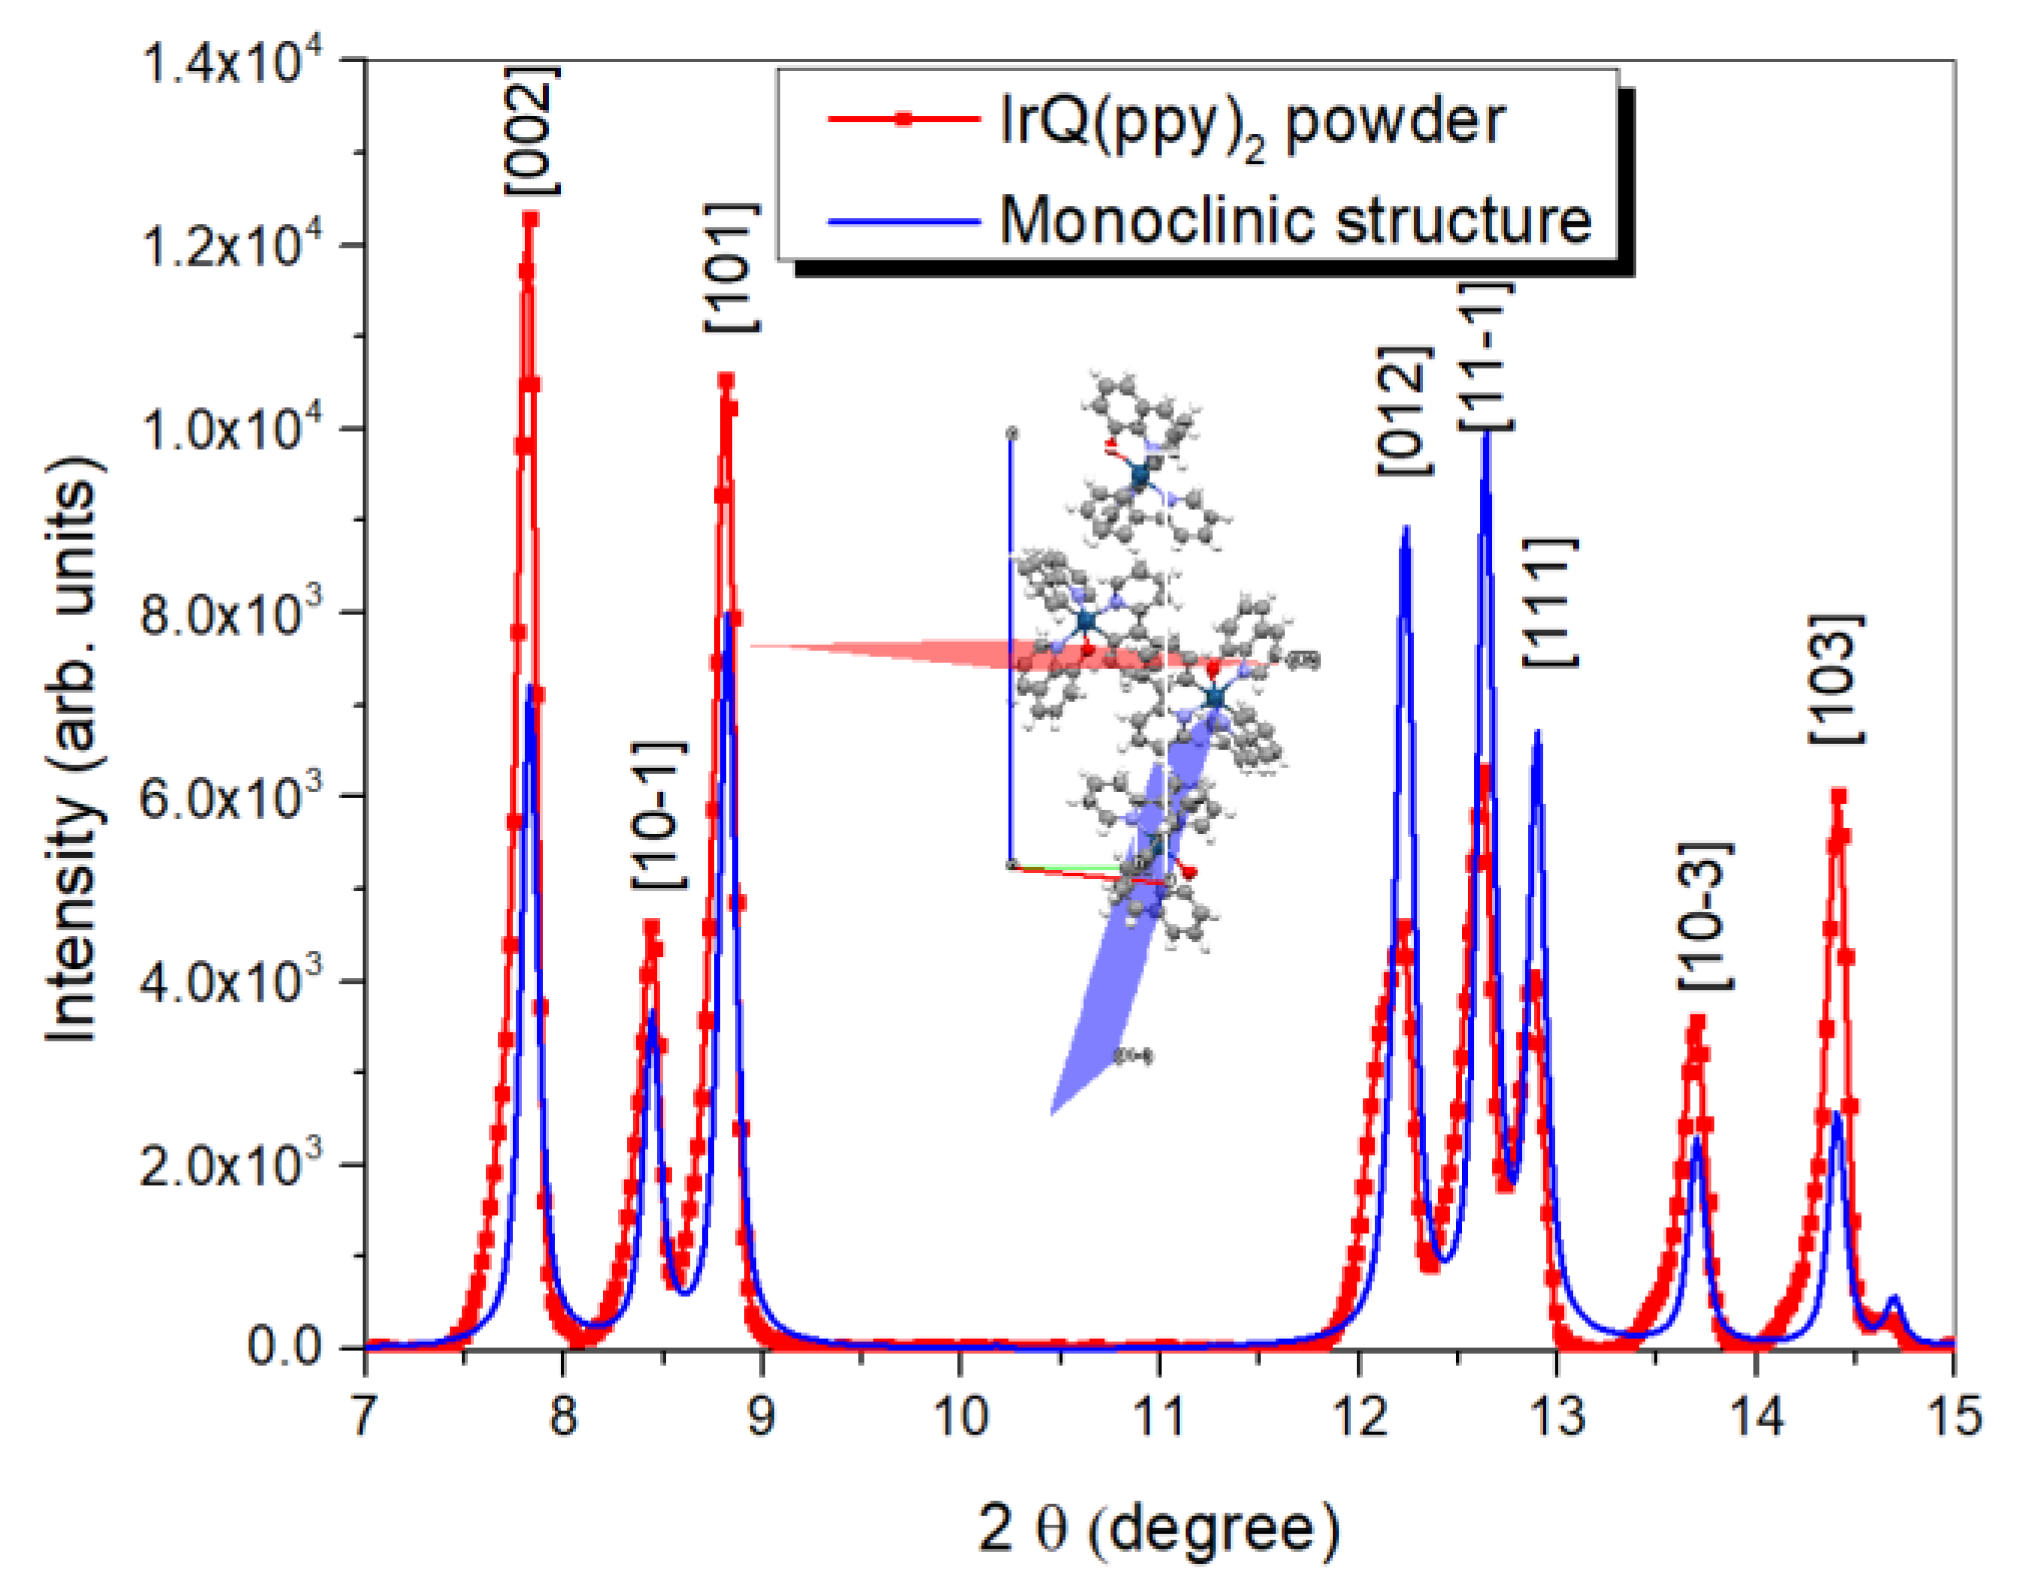
3.4. X-ray Diffraction Analysis

The measured powder by NMR (in solutions) and EXAFS studies were subjected to X-ray diffraction analysis. After the final step of the reaction, between [(C^N)2Ir-µ-Cl]2 compound and the 8-hydroxyquinoline ligand, the solvent was eliminated with a rotary evaporator. The resulting slur was dissolved in dichloromethane to remove the catalyst and other impurities. This solution was then filtered and the IrQ(ppy)2 powder was obtained after recrystallization from solution. The drying procedure significantly influences the crystallography of the final compound.
XRD measurements revealed a monoclinic structure for the IrQ(ppy)2 (Figure 8) with the following parameters: a = 11.8; b = 9.7 and c = 22.9 and angles α = β = γ = 90. Similarly, Chun Yi obtained a monoclinic structure (P2(1)/n) for the IrQ(ppy)2 with the following parameters: a = 11.5; b = 9.4 and c = 22.6 and angles α = γ = 90, but with β = 93.12°, which is the angle between the basal plane and the c axis [26].
The XRD patterns show a different orientation between the monoclinic structure of IrQ(ppy)2 reported by Chun Yi and our sample, suggesting a faster crystallization along with the c-axis leading to needle-like structures (nanowires) and a slower one along the a and b axis.
The IrQ(ppy)2 powder can be easily oxidized in the atmosphere during crystallization from the solution, which significantly reduces the phosphorescent properties of this compound.
For an efficient phosphoresce, the recrystallization process was done in a vacuum at 50 °C which induces a faster growth of IrQ(ppy)2 nanocrystals along the c-axis. When the recrystallization is done at room temperature, the structure is almost similar to that obtained by Chun Yi [26].
In the powder form, a π–π stacking process between the adjacent IrQ(ppy)2 takes place and distances between quinoline ligands compete with the intermolecular interactions [18,47] which induces inter-ligand energy transfer (ILET) [48]. The emission processes follow the excitation in the 1MLCT state and an efficient transfer to the 3MLCT due to the strong spin-orbit coupling.

4. Conclusions

The EXAFS measurements confirm the IrQ(ppy)2 organometallic compound in comparison with the previous XRD data. The presence of the oxygen atoms influences the splitting of the next-nearest neighboring C in the second shell from the Ir3+ ions. The contraction of the interatomic distances in the first shell can be correlated with the π-π stacking between quinoline ligands during the crystallization process. The interatomic distances in the first and second shells obtained from the EXAFS measurements were compared with the trans structure obtained from NMR studied.
The signals in the 1D NMR spectra showed the expected number of protons: 22 protons (eight ppy H resonances twice and six quinoline H resonances). The proton signals were assigned to their position in the bicycling system of the ligand by COSY, HMBC, HSQC, TOCSY and NOESY and reveal the presence of 31 carbon atoms, from which nine carbon atoms are quaternary. All these measurements suggest the formation of the desired compound IrQ(ppy)2, containing two pyridine ligands in trans isomers with a distribution of nitrogen ions in a similar way with facial Ir(ppy)3. These three N ions form a triangle which can be seen in the 15N-HMBC and, in comparison with fac-Ir(ppy)3, the trans-IrQ(ppy)2 presents higher photoluminescence quantum efficiency compared with the equivalent cis-IrQ(ppy)2 and dual green-red electroluminescence. The efficiencies of chemical reaction resulting from NMR measurements for IrQ(ppy)2 vary between 85% and 90% for different samples, while from HPLC the chemical reaction is over 95%.
Finally, XRD measurements confirm the monoclinic structure of the obtained IrQ(ppy)2 powder, where the contraction of the interatomic distances between Ir and its nearest neighbors suggests a π–π stacking between quinoline ligands during the crystallization process, along the c-axis, due to a faster crystallization process obtained during the evaporation of the solvent.

Supplementary Materials

The following are available online at https://www.mdpi.com/1996-1944/13/7/1617/s1, Figure S1: TOCSY spectrum of IrQ(ppy)2. Figure S2: COSY spectrum of quinoline ligand. Figure S3: COSY spectrum of phenylpyridine ligand. Figure S4: 1H-15N HMBC of IrQ(ppy)2. Figure S5: 1H-13C HSQC spectrum of IrQ(ppy)2, Figure S6: 1H-13C HMBC spectrum of IrQ(ppy)2. Table S1: Assignments of IrQ(ppy)2 organometallic compound from 1H-NMR and 13C-NMR.

Author Contributions

I.C.C. and C.C.C. designed and performed the experiments and synthesis. EXAFS, XRD analysis. P.Š. performed NMR, I.C.C. and D.N.C. interpreted data of the resulting spectra. D.N.C. and I.C.C. carried out HPLC. C.C.C., I.C.C. and S.P. prepared and perfected the manuscript. All authors have read and agreed to the published version of the manuscript.

Funding

This work was supported by a grant from the Romanian National Authority for Scientific Research, CNCS-UEFISCDI Core Program PN19-03 (contract no. 21 N/08.02.2019), Financial support from the Romanian Ministry of Research, project NANOBIOSURF-SMIS 103528 and Project DEXMAV (contract no. 12 PFE/2018).

Acknowledgments

The authors acknowledge the CERIC-ERIC Consortium for access to experimental facilities (NMR) and financial support.

Conflicts of Interest

The authors declare no conflict of interest.

References

  1. Yersin, H. Highly Efficient OLEDs with Phosphorescent Materials; Wiley-VCH Verlag GmbH: Weinheim, Germany, 2008; p. 458. [Google Scholar]
  2. Baldo, M.A.; Thompson, M.E.; Forrest, S.R. Phosphorescent materials for application to organic light emitting devices. Pure Appl. Chem. 1999, 71, 2095. [Google Scholar] [CrossRef] [Green Version]
  3. Park, Y.S.; Lee, S.; Kim, K.H.; Kim, S.Y.; Lee, J.H.; Kim, J.J. Exciplex-Forming Co-host for Organic Light-Emitting Diodes with Ultimate Efficiency. Adv. Funct. Mater. 2013, 23, 4914. [Google Scholar] [CrossRef]
  4. Hu, Y.X.; Xia, X.; He, W.Z.; Chi, H.J.; Dong, Y.; Xiao, G.Y.; Lv, Y.L.; Li, X.; Zhang, D.Y. Novel Ir(III) complexes ligated with 2-(2,6-difluoropyridin-3-yl)benzo[d] thiazole for highly efficient OLEDs with mild efficiency roll-off. Dyes Pigments 2019, 166, 254. [Google Scholar] [CrossRef]
  5. Park, Y.W.; Kim, Y.M.; Choi, J.H.; Park, T.H.; Jeong, J.W.; Cho, M.J.; Choi, D.H.; Ju, B.K. Electroluminescence Property of Highly Soluble Ir(III) Complex Utilized by Various Hole Blocking Layers in Polymer Light Emitting Diodes. J. Nanosci. Nanotechnol. 2010, 10, 3250. [Google Scholar] [CrossRef] [PubMed]
  6. Sun, J.; Wang, H.; Xu, H.; Li, J.; Wu, Y.; Du, X.; Xu, B. Synthesis, structure, photophysical and electroluminescent properties of a blue-green self-host phosphorescent iridium(III) complex. Mater. Chem. Phys. 2015, 162, 392. [Google Scholar] [CrossRef]
  7. Sun, Y.; Yang, X.; Liu, B.; Dang, J.; Li, Y.; Zhou, G.; Wu, Z.; Wong, W.Y. Towards high performance solution-processed orange organic light-emitting devices: Precisely adjusting properties of Ir(III) complexes by reasonably engineering the asymmetric configuration with second functionalized cyclometalating ligands. Mater. Chem. C 2019, 7, 8836. [Google Scholar] [CrossRef]
  8. Yang, H.; Guo, H.; Wu, L. Green phosphorescent organic light-emitting devices based on different electron transport layers combining with fluorescent sub-monolayer. Opt. Lett. 2017, 13, 0116. [Google Scholar] [CrossRef]
  9. Ciobotaru, I.C.; Polosan, S.; Ciobotaru, C.C. Organometallic compounds for photovoltaic applications. Inorg. Chim. Acta 2018, 483, 448. [Google Scholar] [CrossRef]
  10. Lowry, M.S.; Goldsmith, J.I.; Slinker, J.D.; Rohl, R.; Pascal, R.A.; Malliaras, G.G.; Bernhard, S. Single-Layer Electroluminescent Devices and Photoinduced Hydrogen Production from an Ionic Iridium(III) Complex. Chem. Mater. 2005, 17, 5712. [Google Scholar] [CrossRef]
  11. Polosan, S.; Ciobotaru, C.C.; Ciobotaru, I.C.; Tsuboi, T. Crystallization properties of IrQ(ppy)2 organometallic complex films. J. Mater. Res. 2017, 32, 1735. [Google Scholar] [CrossRef]
  12. Katz, H.E.; Bao, Z. The Physical Chemistry of Organic Field-Effect Transistors. J. Phys. Chem. B 2000, 104, 671. [Google Scholar] [CrossRef]
  13. Qiao, X.; Tao, Y.; Wang, Q.; Ma, D.; Yang, C.; Wang, L.; Qin, J.; Wang, F. Controlling charge balance and exciton recombination by bipolar host in single-layer organic light-emitting diodes. J. Appl. Phys. 2010, 108, 034508. [Google Scholar] [CrossRef]
  14. Zhang, Y.Q.; Zhong, G.Y.; Cao, X.A. Concentration quenching of electroluminescence in neat Ir(ppy)3 organic light-emitting diodes. J. Appl. Phys. 2010, 108, 083107. [Google Scholar] [CrossRef]
  15. Huh, J.S.; Moon, C.K.; Kim, J.J. Dependence of apparent emitting dipole orientation of an Ir(III) complex on doping concentration, film thickness, and excitation condition. Org. Electron. 2019, 74, 299. [Google Scholar] [CrossRef]
  16. Xie, L.S.; Alexandrov, E.V.; Skorupskii, G.; Proserpio, D.M.; Dinca, M. Diverse p–p stacking motifs modulate electrical conductivity in tetrathiafulvalene-based metal–organic frameworks. Chem. Sci. 2019, 10, 8558. [Google Scholar] [CrossRef] [Green Version]
  17. Schneebeli, S.T.; Kamenetska, M.; Cheng, Z.; Skouta, R.; Friesner, R.A.; Venkataraman, L.; Breslow, R. Single-Molecule Conductance through Multiple π-π-Stacked Benzene Rings Determined with Direct Electrode-to-Benzene Ring Connections. J. Am. Chem. Soc. 2011, 133, 2136. [Google Scholar] [CrossRef]
  18. Polosan, S.; Ciobotaru, I.C.; Ciobotaru, C.C. Organometallic Coatings for Electroluminescence Applications. Coatings 2020, 10, 277. [Google Scholar] [CrossRef] [Green Version]
  19. Tang, C.W.; VanSlyke, S.A. Organic electroluminescent diodes. Appl. Phys. Lett. 1987, 51, 913. [Google Scholar] [CrossRef]
  20. Ciobotaru, C.C.; Polosan, S.; Ciobotaru, I.C. Electroluminescence Properties of IrQ(ppy)2 Dual-Emitter Organometallic Compound in Organic Light-Emitting Devices. J. Elec. Mater. 2018, 47, 1490. [Google Scholar] [CrossRef]
  21. Nonoyama, M.; Yamasaki, K. Rhodium (III) complexes of benzo[h]quinoline and 2-phenylpyridine. Inorg. Nucl. Chem. Lett. 1971, 7, 943. [Google Scholar] [CrossRef]
  22. Nonoyama, M. Benzo[h]quinolin-10-yl-N Iridium (III) Complexes. Bull. Chem. Soc. Jpn. 1974, 47, 767. [Google Scholar] [CrossRef] [Green Version]
  23. Nonoyama, M. Chelating C-metallation of some organic nitrogen compounds with hexachlorotetrakis (tri-n-butylphosphine)-dirhodium (II). J. Organomet. Chem. 1975, 92, 89. [Google Scholar] [CrossRef]
  24. Nonoyama, M. Synthesis of several bis (benzo[h]quinolin-10-yl-n) rhodium (III) complexes. J. Organomet. Chem. 1974, 82, 271. [Google Scholar] [CrossRef]
  25. Ciobotaru, I.C.; Polosan, S.; Ciobotaru, C.C. Dual emitter IrQ(ppy)2 for OLED applications: Synthesis and spectroscopic analysis. J. Lumin. 2014, 145, 259. [Google Scholar] [CrossRef]
  26. Yi, C.; Yang, C.J.; Liu, J.; Xu, M.; Wang, J.H.; Cao, Q.Y.; Gao, X.C. Red to near-infrared electrophosphorescence from an iridium complex coordinated with 2-phenylpyridine and 8-hydroxyquinoline. Inorg. Chim. Acta 2007, 360, 3493. [Google Scholar] [CrossRef]
  27. Wu, Y.; Li, X.; Zhao, H.; Li, J.; Miao, Y.; Wang, H.; Zhu, F.; Xu, B. Pyrene-based hyperbranched porous polymers with doped Ir(piq)2(acac) red emitter for highly efficient white polymer light-emitting diodes. Org. Electron. 2020, 76, 105487. [Google Scholar] [CrossRef]
  28. Liu, J.; Ma, D.G.; Bai, J. Synthesis of a new iridium complex and its yellow efficient electroluminescence with low efficiency roll-off by exhaustive optimization of device. J. Lumin. 2019, 215, 116655. [Google Scholar] [CrossRef]
  29. Su, N.; Shen, C.Z.; Zheng, Y.X. Room temperature fast synthesis four-membered red iridium(III) complexes containing IreSePeS structures for OLEDs. J. Organom. Chem. 2019, 896, 188. [Google Scholar] [CrossRef]
  30. Pastor, A.; Martínez-Viviente, E. NMR spectroscopy in coordination supramolecular chemistry: A unique and powerful methodology. Coord. Chem. Rev. 2008, 252, 2314. [Google Scholar] [CrossRef]
  31. Teng, Q.; Huynh, H.V. A unified ligand electronic parameter based on 13C NMR spectroscopy of N-Heterocyclic carbene complexes. Dalton Trans. 2016, 46, 614. [Google Scholar] [CrossRef]
  32. Martschitsch, C.; Schubert, U. An NMR study on the reaction of [(k2 -P,N)- Ph2PCH2CH2NMe2]PtMe2 with activated chlorocarbons: C–Cl and C–C activation, followed by C–N cleavage of the phosphinoalkylamine ligand and formation of an ylide complex. Monatsh. Chem. 2014, 145, 577. [Google Scholar] [CrossRef]
  33. Gavriluta, A.; Büchel, G.E.; Freitag, L.; Novitchi, G.; Tommasino, J.B.; Jeanneau, E.; Kuhn, P.S.; González, L.; Arion, V.B.; Luneau, D. Mechanism Elucidation of the cis–trans Isomerization of an Azole Ruthenium–Nitrosyl Complex and Its Osmium Counterpart. Inorg. Chem. 2013, 52, 6260. [Google Scholar] [CrossRef] [PubMed]
  34. Pinto, D.C.G.A.; Santos, C.M.M.; Silva, A.M.S. Advanced NMR techniques for structural characterization of heterocyclic structures. In Recent Research Developments in Heterocyclic Chemistry, 1st ed.; Pinho e Melo, T.M.V.D., Ed.; Research Signpost: Kerala, India, 2007; Volume 37, pp. 397–475. [Google Scholar]
  35. Hetterscheid, D.G.H.; Reek, J.N.H. Me2–NHC based robust Ir catalyst for efficient water oxidation. Chem. Commun. 2011, 47, 2712. [Google Scholar] [CrossRef] [PubMed]
  36. Nakagawa, T.; Beasley, C.A.; Murray, R.W. Efficient Electro-Oxidation of Water near Its Reversible Potential by a Mesoporous IrOx Nanoparticle Film. J. Phys. Chem. C 2009, 113, 12958. [Google Scholar] [CrossRef]
  37. Taguchi, T.; Harada, J.; Kiku, A.; Tohji, K.; Shinoda, K. Development of a new in-laboratory XAFS apparatus based on new concept. J. Synchrotron Radiat. 2001, 8, 363. [Google Scholar] [CrossRef] [PubMed] [Green Version]
  38. Taguchi, T.; Harada, J.; Tohji, K.; Shinoda, K. An innovated laboratory XAFS apparatus. Adv. X-ray Anal. 2002, 45, 397. [Google Scholar]
  39. Taguchi, T.; Ozawa, T.; Yashiro, H. REX2000: Yet another XAFS analysis package. Phys. Scr. 2005, 2005, 205. [Google Scholar] [CrossRef]
  40. Rehr, J.J.; Mustre de Leon, J.; Zabinsky, S.I.; Albers, R.C. Theoretical x-ray absorption fine structure standards. J. Am. Chem. Soc. 1991, 113, 5135. [Google Scholar] [CrossRef]
  41. Hoare, R.J.; Mills, O.S. Carbon compounds of the transition metals. Part XXV. Crystal and molecular structure of acetatobis(phenylazophenyl-2C,N′)rhodium(II). J. Chem. Soc.-Dalton Trans. 1972, 19, 2138–2141. [Google Scholar] [CrossRef]
  42. Patrick, J.M.; White, A.H.; Bruce, M.I.; Beatson, M.J.; Black, D.S.; Deacon, G.B.; Thomas, N.C. Crystal structure of bis(benzo[h]quinolin-10-yl-C10,N)dicarbonylruthenium(II). J. Chem. Soc.-Dalton Trans. 1983, 9, 2121–2123. [Google Scholar] [CrossRef]
  43. Sprouse, S.; King, K.A.; Spellane, P.J.; Watts, R.J. Photophysical effects of metal-carbon. sigma. bonds in ortho-metalated complexes of iridium(III) and rhodium(III). J. Am. Chem. Soc. 1984, 106, 6647. [Google Scholar] [CrossRef]
  44. Feiters, M.C.; Longo, A.; Banerjee, D.; van der Ham, C.J.M.; Hetterscheid, D.G.H. Validation of EXAFS Analysis of Iridium Compounds. J. Phys. Conf. Ser. 2016, 712, 012059. [Google Scholar] [CrossRef] [Green Version]
  45. Graber, S. From STM to LEECs: Syntheses and Applications of Multifunctional Bipyridine Ligands and their Iridium(III) Complexes. Ph.D. Thesis, Philosophisch-Naturwissenschaftlichen Fakultat der Universitat Basel, Basel, Switzerland, 2009. [Google Scholar]
  46. Kappaun, S.; Eder, S.; Sax, S.; Mereiter, K.; List, E.J.W.; Slugovc, C. Organoiridium Quinolinolate Complexes: Synthesis, Structures, Thermal Stabilities and Photophysical Properties. Eur. J. Inorg. Chem. 2007, 16, 4207. [Google Scholar] [CrossRef]
  47. Ding, J.; Gao, J.; Fu, Q.; Cheng, Y.; Ma, D.; Wang, L. Highly efficient phosphorescent bis-cyclometalated iridium complexes based on quinoline ligands. Synth. Met. 2005, 155, 539. [Google Scholar] [CrossRef]
  48. You, Y.; Park, S.Y. Inter-Ligand Energy Transfer and Related Emission Change in the Cyclometalated Heteroleptic Iridium Complex:  Facile and Efficient Color Tuning over the Whole Visible Range by the Ancillary Ligand Structure. J. Am. Chem. Soc. 2005, 127, 12438. [Google Scholar]
Figure 1. Synthesis route of IrQ(ppy)2.
Materials 13 01617 g001
Figure 2. X-ray absorption spectra of the IrQ(ppy)2 organometallic compounds.
Materials 13 01617 g002
Figure 3. Extended X-ray absorption fine structure EXAFS k3χ(k) spectra of IrQ(ppy)2 experiments.
Materials 13 01617 g003
Figure 4. EXAFS FEFF9 calculations of IrQ(ppy)2.
Materials 13 01617 g004
Figure 5. High-performance liquid chromatography (HPLC) analysis of IrQ(ppy)2, dimer and ligands at (a) 261 and (b) 403 nm.
Materials 13 01617 g005
Figure 6. Nuclear magnetic resonance (1H NMR) spectra of 2-phenylpyridine, dimer and complex.
Materials 13 01617 g006
Figure 7. Vital NOESY correlations of IrQ(ppy)2.
Materials 13 01617 g007
Figure 8. XRD patterns of the IrQ(ppy)2 powder.
Materials 13 01617 g008
Table 1. Average coordination number obtained by EXAFS curve fitting.
ShellsStructural Model Based
on XRD a
EXAFS b
N/R (Å)NR (Å)σ22)
x10−3
1st shell1 O/2.15 Å
1 N/2.13 Å
2 N/2.03 Å
2 C/2.03 Å
6 (C,N,O) 1.97 ± 0.02 Å10 ± 3
2nd shell11 C/2.98 Å5 C
6 C
2.63 ± 0.02 Å
2.96 ± 0.03 Å
8 ± 3
6 ± 2
a—data from literature; [26] for the final compound; b—our work.
Table 2. Quinoline protons identified from total correlation spectroscopy (TOCSY) map.
No of Sets1 H- δ (ppm)
57.987.677.11
67.036.807.42
Table 3. Phenylpyridine protons identified from TOCSY map.
No of Sets1 H- δ (ppm)
18.807.007.627.79
27.867.636.797.53
36.456.797.606.92
46.306.777.606.85

