Abstract
This study presents the life-dependent material parameters concept as applied to several well-known fatigue models for the purpose of life prediction under multiaxial and non-zero mean loading. The necessity of replacing the fixed material parameters with life-dependent parameters is demonstrated. The aim of the research here is verification of the life-dependent material parameters concept when applied to multiaxial fatigue loading with non-zero mean stress. The verification is performed with new experimental fatigue test results on a 7075-T651 aluminium alloy and S355 steel subjected to multiaxial cyclic bending and torsion loading under stress ratios equal to R = −0.5 and 0.0, respectively. The received results exhibit the significant effect of the non-zero mean value of shear stress on the fatigue life of S355 steel. The prediction of fatigue life was improved when using the life-dependent material parameters compared to the fixed material parameters.
1. Introduction
Non-monotonic alternation of stress states may lead to permanent changes in the structure of materials and is often the cause of the limited functionality of machines and engineering structures [1,2,3,4]. The mechanisms leading to fatigue failure of materials are complex and depend on many factors [5]. To avoid multiscale damage modelling of material behaviours, phenomenological models are mostly applied for fatigue life prediction in engineering problems [6]. These models are usually based on a semi-empirical function of multiaxial stress/strain components correlated with fatigue life [7,8,9,10]. Unfortunately, fatigue life prediction models are very often limited; i.e., limited to a given type of material, stress path, temperature, fatigue life range, etc. There is a tendency to modify such models in order to extend their scope of operation. This has resulted in the development or modification of many models over the last few decades [10,11,12,13,14,15,16]. Functions that reduce the fluctuation of multiaxial stress states to an equivalent scalar value are an integral part of fatigue models. In the fatigue life calculation algorithm, this scalar value is compared with the corresponding reference characteristics, resulting in fatigue life estimation.
Among many criteria described in the literature, a group can be distinguished which is characterised by the assumption that components of the stress/strain vector in a material plane with a specific orientation are correlated with the fatigue life. This proposal, called the critical plane approach, has gained great interest [17,18,19,20,21,22,23,24,25,26,27,28]. Depending on the material, strain state, environment, component geometry, and stress amplitude, the fatigue process may be dominated by cracking in the plane of maximum shear or normal stresses [29,30]. For this reason, many researchers formulate fatigue criteria that are dependent on the crack mode, and the criterion itself is a certain combination of normal and shear components of the stress/strain vector in the critical plane. The stress-based criteria usually feature linear or non-linear functions of material parameters and shear τns, normal σn (in the critical plane), or hydrostatic σh (stress invariant) stresses. The criteria proposed in the literature most often assume that material parameters used in the multiaxial stress-reducing function are constant, and serve to balance the different effects of normal and shear stress components on the development of damage in the material. Their values can be estimated on the basis of experimental data, mainly for uniaxial loading. Fatigue criteria, in their original form, are usually used to assess the limit state called the fatigue limit [31,32,33,34]. Therefore, the material parameters are a function of the fatigue limits from uniaxial fatigue tests. The studies carried out by Socie [29] have shown that the dominant mechanisms of damage depend not only on the loading and type of material but also on the fatigue life. Socie [35,36] noted that for stainless steel 304 and Inconel 718 and 1045, the crack nucleation period is controlled by shear stress, which increases with fatigue life when compared to that controlled by normal stress. Based on these observations, it can be concluded that the material parameters assessing the effect of shear and normal stress on fatigue life are not constant, but instead dependent on life. The phenomenon of the life dependency of the material parameters in multiaxial fatigue models has been analysed in [21,37,38,39,40,41]. It was demonstrated that the life-dependent material parameters can be successfully applied to multiaxial stress- and strain-based fatigue life prediction models under cyclic proportional and non-proportional loading paths with zero mean stress. The variability of the material parameters over the fatigue life range strongly depends on the uniaxial fatigue stress/strain–life curves. For materials with parallel uniaxial fatigue curves, the material parameters are independent of the fatigue life, and as a result, they can be considered as fixed.
Additional static loading could be an important factor affecting fatigue life [42,43]. A non-zero mean value of the stress is often caused by the effect of self-weight of the working element as well as the effect of initial tension in load-bearing elements (e.g., belts in gearboxes) or residual stresses [44,45,46,47]. The effectiveness of multiaxial fatigue models with life-dependent material parameters under cyclic multiaxial with zero mean stress has been validated in a few research papers [21,37,39]. For fatigue loading with a non-zero mean stress, the life-dependent material parameters concept was analysed only in [48], which focused on the algorithm of lifetime calculation, including the concept of life-dependent material parameters. The proposed concept needs to be further verified with a larger group of materials and models.
The aim of this work is to verify the life-dependent material parameters concept when applied to the fatigue life prediction of a 7075-T651 aluminium alloy and S355 steel under multiaxial fatigue loading with a non-zero mean stress. The results of the new experimental fatigue tests under uniaxial and multiaxial cyclic bending and torsion loading with stress ratios equal to R = −0.5 and 0.0, respectively, are presented here. Several well-known stress-based fatigue life prediction models are implemented. For the first time, the life-dependent material parameter concept has been introduced to the Crossland [49], Papadopoulos [50,51], and Papuga–Růžička [52] criteria under fatigue loading while including a non-zero mean stress.
2. Multiaxial Fatigue Life Models with Life-Dependent Material Parameters
The life-dependent material parameters concept analysed in this paper concerns the wide group of multiaxial fatigue life prediction models with the following shared assumptions; namely, (i) there is a scalar function of spatial stress/strain components and the material parameters, , are equivalent to the stress/strain state under uniaxial loading (equivalent with respect to the fatigue life); (ii) the fluctuating stress/strain histories could be replaced by the amplitudes and mean values of counted loading cycles. Most of the fatigue models based on the critical plane approach including stress-based, strain-based, and energy-based models [7,53], but also models based on the stress invariants [54] belonging to this group. The general equation for fatigue life prediction can be presented as follows:
where is the reference fatigue characteristic, relating the stress/strain amplitude with the number of cycles to failure under uniaxial cyclic loading. The material parameters are identified by applying Equation (1) to uniaxial loading. Most fatigue models in the analysed group distinguish shear and normal stress/strain components in the critical plane or deviatoric and hydrostatic stress invariant components to be crucial for determining the fatigue failure of metallic materials. As a consequence, the material parameters serve as the weighting factors of shear and tensile selected stress/strain components. For a wide range of cycles to failure, K is not a constant value as the mechanisms of fatigue failure depend essentially on the value of the applied load. The variability of K can be demonstrated by identifying its value using uniaxial loading. For example, for the applied uniaxial stress state with amplitude leading to failure at number of cycles, Equation (1) with the reference S–N curve for torsion loading can be shown as:
The parameter K can be found by solving the above equation relative to K, obtaining the function f in its general form as follows:
The same identifying procedure should be applied to the strain- and energy-based fatigue models that lead to conclusions of the life dependency of material parameters when introduced as weighting factors into the stress/strain reducing function .
3. Stress-Based Multiaxial Fatigue Models
To verify the proposed methodology for fatigue life calculation covering the variability of material parameters depending on the number of cycles to failure, fatigue models were selected with significant differences in stress-reducing function and definition of the critical plane. Since the selected models are well documented in many papers, only a brief summary is given below. The application of material fatigue models for fatigue life estimation consists of calculating the equivalent stress value σeq and comparing it with the material S–N curve. In the analysed models, the material parameters are mainly a function of the ratio of torsion fatigue strength to axial fatigue strength; i.e., . The fatigue models and their life-dependent material parameters are shown in Table 1. The first column in Table 1 presents the selected semi-empirical stress-based functions for fatigue life calculation in the form of equations with the life-dependent material parameters (the names of inventors are also included). The second column presents the formulae of the life-dependent material parameters applied to a particular model. Among the seven selected models, there is one based on stress invariants (the Crossland model) and six critical plane approach models. The critical plane orientation is determined as the plane of maximum shear stress (Matake, Dang Van, and Papadopoulos models), the plane with maximum equivalent stress value (Stulen–Cummings–Findley and Papuga–Růžička models), or the plane shifted by the angle with respect to the average principal stress directions (Carpinteri–Spagnoli model). The mean value of loading is taken into account in the presented models, expect for the Matake one, by superimposing the mean value to the amplitude of normal or hydrostatic stresses. In the Matake model, the mean value is not included.

Table 1.
Selected models for fatigue life estimation with the life-dependent material parameters.
In [60], Carpinteri et al. found that static normal stresses imposed on cyclically changing normal stresses significantly reduce fatigue strength, while mean shear stresses do not affect fatigue life. The modification adopted in [60] comprises the implementation of the Goodman [61] model to the Carpinteri–Spagnoli criterion [59] and takes the following form:
In this paper, it is proposed that Morrow’s correction be included [62], which is applied to the mean value of the normal stress. The result is that the mean stress is reduced by the axial fatigue strength coefficient and the fatigue model can be described with the following equation:
4. Experimental Research
Experimental tests for the analysed materials were carried out under the load of constant amplitude plane-bending moment , torsion moment , and two combinations of proportional bending and torsion with ratios of applied stress amplitudes of and . The plane bending and torsion were generated by a single force applied to lever with a length of 0.2 m. The rotation of specimen by angle with respect to the lever decomposes the principal moment into bending and torsion moments with a fixed ratio for a given angle . Details of the applied fatigue stand can be found in [63]. The applied frequency of loading varied between 5 and 30 Hz, depending on the applied stress amplitudes. The tests included loading with the stress ratio R equal to −1, −0.5, and 0. A specimen stiffness drop equal to 20% defines the fatigue failure. Figure 1 shows the geometry of the specimen used for testing.

Figure 1.
Geometry of the specimen.
S355 steel specimens were manufactured from a rolled bar with a diameter of 22 mm in the as-delivered condition. The chemical composition and basic strength properties are shown in Table 2. Aluminium alloy 7075-T651 specimens were manufactured from an extruded bar with a diameter of 16 mm in the as-delivered condition. The chemical composition and basic mechanical properties are presented in Table 3 and Table 4, respectively.
Table 2.
Chemical composition of S355 steel (wt.%).
Table 3.
Chemical composition of aluminium alloy 7075-T651 (wt %).
Table 4.
Basic mechanical properties for the analysed materials.
The results of the experimental studies were used to determine the uniaxial fatigue characteristics (S–N curves) in the following form:
For cyclic bending and torsion, where A and m are linear regression factors, is the amplitude or maximum value of the stress in the cycle according to the selected loading (Table 5). Fatigue characteristics for fully reversed bending and torsion (R = −1) and for zero-pulsating bending (R = 0) along with a fatigue scatter band with [64,65] are presented in Figure 2a for S355 steel and in Figure 3a for 7075-T651 aluminium alloy. The fatigue scatter band for each experimental fatigue life was calculated by applying the following formula:
Table 5.
Regression coefficients of the fatigue characteristics with intervals for a 95% confidence level.
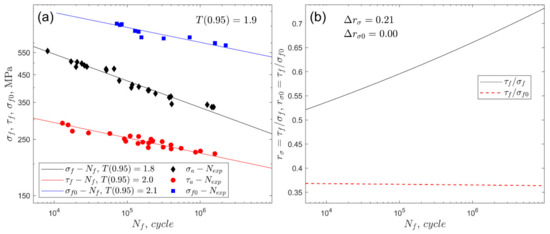
Figure 2.
(a) Fatigue characteristics of the S355 steel for fully reversed bending , torsion , and the zero-pulsating bending (R = 0). (b) Fatigue strength ratios and .

Figure 3.
(a) Fatigue characteristics of the aluminium alloy 7075-T651 for fully reversed bending , torsion , and the zero-pulsating bending (R = 0). (b) Fatigue strength ratios and .
The empirical cumulative distribution of was used to calculate for a 0.95 probability. The shape-preserving piecewise cubic interpolation was applied to find at 0.95 probability. The value of presents the required fatigue scatter band around the fitted S–N curve to include 95% of data. In addition, Figure 2b (for steel S355) and 3b (for aluminium alloy 7075-T651) show graphs of the ratio of fatigue strengths in fully reversed torsion to axial stress at R = −1 and 0. The range of the ratio for the analysed number of cycles was for steel S355, and for aluminium alloy 7075-T651. The variation in is related to the zero-pulsating bending loading, and for both steel and aluminium, the variation was insignificant (red dashed lines in Figure 2b and Figure 3b).
The variability of the normalised life-dependent material parameters applied in the multiaxial fatigue models is shown in Figure 4 and Figure 5. The maximum values of each material parameter along with their ranges, normalised by maximum value, are included in the legends of Figure 4 and Figure 5. The highest relative change in the material parameters was observed for the Crossland model for both tested materials.
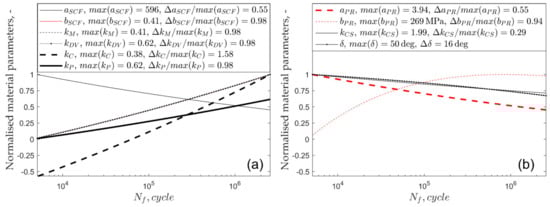
Figure 4.
Normalised material parameters in the function of number of cycles to failure for S355 steel: (a) linear models and (b) non-linear models.

Figure 5.
Normalised material parameters in the function of number of cycles to failure for aluminium alloy 7075-T651: (a) linear models and (b) non-linear models.
Exemplary photos of macroscopic fatigue cracks in S335 steel and 7075-T651 aluminium alloy are presented in Figure 6 and Figure 7, respectively. Dye penetrant inspection was applied to reveal the surface cracks presented in Figure 6 and Figure 7. The macroscopic cracks on the specimen surfaces are perpendicular to the applied stress under cyclic bending and independent of the number of cycles for the failure of S355 steel (Figure 6a). However, under cyclic torsion loading, the macroscopic crack mode depends on the number of cycles for failure. For shorter fatigue lives below 30,000 cycles, a pure shear mode was observed (Figure 6b). Increasing the number of cycles to failure, cracks under the shear mode became shorter, along with additional tensile crack mode. Above 400,000 cycles for failure, only a tensile macroscopic crack mode was observed (Figure 6b). Those observations of the crack mode, depending on the number of cycles for failure, could explain the life dependency of the material parameters analysed in the present paper.

Figure 6.
Exemplary photos of fatigue cracks under cyclic (a) bending and (b) torsion loads for the S355 steel.

Figure 7.
Exemplary photos of fatigue cracks under cyclic (a) bending and (b) torsion loads for the 7075-T651 aluminium alloy.
For the 7075-T651 aluminium alloy, the macroscopic cracks under cyclic bending observed on the specimen surface are perpendicular to the applied stress. Multiple cracks were observed for shorter fatigue lives (Figure 7a), while a single dominant crack was observed for lives above 10,000 cycles. Under cyclic torsion, the pure shear crack mode was observed for fatigue lives of below 600,000 cycles to failure (Figure 7b). An additional tensile crack mode was noted in specimens with fatigue life above 600,000 cycles (Figure 6b).
Variation of dominant damage mechanism (crack mode or/and number of initiated cracks) depending on the number of cycles to failure results in the life-dependent ratio of fatigue strengths , and as a consequence, the material parameters applied in multiaxial models must also be life-dependent. All experimental results are included in Appendix A.
5. Results and Analysis
The performance of the life-dependent material parameters applied to the fatigue life models was assessed on the basis of the fatigue scatter band (Equation (7), where was replaced by ) at a confidence level of 0.95 [21,64,65]. Its value presents the required uniform scatter band around the perfect agreement to include 95% of data. A lower value of the coefficient exhibits improved correlation for the experimental and calculated fatigue lives. The experimental fatigue scatter bands presented in Figure 2a and Figure 3a, which were determined for uniaxial loading, must be used as reference values for the proper validation of multiaxial fatigue models.
The number of cycles to failure, , was calculated using two methods; namely, those with fixed and life-dependent material parameters. For the first method, the material constants were calculated from the S–N curves at a reference number of cycles equal to 2 × 10⁶.
Due to the large number of calculation results, only two exemplary figures (Figure 8 and Figure 9) with the comparison of the experimental and calculated fatigue lives are presented. Each legend of Figure 8 and Figure 9 shows the fatigue scatter calculated separately for each type of loading, and the overall scatter band is presented in upper-left corner of the plot. The dashed lines indicate a scatter band with a value equal to 3 and the continuous line indicates a perfect match. Figure 8 and Figure 9 show the percentages of the conservative results, where . Those exemplary presented figures present the results obtained with the application of the Crossland model. In general, similar characteristics of the results were obtained for all the applied fatigue models. As a result of zero hydrostatic stress under pure torsion loading, the value of the material parameters does not affect the equivalent stress in the Crossland model. Thus, the points in the plots (Figure 8 and Figure 9) under pure torsion are located in the same position, independent of the applied material parameters concept. According to the results obtained under pure torsion, the non-zero mean value of shear stress has a significant influence on the fatigue life for S355 steel and less of an effect for the 7075-T651 aluminium alloy. This effect was not taken into account in the analysed fatigue models, for which only the non-zero mean value of the normal or hydrostatic stress influences the fatigue life.

Figure 8.
Experimental and calculated fatigue lives for the Crossland model under R = −0.5 for S355 steel: (a) fixed material parameters; (b) life-dependent material parameters.

Figure 9.
Experimental and calculated fatigue lives for the Crossland model under R = −0.5 for 7075-T651 aluminium alloy: (a) fixed material parameters; (b) life-dependent material parameters.
A summary of calculation results for all types of loading is presented in Figure 10, Figure 11, Figure 12 and Figure 13. The values of the coefficient for all analysed models using the fixed and life-dependent values of material parameters are presented in panel (a) of Figure 10, Figure 11, Figure 12 and Figure 13. Panel (b) of Figure 10, Figure 11, Figure 12 and Figure 13 present the change of (i.e., denotes an improvement of the fatigue life prediction due to the application of the life-dependent material parameters).
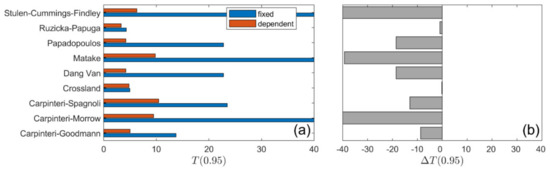
Figure 10.
Summary comparison of calculation results for the analysed models under R = 0.0 for S355 steel: (a) fatigue scatter band and (b) change in the fatigue scatter band for all analysed fatigue models.
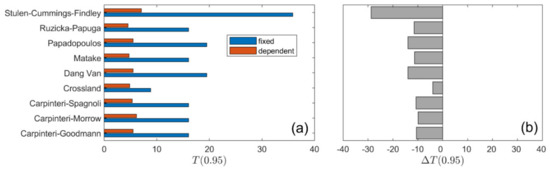
Figure 11.
Summary comparison of calculation results for the analysed models under R = −0.5 for S355 steel: (a) fatigue scatter band and (b) change in the fatigue scatter band for all analysed fatigue models.
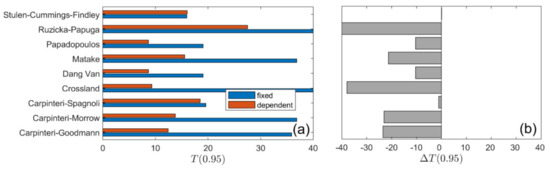
Figure 12.
Summary comparison of calculation results for the analysed models under R = 0.0 for 7075-T651 aluminium alloy: (a) fatigue scatter band and (b) change in the fatigue scatter band for all analysed fatigue models.

Figure 13.
Summary comparison of calculation results for the analysed models under R = −0.5 for 7075-T651 aluminium alloy: (a) fatigue scatter band and (b) change in the fatigue scatter band for all the analysed fatigue models.
Due to the application of the life-dependent material parameters, the calculated fatigue lives better correlate with the experimental fatigue lives for all analysed fatigue models.
For S355 steel, the lowest value of was obtained for the Papuga–Růžička model; i.e., under and under . However, those values are still unsatisfactory if compared to the experimental value of the fatigue scatter band equal to 1.9 (Figure 2a). This is mainly due to the apparent effect of the non-zero mean shear stress on the fatigue life for S355 steel, which is not taken into account in the models analysed here.
For the 7075-T651 aluminium alloy, the effect of a non-zero shear stress is pronounced for higher mean values, i.e., pronounced under , whereas the effect when is insignificant. Under the stress ratio , the lowest value of , equal to 8.7, was received for the Dang Van and Papadopoulos models with the life-dependent material parameters (Figure 12). The value of 8.7 is unacceptable, since it is more than three times higher than the experimental scatter, equal to 2.4 (Figure 3a). For a lower value of mean stress, i.e., under stress ratio , better consistency of the calculated and experimental fatigue lives was obtained (Figure 13). The lowest value of , equal to 3.1, was received for the Crossland model (see also Figure 9b) with the application of the life-dependent material parameters. The value of 3.1 is only 30% higher than the experimental value, which is equal to 2.4 (Figure 3a).
The inclusion of Goodman’s (Equation (4)) and Morrow’s (Equation (5)) corrections in the Carpinteri–Spagnoli model for S355 steel and 7075-T651 aluminium alloy improved the correlation of results under the stress ratio with respect to the basic form of the model, while under ratio , all three model forms give similar results.
6. Conclusions
The following conclusions can be drawn from our analyses:
- The application of the life-dependent material parameters improved the consistency of the experimental and calculated fatigue lives for all analysed fatigue models and for both S355 steel and 7075-T651 aluminium alloy under non-zero mean stress.
- The best (though still unsatisfactory) consistency of the experimental and calculated fatigue lives was obtained for the Papuga–Růžička model for the S355 steel for both stress ratios of R = 0 and −0.5.
- The best and satisfactory consistency of the experimental and calculated fatigue lives was obtained for the Crossland model with the life-dependent material parameters for the 7075-T651 aluminium alloy with a stress ratio of R = −0.5.
- The reduction of mean stress with Goodman’s and Morrow’s corrections in the Carpinteri–Spagnoli model resulted in insignificant improvement of the calculation results in comparison with the experimental ones.
- A non-zero shear stress has a pronounced effect on the fatigue life of S355 steel for both stress ratios but shows an insignificant influence for the 7075-T651 aluminium alloy under a stress ratio of R = −0.5.
Author Contributions
Experiment, writing—original draft, K.K. and A.K.; methodology, writing—editing, S.D. All authors have read and agreed to the published version of the manuscript.
Funding
This research was founded by the National Science Centre, Poland grant number 2017/25/B/ST8/00684.
Conflicts of Interest
The authors declare no conflict of interest.
Nomenclature
| Material parameters for Papuga–Růžička criterion | |
| Material parameters for Stulen–Cummings–Findley criterion | |
| Material parameters for the Crossland, Dang Van, Carpinteri–Spagnoli, Matake, and Papadopoulos criteria, respectively | |
| Number of cycles for failure | |
| Ratio of fatigue strength in fully reversed torsion to axial stress (R = −1) at a given number of cycles to failure | |
| Ratio of fatigue strength in fully reversed torsion to zero-pulsating axial stress (R = 0) at a given number of cycles to failure | |
| Range of observed over the span of experimental fatigue lives | |
| Fatigue strength in fully reversed axial loading at a given number of cycles to failure | |
| Fatigue strength in zero-pulsating axial loading at a given number of cycles to failure | |
| Maximum value of normal and hydrostatic stresses, respectively | |
| Normal and shear stress amplitudes on critical plane, respectively | |
| Axial fatigue strength coefficient | |
| Fatigue strength in fully reversed torsion loading at given number of cycles to failure | |
| R | Stress ratio, |
| Fatigue scatter band for a 95% confidence level | |
| Average resolved shear stress amplitude for the Papadopoulos et al. criterion | |
| Amplitude of second invariant of stress deviator tensor |
Appendix A
Table A1.
Experimental results for the 7075-T651 aluminium alloy obtained under cyclic bending, torsion, and combined bending–torsion with different stress ratios.
Table A1.
Experimental results for the 7075-T651 aluminium alloy obtained under cyclic bending, torsion, and combined bending–torsion with different stress ratios.
| Bendingτa/σa = 0 | Torsionτa/σa = ∞ | τa/σa = 0.5 | τa/σa = 0 | ||||||||||||||||
|---|---|---|---|---|---|---|---|---|---|---|---|---|---|---|---|---|---|---|---|
| σm, MPa | σa, MPa | Nexp Cycle | R | τm MPa | τa MPa | Nexp Cycle | R | σm, MPa | τm MPa | σa, MPa | τa MPa | Nexp Cycle | R | σm, MPa | τm MPa | σa, MPa | τa MPa | Nexp Cycle | R |
| 68 | 203 | 1,523,893 | −0.5 | 30 | 90 | 3,953,694 | −0.5 | 43 | 21 | 129 | 64 | 975,519 | −0.5 | 27 | 27 | 82 | 82 | 1,876,707 | −0.5 |
| 68 | 203 | 631,997 | −0.5 | 34 | 102 | 1,262,091 | −0.5 | 43 | 21 | 129 | 64 | 2,067,037 | −0.5 | 31 | 31 | 93 | 93 | 996,202 | −0.5 |
| 68 | 204 | 1,716,588 | −0.5 | 41 | 124 | 925,686 | −0.5 | 47 | 23 | 140 | 70 | 757,509 | −0.5 | 35 | 35 | 104 | 104 | 614,205 | −0.5 |
| 74 | 223 | 690,995 | −0.5 | 46 | 138 | 636,996 | −0.5 | 47 | 23 | 140 | 70 | 712,709 | −0.5 | 38 | 38 | 113 | 113 | 422,002 | −0.5 |
| 75 | 225 | 432,390 | −0.5 | 50 | 150 | 429,692 | −0.5 | 50 | 25 | 149 | 75 | 745,302 | −0.5 | 42 | 42 | 127 | 127 | 219,502 | −0.5 |
| 90 | 271 | 101,787 | −0.5 | 55 | 166 | 334,798 | −0.5 | 55 | 28 | 166 | 83 | 393,205 | −0.5 | 45 | 45 | 135 | 135 | 178,541 | −0.5 |
| 92 | 275 | 72,687 | −0.5 | 57 | 171 | 142,299 | −0.5 | 56 | 28 | 167 | 83 | 504,501 | −0.5 | 74 | 74 | 74 | 74 | 697,911 | 0 |
| 154 | 154 | 1,508,904 | 0 | 67 | 201 | 37,593 | −0.5 | 56 | 28 | 167 | 83 | 820,308 | −0.5 | 82 | 82 | 82 | 82 | 523,704 | 0 |
| 154 | 154 | 764,990 | 0 | 68 | 204 | 34,095 | −0.5 | 62 | 31 | 185 | 92 | 358,706 | −0.5 | 93 | 93 | 93 | 93 | 476,404 | 0 |
| 168 | 168 | 582,995 | 0 | 96 | 96 | 1,290,395 | 0 | 62 | 31 | 186 | 93 | 376,619 | −0.5 | 93 | 93 | 93 | 93 | 373,300 | 0 |
| 197 | 197 | 400,700 | 0 | 111 | 111 | 480,495 | 0 | 66 | 33 | 197 | 99 | 181,717 | −0.5 | 108 | 108 | 108 | 108 | 275,300 | 0 |
| 197 | 197 | 323,796 | 0 | 127 | 127 | 447,295 | 0 | 66 | 33 | 198 | 99 | 233,104 | −0.5 | 109 | 109 | 109 | 109 | 188,406 | 0 |
| 218 | 218 | 313,789 | 0 | 92 | 46 | 92 | 46 | 2,169,502 | 0 | 115 | 115 | 115 | 115 | 143,007 | 0 | ||||
| 220 | 220 | 124,694 | 0 | 101 | 51 | 101 | 51 | 833,511 | 0 | ||||||||||
| 223 | 223 | 115,395 | 0 | 123 | 61 | 123 | 61 | 443,000 | 0 | ||||||||||
| 231 | 231 | 110,004 | 0 | 142 | 71 | 142 | 71 | 268,005 | 0 | ||||||||||
| 231 | 231 | 234,899 | 0 | 153 | 77 | 153 | 77 | 166,014 | 0 | ||||||||||
| 235 | 235 | 96,293 | 0 | 168 | 84 | 168 | 84 | 134,507 | 0 | ||||||||||
Table A2.
Experimental results for the S355 steel obtained under cyclic bending, torsion, and combined bending–torsion with different stress ratios.
Table A2.
Experimental results for the S355 steel obtained under cyclic bending, torsion, and combined bending–torsion with different stress ratios.
| Bending τa/σa = 0 | Torsion τa/σa = ∞ | τa/σa = 0.5 | τa/σa = 0 | ||||||||||||||||
|---|---|---|---|---|---|---|---|---|---|---|---|---|---|---|---|---|---|---|---|
| σm, MPa | σa, MPa | Nexp | R | τm MPa | τa MPa | Nexp | R | σm, MPa | τm MPa | σa, MPa | τa MPa | Nexp | R | σm, MPa | τm MPa | σa, MPa | τa MPa | Nexp | R |
| 111 | 333 | 1,801,499 | −0.5 | 67 | 201 | 996,086 | −0.5 | 85 | 42 | 254 | 127 | 4,656,299 | −0.5 | 55 | 57 | 169 | 170 | 3,841,512 | −0.5 |
| 114 | 342 | 1,542,186 | −0.5 | 68 | 203 | 1,685,203 | −0.5 | 87 | 44 | 262 | 131 | 2,599,907 | −0.5 | 56 | 58 | 173 | 174 | 3,105,012 | −0.5 |
| 118 | 353 | 866,891 | −0.5 | 68 | 205 | 1,422,090 | −0.5 | 88 | 44 | 263 | 131 | 1,270,000 | −0.5 | 58 | 60 | 178 | 179 | 965,013 | −0.5 |
| 118 | 354 | 626,788 | −0.5 | 69 | 207 | 757,790 | −0.5 | 91 | 45 | 273 | 136 | 765,871 | −0.5 | 58 | 60 | 178 | 179 | 818,518 | −0.5 |
| 123 | 369 | 242,798 | −0.5 | 73 | 218 | 564,086 | −0.5 | 93 | 47 | 280 | 140 | 335,509 | −0.5 | 61 | 63 | 187 | 188 | 192,004 | −0.5 |
| 124 | 372 | 311,898 | −0.5 | 73 | 218 | 320,685 | −0.5 | 94 | 47 | 283 | 141 | 523,793 | −0.5 | 62 | 63 | 188 | 189 | 207,013 | −0.5 |
| 133 | 399 | 99,995 | −0.5 | 75 | 226 | 202,991 | −0.5 | 97 | 49 | 291 | 146 | 302,520 | −0.5 | 144 | 145 | 144 | 145 | 7,919,304 | 0 |
| 136 | 409 | 122,893 | −0.5 | 77 | 230 | 99,000 | −0.5 | 100 | 50 | 300 | 150 | 242,823 | −0.5 | 148 | 150 | 148 | 150 | 1,030,312 | 0 |
| 294 | 294 | 2,235,000 | 0 | 101 | 50 | 303 | 151 | 96,505 | −0.5 | 149 | 150 | 149 | 150 | 444,310 | 0 | ||||
| 299 | 299 | 1,601,000 | 0 | 101 | 51 | 303 | 152 | 68,100 | −0.5 | 154 | 155 | 154 | 155 | 632,115 | 0 | ||||
| 300 | 300 | 1,587,403 | 0 | 222 | 111 | 222 | 111 | 2,043,504 | 0 | 160 | 161 | 160 | 161 | 382,914 | 0 | ||||
| 313 | 313 | 316,499 | 0 | 223 | 112 | 223 | 112 | 564,573 | 0 | 161 | 162 | 161 | 162 | 397,702 | 0 | ||||
| 316 | 316 | 156,590 | 0 | 223 | 112 | 223 | 112 | 1,144,008 | 0 | 166 | 167 | 166 | 167 | 194,006 | 0 | ||||
| 316 | 316 | 717,396 | 0 | 224 | 112 | 224 | 112 | 721,904 | 0 | ||||||||||
| 332 | 332 | 143,087 | 0 | 230 | 115 | 230 | 115 | 624,804 | 0 | ||||||||||
| 335 | 335 | 128,400 | 0 | 231 | 115 | 231 | 115 | 600,007 | 0 | ||||||||||
| 353 | 353 | 79,693 | 0 | 238 | 119 | 238 | 119 | 371,704 | 0 | ||||||||||
| 356 | 356 | 84,397 | 0 | 238 | 119 | 238 | 119 | 394,501 | 0 | ||||||||||
| 358 | 358 | 72,058 | 0 | ||||||||||||||||
References
- Yu, Z.; Zhu, S.; Liu, Q.; Liu, Y. A New Energy-Critical Plane Damage Parameter for Multiaxial Fatigue Life Prediction of Turbine Blades. Materials 2017, 10, 513. [Google Scholar] [CrossRef] [PubMed]
- Romanowicz, P.; Szybiński, B. Fatigue Life Assessment of Rolling Bearings Made from AISI 52100 Bearing Steel. Materials 2019, 12, 371. [Google Scholar] [CrossRef] [PubMed]
- Xu, X.; Lai, J.; Lohmann, C.; Tenberge, P.; Weibring, M.; Dong, P. A model to predict initiation and propagation of micro-pitting on tooth flanks of spur gears. Int. J. Fatigue 2019, 122, 106–115. [Google Scholar] [CrossRef]
- Kiani, M.; Fry, G.T. Fatigue analysis of railway wheel using a multiaxial strain-based critical-plane index. Fatigue Fract. Eng. Mater. Struct. 2018, 41, 412–424. [Google Scholar] [CrossRef]
- Sangid, M.D. The physics of fatigue crack initiation. Int. J. Fatigue 2013, 57, 58–72. [Google Scholar] [CrossRef]
- D’Amore, A.; Grassia, L. Comparative study of phenomenological residual strength models for composite materials subjected to fatigue: Predictions at Constant Amplitude (CA) loading. Materials 2019, 12, 3398. [Google Scholar] [CrossRef]
- Karolczuk, A.; Macha, E. A review of critical plane orientations in multiaxial fatigue failure criteria of metallic materials. Int. J. Fract. 2005, 134, 267–304. [Google Scholar] [CrossRef]
- You, B.R.; Lee, S.B. A critical review on multiaxial fatigue assessments of metals. Int. J. Fatigue 1996, 18, 235–244. [Google Scholar] [CrossRef]
- Kluger, K.; Pawliczek, R. Assessment of Validity of Selected Criteria of Fatigue Life Prediction. Materials 2019, 12, 2310. [Google Scholar] [CrossRef]
- Zhu, S.P.; Yu, Z.Y.; Correia, J.; De Jesus, A.; Berto, F. Evaluation and comparison of critical plane criteria for multiaxial fatigue analysis of ductile and brittle materials. Int. J. Fatigue 2018, 112, 279–288. [Google Scholar] [CrossRef]
- Wang, J.; Wei, D.; Wang, Y.; Jiang, X. A fatigue life prediction model based on modified resolved shear stress for nickel-based single crystal superalloys. Metals 2019, 9, 180. [Google Scholar] [CrossRef]
- Zhou, J.; Huang, H.Z.; Li, H. A novel energy-critical multiaxial fatigue life prediction for low cycle fatigue under mixed-mode loading. Metals 2018, 8, 1066. [Google Scholar] [CrossRef]
- Tak, N.H.; Kim, J.; Lim, J. An Energy-Based Unified Approach to Predict the Low-Cycle Fatigue Life of Type 316L Stainless Steel under Various Temperatures and Strain-Rates. Materials 2019, 12, 1090. [Google Scholar] [CrossRef] [PubMed]
- Benedetti, M.; Berto, F.; Le Bone, L.; Santus, C. A novel Strain-Energy-Density based fatigue criterion accounting for mean stress and plasticity effects on the medium-to-high-cycle uniaxial fatigue strength of plain and notched components. Int. J. Fatigue 2020, 133, 105397. [Google Scholar] [CrossRef]
- Zhang, W.; Jiang, T.; Liu, L. Low Cycle Fatigue Life Prediction Model of 800H Alloy Based on the Total Strain Energy. Materials 2020, 13, 76. [Google Scholar] [CrossRef]
- Lu, Y.; Wu, H.; Zhong, Z. A modified energy-based model for low-cycle fatigue life prediction under multiaxial irregular loading. Int. J. Fatigue 2019, 128, 105187. [Google Scholar] [CrossRef]
- Kenmeugne, B.; Soh Fotsing, B.D.; Anago, G.F.; Fogue, M.; Robert, J.L.; Kenne, J.P. On the evolution and comparison of multiaxial fatigue criteria. Int. J. Eng. Technol. 2012, 4, 37–46. [Google Scholar]
- Cruces, A.S.; López-Crespo, P.; Moreno, B.; Antunes, F. V Multiaxial Fatigue Life Prediction on S355 Structural and Offshore Steel Using the SKS Critical Plane Model. Metals 2018, 8, 1060. [Google Scholar] [CrossRef]
- Carpinteri, A.; Karolczuk, A.; Macha, E.; Vantadori, S. Expected position of the fatigue fracture plane by using the weighted mean principal Euler angles. Int. J. Fract. 2002, 115, 87–99. [Google Scholar] [CrossRef]
- Karolczuk, A.; Macha, E. Critical planes in multiaxial fatigue. Mater. Sci. Forum 2005, 482, 109–114. [Google Scholar] [CrossRef]
- Hemmesi, K.; Farajian, M.; Fatemi, A. Application of the critical plane approach to the torsional fatigue assessment of welds considering the effect of residual stresses. Int. J. Fatigue 2017, 101, 271–281. [Google Scholar] [CrossRef]
- Chen, X.; Xu, S.; Huang, D. A critical plane-strain energy density criterion for multiaxial low-cycle fatigue life under non-proportional loading. Fatigue Fract. Eng. Mater. Struct. 1999, 22, 679–686. [Google Scholar] [CrossRef]
- Karolczuk, A.; Kluger, K.; Łagoda, T. A correction in the algorithm of fatigue life calculation based on the critical plane approach. Int. J. Fatigue 2016, 83, 174–183. [Google Scholar] [CrossRef]
- Yu, Z.Y.; Zhu, S.P.; Liu, Q.; Liu, Y. Multiaxial fatigue damage parameter and life prediction without any additional material constants. Materials 2017, 10, 923. [Google Scholar] [CrossRef] [PubMed]
- Zhu, H.; Wu, H.; Lu, Y.; Zhong, Z. A novel energy-based equivalent damage parameter for multiaxial fatigue life prediction. Int. J. Fatigue 2019, 121, 1–8. [Google Scholar] [CrossRef]
- Zhu, S.-P.; Yu, Z.-Y.; Liu, Q.; Ince, A. Strain energy-based multiaxial fatigue life prediction under normal/shear stress interaction. Int. J. Damage Mech. 2019, 28, 708–739. [Google Scholar] [CrossRef]
- Xu, S.; Zhu, S.-P.; Hao, Y.-Z.; Liao, D. Critical plane–based multiaxial fatigue life prediction of turbine disk alloys by refining normal stress sensitivity. J. Strain Anal. Eng. Des. 2018, 53, 719–729. [Google Scholar] [CrossRef]
- Zhuang, W.Z.; Halford, G.R. Investigation of residual stress relaxation under cyclic load. Int. J. Fatigue 2001, 23, 31–37. [Google Scholar] [CrossRef]
- Socie, D.F. Critical plane approaches for multiaxial fatigue damage assessment. Am. Soc. Test. Mater. 1993, 1, 7–36. [Google Scholar]
- Gates, N.R.; Fatemi, A. On the consideration of normal and shear stress interaction in multiaxial fatigue damage analysis. Int. J. Fatigue 2017, 100, 322–336. [Google Scholar] [CrossRef]
- Feng, E.S.; Wang, X.G.; Jiang, C. A new multiaxial fatigue model for life prediction based on energy dissipation evaluation. Int. J. Fatigue 2019, 122, 1–8. [Google Scholar] [CrossRef]
- Lu, C.; Melendez, J.; Martínez-Esnaola, J.M. A universally applicable multiaxial fatigue criterion in 2D cyclic loading. Int. J. Fatigue 2018, 110, 95–104. [Google Scholar] [CrossRef]
- Matsubara, G.; Hayashida, A.; Kano, D. Predicting the multiaxial fatigue limit and the multiaxial high-cycle fatigue life based on the unified equivalent shear stress from axial strength characteristics with various waveforms. Int. J. Fatigue 2018, 112, 52–62. [Google Scholar] [CrossRef]
- Papuga, J. A survey on evaluating the fatigue limit under multiaxial loading. Int. J. Fatigue 2011, 33, 153–165. [Google Scholar] [CrossRef]
- Socie, D.F.; Waill, L.A.; Dittmer, D.F. Biaxial fatigue of Inconel 718 including mean stress effects. Am. Soc. Test. Mater. 1985, 8, 463–481. [Google Scholar]
- Sakane, M.; Itoh, T.; Kida, S.; Ohnami, M.; Socie, D.F. Dislocation Structure and Non-Proportional Hardening of Type 304 Stainless Steel; Opole University of Technology: Cracow, Poland, 1997; pp. 189–206. [Google Scholar]
- Karolczuk, A.; Papuga, J.; Palin-Luc, T. Progress in fatigue life calculation by implementing life-dependent material parameters in multiaxial fatigue criteria. Int. J. Fatigue 2020, 134, 105509. [Google Scholar] [CrossRef]
- Karolczuk, A.; Skibicki, D.; Pejkowski, Ł. Evaluation of the Fatemi-Socie damage parameter for the fatigue life calculation with application of the Chaboche plasticity model. Fatigue Fract. Eng. Mater. Struct. 2019, 42, 197–208. [Google Scholar] [CrossRef]
- Karolczuk, A. Analysis of revised fatigue life calculation algorithm under proportional and non-proportional loading with constant amplitude. Int. J. Fatigue 2016, 88, 111–120. [Google Scholar] [CrossRef]
- Kluger, K.; Karolczuk, A.; Robak, G. Validation of multiaxial fatigue criteria application to lifetime calculation of S355 steel under cyclic bending-torsion loading. Procedia Struct. Integr. 2019, 23, 89–94. [Google Scholar] [CrossRef]
- Karolczuk, A.; Papuga, J. Recent progress in the application of multiaxial fatigue criteria to lifetime calculations. Procedia Struct. Integr. 2019, 23, 69–76. [Google Scholar] [CrossRef]
- Böhm, M.; Głowacka, K. Fatigue Life Estimation with Mean Stress Effect Compensation for Lightweight Structures—The Case of GLARE 2 Composite. Polymers 2020, 12, 251. [Google Scholar] [CrossRef] [PubMed]
- Özdeş, H.; Tiryakioğlu, M. Walker parameter for mean stress correction in fatigue testing of Al-7%Si-Mg alloy castings. Materials 2017, 10, 1401. [Google Scholar] [CrossRef] [PubMed]
- Pan, X.; Li, X.; Zhou, L.; Feng, X.; Luo, S.; He, W. Effect of residual stress on S-N curves and fracture morphology of Ti6Al4V titanium alloy after laser shock peening without protective coating. Materials 2019, 12, 3799. [Google Scholar] [CrossRef] [PubMed]
- Toribio, J.; Lorenzo, M.; Vergara, D.; Aguado, L. The role of overloading on the reduction of residual stress by cyclic loading in cold-drawn prestressing steelwires. Appl. Sci. 2017, 7, 84. [Google Scholar] [CrossRef]
- Hu, K.; Zhu, F.; Chen, J.; Noda, N.A.; Han, W.; Sano, Y. Simulation of thermal stress and fatigue life prediction of high speed steel work roll during hot rolling considering the initial residual stress. Metals 2019, 9, 966. [Google Scholar] [CrossRef]
- Tchuindjang, D.; Fricke, W.; Vormwald, M. Numerical analysis of residual stresses and crack closure during cyclic loading of a longitudinal gusset. Eng. Fract. Mech. 2018, 198, 65–78. [Google Scholar] [CrossRef]
- Kluger, K.; Łagoda, T. Modification of the algorithm for calculating fatigue life for the criteria based on the concept of the critical plane. J. Theor. Appl. Mech. 2018, 56, 191–201. [Google Scholar] [CrossRef]
- Crossland, B. Effect of large hydrostatic pressures on the torsional fatigue strength of an alloy steel. In Proceedings of the International Conference on Fatigue of Metals, London, UK, 10–14 September 1956; New York, NY, USA, 28–30 November 1956. Institute of Mechanical Engineers: London, UK, 1956; pp. 138–149. [Google Scholar]
- Papadopoulos, I.V. Long life fatigue under multiaxial loading. Int. J. Fatigue 2001, 23, 839–849. [Google Scholar] [CrossRef]
- Papadopoulos, I.V. A new criterion of fatigue-strength for out-of-phase bending and torsion. Int. J. Fatigue 1994, 16, 377–384. [Google Scholar] [CrossRef]
- Papuga, J.; Růžička, M. Two new multiaxial criteria for high cycle fatigue computation. Int. J. Fatigue 2008, 30, 58–66. [Google Scholar] [CrossRef]
- Ellyin, F. Fatigue failure under multiaxial states of stress. In Fatigue Damage, Crack Growth and Life Prediction; Springer: Berlin/Heidelberg, Germany, 1997; p. 484. [Google Scholar]
- Papadopoulos, I.V.; Davoli, P.; Gorla, C.; Filippini, M.; Bernasconi, A. A comparative study of multiaxial high-cycle fatigue criteria for metals. Int. J. Fatigue 1997, 19, 219–235. [Google Scholar] [CrossRef]
- Findley, W.N. A theory for the effect of mean stress on fatigue of metals under combined torsion and axial load or bending. J. Eng. Ind. 1959, 81, 301–306. [Google Scholar] [CrossRef]
- Stulen, F.B.; Cummings, H.N. A failure criterion for multiaxial fatigue stresses. Proc. ASTM 1954, 54, 822–835. [Google Scholar]
- Dang Van, K.; Cailletaud, G.; Flavenot, J.F.; Le Douaron, A.; Lieurade, H.P. Criterion for High Cycle Fatigue Failure under Multizaxial Loading; Mechanical Engineering Publisher: London, UK, 1989; pp. 459–478. [Google Scholar]
- Matake, T. An Explanation on Fatigue Limit under Combined Stress. Bull. JSME 1977, 20, 257–263. [Google Scholar] [CrossRef]
- Carpinteri, A.; Spagnoli, A. Multiaxial high-cycle fatigue criterion for hard metals. Int. J. Fatigue 2001, 23, 135–145. [Google Scholar] [CrossRef]
- Carpinteri, A.; Spagnoli, A.; Vantadori, S. Multiaxial fatigue assessment using a simplified critical plane-based criterion. Multiaxial Fatigue Models 2011, 33, 969–976. [Google Scholar] [CrossRef]
- Goodman, J. Mechanics Applied to Engineering. In Longman; Green & Company: London, UK, 1899. [Google Scholar]
- Morrow, J. Fatigue properties of metals. In Fatigue Design Handbook; SAE: Warrendale, PA, USA, 1968. [Google Scholar]
- Carpinteri, A.; Vantadori, S.; Lagoda, T.; Karolczuk, A.; Kurek, M.; Ronchei, C. Fatigue assessment of metallic components under uniaxial and multiaxial variable amplitude loading. Fatigue Fract. Eng. Mater. Struct. 2018, 41, 1306–1317. [Google Scholar] [CrossRef]
- Karolczuk, A.; Kluger, K. Analysis of the coefficient of normal stress effect in chosen multiaxial fatigue criteria. Theor. Appl. Fract. Mech. 2014, 73, 39–47. [Google Scholar] [CrossRef]
- Kluger, K.; Lagoda, T. A new algorithm for estimating fatigue life under mean value of stress. Fatigue Fract. Eng. Mater. Struct. 2017, 40, 448–459. [Google Scholar] [CrossRef]


© 2020 by the authors. Licensee MDPI, Basel, Switzerland. This article is an open access article distributed under the terms and conditions of the Creative Commons Attribution (CC BY) license (http://creativecommons.org/licenses/by/4.0/).