Phosphate Coatings Enriched with Copper on Titanium Substrate Fabricated Via DC-PEO Process


 ,
,  ,
,  ,
, 
 ,
,
Abstract
1. Introduction
2. Materials and Methods
3. Results
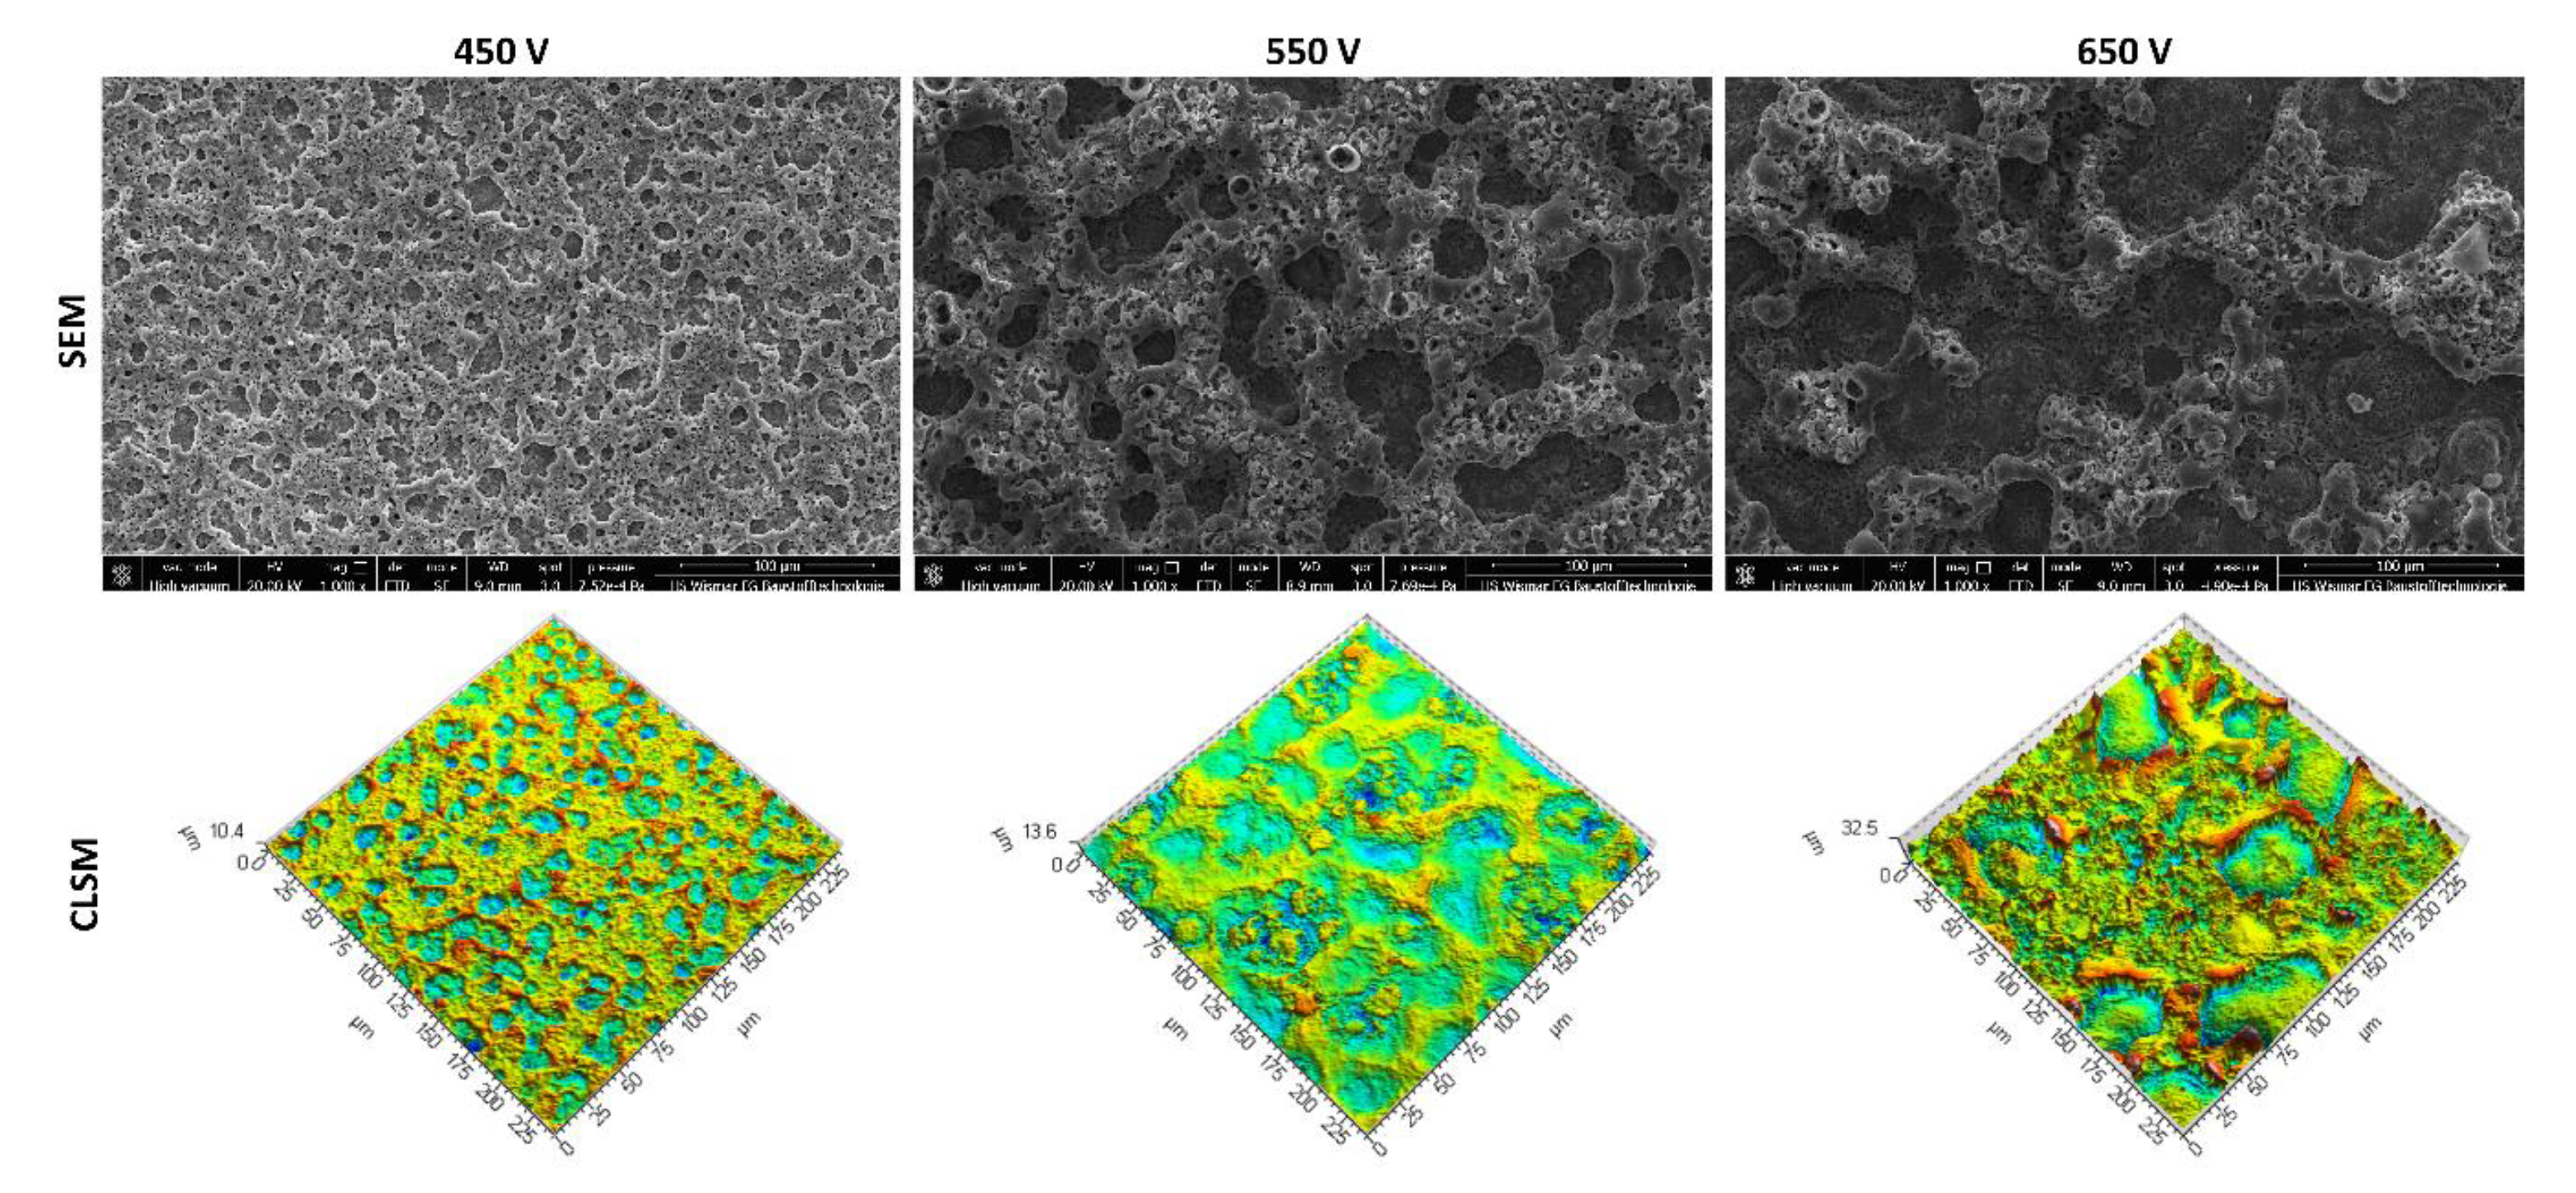
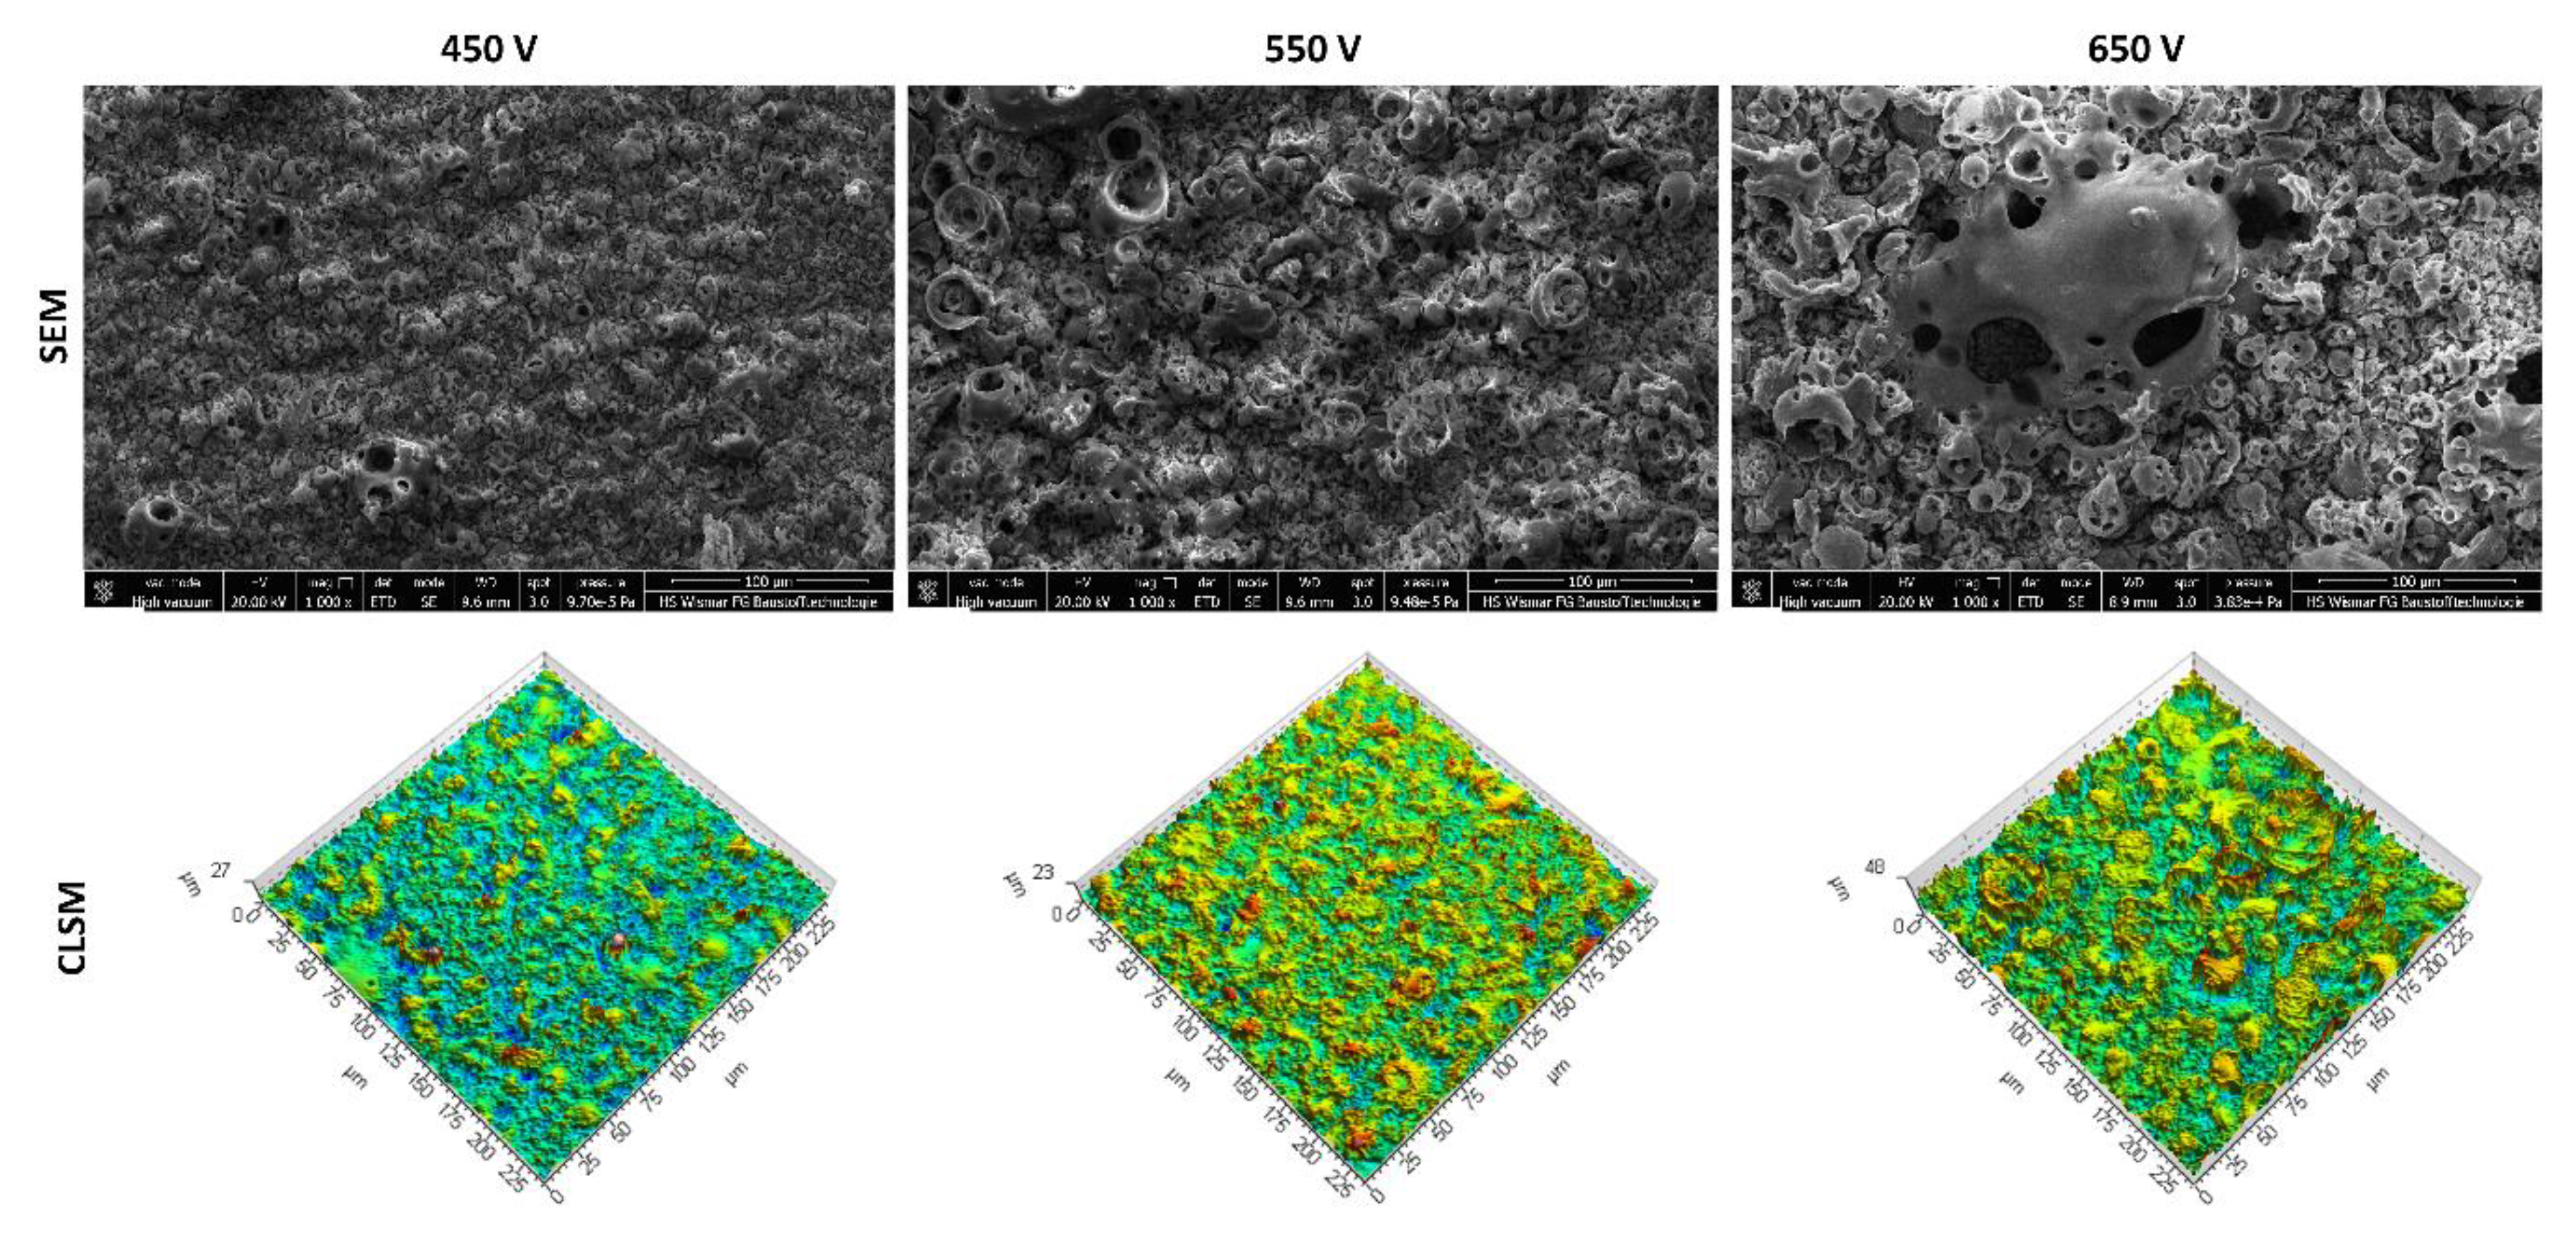
3.1. Scanning Electron Microscopy and Confocal Laser Scanning Microscopy Studies
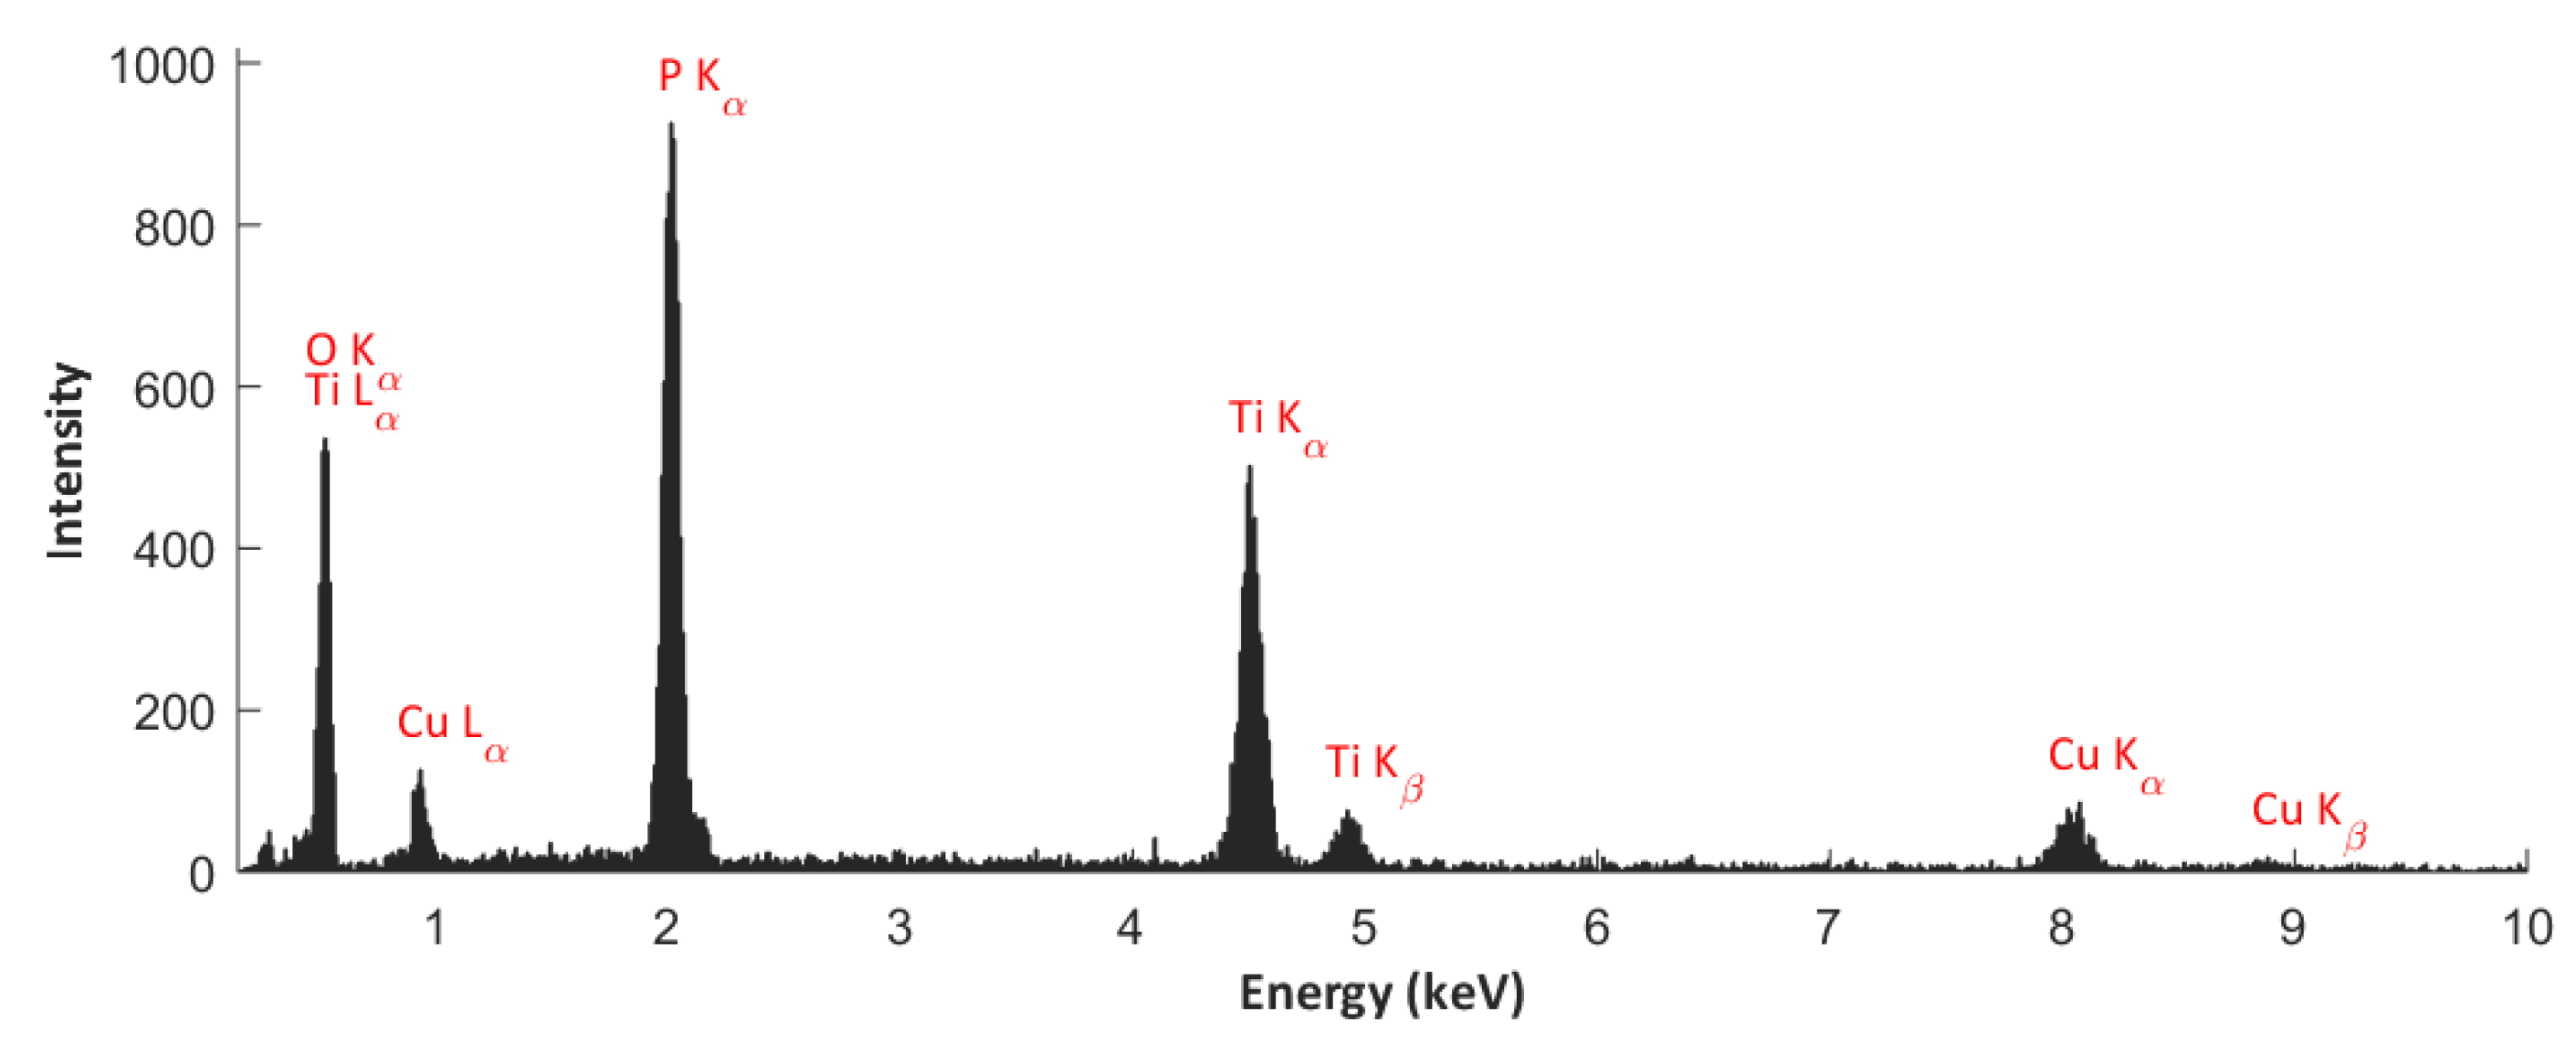
3.2. EDS Studies
3.3. XPS Studies
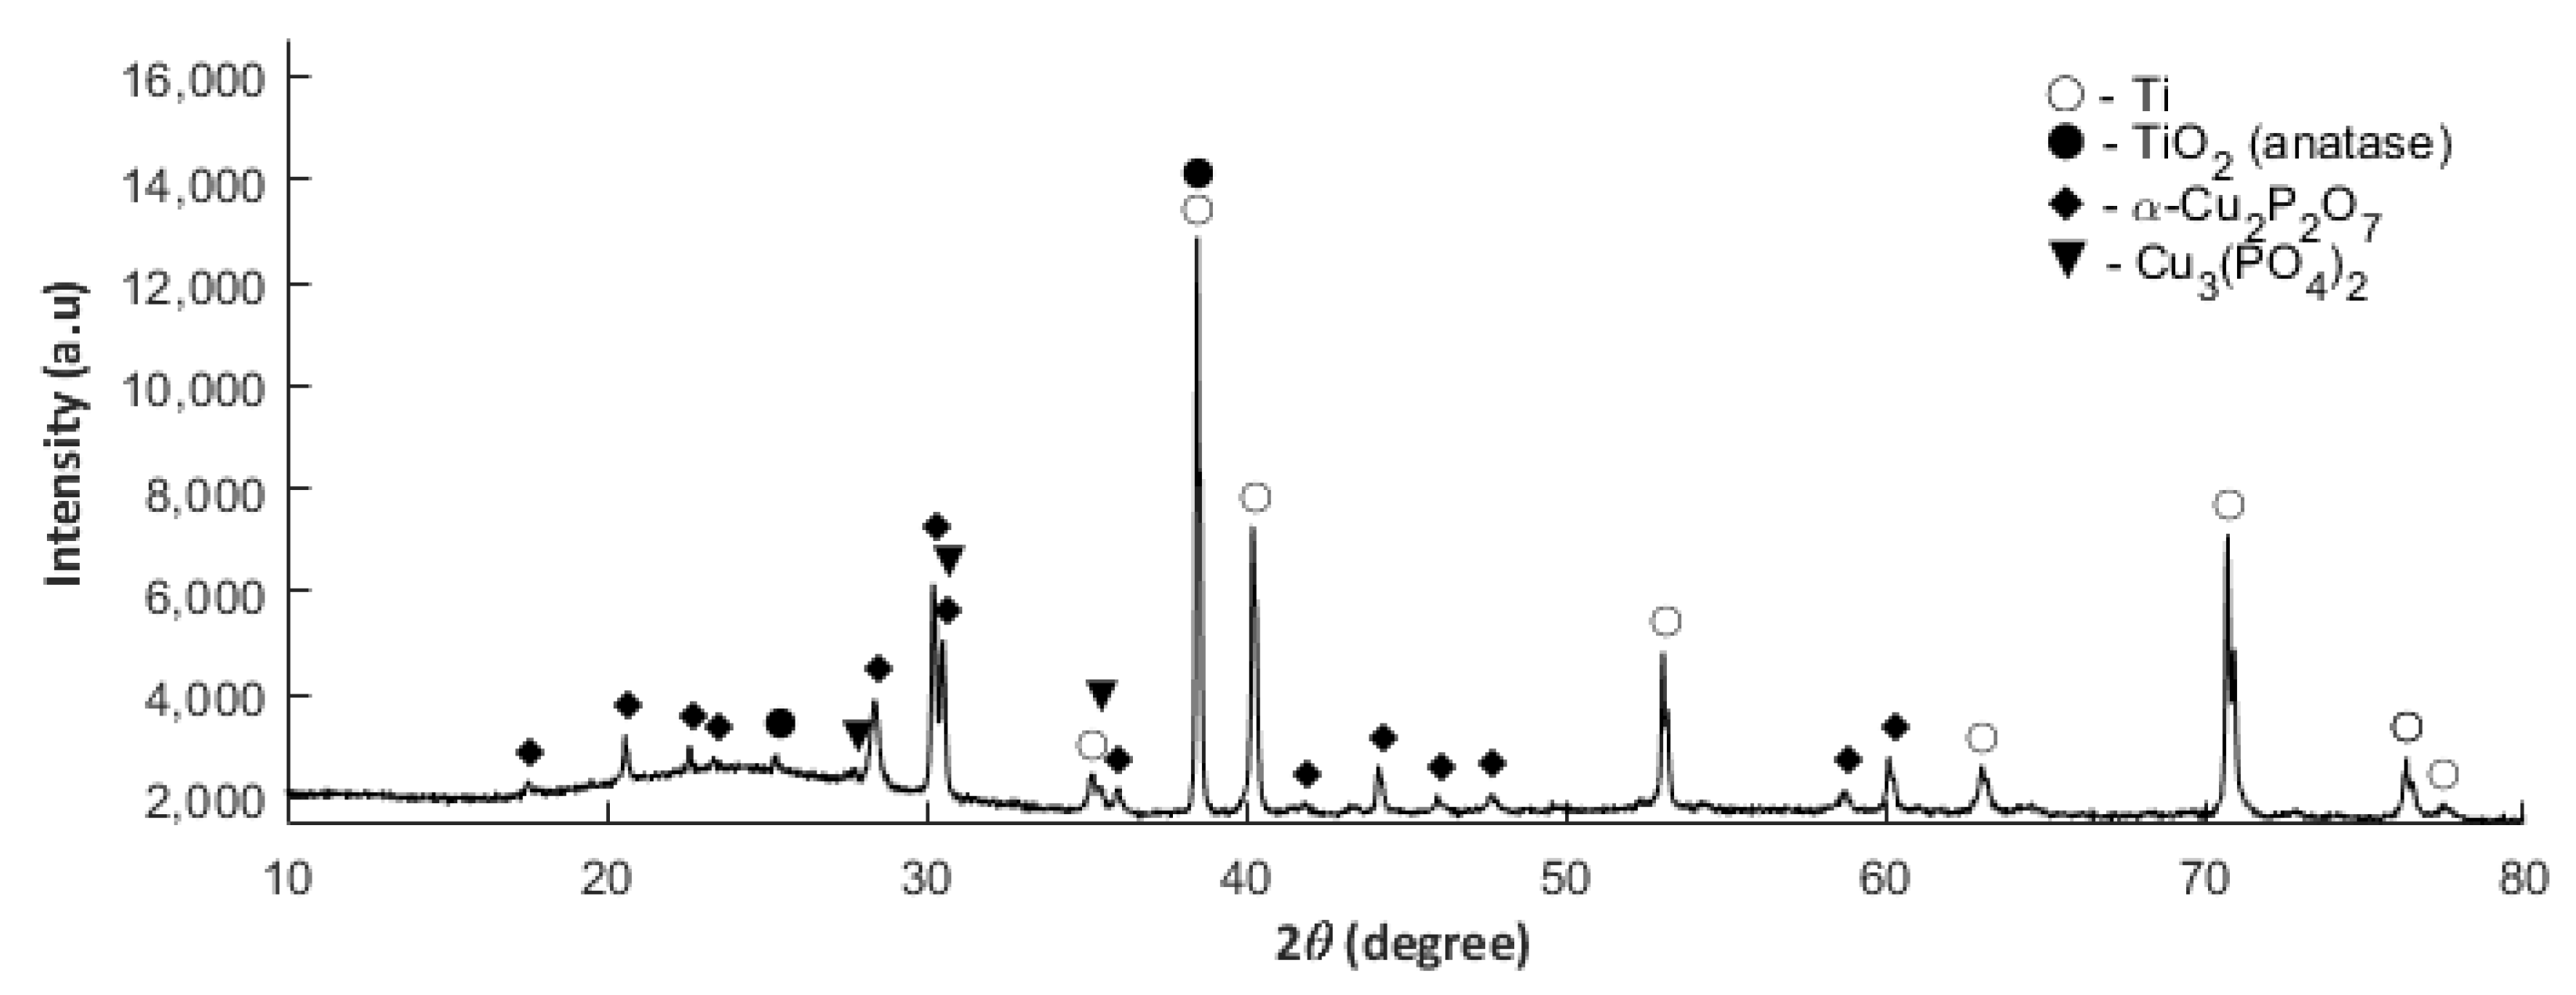
3.4. XRD Studies
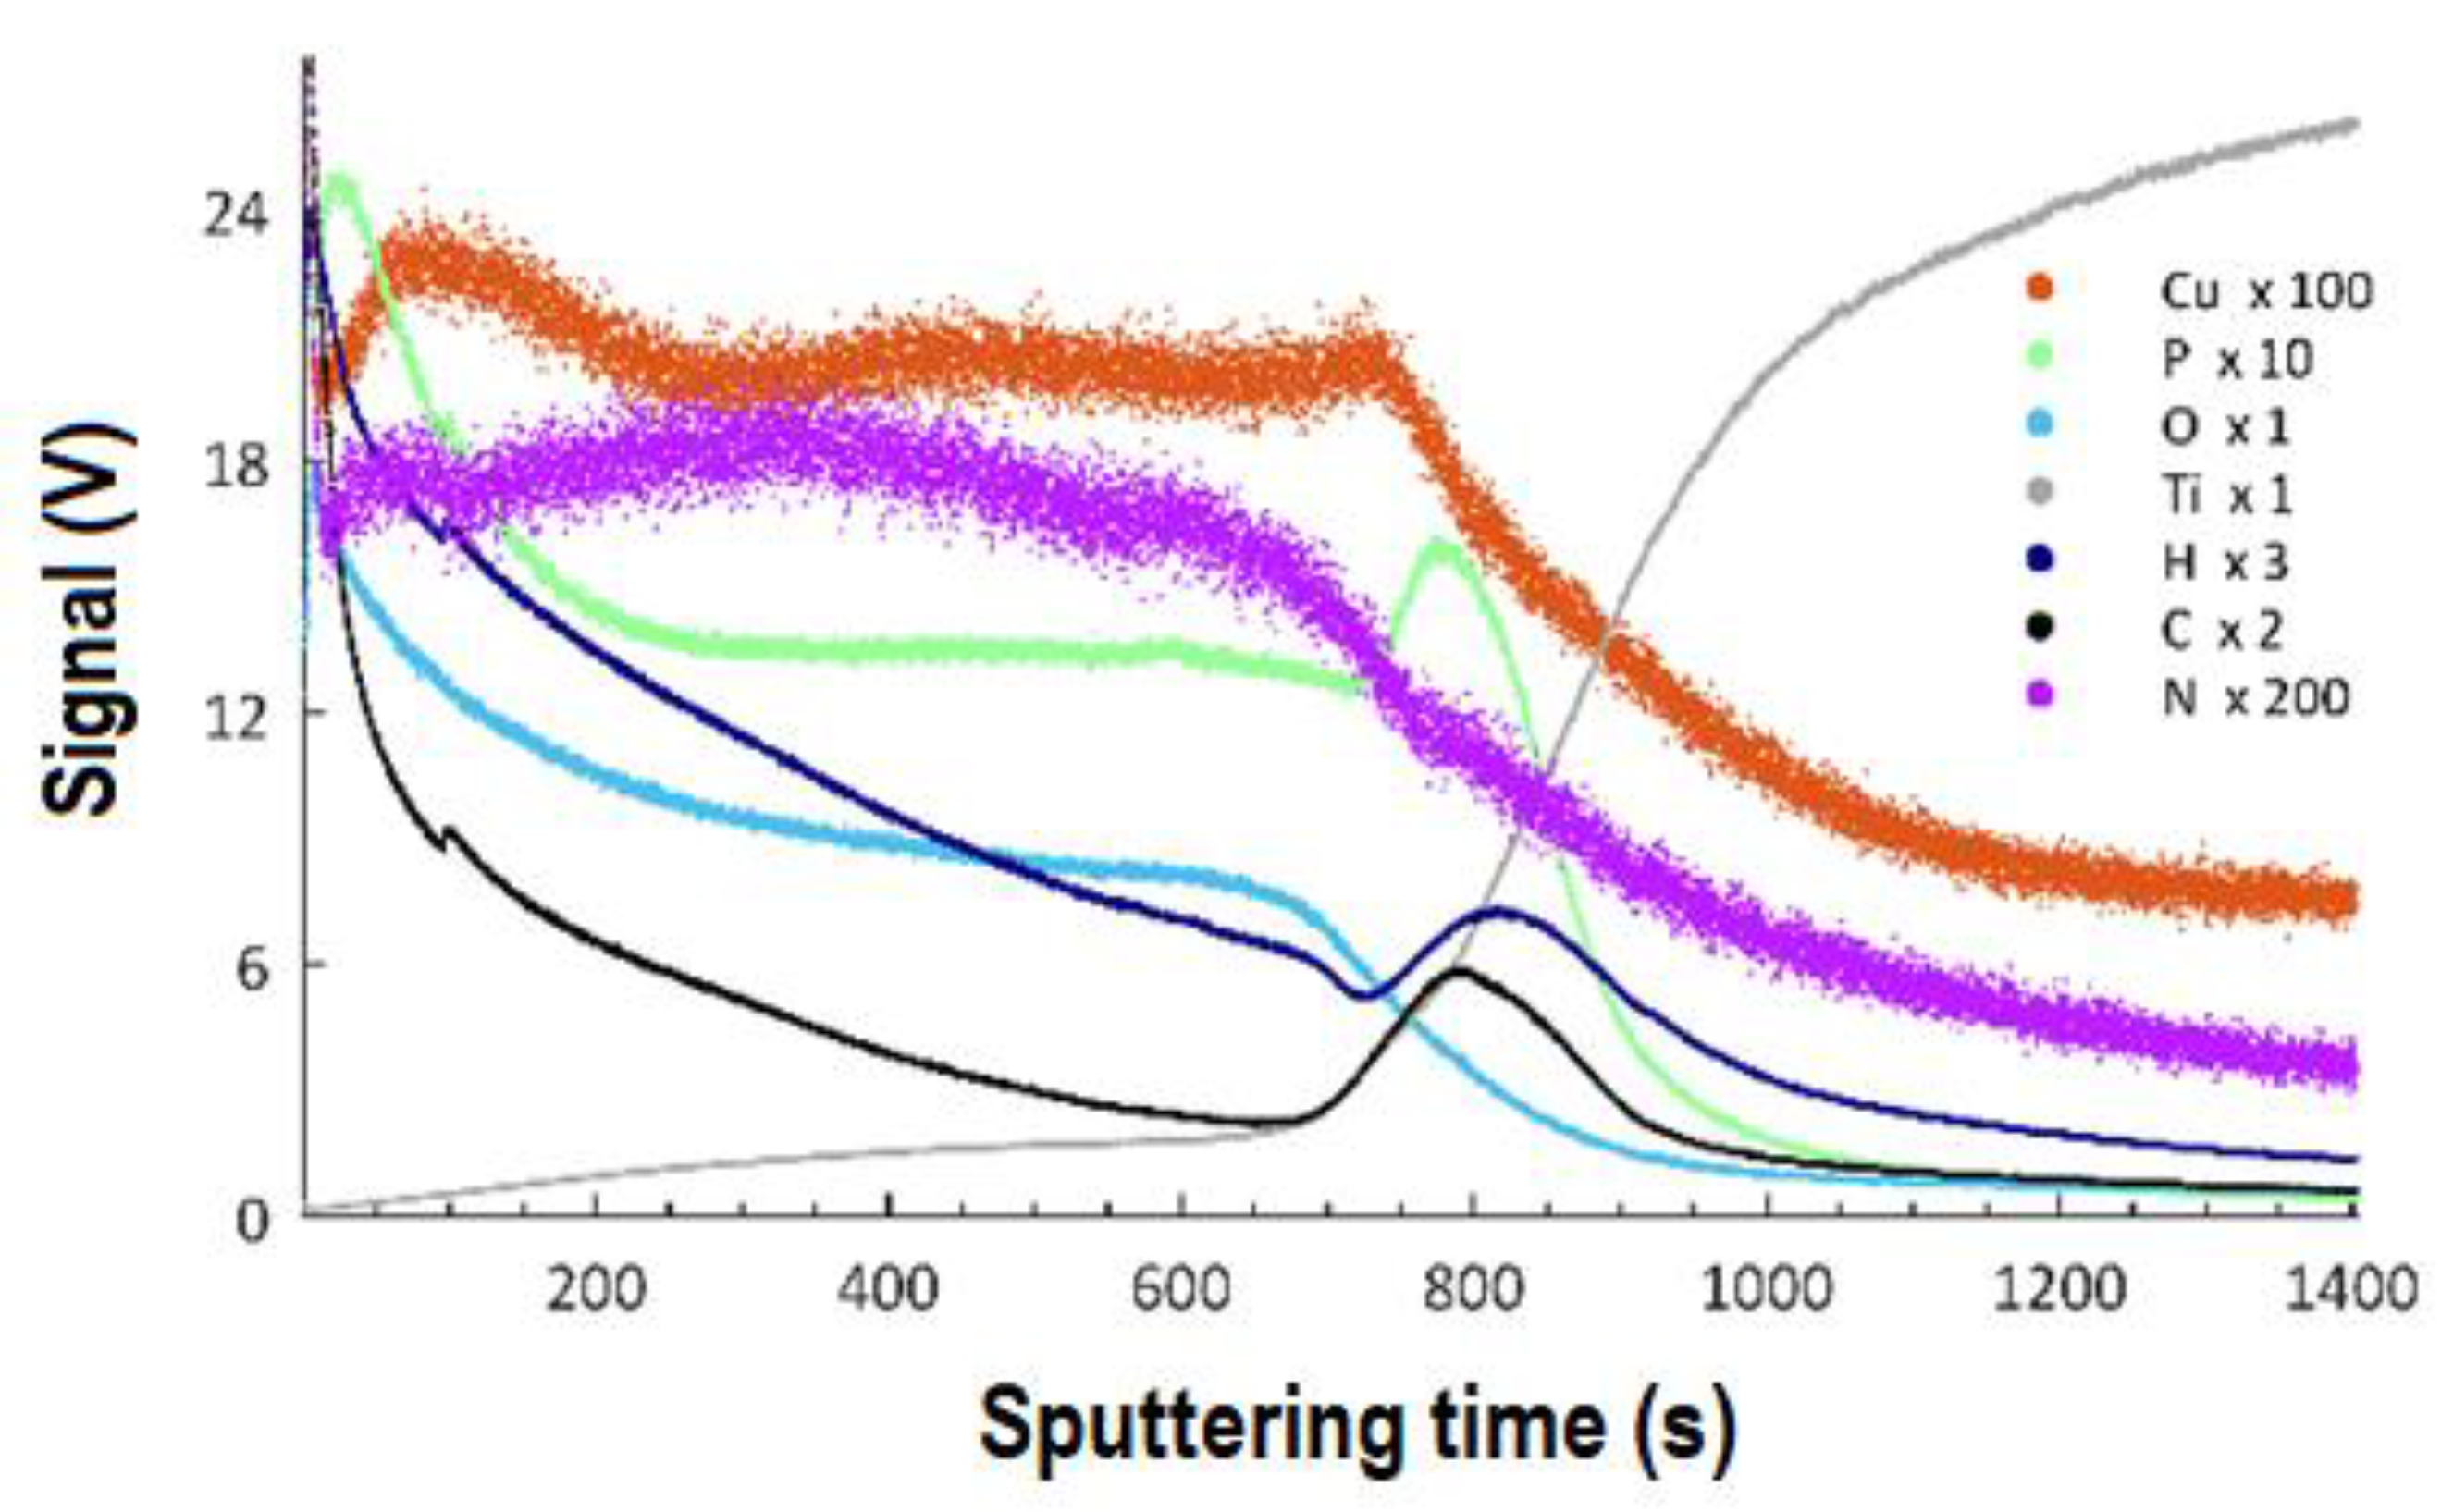
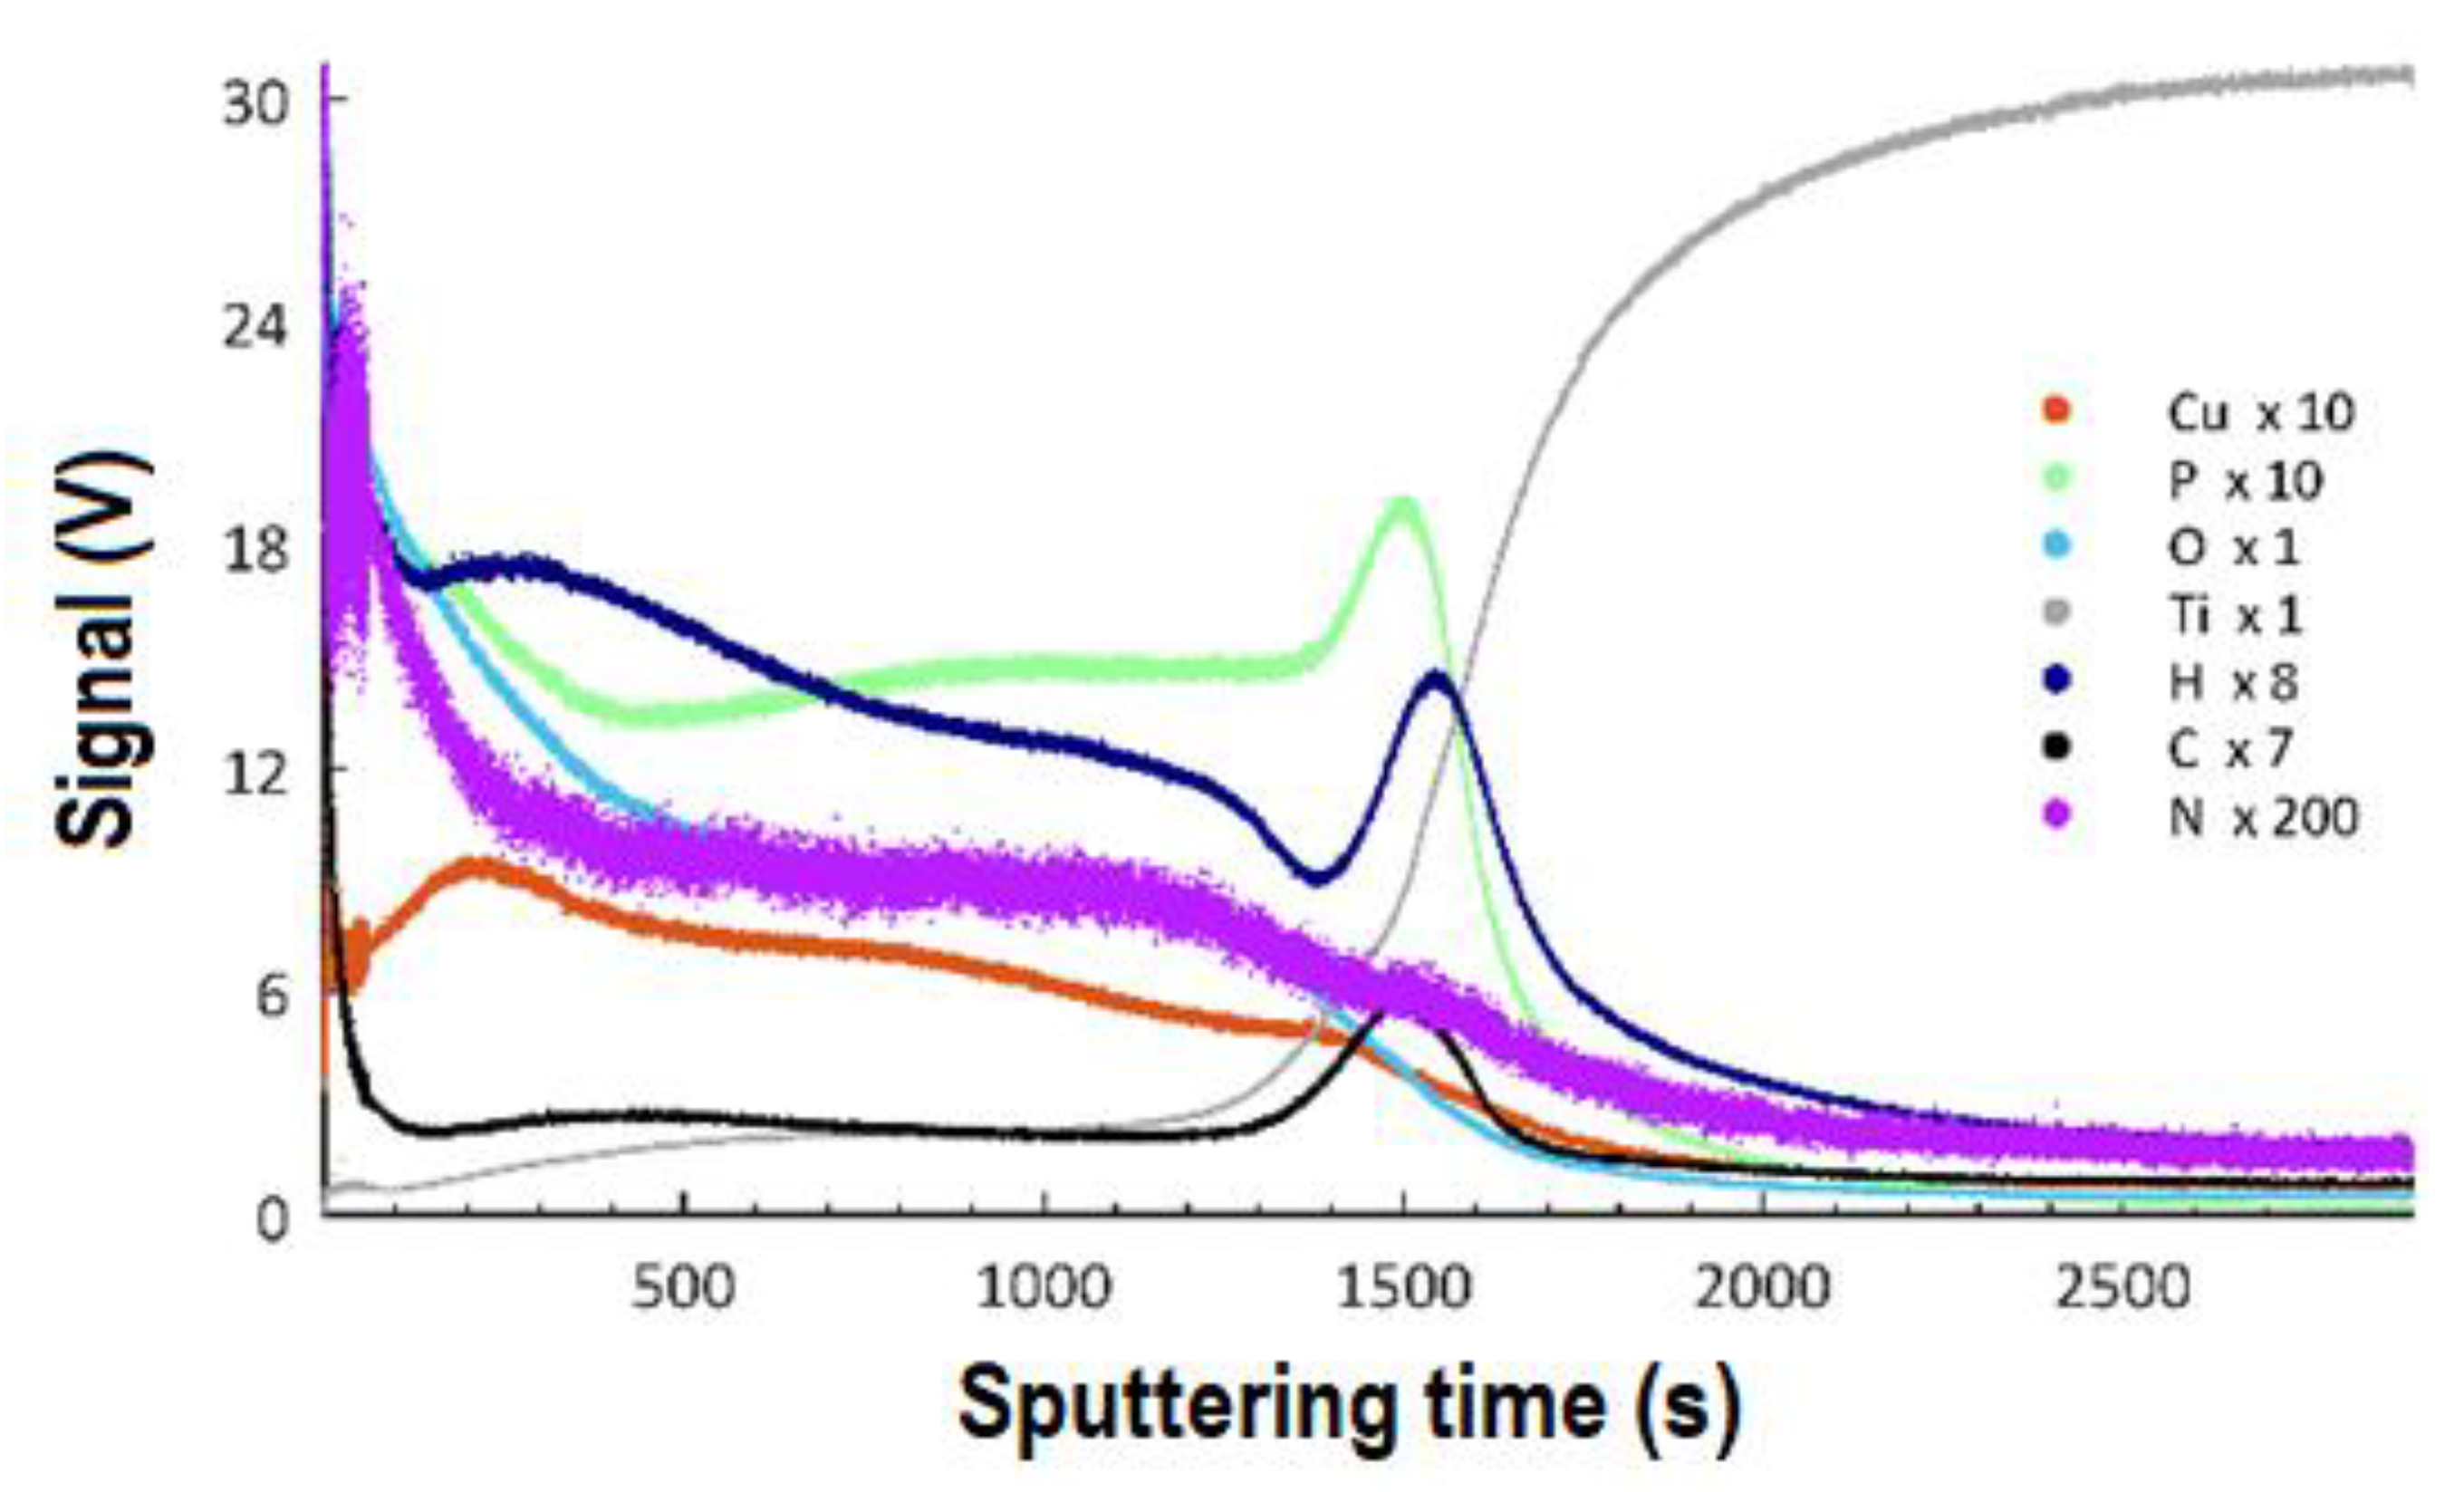
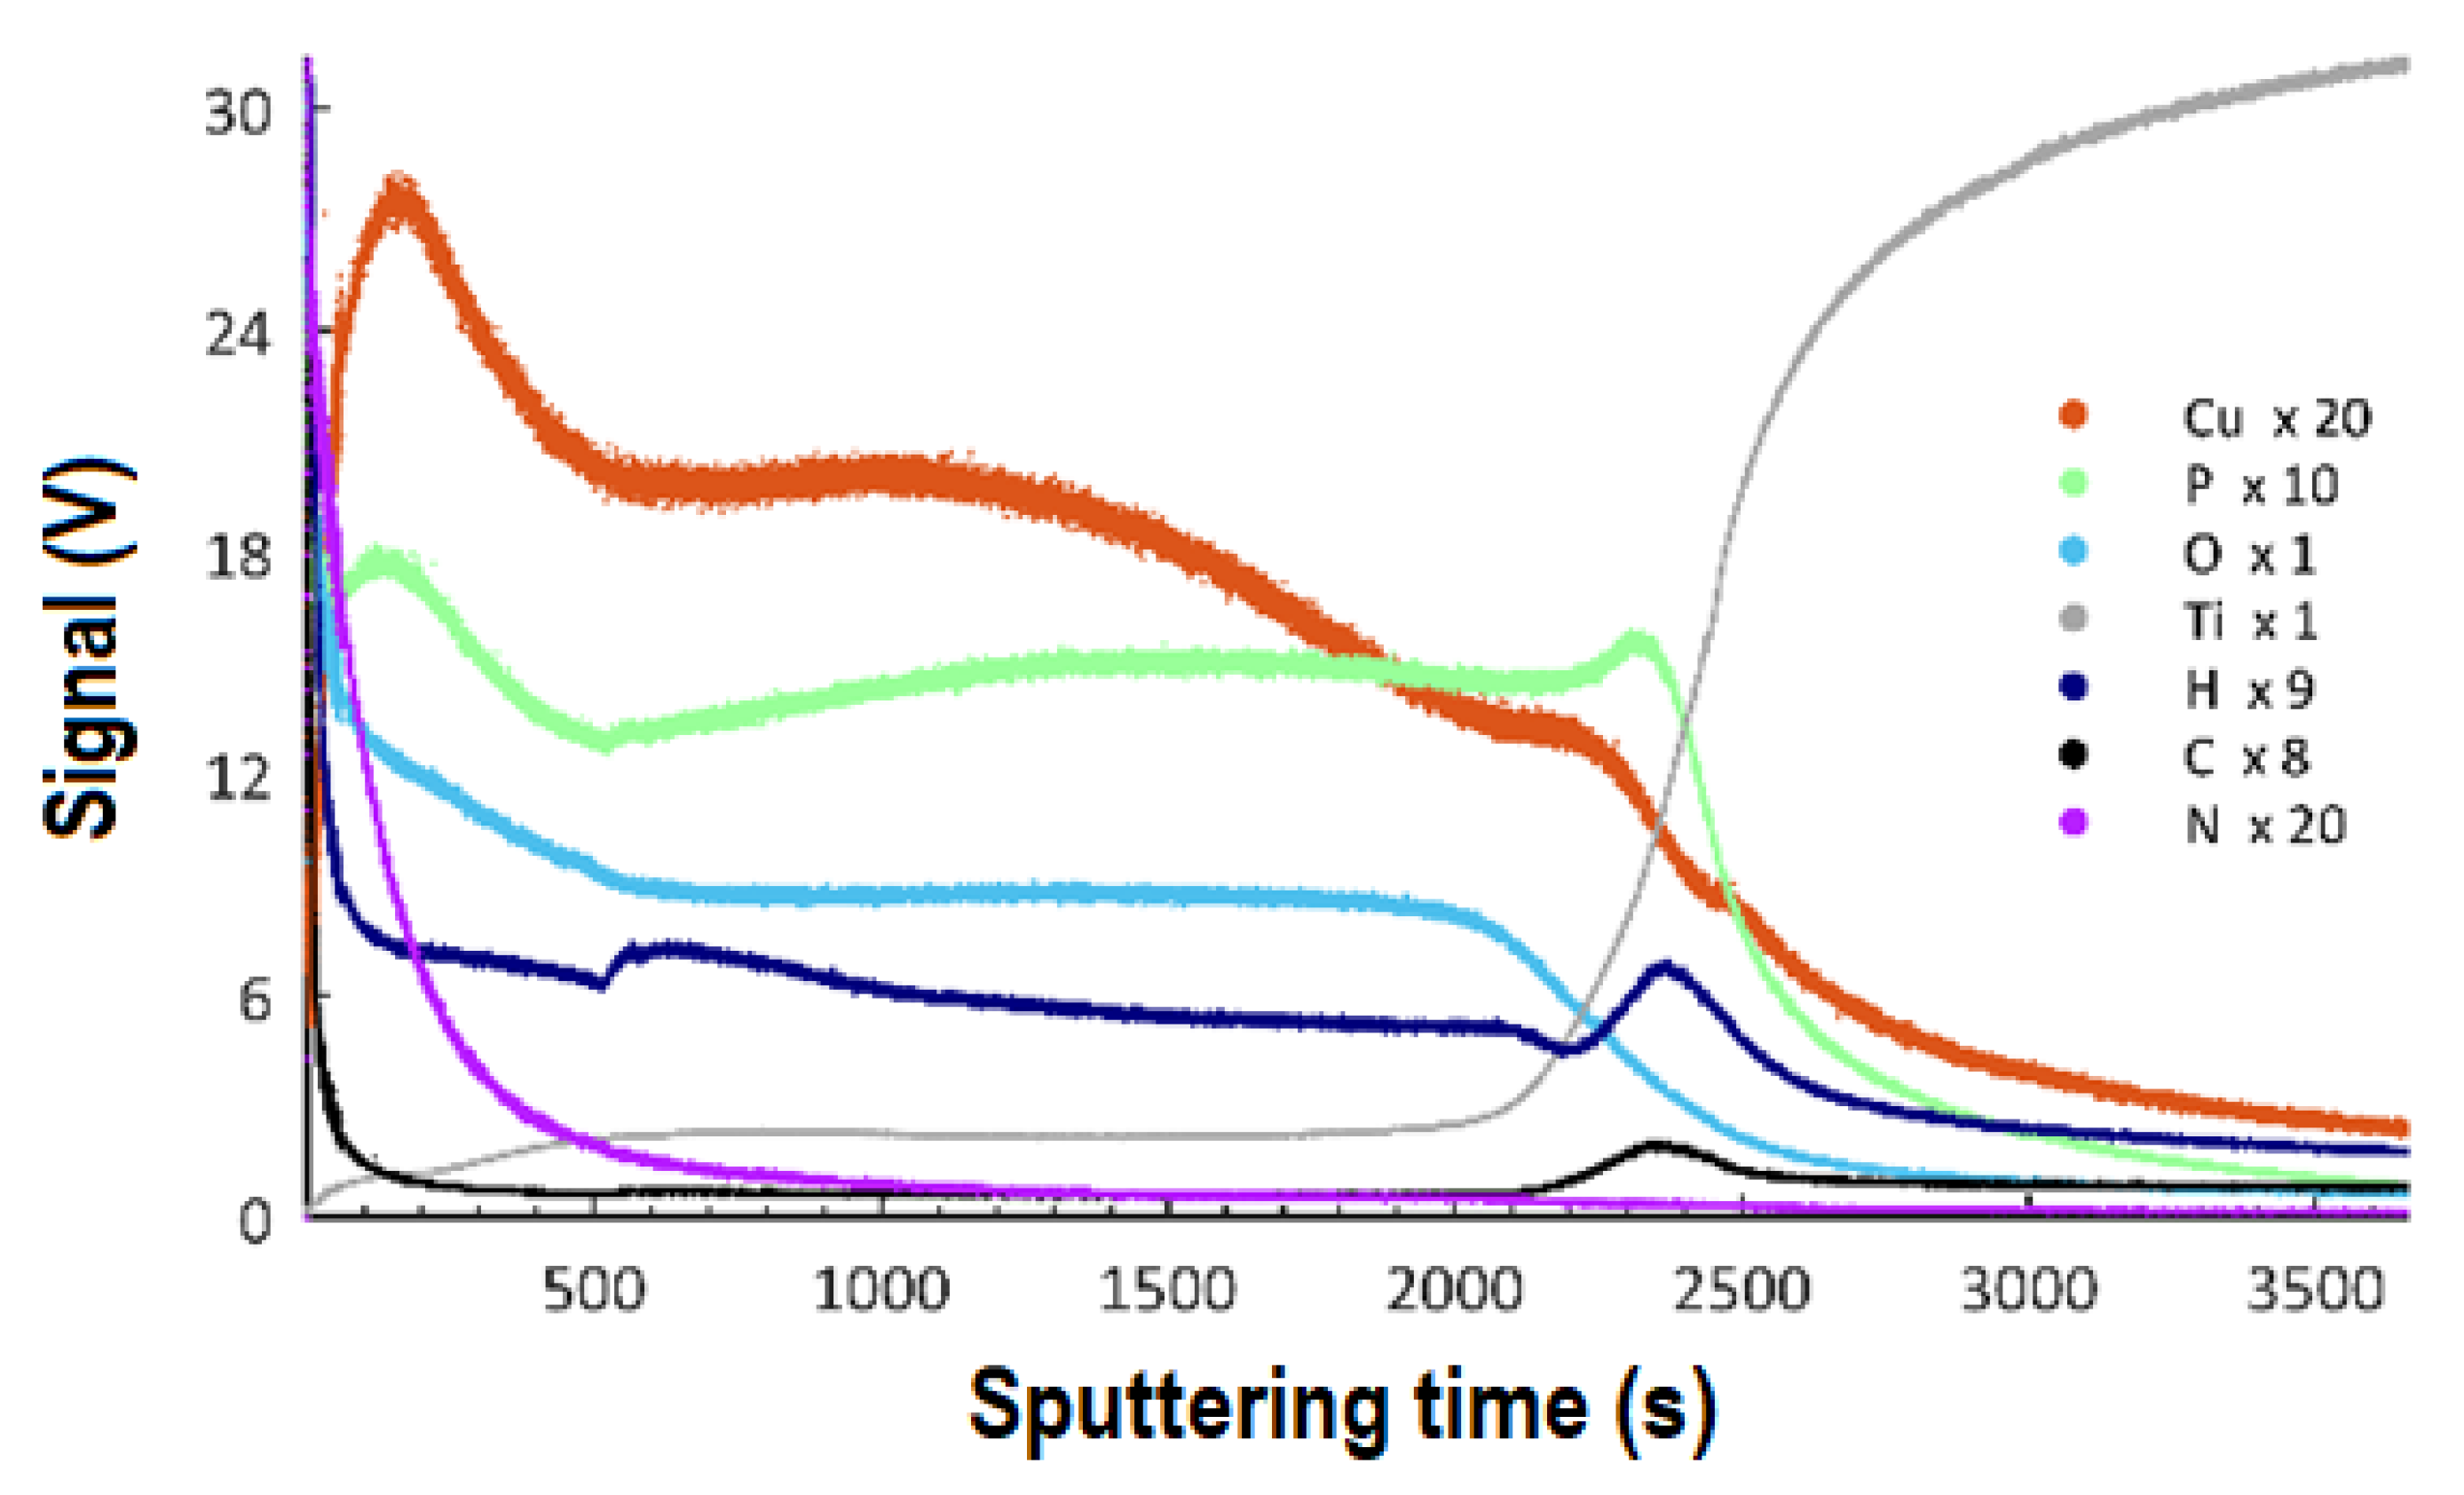
3.5. GDOES Studies
4. Discussion
5. Conclusions
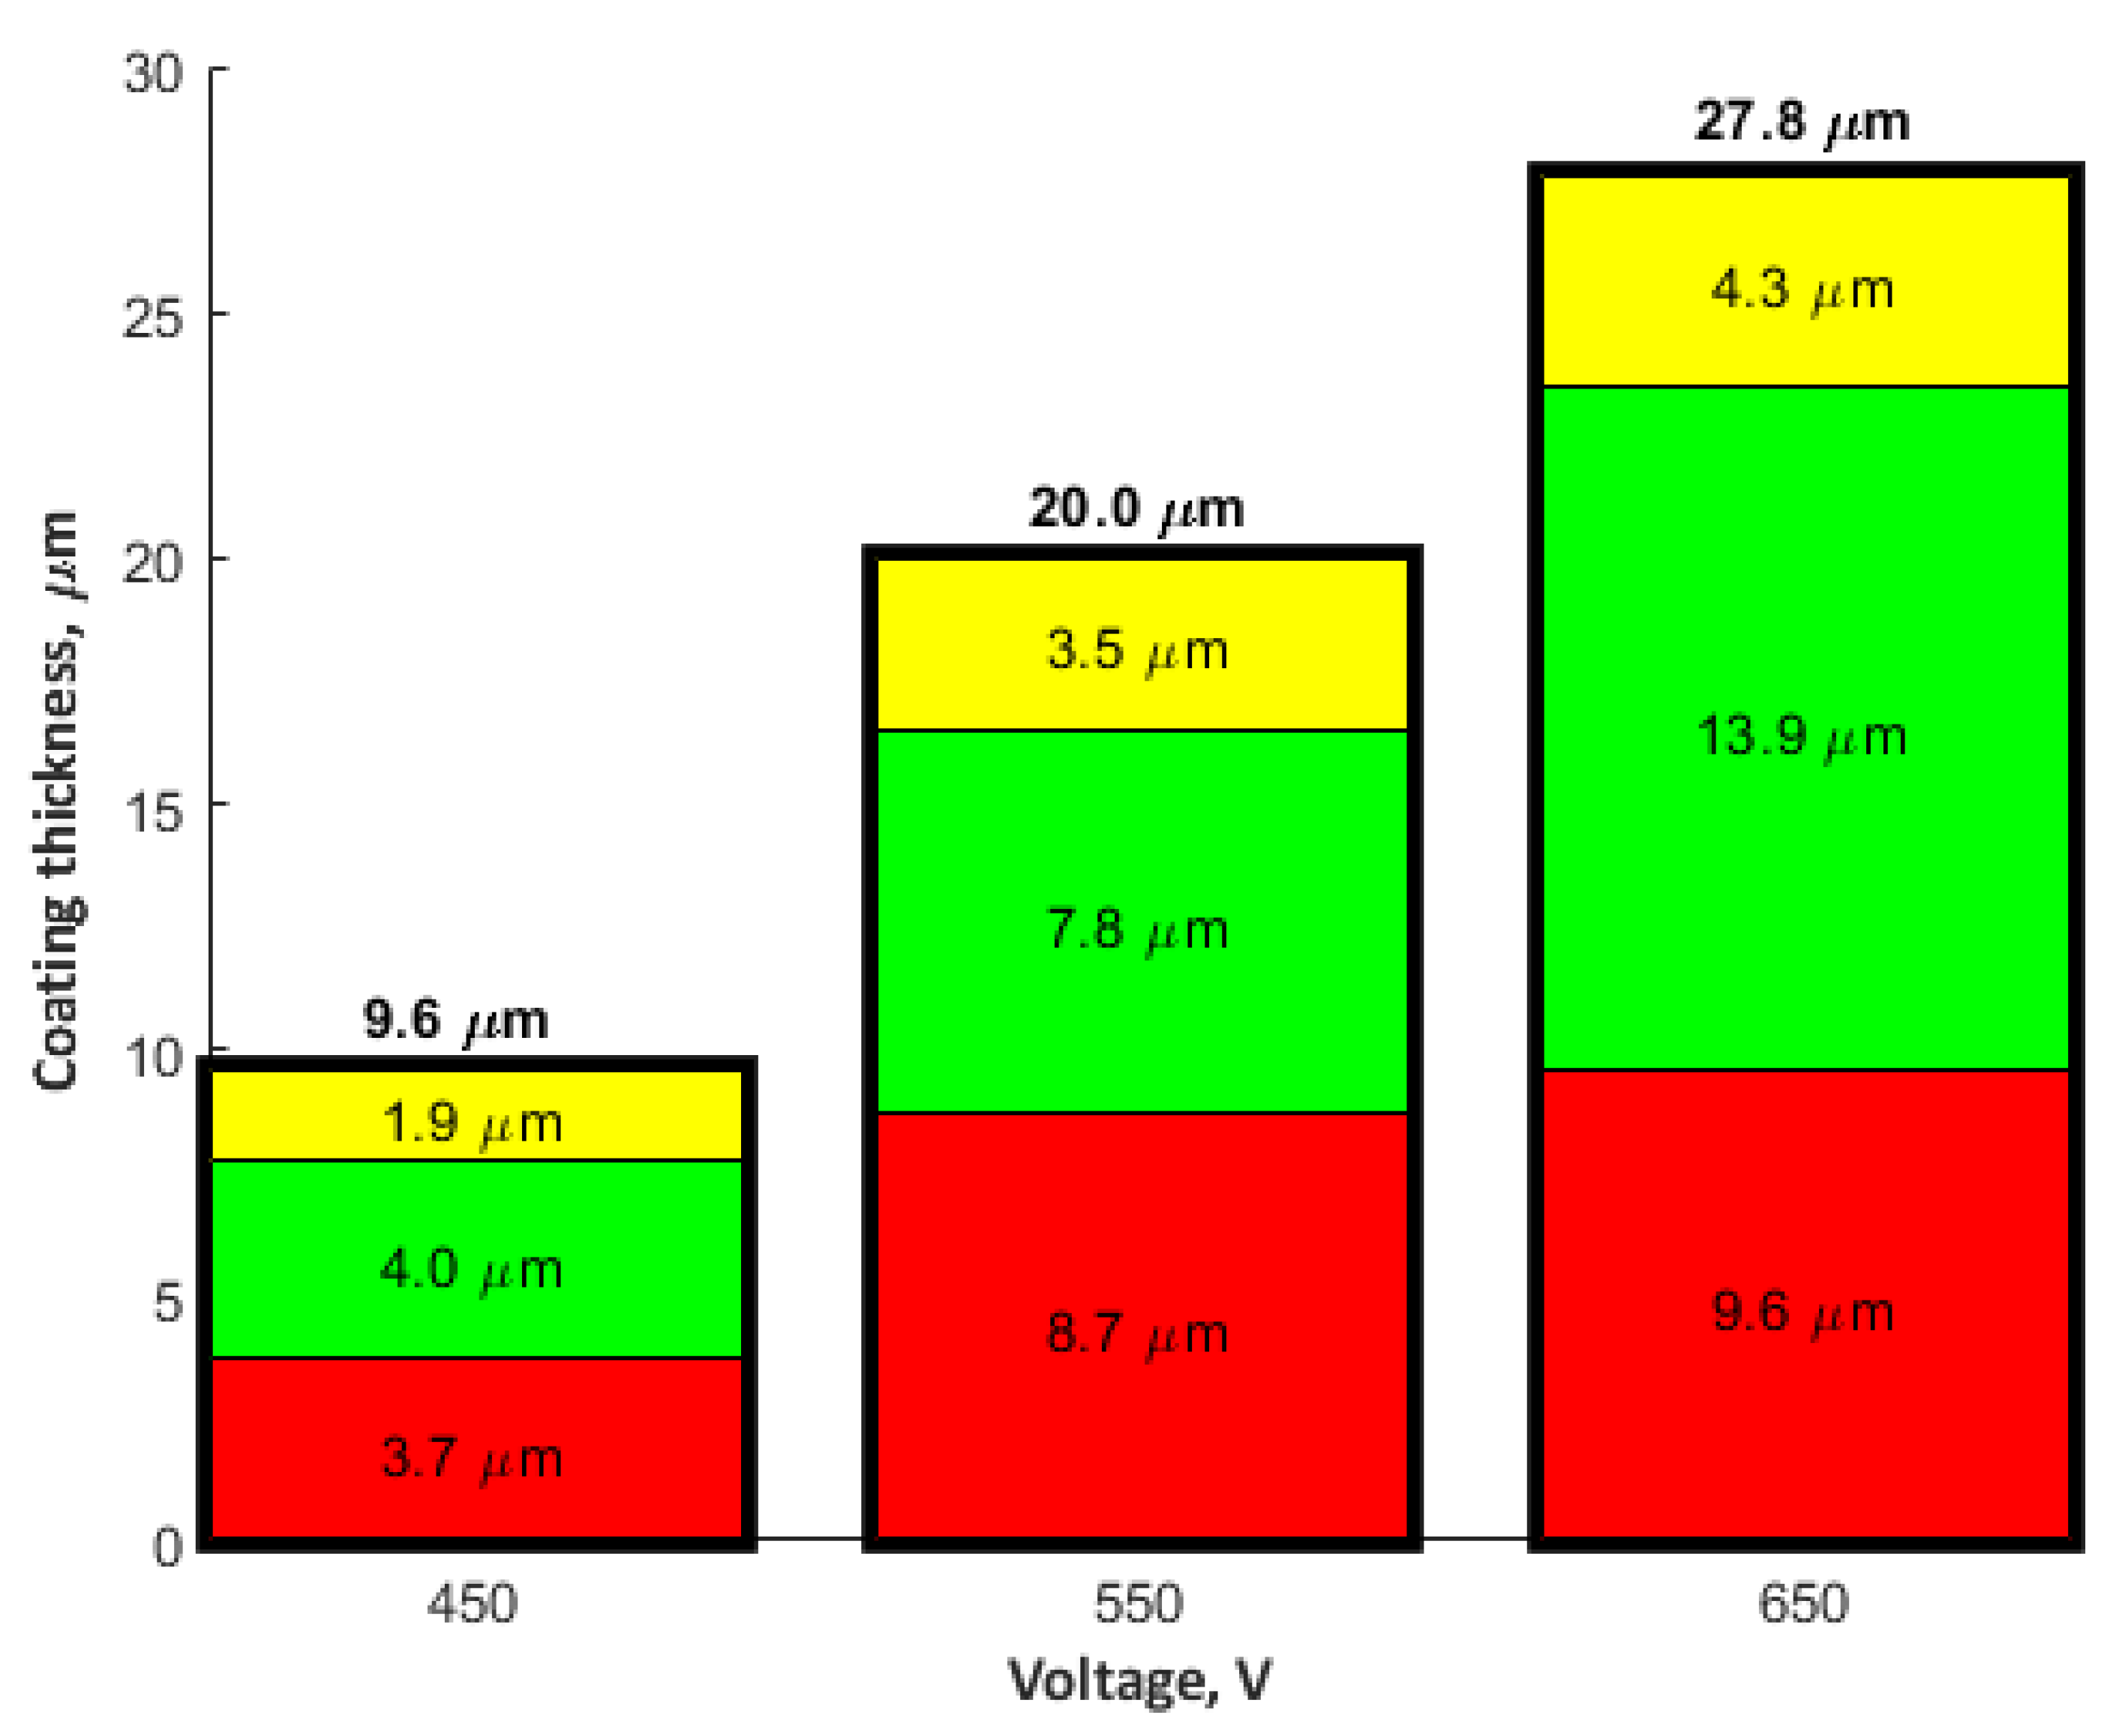
- (a)
- In the obtained PEO coatings, one may distinguish three layers: porous (i), semi-porous (ii), and a transient one (iii); The porous layers are approximately two times thinner than the semi-porous and the transient ones due the fact that the damaging discharges mostly affect the porous layer.
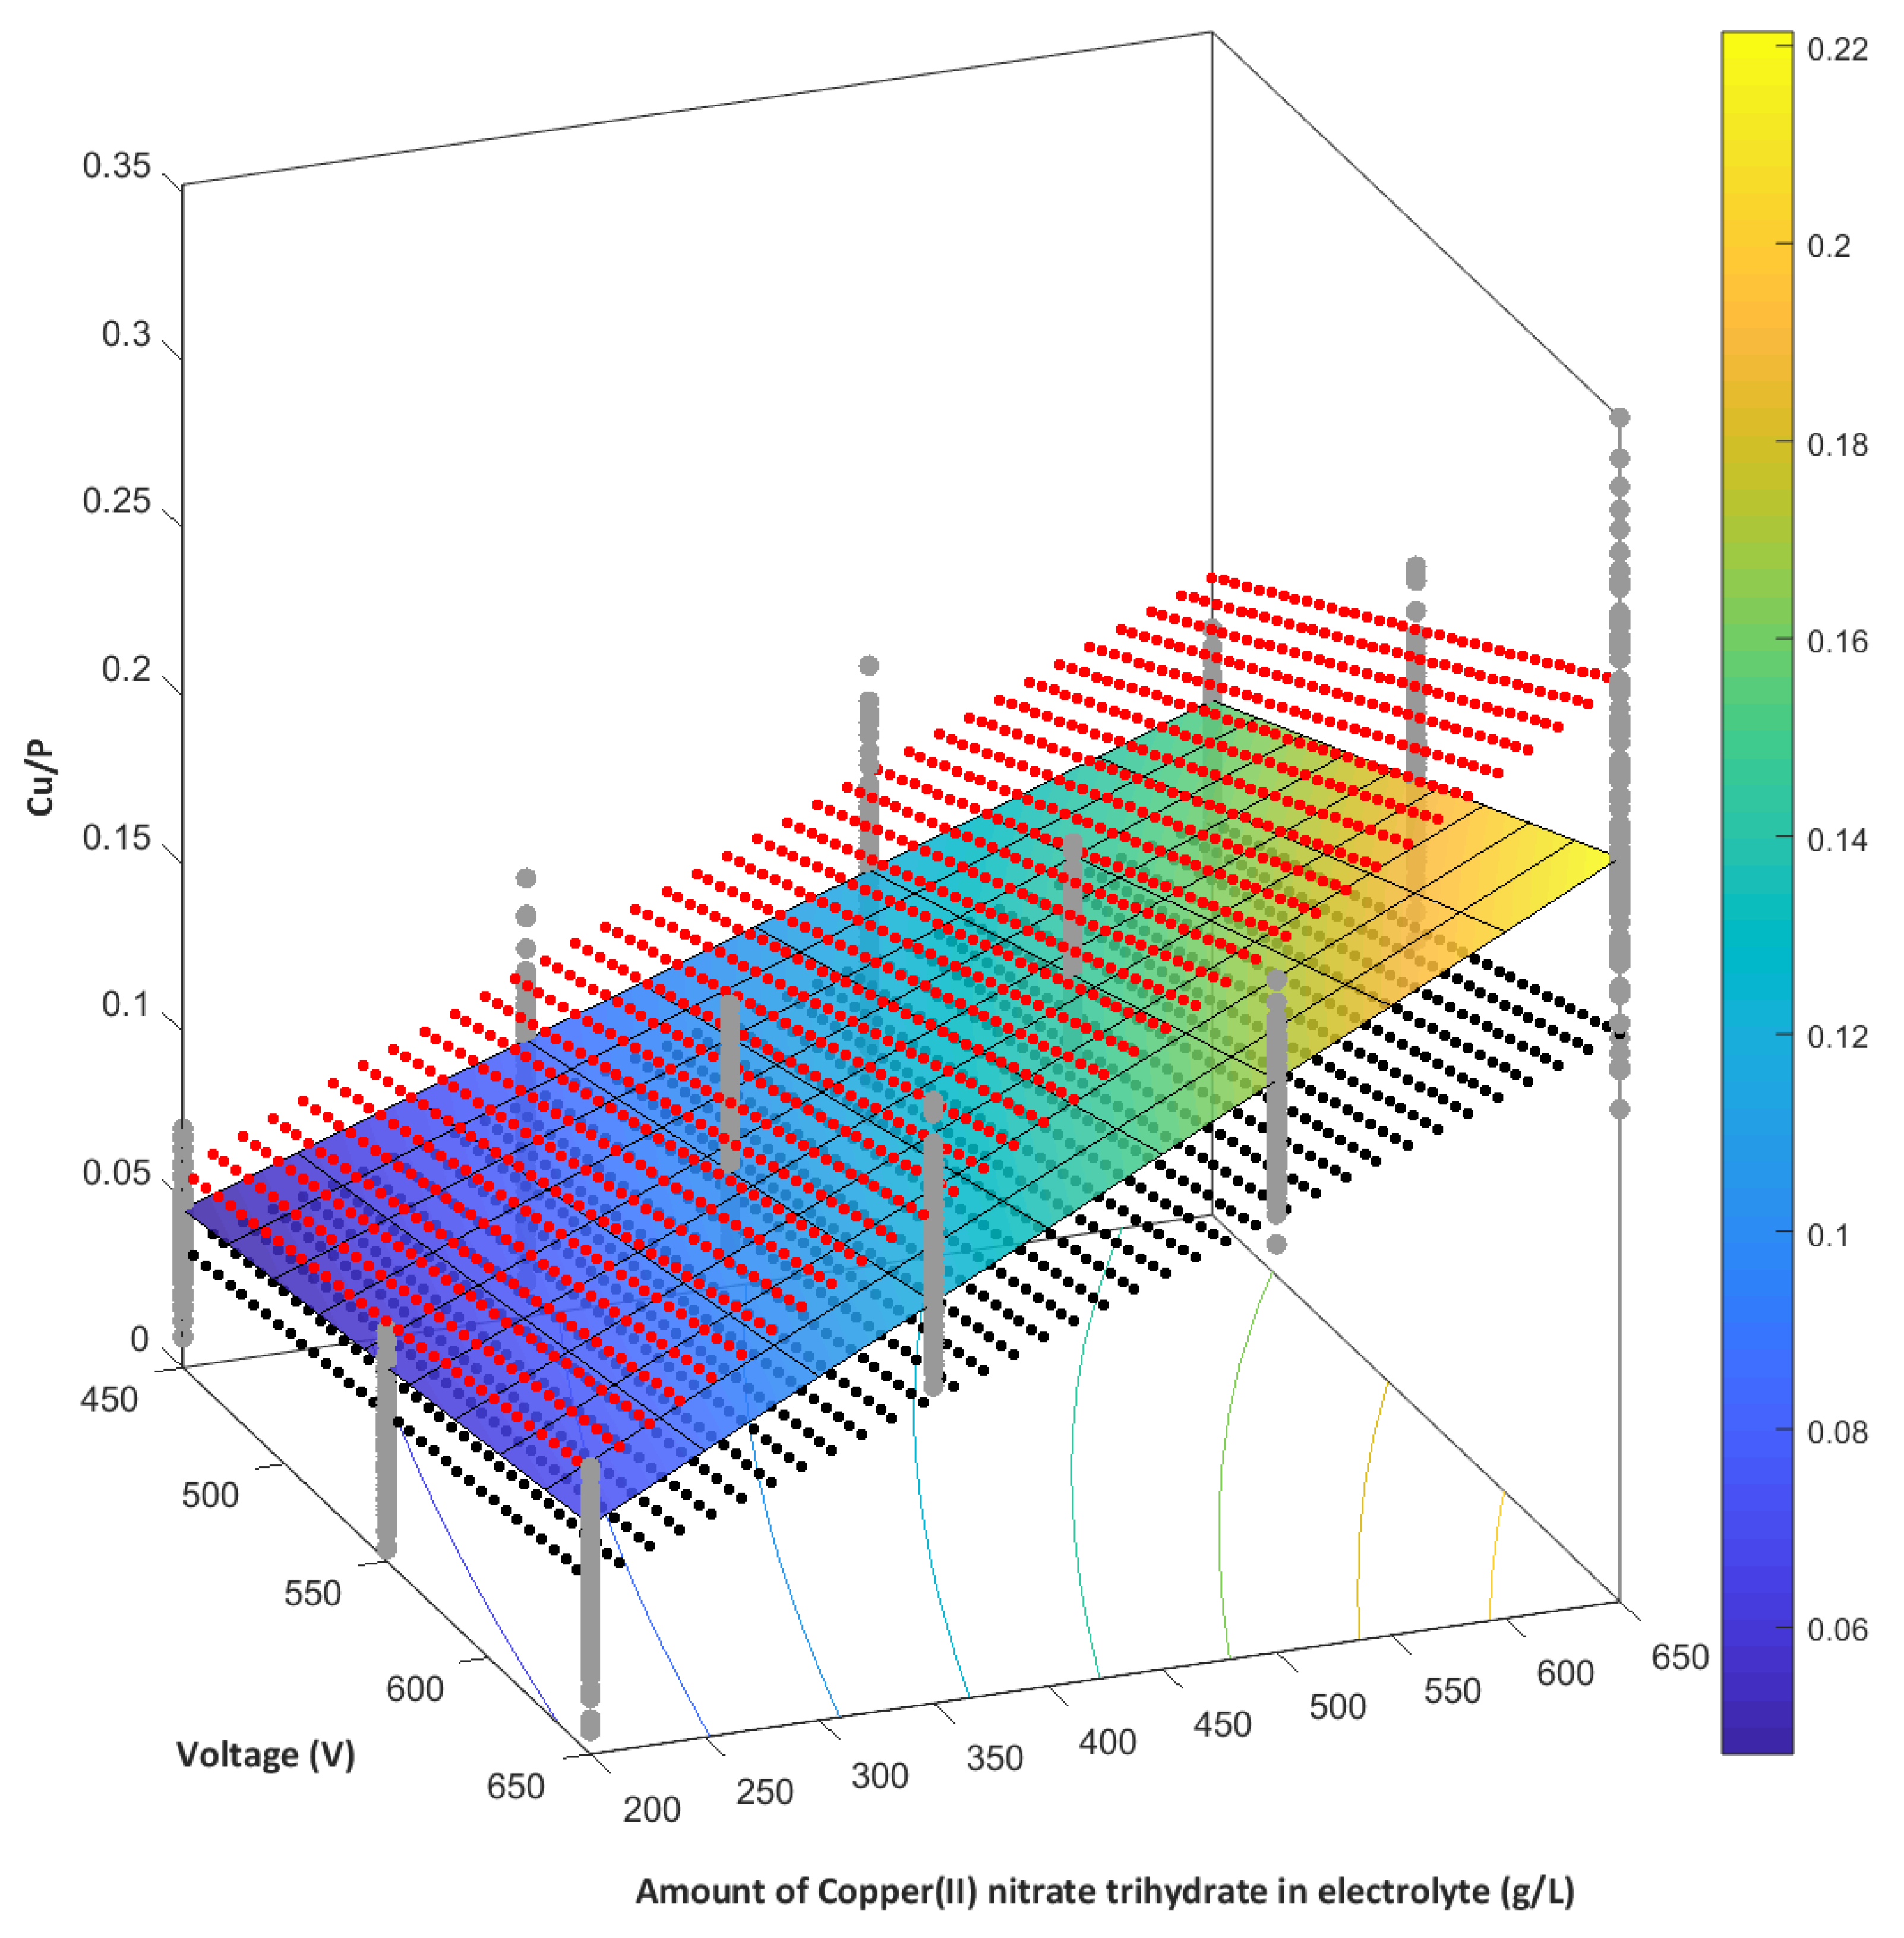
- (b)
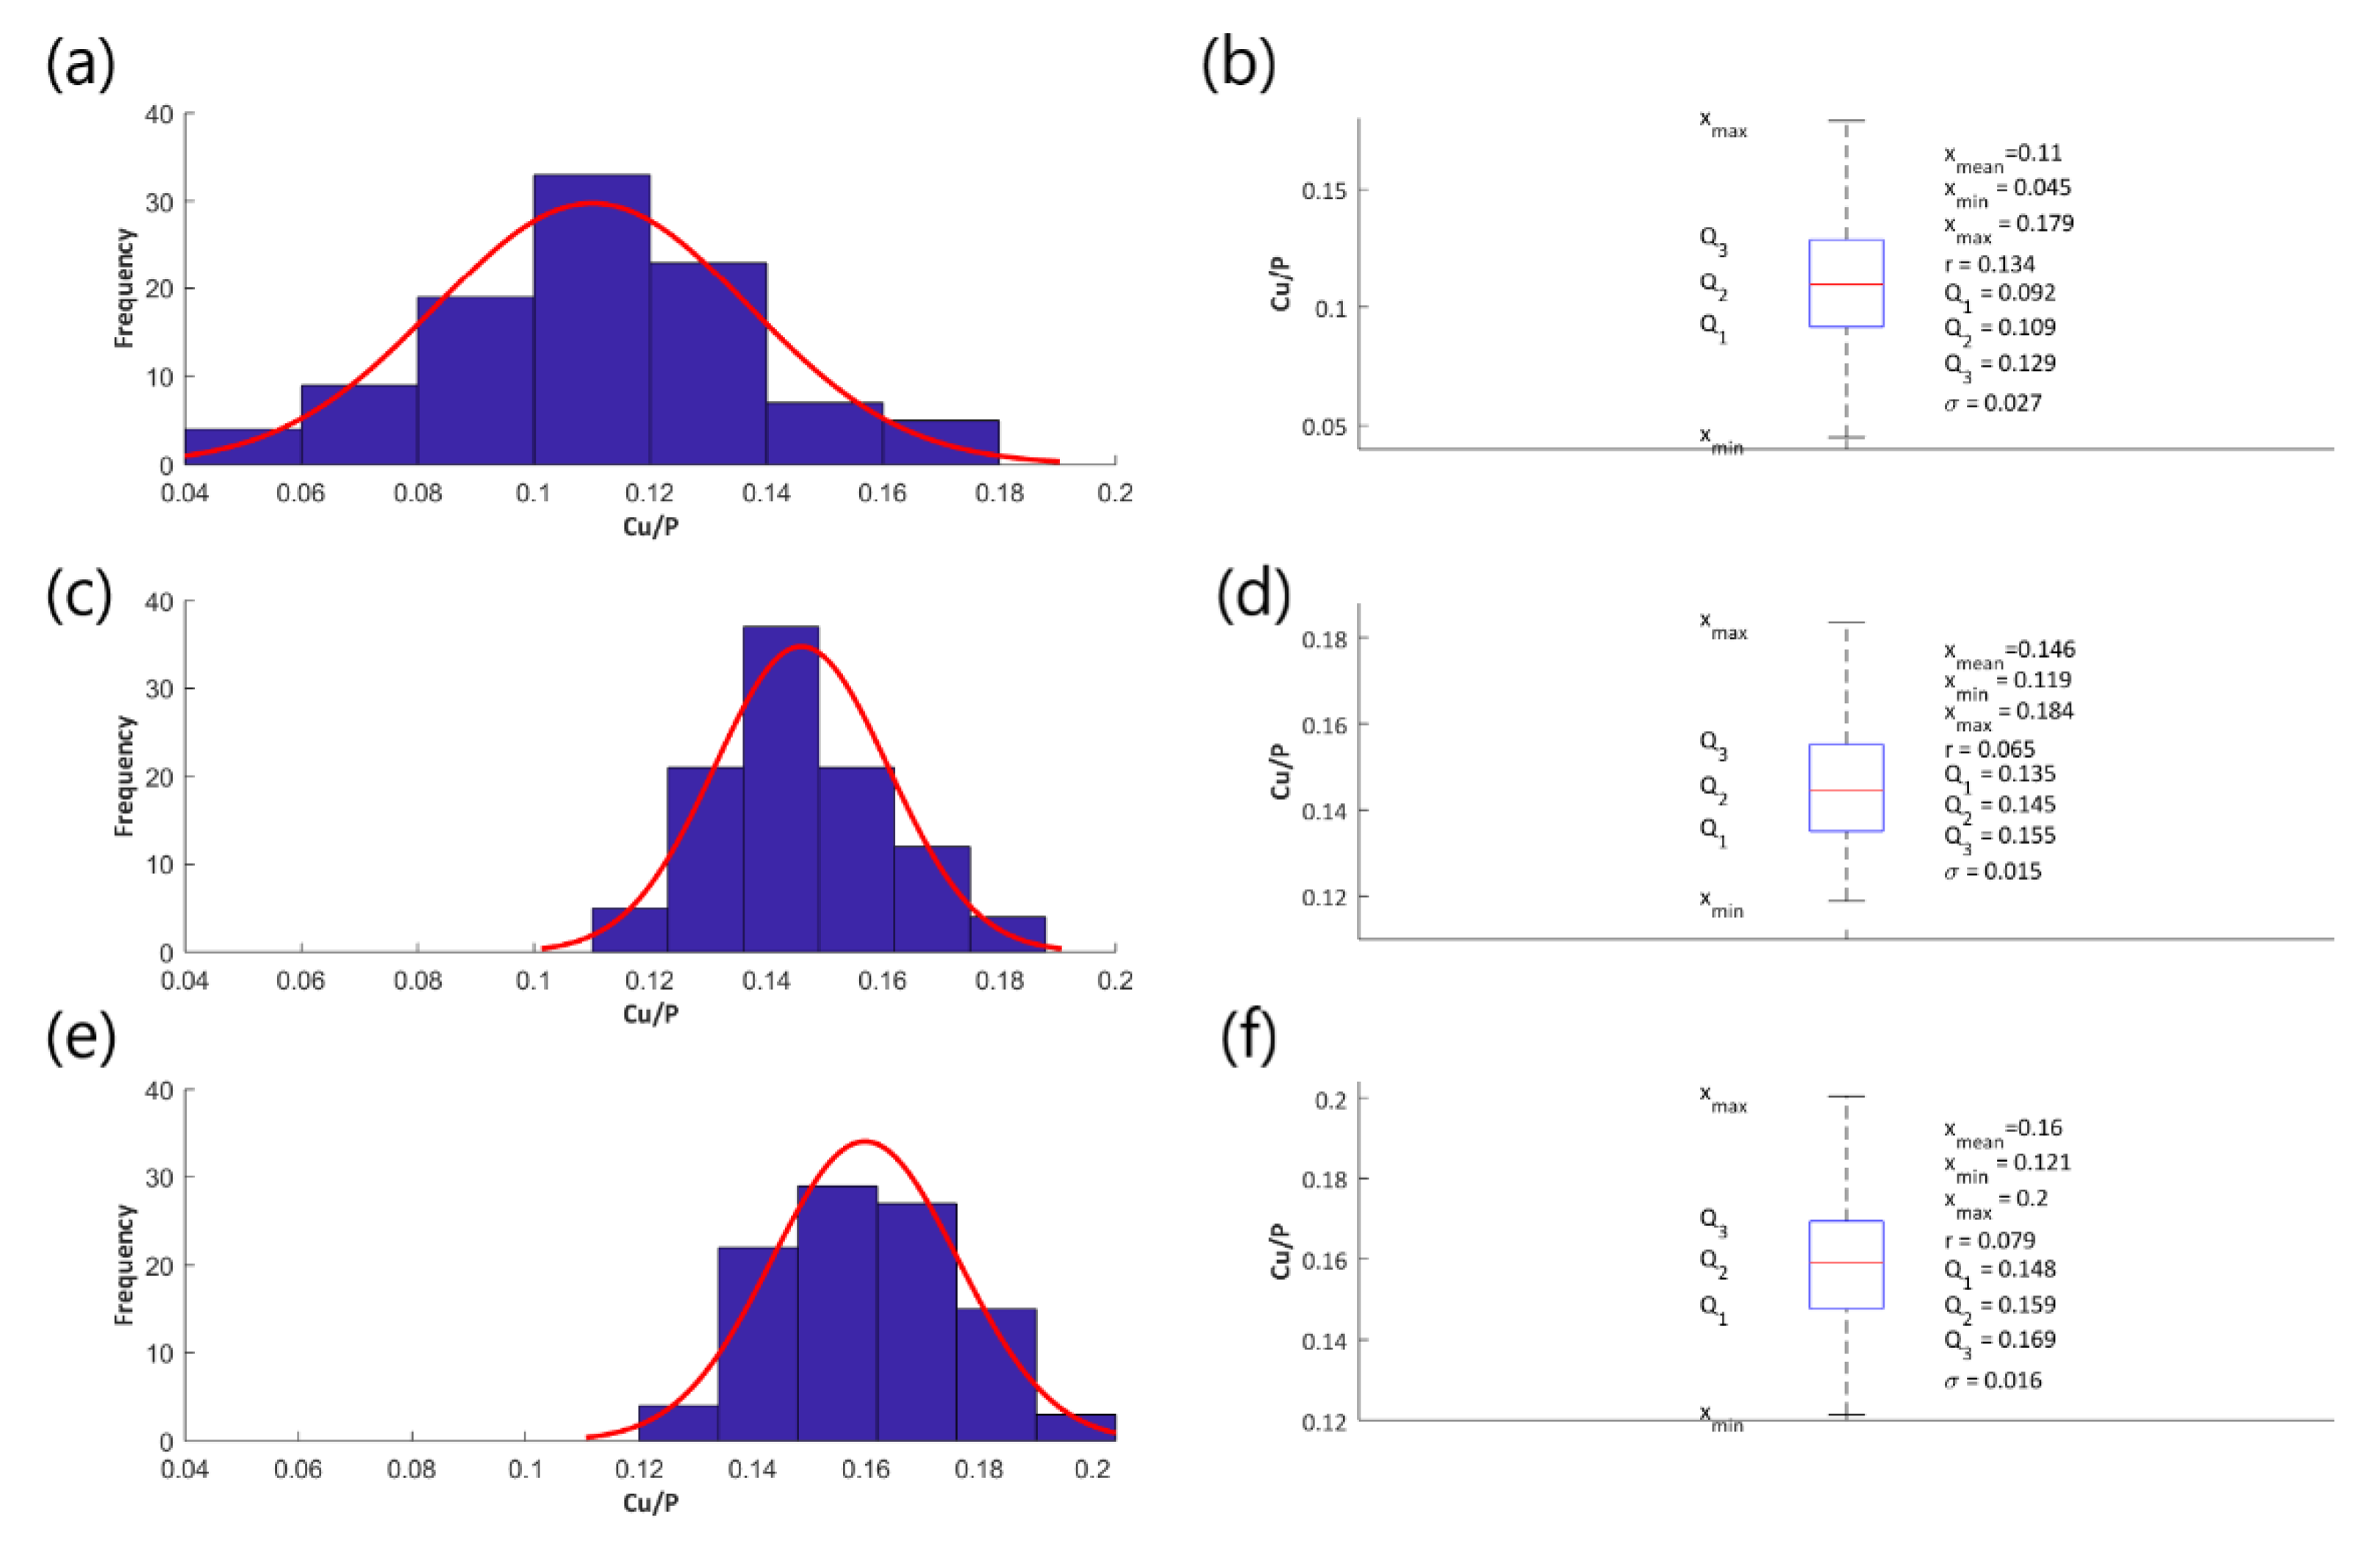
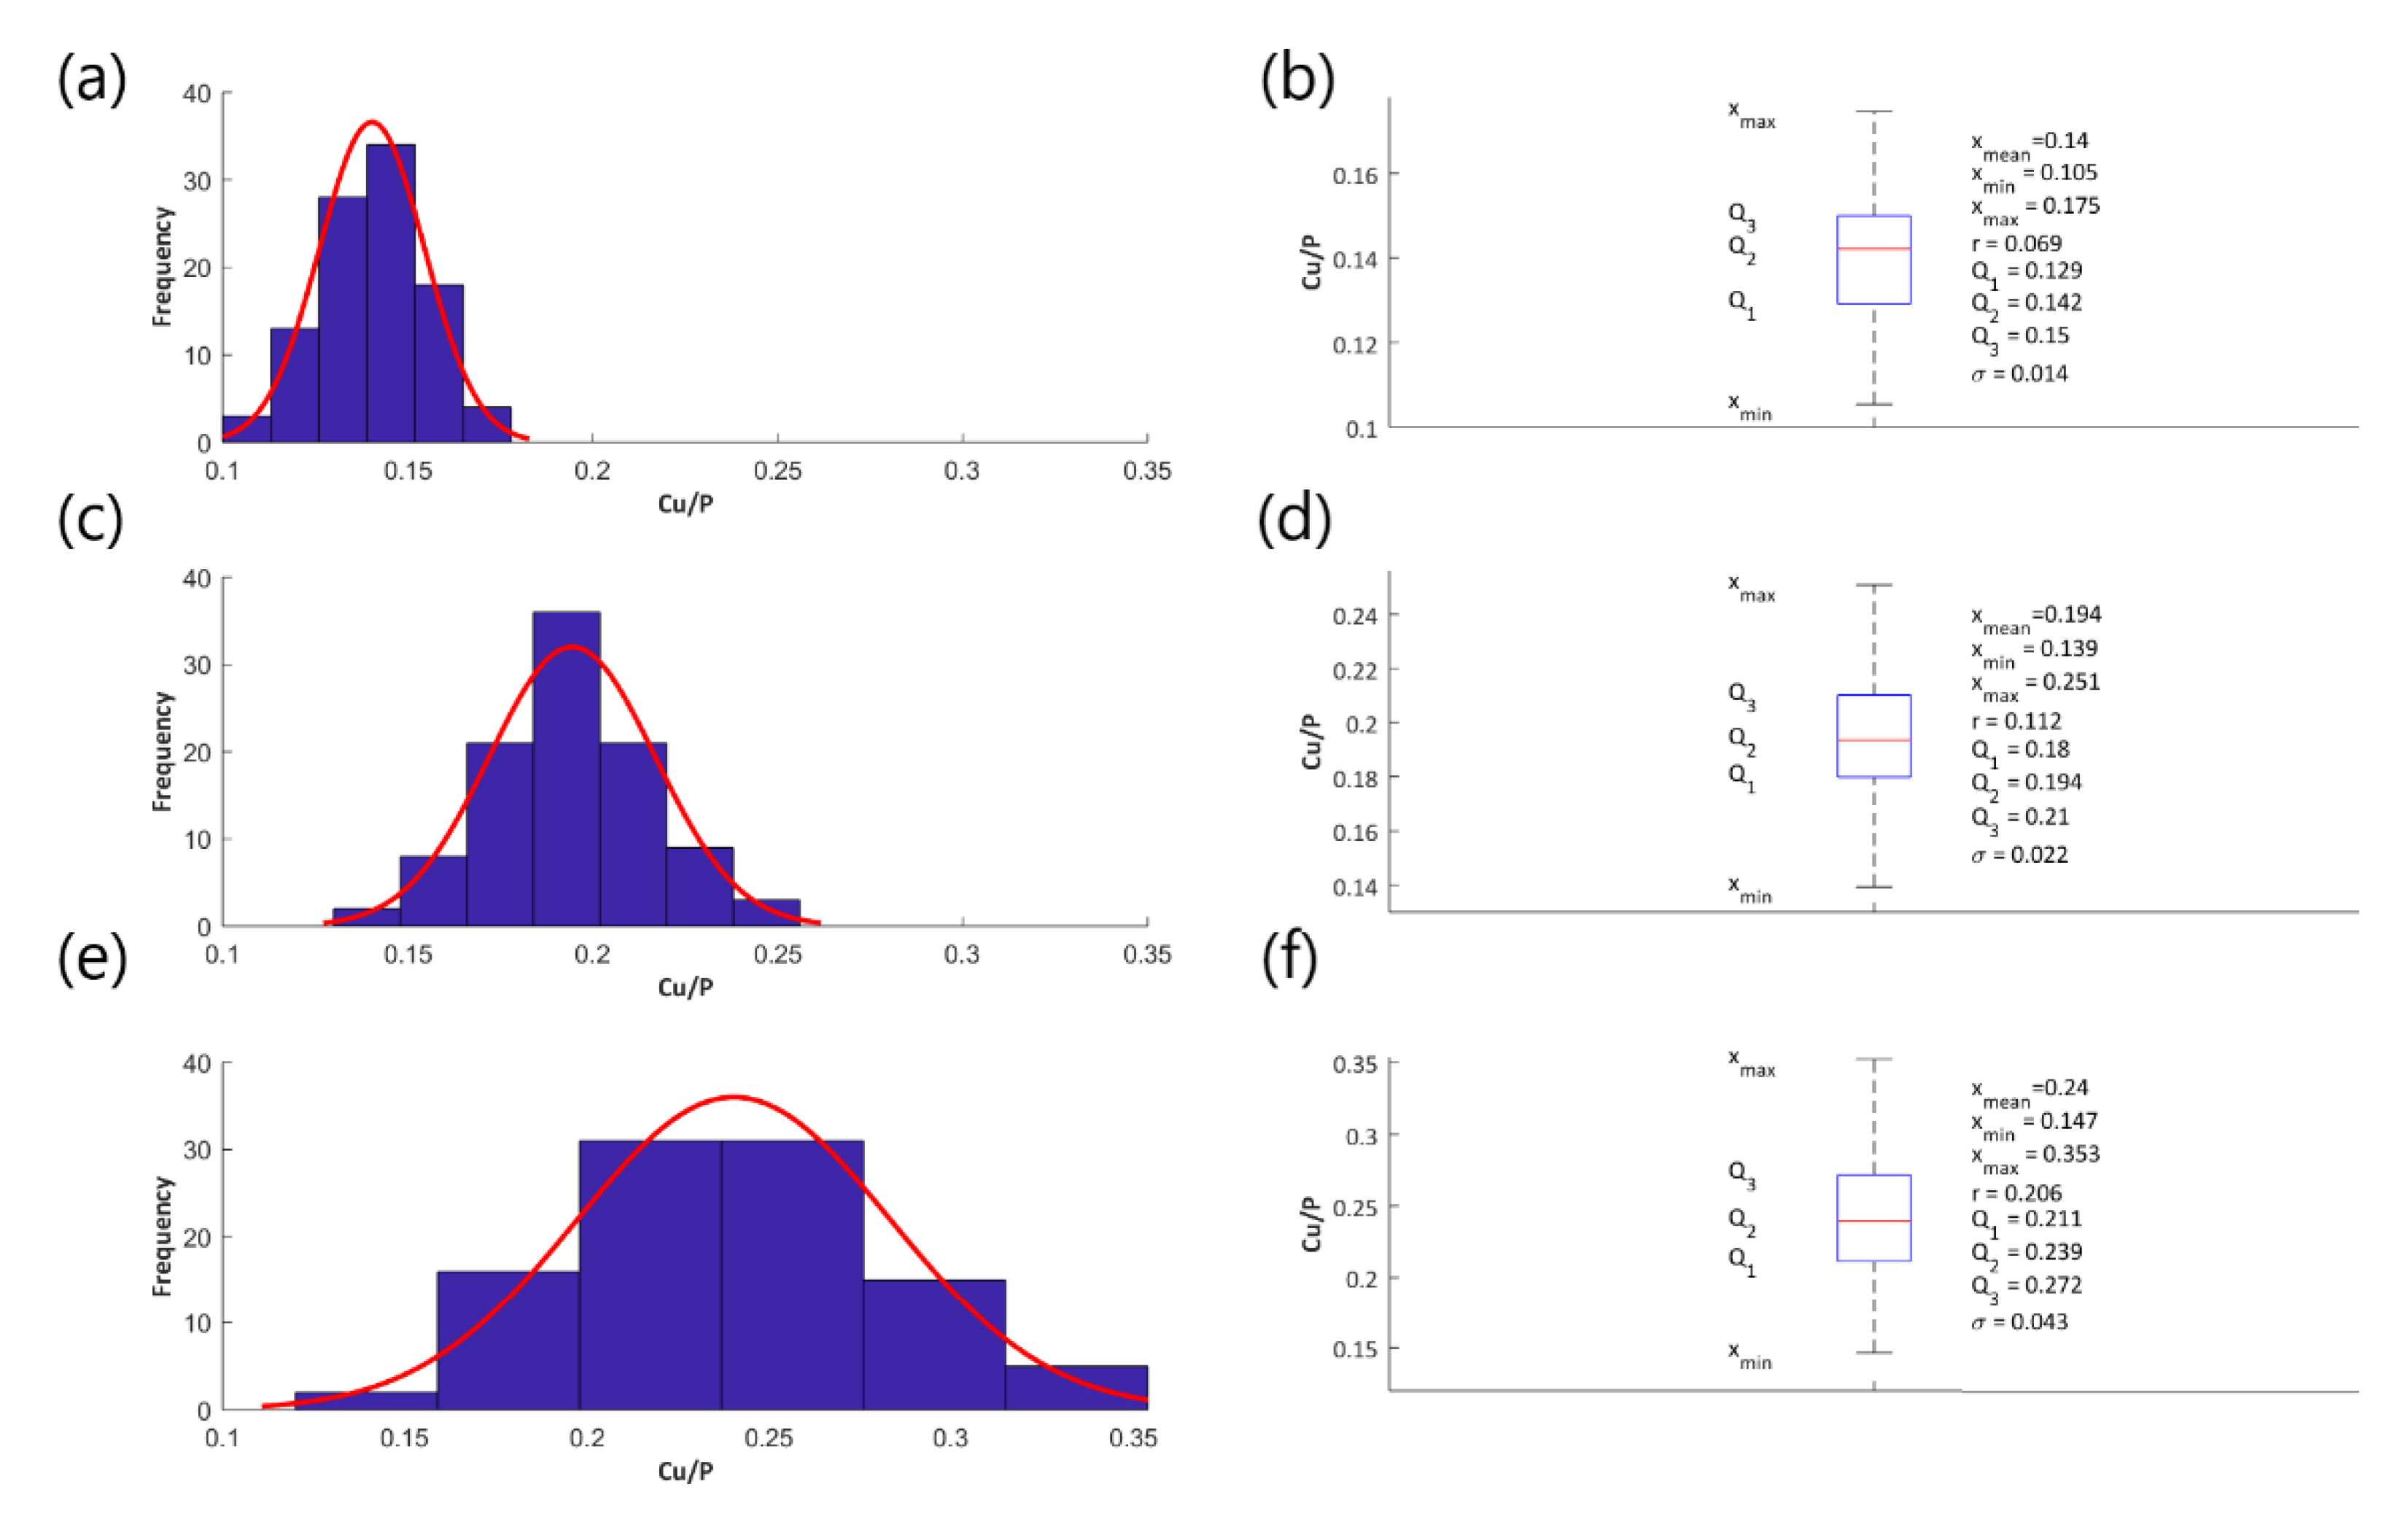
- The higher the voltage, the higher the amount of copper in PEO coating.
- (c)
- The higher the amount of Cu(NO3)2∙3H2O used, the higher the amount of copper in PEO coating.
- (d)
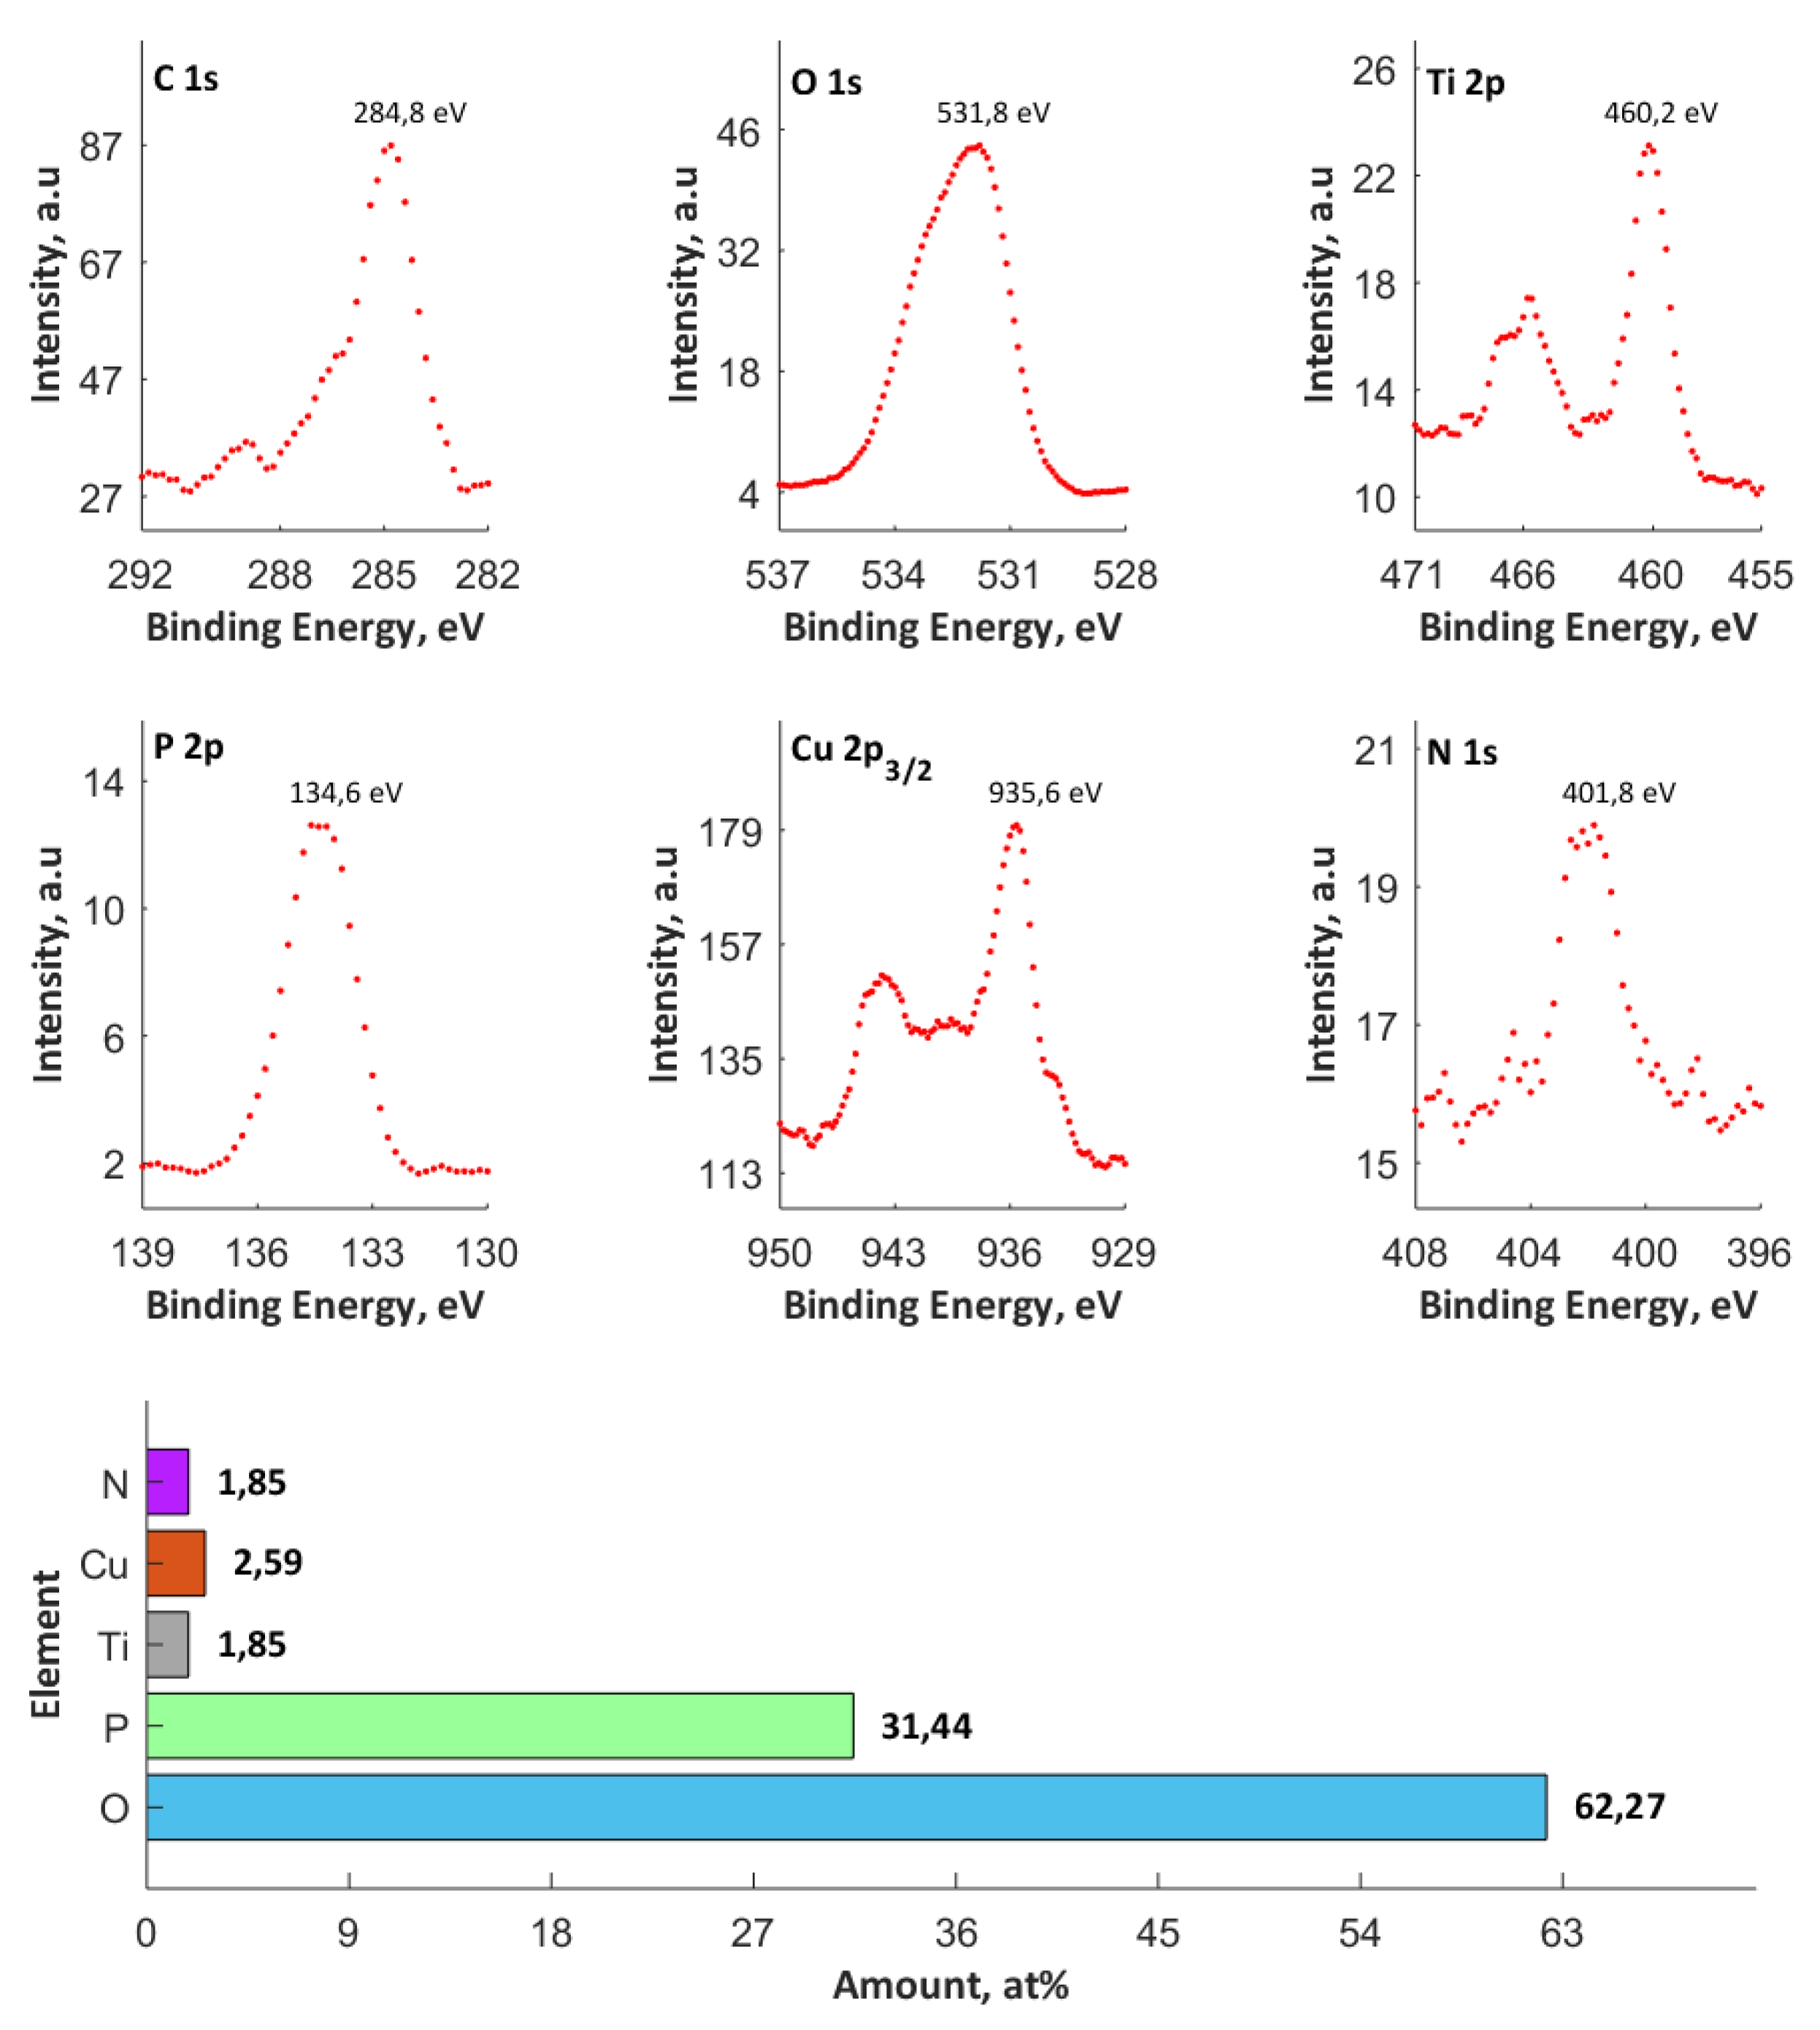
- The top (10 nm) of PEO coatings contain Ti4+, Cu+, and Cu2+, as well as PO43–, and/or HPO42–, and/or H2PO4–, and/or P2O72–.
- (e)
- The maximum atomic concentration of copper (based on XPS results) in the top surface of PEO coatings equaled 2.59% for the process that was performed in electrolyte consisting of orthophosphoric acid and the copper(II) nitrate(V) trihydrate of concentration 650 g/dm3 and voltage of 650 V.
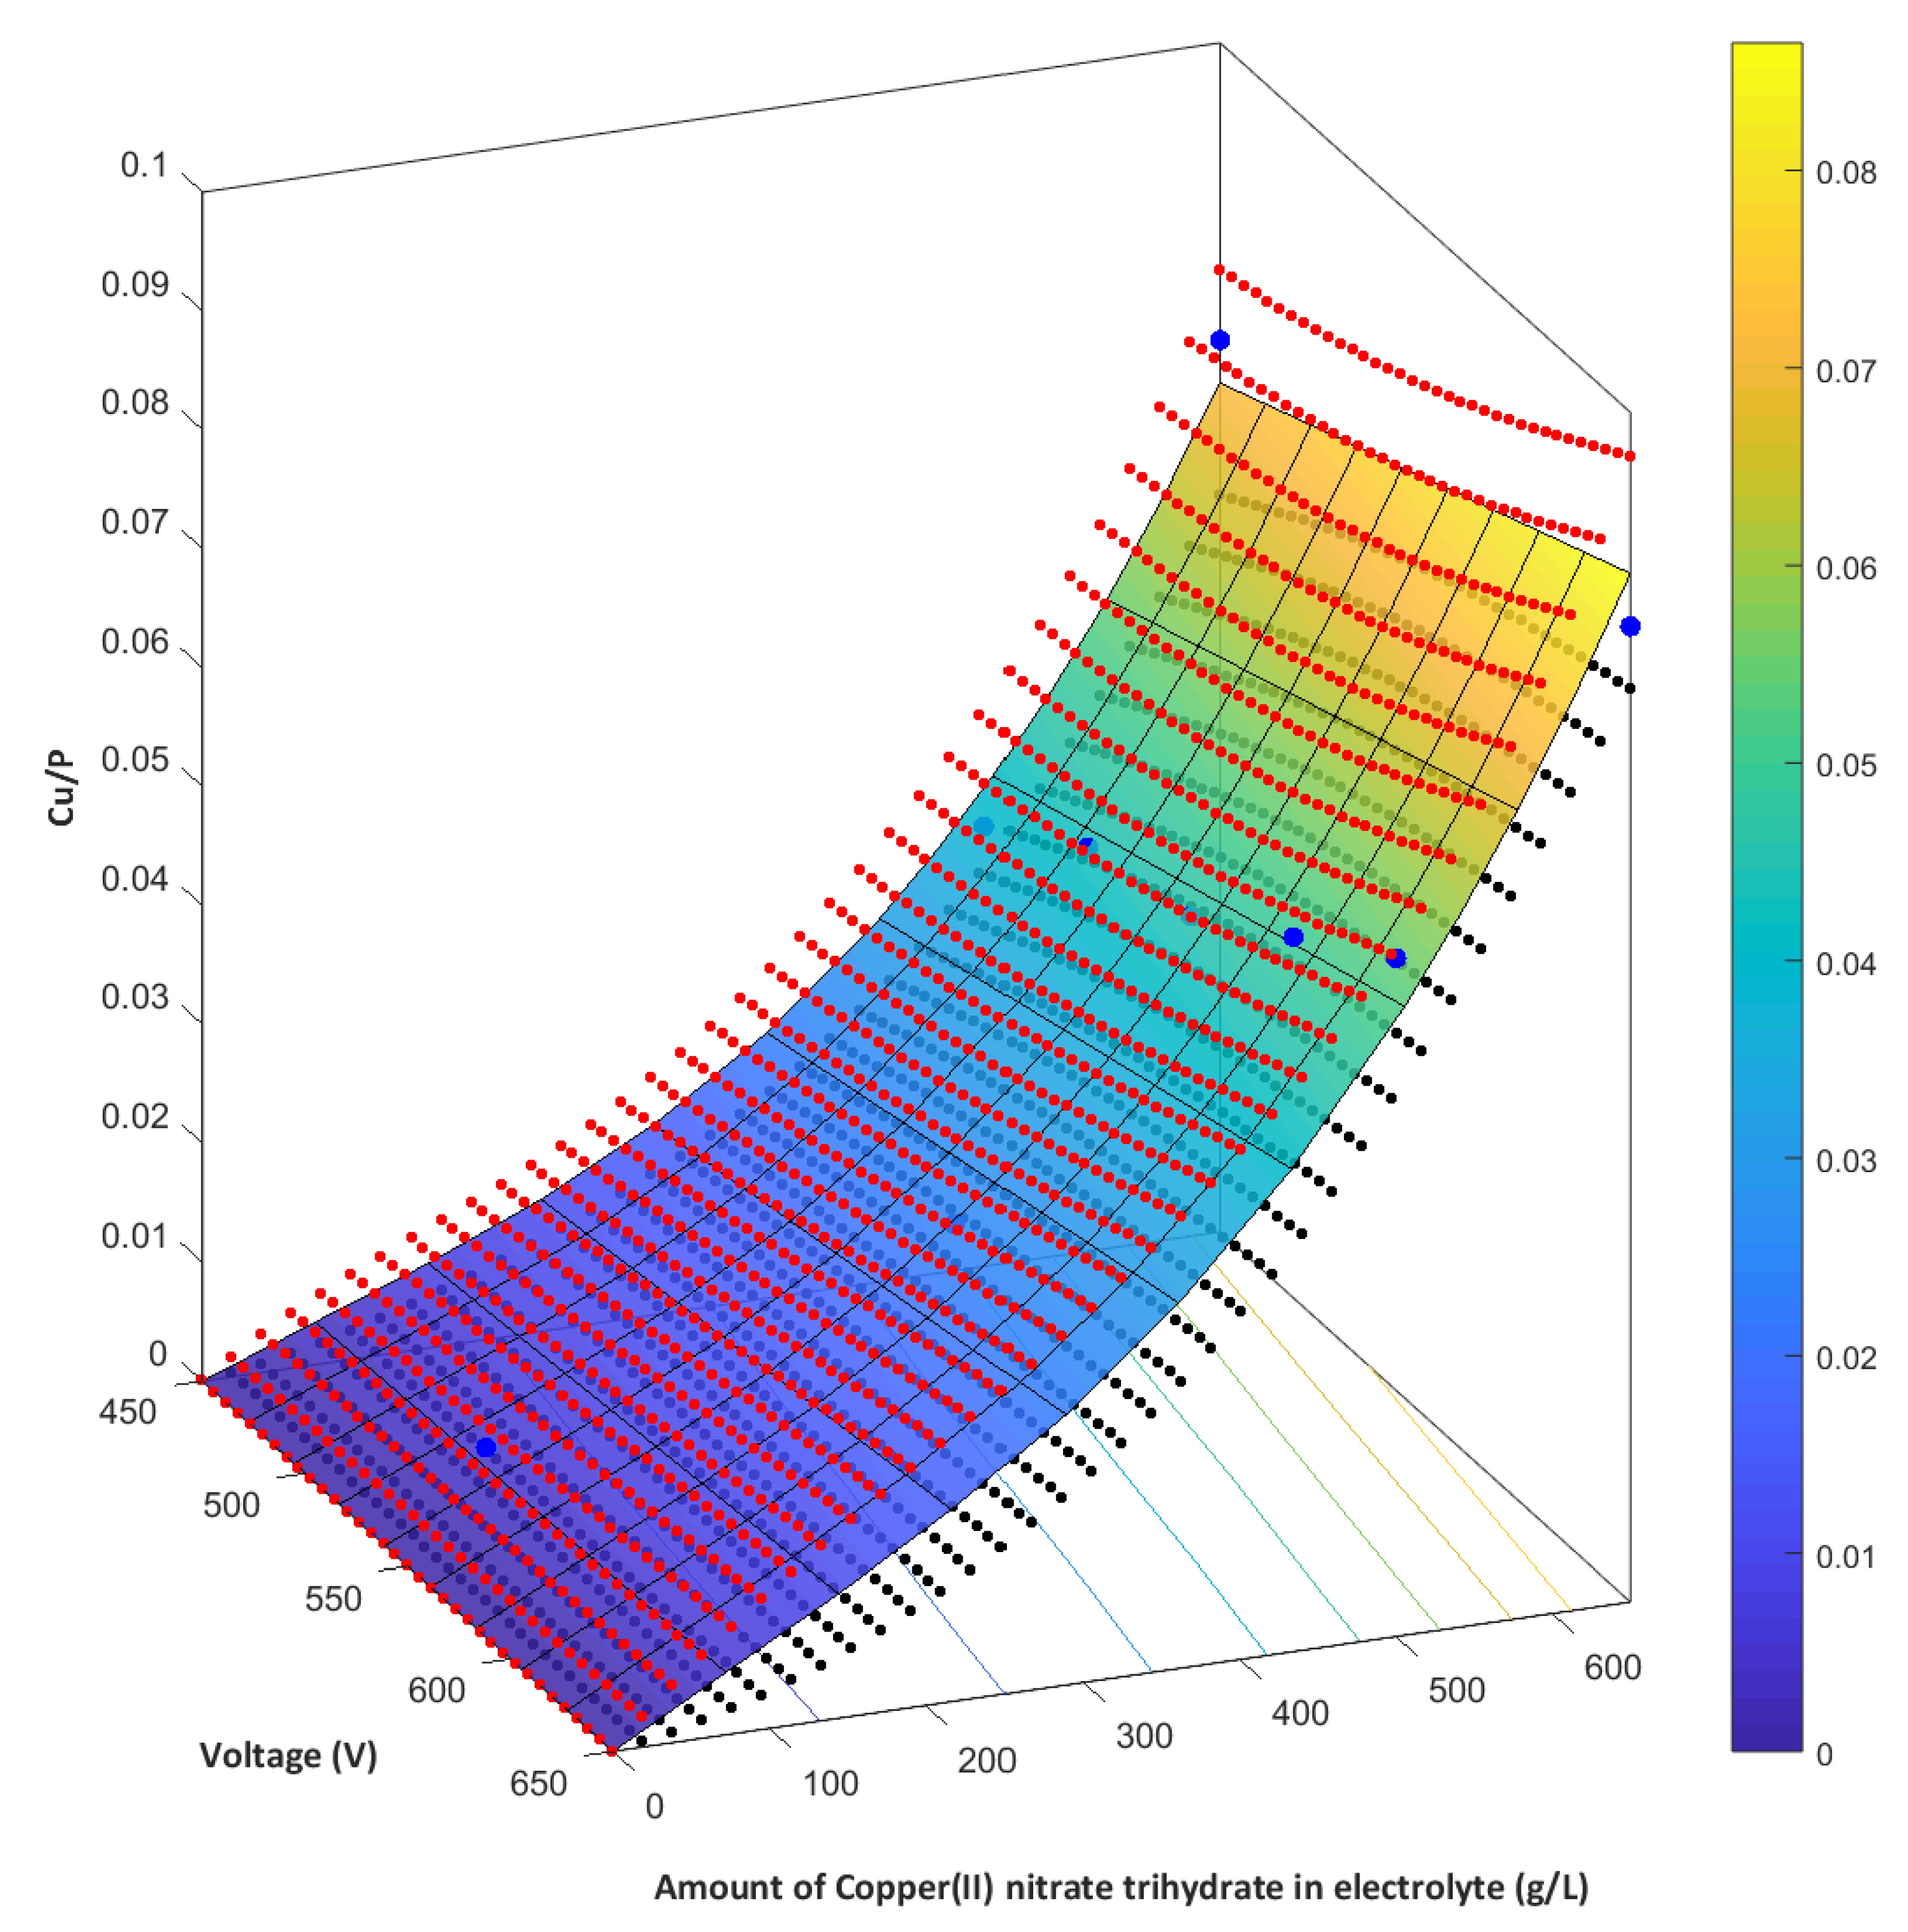
- (f)
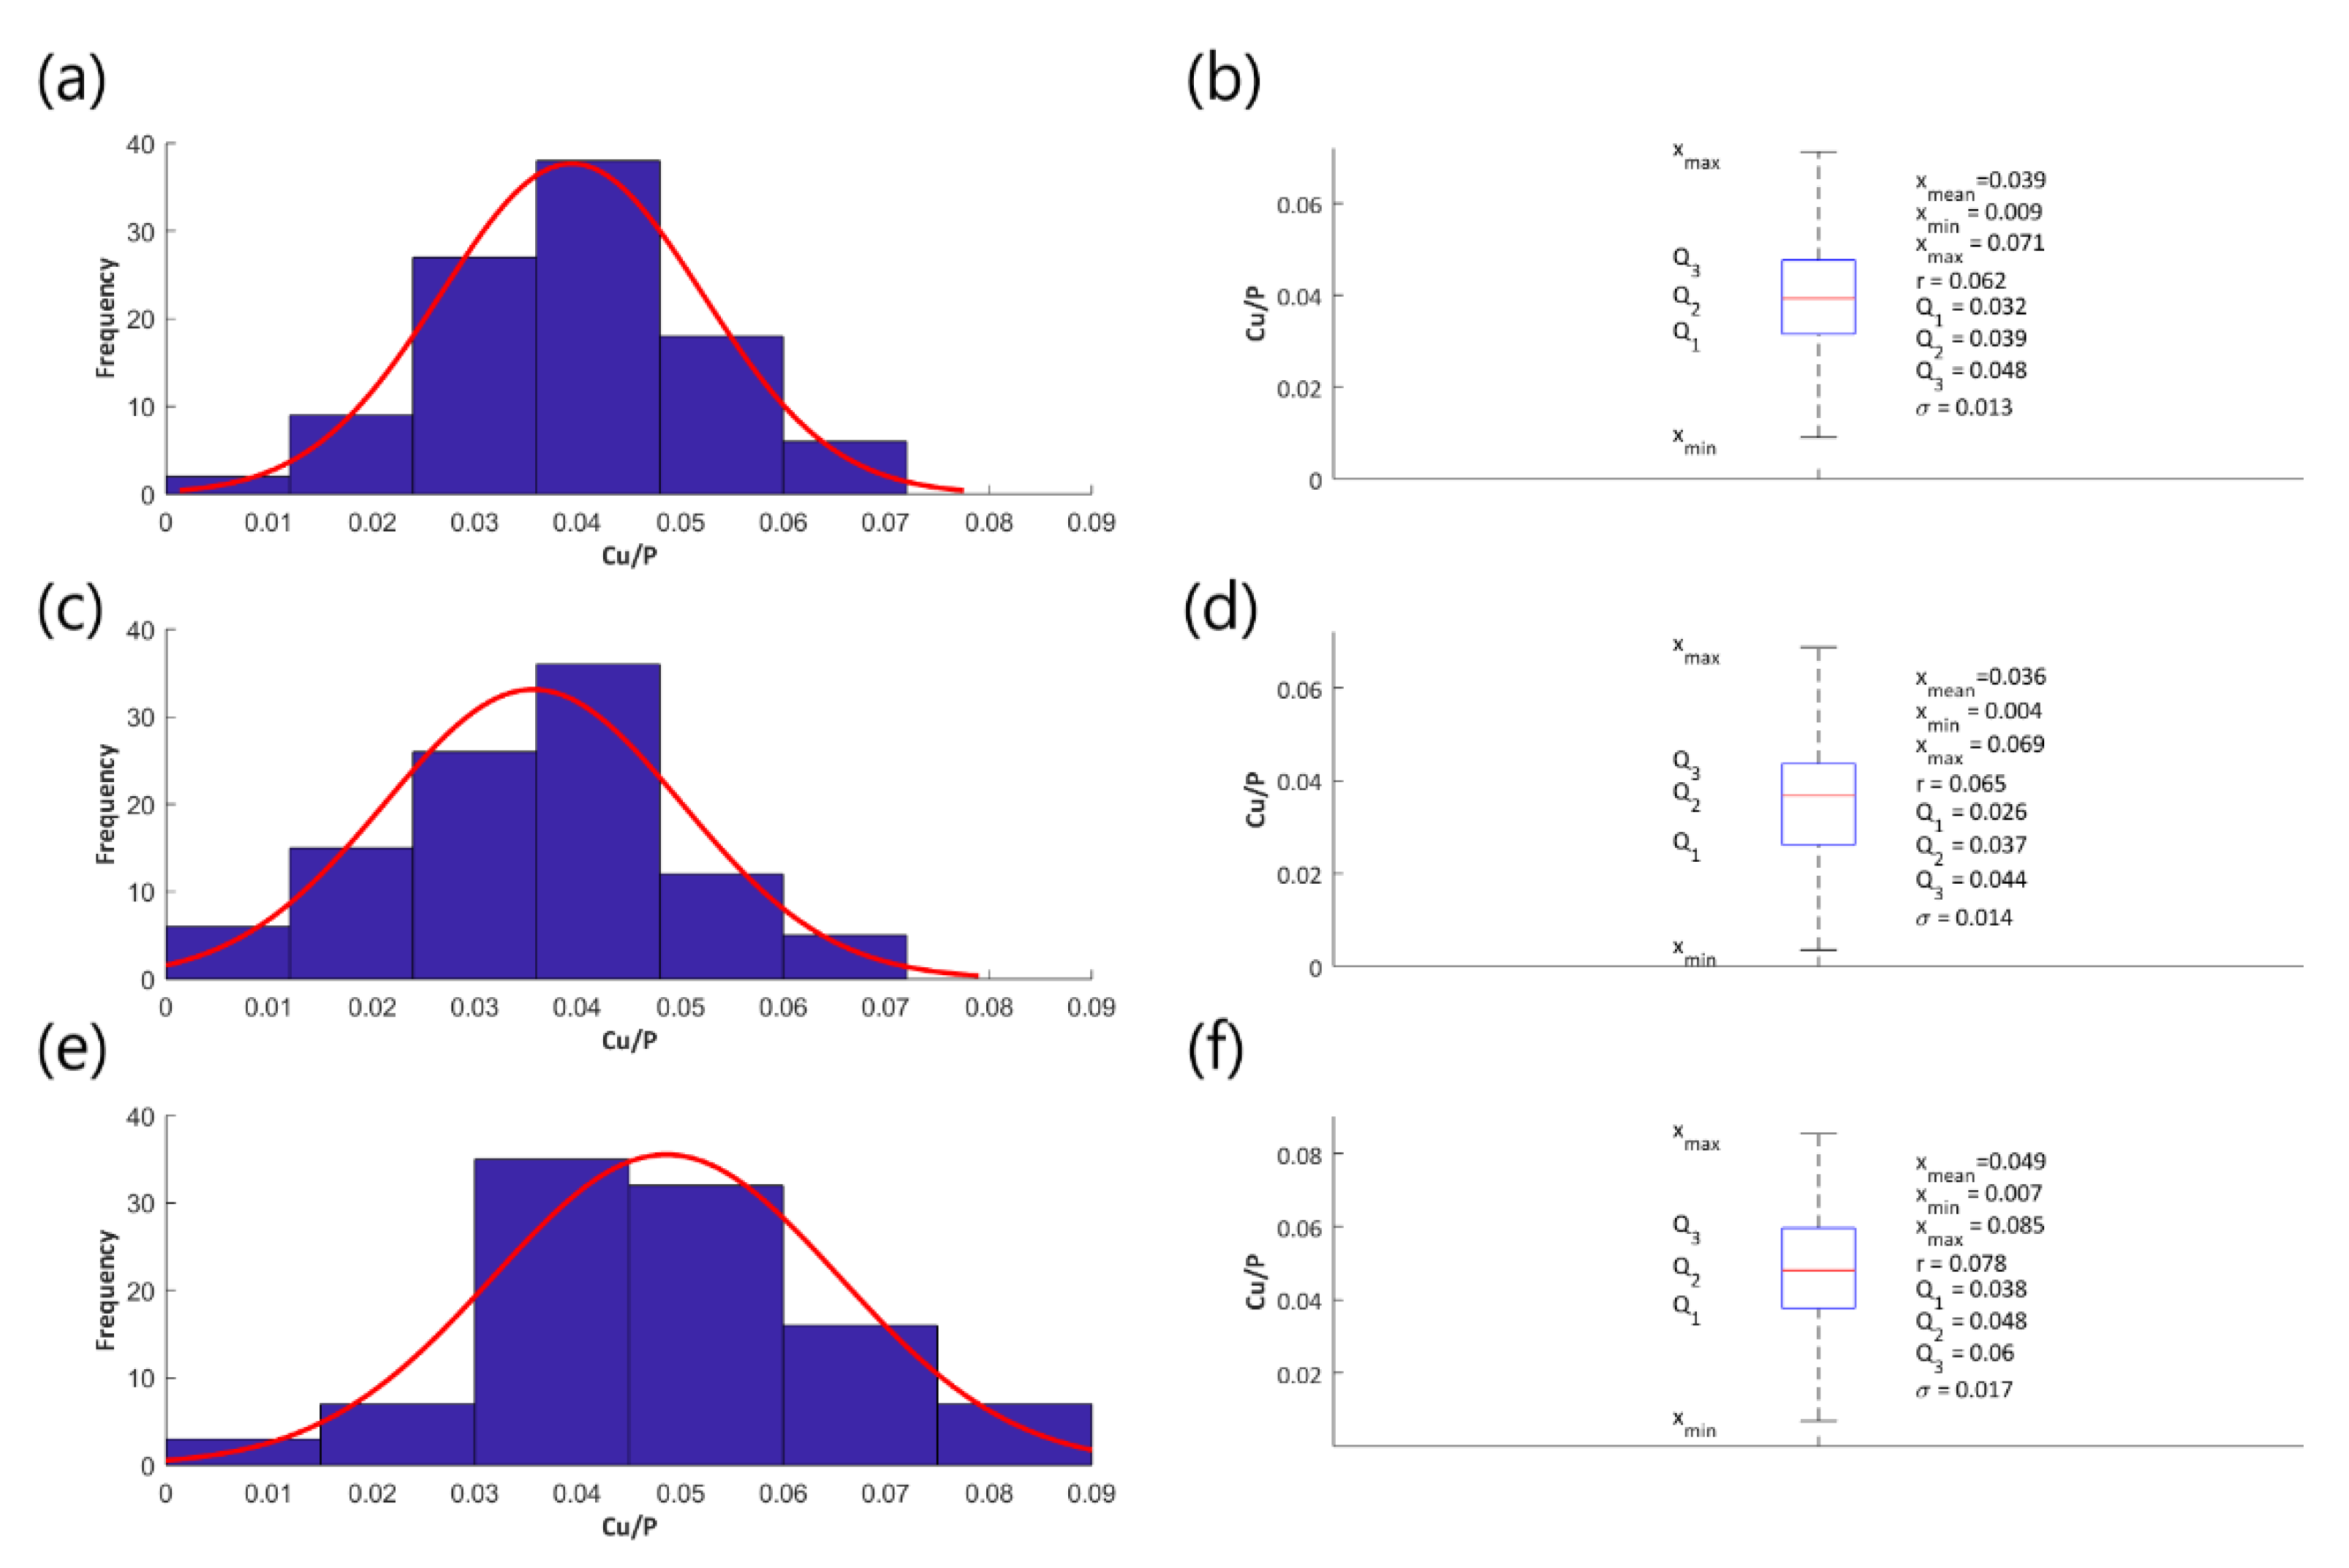
- The Cu/P ratios (based on XPS results) on the obtained samples, fabricated in electrolyte with 0-650 g/dm3 Cu(NO3)2 and voltages between 450 V and 650 V, are in the range of 0.009 up to 0.082.
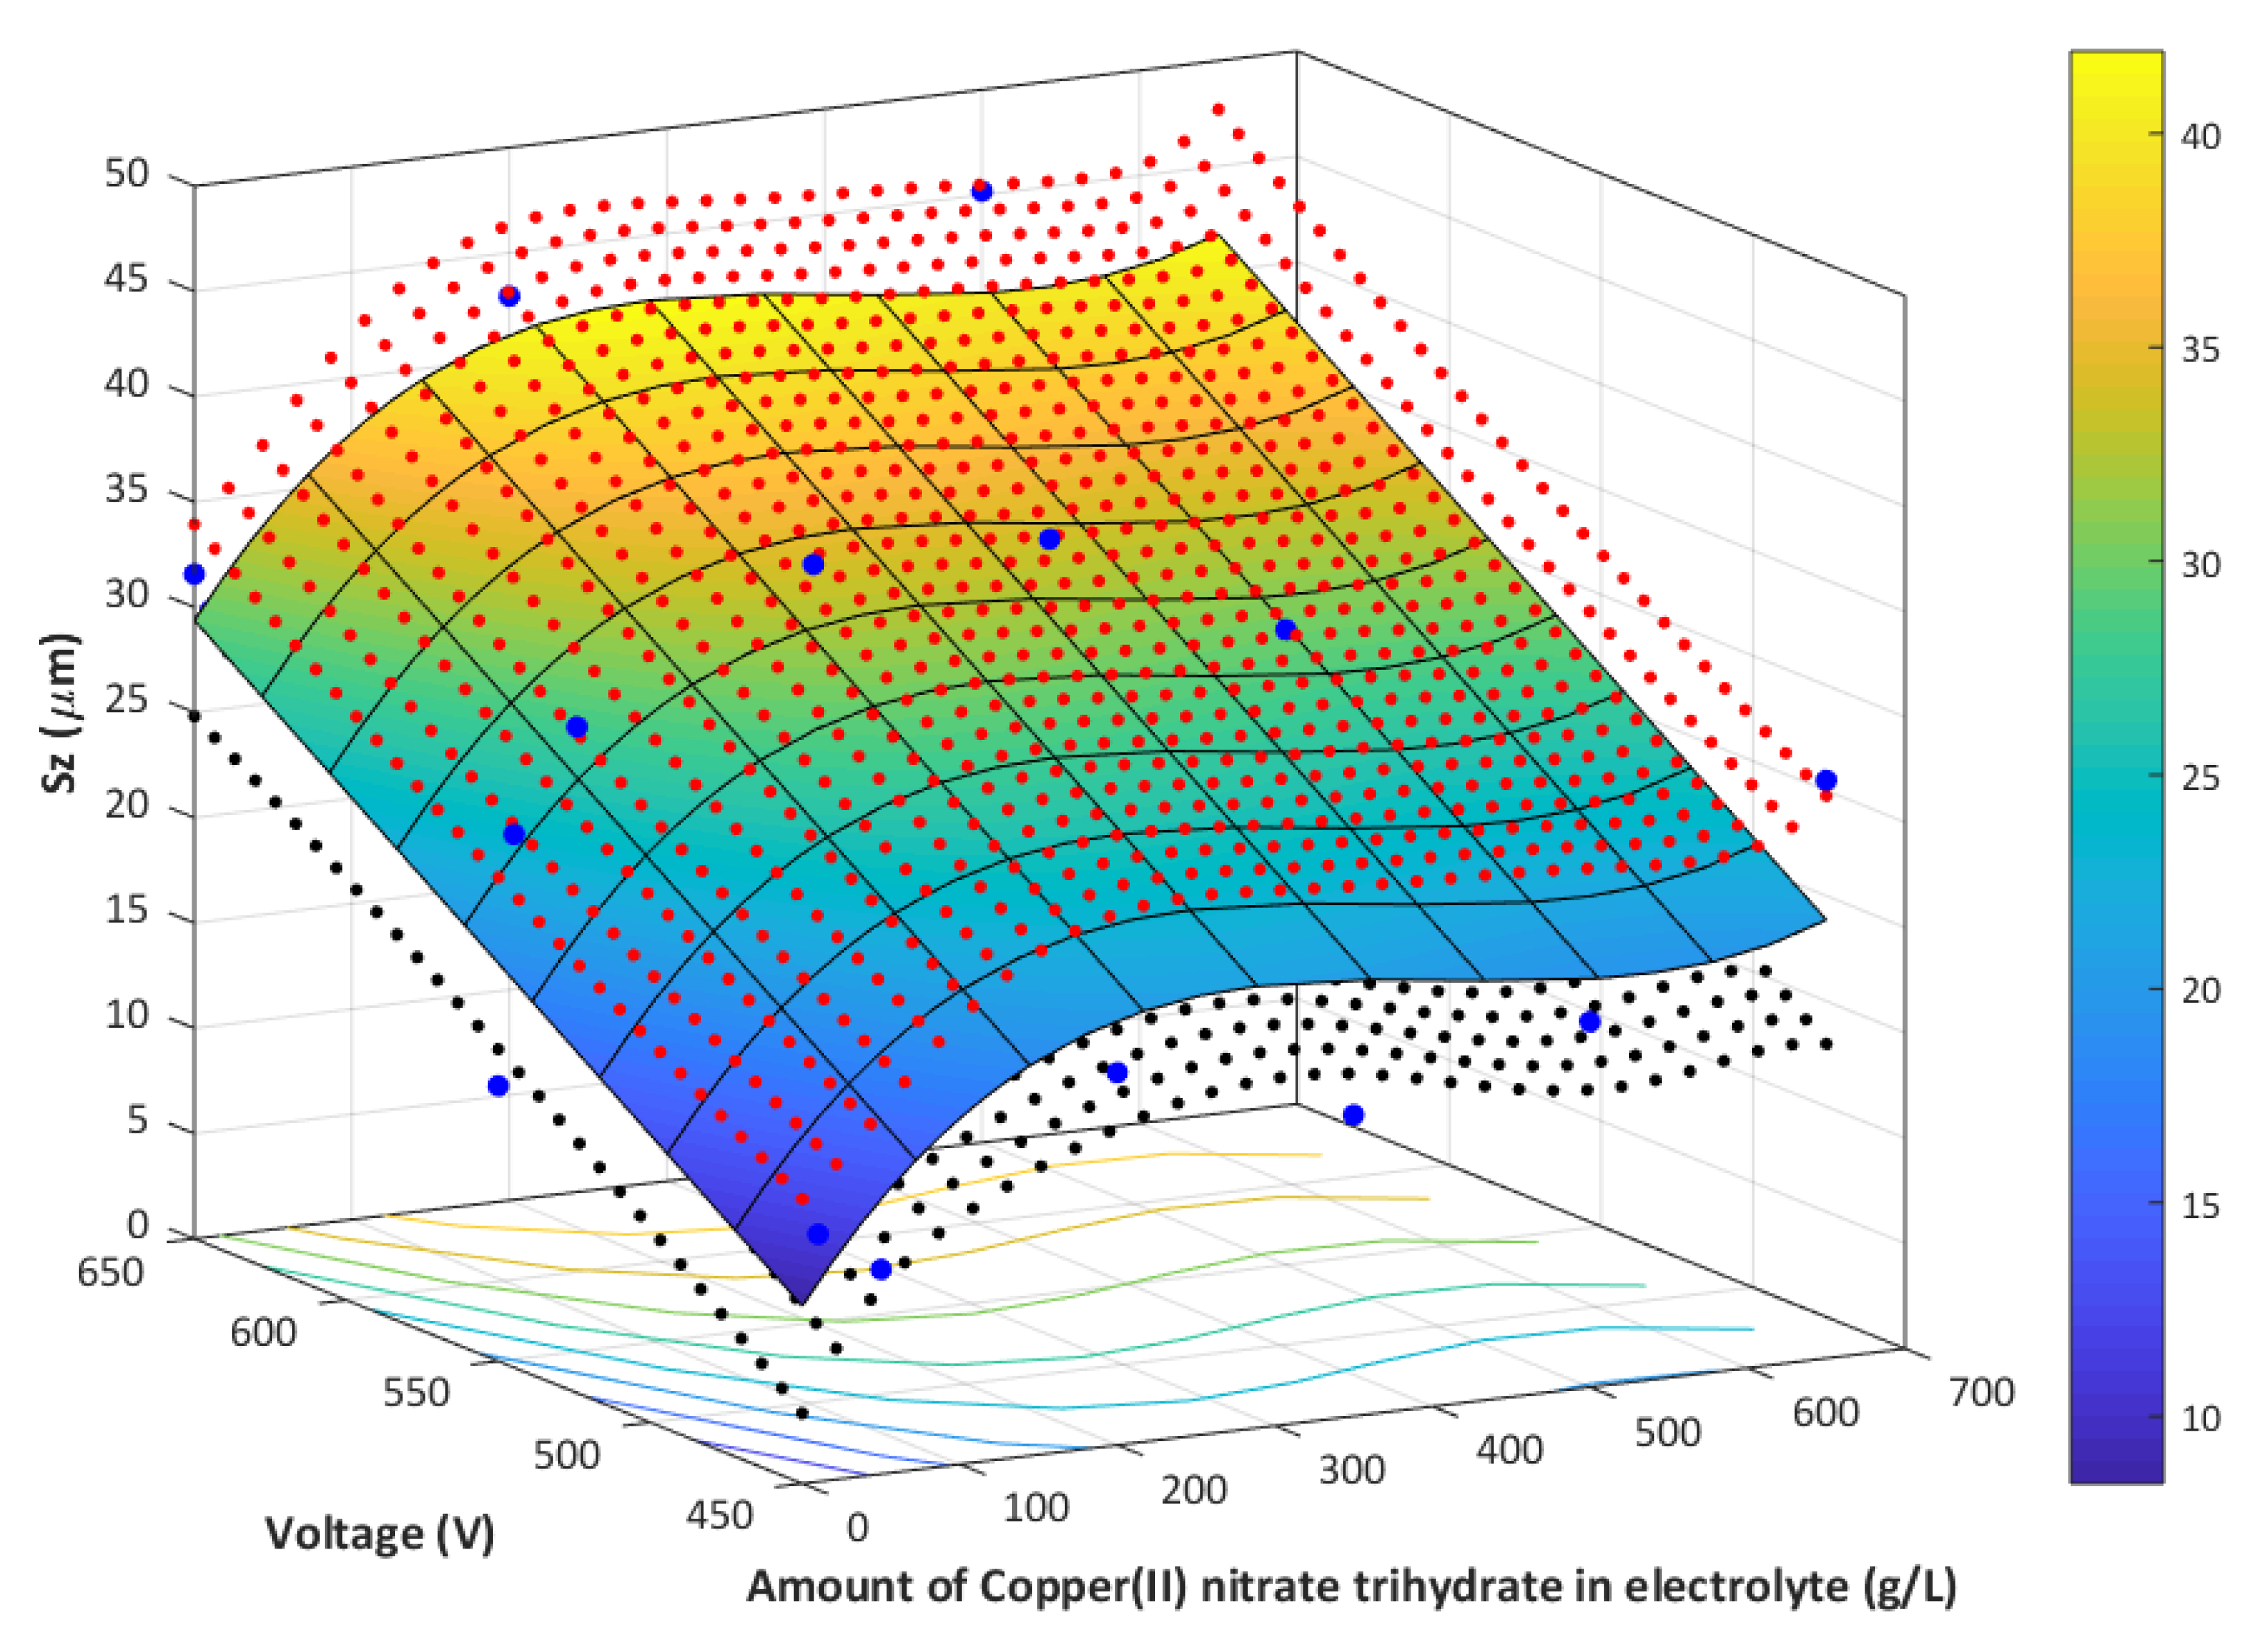
- (g)
- The 3D roughness parameters (Sz/Sa) of the obtained samples, fabricated in electrolyte with 0–650 g/dm3 Cu(NO3)2 and voltages between 450 V and 650 V, are in the range of 9.72 μm/0.99 μm, up to 45.18 μm/3.42 μm.
- (h)
- The thicknesses of PEO coatings, obtained in electrolyte with 350 g/dm3 Cu(NO3)2 and at voltages between 450V and 650 V, are in the range from 9.6 μm up to 27.8 μm.
Supplementary Materials
Author Contributions
Funding
Conflicts of Interest
References
- Rokosz, K.; Hryniewicz, T.; Raaen, S.; Chapon, P.; Dudek, L. GDOES, XPS, and SEM with EDS analysis of porous coatings obtained on titanium after plasma electrolytic oxidation. Surf. Interface Anal. 2017, 49, 303–315. [Google Scholar] [CrossRef]
- Rokosz, K.; Hryniewicz, T.; Raaen, S.; Chapon, P. Investigation of porous coatings obtained on Ti-Nb-Zr-Sn alloy biomaterial by plasma electrolytic oxidation: Characterisation and modelling. Int. J. Adv. Manuf. Technol. 2016, 87, 3497–3512. [Google Scholar] [CrossRef]
- Rokosz, K.; Hryniewicz, T.; Matysek, D.; Dudek, L.; Malorny, W. SEM and EDS analysis of nitinol surfaces treated by plasma electrolytic oxidation. Adv. Mater. Sci. 2015, 15, 41–47. [Google Scholar] [CrossRef][Green Version]
- Rokosz, K.; Hryniewicz, T.; Raaen, S.; Matysek, D.; Dudek, L.; Pietrzak, K. SEM, EDS, and XPS characterization of coatings obtained on titanium during AC plasma electrolytic process enriched in magnesium. Adv. Mater. Sci. 2018, 18, 68–78. [Google Scholar] [CrossRef]
- Marques, I.S.V.; Nilson, C.C.; Landers, R.; Yuan, J.C.C.; Mesquita, M.F.; Sukotjo, C.; Mathew, T.; Barao, V.A.D. Incorporation of Ca, P, and Si on bioactive coatings produced by plasma electrolytic oxidation: The role of electrolyte concentration and treatment duration. Biointerphases 2015, 10, 1–12. [Google Scholar] [CrossRef] [PubMed]
- Zhang, L.; Guo, J.Q.; Huang, X.Y.; Zhang, Y.N.; Han, Y. The dual function of Cu-doped TiO2 coatings on titanium for application in percutaneous implants. J. Mater. Chem. B 2016, 4, 3788–3800. [Google Scholar] [CrossRef]
- Zhou, R.; Wei, D.; Cheng, S.; Zhou, Y.; Jia, D.; Wang, Y.; Li, B. The effect of titanium bead diameter of porous titanium on the formation of micro-arc oxidized TiO2-based coatings containing Si and Ca. Ceram. Int. 2013, 39, 5725–5732. [Google Scholar] [CrossRef]
- Yavari, S.A.; Necula, B.S.; Fratila-Apachitei, L.E.; Duszczyk, J.; Apachitei, I. Biofunctional surfaces by plasma electrolytic oxidation on titanium biomedical alloys. Surf. Eng. 2016, 32, 411–417. [Google Scholar] [CrossRef]
- Zhou, R.; Wei, D.; Yang, H.; Cheng, S.; Feng, W.; Li, B.; Wang, Y.; Jia, D.; Zhou, Y. Osseointegration of bioactive microarc oxidized amorphous phase/TiO2 nanocrystals composited coatings on titanium after implantation into rabbit tibia. J. Mater. Sci. Mater. Med. 2014, 25, 1307–1318. [Google Scholar] [CrossRef]
- Mirelman, L.K.; Curran, J.A.; Clyne, T.W. The production of anatase-rich photoactive coatings by plasma electrolytic oxidation. Surf. Coat. Technol. 2012, 207, 66–71. [Google Scholar] [CrossRef]
- Peláez-Abellán, E.; Duarte, L.T.; Biaggio, S.R.; Rocha-Filho, R.C.; Bocchi, N. Modification of the titanium oxide morphology and composition by a combined chemical-electrochemical treatment on cp Ti. Mater. Res. 2012, 15, 159–165. [Google Scholar] [CrossRef]
- Zhu, L.; Ye, X.; Tang, G.; Zhao, N.; Gong, Y.; Zhao, Y.; Zhao, J.; Zhang, X. Corrosion test, cell behavior test, and in vivo study of gradient TiO2 layers produced by compound electrochemical oxidation. J. Biomed. Mater. Res. A 2006, 78, 515–522. [Google Scholar] [CrossRef] [PubMed]
- Terleeva, O.P.; Sharkeev, Y.P.; Slonova, A.I.; Mironov, I.V.; Legostaeva, E.V.; Khlusov, I.A.; Matykina, E.; Skeldon, P.; Thompson, G.E. Effect of microplasma modes and electrolyte composition on micro-arc oxidation coatings on titanium for medical applications. Surf. Coat. Technol. 2010, 205, 1723–1729. [Google Scholar] [CrossRef]
- Wang, S.; Zhao, Q.; Liu, D.; Du, N. Microstructure and elevated temperature tribological behavior of TiO2/Al2O3 composite ceramic coating formed by microarc oxidation of Ti6Al4V alloy. Surf. Coat. Technol. 2015, 272, 343–349. [Google Scholar] [CrossRef]
- Teh, T.H.; Berkani, A.; Mato, S.; Skeldon, P.; Thompson, G.E.; Habazaki, H.; Shimizu, K. Initial stages of plasma electrolytic oxidation of titanium. Corros. Sci. 2003, 45, 2757–2768. [Google Scholar] [CrossRef]
- Hariprasad, S.; Ashfaq, M.; Arunnellaiappan, T.; Harilal, M.; Rameshbabu, N. Role of electrolyte additives on in-vitro corrosion behavior of DC plasma electrolytic oxidization coatings formed on CP-Ti. Surf. Coat. Technol. 2016, 292, 20–29. [Google Scholar]
- Rudnev, V.S.; Yarovaya, T.P.; Egorkin, V.S.; Sinebryukov, S.L.; Gnedenkov, S.V. Properties of coatings formed on titanium by plasma electrolytic oxidation in a phosphate-borate electrolyte. Russ. J. Appl. Chem. 2010, 83, 664–670. [Google Scholar] [CrossRef]
- Sharifi, H.; Aliofkhazraei, M.; Darband, G.; Rouhaghdam, A.S. Characterization of PEO nanocomposite coatings on titanium formed in electrolyte containing atenolol. Surf. Coat. Technol. 2016, 304, 438–449. [Google Scholar] [CrossRef]
- Tang, H.; Sun, Q.; Yi, C.G.; Jiang, Z.H.; Wang, F.P. High emissivity coatings on titanium alloy prepared by micro-arc oxidation for high temperature application. J. Mater. Sci. 2012, 47, 2162–2168. [Google Scholar] [CrossRef]
- Tang, H.; Xin, T.Z.; Sun, Q.; Yi, C.G.; Jiang, Z.H.; Wang, F.P. Influence of FeSO4 concentration on thermal emissivity of coatings formed on titanium alloy by micro-arc oxidation. Appl. Surf. Sci. 2011, 257, 10839–10844. [Google Scholar] [CrossRef]
- Tang, H.; Sun, Q.; Xin, T.Z.; Yi, C.G.; Jiang, Z.H.; Wang, F.P. Influence of Co(CH3COO)2 concentration on thermal emissivity of coatings formed on titanium alloy by micro-arc oxidation. Curr. Appl. Phys. 2012, 12, 284–290. [Google Scholar] [CrossRef]
- Aliasghari, S. Plasma Electrolytic Oxidation of Titanium. Ph.D. Thesis, The University of Manchester, Manchester, UK, 2014. [Google Scholar]
- Liu, S.M.; Yang, X.J.; Cui, Z.D.; Zhu, S.L.; Wei, Q. One-step synthesis of petal-like apatite/titania composite coating on a titanium by micro-arc treating. Mater. Lett. 2011, 65, 1041–1044. [Google Scholar] [CrossRef]
- Zhang, W.; Du, K.; Yan, C.; Wang, F. Preparation and characterization of a novel Si-incorporated ceramic film on pure titanium by plasma electrolytic oxidation. Appl. Surf. Sci. 2008, 254, 5216–5223. [Google Scholar] [CrossRef]
- Rokosz, K.; Hryniewicz, T.; Kacalak, W.; Tandecka, K.; Raaen, S.; Gaiaschi, S.; Chapon, P.; Malorny, W.; Matysek, D.; Dudek, L.; et al. Characterization of Porous Phosphate Coatings Enriched with Calcium, Magnesium, Zinc and Copper Created on CP Titanium Grade 2 by Plasma Electrolytic Oxidation. Metals 2018, 8, 112. [Google Scholar] [CrossRef]


| Electrolytes | Ref. |
|---|---|
| (NaPO3)6, NaF, NaAlO2 | [12] |
| (NaPO3)6, CaO, Na2H2EDTA, KOH | [13] |
| (NaPO3)6, Na2SiO3, NaAlO2 | [14] |
| Na4P2O7, KOH, NaAlO2 | [15] |
| Na3PO4, (NH4)2HPO4, C2H7NO2, KOH, Na2SO4, (HOCH2)3CNH2 | [16] |
| Na3PO4, Na2B4O7, Na3WO4 | [17] |
| Na3PO4, α-Al2O3 | [18] |
| Na3PO4, Na2SiO3 | [14] |
| Na3PO4, FeSO4, Co(CH3COO)2, Ni(CH3COO)2, K2ZrF6 | [19] |
| Na3PO4, FeSO4 | [20] |
| Na3PO4, Co(CH3COO)2 | [21] |
| Na3PO4, NaAlO2, KOH, NaCl | [22] |
| NaH2PO4, (CH3COO)2Ca | [23] |
| Ca(H2PO4)2, CaO, Na2(EDTA), Na2SiO3 | [24] |
© 2020 by the authors. Licensee MDPI, Basel, Switzerland. This article is an open access article distributed under the terms and conditions of the Creative Commons Attribution (CC BY) license (http://creativecommons.org/licenses/by/4.0/).
Share and Cite
Rokosz, K.; Hryniewicz, T.; Kacalak, W.; Tandecka, K.; Raaen, S.; Gaiaschi, S.; Chapon, P.; Malorny, W.; Matýsek, D.; Pietrzak, K.; et al. Phosphate Coatings Enriched with Copper on Titanium Substrate Fabricated Via DC-PEO Process. Materials 2020, 13, 1295. https://doi.org/10.3390/ma13061295
Rokosz K, Hryniewicz T, Kacalak W, Tandecka K, Raaen S, Gaiaschi S, Chapon P, Malorny W, Matýsek D, Pietrzak K, et al. Phosphate Coatings Enriched with Copper on Titanium Substrate Fabricated Via DC-PEO Process. Materials. 2020; 13(6):1295. https://doi.org/10.3390/ma13061295
Chicago/Turabian StyleRokosz, Krzysztof, Tadeusz Hryniewicz, Wojciech Kacalak, Katarzyna Tandecka, Steinar Raaen, Sofia Gaiaschi, Patrick Chapon, Winfried Malorny, Dalibor Matýsek, Kornel Pietrzak, and et al. 2020. "Phosphate Coatings Enriched with Copper on Titanium Substrate Fabricated Via DC-PEO Process" Materials 13, no. 6: 1295. https://doi.org/10.3390/ma13061295
APA StyleRokosz, K., Hryniewicz, T., Kacalak, W., Tandecka, K., Raaen, S., Gaiaschi, S., Chapon, P., Malorny, W., Matýsek, D., Pietrzak, K., & Dudek, Ł. (2020). Phosphate Coatings Enriched with Copper on Titanium Substrate Fabricated Via DC-PEO Process. Materials, 13(6), 1295. https://doi.org/10.3390/ma13061295