Abstract
Vehicle exhaust seriously pollutes urban air and harms human health. Photocatalytic technology can effectively degrade automobile exhaust. This work prepared g-C3N4/CeO2 photocatalytic material by constructing heterojunctions. Four kinds of g-C3N4/CeO2 composite photocatalytic materials with different mass ratios were prepared. An indoor exhaust gas purification test was carried out under natural light and ultraviolet light irradiations. The optimum mass ratio of g-C3N4 material and CeO2 material was determined by evaluating the exhaust gas degradation effective. Moreover, the structure and morphology of the g-C3N4/CeO2 composite were investigated with microscopic characterization experiments (including XRD, TG-DSC, FT-IR, UV-Vis, SEM and XPS). The results obtained were that the optimum mass ratio of g-C3N4 material to CeO2 material was 0.75. The degradation efficiencies under ultraviolet irradiation in 60 min for HC, CO, CO2, NOX were 7.59%, 12.10%, 8.25% and 36.82%, respectively. Under visible light conditions, the degradation efficiency in 60 min for HC, CO, CO2 and NOX were 15.88%, 16.22%, 10.45% and 40.58%, respectively. This work is useful for purifying automobile exhaust in the future.
1. Introduction
While the development of science and technology has created a lot of wealth for human society, it also consumes a lot of energy and emits a large amount of waste gas and water, thus causing serious environment pollution and endangering humans’ health [1]. Automobiles are the main contributors to atmospheric pollutant emissions, with CO, NOX and PM emissions exceeding 90% and HC exceeding 80%. The main components contained in automobile exhaust are NOX, HC, CO and CO2. Nitrogen oxides can cause environmental problems such as acid rain and ozone depletion. Nitrogen oxides can also produce photochemical smog with HC. The most famous photochemical smog events are the London photochemical smog and Los Angeles photochemical smog events [2]. Carbon dioxide is a greenhouse gas that can raise the Earth’s temperature. Severe environmental pollution is destroying our ecosystem, so it is a significant task to govern and protect the environment [3].
In the 1970s, Japanese scholars Honda and Fujishma first found the photolysis of water under the bias condition by using a single crystal TiO2 photoelectrode [4], and they successfully decomposed water into H2 and O2. It was later found that the TiO2 material irradiated by light could not only decompose water but also be used to degrade organic pollutants. TiO2 material could deeply oxidize most of the toxic organic substances [5]. This major discovery attracted a large amount of scholars’ interests, and there have been many outcomes related TiO2 material [6,7,8,9,10,11,12]. However, TiO2 has a large forbidden band width (about 3.2 eV) and cannot absorb solar light efficiently. It can only absorb 4%–6% of the ultraviolet band energy in the solar spectrum. Though the modified TiO2 catalytic material has a greater performance than that of pure TiO2 material, the catalytic effect still cannot effectively break through. Therefore, it is very meaningful to find and study materials that can make full use of solar energy.
Graphite phase carbon nitride is a non-metallic semiconductor material with the advantages of non-toxicity, low cost, and easy preparation. It is widely used in the production of clean renewable energy and environmental pollution control technologies. Its forbidden band width is about 2.7 eV, which can directly use solar energy, thus attracting a lot of scholars’ attention and research [13,14,15,16,17,18]. However, the photogenerated electron-hole pairs of g-C3N4 are easily complexed and have a small specific surface area, resulting in a low photocatalytic activity [19,20]. Therefore, the photocatalytic activity of g-C3N4 could be improved by modifying methods. Building heterojunction is a common method for photocatalysts. For example, the photocatalytic efficiency of g-C3N4/BiVO4 heterojunction is almost 5.3 times higher than that of an individual g-C3N4 sample [21]. In addition, WO3/g-C3N4 heterostructure nanocomposites were found to possess excellent photocatalytic activity for degrading methyl orange (MO) and tetracycline (TC) under visible light irradiation [22]. In this work, CeO2 was introduced to improve the photocatalytic efficiency of g-C3N4.
The cerium oxide material is a good catalyst with good oxygen storage and redox properties. It is a cubic fluorite-type structure that is composed of a face centered cubic cation and an anion occupying the octahedral gap position [23]. In this structure, the cation of each cerium element coordinates with the eight nearest oxygen element anions, and each oxygen element anion coordinates with the four nearest cerium element cations [24]. CeO2 has a variable metal ion pair (Ce3+/Ce4+) under different redox reaction atmospheres. This property makes the CeO2 material have an excellent oxygen storage and release capacity [25,26,27]. Furthermore, CeO2 has a valence band of 2.35 eV and a conduction band of −0.23 eV, and it can form a composite heterojunction with graphite phase carbon nitride. The heterojunction structure can promote the dissociation of excitons and improve the separation efficiency of the photo-generated carriers of the catalyst, thereby achieving the purpose of improving the activity of the catalyst [28].
However, few works have focused on g-C3N4/CeO2 heterostructure nanocomposites. Therefore, this work prepared a g-C3N4/CeO2 heterostructure composite photocatalytic material with different mass ratios. An exhaust gas degradation test was carried out to obtain the optimal mass ratio of g-C3N4 and CeO2. Under the optimal preparation conditions, the exhaust gas degradation test was conducted in 60 min. Moreover XRD, TG-DSC, FT-IR, UV-Vis, SEM, and XPS were executed to verify the performance of the g-C3N4/CeO2 material.
2. Experiment and Methods
2.1. Materials and Equipment

Table 1.
Test equipment.
Table 2.
Test raw materials.
2.2. Preparation
The steps for preparing g-C3N4/CeO2 are as follows:
(1) g-C3N4 was prepared by dicyandiamide thermal polymerization at 600 °C.
(2) Three grams of g-C3N4 powders were weighed and dispersed it into a mixed solvent of 10 mL of deionized water and 40 mL of absolute ethanol. The mixed solution was stirred evenly and recorded as solution A. Then, 3 g of CeO2 powders were weighed and added to solution A, stirred, and recorded as solution B.
(3) A magnetic stirrer was used to stir solution B for 2 h, and then solution B was put in an oven at 80 °C for 12 h. The block solid could be obtained. Then, it was ground into powder and placed in a ceramic crucible.
(4) The crucible was placed in a muffle furnace at a heating rate of 15 °C/min and heated to 500 °C for 4 h, and then it was cooled down to 450 °C for 12 h. The sample that was obtained after calcination and cooling was the g-C3N4/CeO2 binary composite material.
(5) According to the above method, binary composite materials with 1:0.5, 1:0.75, 1:1 and 1:2 mass ratios of g-C3N4 to CeO2 were prepared.
2.3. Indoor Exhaust Gas Purification Step and Evaluation Method
Purification efficiency (η) can be used to evaluate the purification effect of the prepared materials on the exhaust gas. The purification efficiency formula can be written as the follows:
where is the purification efficiency, C0 is the initial exhaust concentration, and Ct is the exhaust concentration after t minutes.
Therefore, we proposed a method for indoor exhaust gas purification. The indoor test process was as follows:
- (1)
- The g-C3N4/CeO2 photocatalytic material was prepared by following the above steps, and 3 g of g-C3N4/CeO2 were weighed and then spread evenly on clean A4 paper;
- (2)
- The exhaust purification system was connected in sequence. The exhaust purification system in this work is shown in Figure 1. Firstly, the DTN220B-NO2 portable nitrogen dioxide detector was put into the reaction box, and a small fan was turned on to keep gas flowing. Then, the photocatalytic material was put into the reaction box, which was closed tightly. Secondly, the reaction chamber was covered with a curtain to prevent light from entering. Then, the air inlet valve was opened, and the air outlet valve was closed. The engine was connected to the air inlet and injected exhaust gas into the reaction box.
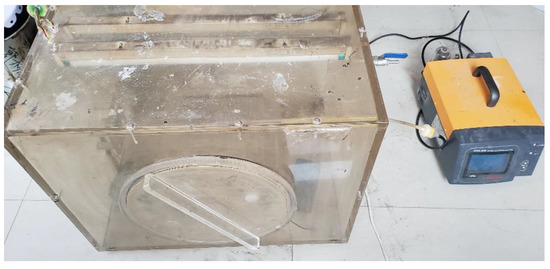 Figure 1. The exhaust purification system [29].
 - (3)
- The NHA-506 (5G) car exhaust gas analyzer (Nanhua Instrument Co., Ltd., Foshan, China) was turned on. After injecting for a period of time, the automobile exhaust gas analyzer was used to test the concentration of various components in the exhaust gas. When a certain concentration was reached, the intake valve was closed and the gasoline engine was turned off. The UV or incandescent lamp was turned on and the test was started.
- (4)
- The concentrations of NO, NO2, CO, CO2 and HC were recorded every 10 min. A total of 60 min and 7 groups of data were recorded.
2.4. Error Correction of Exhaust Gas Purification Test
Because the engine parameters of each car are different, the exhaust gas concentrations that are produced are also different. In this work, it was concluded that each component was in a certain range after a large number of repeated works. Through a large number of inflation tests, it could be found that the concentration range of HC was 340–400 ppm, CO was 4%–6%, CO2 was 5%–9%, and NOX was 40–80 ppm. The principle of this tail gas purification experiment was to use a car tail gas analyzer to suck the tail gas out of the gas purification box for testing. The exhaust gas component purification efficiency was calculated according to the initial concentration and the concentration at any time by Formula (1). However, the reduction of the exhaust gas concentration in the purification tank was composed of two parts, one of which was purified by the photocatalytic material and the other of which was extracted by the test instrument. Therefore, the process of determining which part was taken out by the instrument and which part was purified by materials was the key to ensuring the accurate calculation of photocatalytic efficiency. This article adopted the correction method to solve the problem of system error. The specific method was to use a large amount of blank test data to determine the correction value, which was the so-called blank test. The blank sample test used an exhaust gas purification test system. First, a sample was placed in the system, then it was tested again according to the purification process, and the data were recorded. After a large number of repeated tests, a large amount of data were obtained. The exhaust gas purification test was recorded every 10 min, so the blank test data were also recorded every 10 min. In this way, it could better reflect how the purification efficiency changed every 10 min. After a large number of blank sample tests, the final data are shown in Table 3. As can be seen from the table, the concentration of each component was reduced every 10 min with the passage of time. This was because the concentration of the gas in the environment box was decreasing, which also caused the concentration of the same volume of gas to be drawn down.
Table 3.
Exhaust gas purification system error correction table.
2.5. Analysis of Exhaust Gas Degradation Efficiency
According to the above experimental procedure in Section 2.3, the degradation efficiency of the g-C3N4/CeO2 composite that was prepared at different mass ratios could be calculated. The optimum ratio of g-C3N4 to CeO2 could be obtained. Moreover, the degradation efficiency of tail gas at the optimum ratio was further studied.
2.6. Microscopic Test
Studies have shown that CeO2 has a good visible light absorption capability and can degrade organic pollutants. The photogenerated electron-hole pair of g-C3N4 is easy to recombine when coupled with its low quantum efficiency and low catalytic performance, which limits its scale application in the field of degradation tail gas. Therefore, according to the band principle, g-C3N4/CeO2 composites were prepared. The newly formed composite material was a special heterojunction structure, and the structure and morphology of the composite material were studied by microscopic characterization methods such as XRD, FT-IR, UV-Vis, TG-DSC, SEM and XPS.
3. Results and Discussion
3.1. Degradation Principle of g-C3N4/CeO2
Figure 2 shows the principle of purifying exhaust gas by the g-C3N4/CeO2 composite material. The conduction band is the energy space formed by free electrons. The valence band usually refers to the highest energy band in a semiconductor or insulator that can be filled with electrons at 0 K. It can be seen from the Figure 2 that, due to the special relationship between the valence and conduction bands of the CeO2 material and the g-C3N4 material, a composite heterojunction photocatalytic material was formed. If the photon energy was higher than that of the photocatalyst absorption threshold when the sunlight irradiated g-C3N4/CeO2, the valence band electron (e−) of g-C3N4/CeO2 occurred inter-band transition. When an electron transitioned from the valence band to the conduction band, a corresponding hole (h+) was generated in the valence band. Then, a series of reactions occurred between the photo-generated electrons and the holes. For example, O2 was adsorbed on the surface of g-C3N4/CeO2 catalyst to form • by catching electrons, and the generated holes could oxidize water on the surface of g-C3N4/CeO2 to •OH. • and •OH were strong oxidizing groups that could oxidize most organic pollutants to CO2 and H2O. Since photogenerated electrons and holes were opposite charges, they would recombine through electrostatic forces, releasing or emitting energy to consume energy. The photo-generated carriers of g-C3N4 were easy to recombine. When the CeO2 material was added, the photo-generated electrons could be transferred from the conduction band of g-C3N4 to the conduction band of CeO2, and the photo-generated holes could be transferred from the valence band of CeO2 to the g-C3N4 valence band. Therefore, the g-C3N4/CeO2 photocatalytic material could effectively solve the problem of the low photo-generated carrier separation efficiency of the g-C3N4 material and could promote the dissociation of excitons, achieving the purpose of improving the photocatalytic activity of the g-C3N4 catalyst.
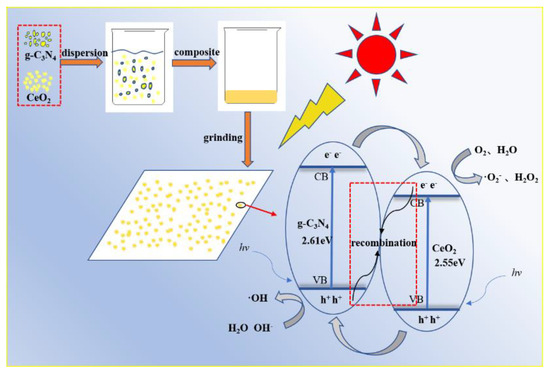
Figure 2.
Principle of purifying exhaust gas with a g-C3N4/CeO2 composite material.
3.2. Degradation Efficiency of g-C3N4/CeO2
The degradation efficiencies of the binary composite that were obtained at different g-C3N4 to CeO2 mass ratios was tested by the method described in Section 2.3. The photocatalytic purification effective after error compensation is shown in Figure 3.
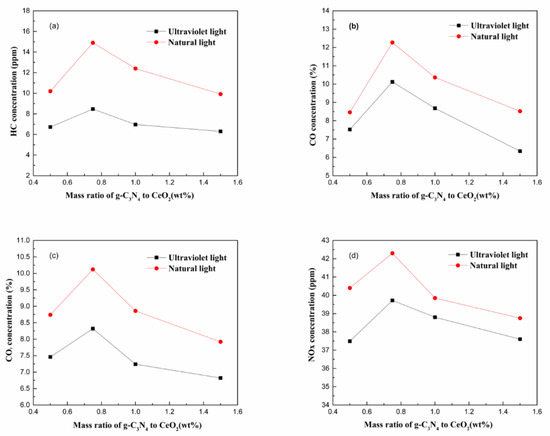
Figure 3.
The purification effective change pattern at different g-C3N4 to CeO2 mass ratios for (a) HC, (b) CO, (c) CO2, and (d) NOX.
It can be seen from the four graphs in Figure 3 that the degradation efficiency of exhaust gas under natural light conditions was better than that under ultraviolet light, and in both natural and ultraviolet light conditions, the degradation efficiency of the four components in the automobile exhaust had a peak. When the mixing mass ratio of g-C3N4 to CeO2 was less than 0.75, the purification rate of each component increased continuously with the ratio increases. When the mixing mass ratio of g-C3N4 to CeO2 was greater than 0.75, the purification rate of each component was continuously reduced with the ratio increases. From the above results, it could be concluded that the optimum blend ratio of g-C3N4 to CeO2 was 0.75.
From the above analysis, when the mixing mass ratio of g-C3N4 to CeO2 was 0.75, the binary composites had the highest purification efficiency for the four components in the exhaust gas under both natural light and ultraviolet light conditions. However, it could not indicate how the exhaust gas concentration changed every 10 min over 60 min. Therefore, when the mass ratio of g-C3N4 to CeO2 was 0.75, the change trends of four components HC, CO, CO2 and NOX were studied. The results that were obtained are shown in Figure 4.
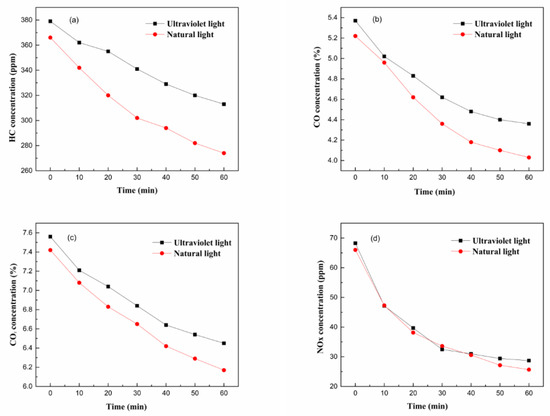
Figure 4.
The change pattern of exhaust gas concentration (a) HC; (b) CO; (c) CO2; and (d) NOX.
It can be seen from Figure 4 that under ultraviolet light conditions, the degradation efficiencies of the g-C3N4/CeO2 composites for HC, CO, CO2 and NOX in 60 min were 7.59%, 12.10%, 8.25% and 36.82%, respectively. Under visible light irradiation, the degradation efficiencies of HC, CO, CO2 and NOX in the 60 min were 15.88%, 16.22%, 10.45% and 40.58%, respectively. The trends of HC, CO, CO2, and NOX concentration patterns were concave curves, indicating that the degradation rate for exhaust gas in the initial stage was higher. With the extension of time, the purification and degradation rate of exhaust pollutants gradually decreased.
3.3. Micro Analysis
3.3.1. UV-Vis Analysis
Figure 5a shows UV-Vis DRS spectra of g-C3N4, CeO2 and g-C3N4/CeO2. All the samples showed an adsorption edge in the visible light region. The g-C3N4/CeO2 material showed an adsorption edge of 550 nm, signifying its photocatalytic activity under visible-light irradiation and a significant blue-shift was observed for g-C3N4 and CeO2 [30]. Based on the electronic absorption spectra, the band gap energy could be obtained [31]. The calculated band gap value of the samples is shown in Figure 5b. The band gaps of g-C3N4, CeO2 and g-C3N4/CeO2 were 2.61, 2.55, and 2.02 eV, respectively. The g-C3N4/CeO2 binary composite showed a certain extent of red shift, corresponding to the high utilization of the visible light [32].
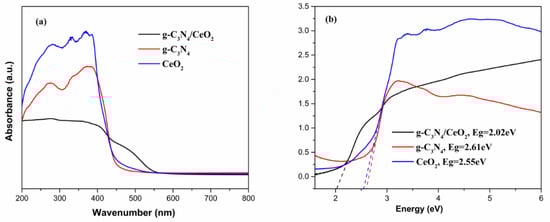
Figure 5.
(a) UV-Vis DRS, (b) plots of (αhν)1/2 vs. photon energy of g-C3N4, CeO2, g-C3N4/CeO2 samples.
3.3.2. FI-TR Analysis
Figure 6 shows the infrared vibrational spectrum of the prepared g-C3N4/CeO2 binary composite at 2000–500 cm−1. As can be seen from Figure 6, there was a significant difference in the infrared spectra between the two materials between 500 and 1300 cm−1. Among them, the characteristic absorption peak in the range of 500–900 cm−1 was the stretching vibration absorption peak of Ce-O-Ce corresponding to the CeO2 material. The characteristic absorption peak in the range of 1250–1725 cm−1 was the typical stretching vibration absorption of the C–N heterocyclic ring corresponding to the g-C3N4 material. It was a typical 3-s-triazine structure out-of-plane bending vibration peak at 1280 and 1458 cm−1. This indicated that the sample was the binary composite of g-C3N4 and CeO2. In other ranges, the infrared spectra of the two materials were similar, probably due to the lower specific gravity of the CeO2 material, or possibly because the infrared absorption peak of the g-C3N4 material was stronger.
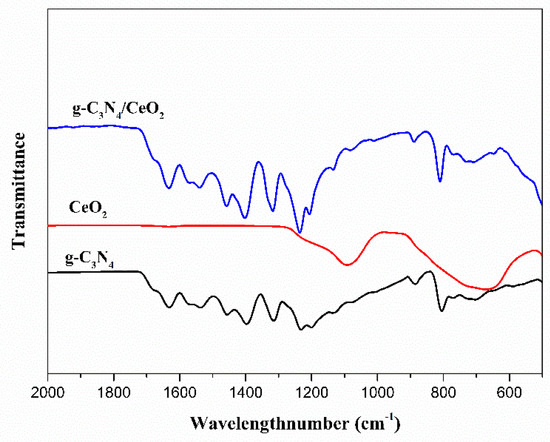
Figure 6.
Infrared vibrational spectrum of the g-C3N4/CeO2 binary composite.
3.3.3. XRD
Figure 7 is an XRD pattern of the g-C3N4/CeO2 binary composite that was prepared by the optimum ratio obtained in Section 2.2. It can be seen from the figure that the peaks at the diffraction angles at 16.64° and 27.5° were characteristic peaks of g-C3N4. The diffraction peaks at 28.57°, 31.28°, 47.50°, 56.34°, 59.49°, 69.41°, 76.71° and 79.79° corresponded to the (111), (200), (220), (311), (222), (400), (331) and (420) crystal planes, respectively, of cubic fluorite-type CeO2. They all corresponded to the standard JCPDS NO.34-0394 card of CeO2 [23]. As can be seen from the figure, the mixed diffraction peaks of the two materials were relatively obvious, the peak width was narrow, and the crystallinity was good, so the prepared binary composite crystal form was better. Additionally, no other new crystal phase was found in the prepared binary composite material, indicating that the obtained sample was a composite of the g-C3N4 and CeO2 materials.
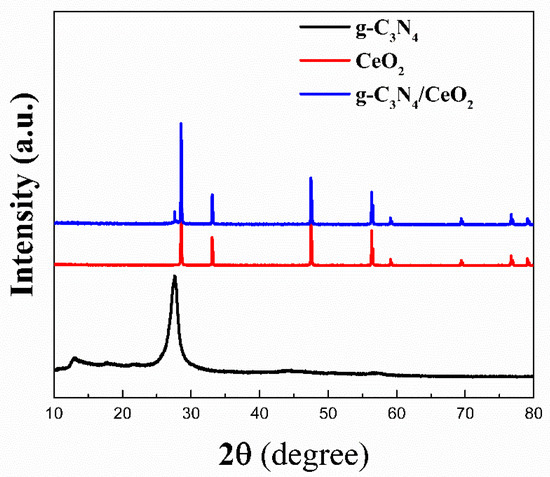
Figure 7.
XRD pattern of g-C3N4/CeO2.
3.3.4. TG-DSC
Figure 8a is a TG-DSC analysis chart of g-C3N4. The TG and DSC diagrams of g-C3N4 could clearly reflect the following phase transition processes: When the temperature was raised from 0 to 609 °C, g-C3N4 absorbed heat slowly, while the TG data showed that the quality did not significantly change at this stage. This was because the melting point of g-C3N4 prepared in this work was about 609 °C, which was produced by endothermic melting. When the temperature was raised from 609 to 761 °C, the mass percentage of g-C3N4 sharply dropped, and the loss amount reached 92.07%. There was a strong exothermic peak at about 724 °C. This was because the temperature was too high, g-C3N4 was completely decomposed or sublimated, and the mass percentage at this time was zero.
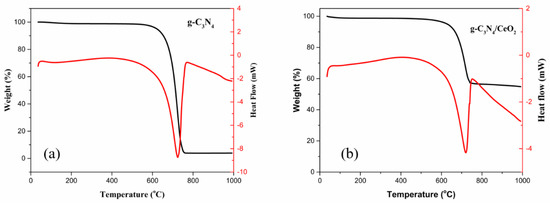
Figure 8.
TG-DSC analysis of (a) g-C3N4 and (b) g-C3N4/CeO2.
Figure 8b shows a TG-DSC analysis chart of g-C3N4/CeO2. The TG and DSC diagrams of g-C3N4/CeO2 clearly reflect the following phase transition processes: From 0 to 609 °C, g-C3N4/CeO2 slowly absorbed heat, and the TG data showed that the quality did not significantly change at this stage. This was because the melting points of g-C3N4 and CeO2 were about 609 and 2400 °C. g-C3N4 was melted endothermically. When the temperature was raised from 609 to 761 °C, the mass percentage sharply dropped, and the mass loss reached 42.86%. There was a strong exothermic peak around 753 °C as well. This was because the temperature was too high, g-C3N4 was completely decomposed or sublimated, and the mass percentage at this time was 57.14%. It can be speculated that the remaining material was CeO2. It could be found from the mass loss percentage that the mixing mass ratio of g-C3N4 to CeO2 was 0.75. The right shift of the exothermic peak of the g-C3N4/CeO2 composite also showed that the two materials were connected together in the form of covalent bonds.
3.3.5. SEM
Figure 9 is the SEM images of g-C3N4 [33], CeO2, and g-C3N4/CeO2. As can be seen from the Figure 9a,b, g-C3N4 is granular and porous, and CeO2 is a rod-like structure. Figure 9c is the SEM image of g-C3N4/CeO2. It can be clearly seen from Figure 9 that layered g-C3N4 was attached to CeO2. This fully and directly shows that g-C3N4/CeO2 is a result of mutual doping.
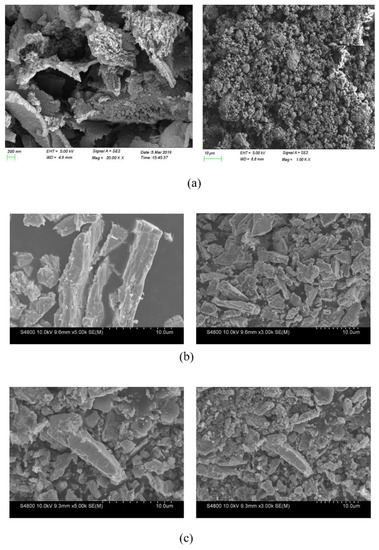
Figure 9.
SEM images of (a) g-C3N4, (b) CeO2 and (c) g-C3N4/CeO2.
3.3.6. XPS
Figure 10 is the XPS spectrum of g-C3N4. As can be seen from Figure 10a, the sample contained three elements of C, N, and O. The O element may have been caused by the sample not being dried or the surface having H2O molecules. Figure 10b is the C 1s spectrum of g-C3N4. It can be seen from the figure that the peaks appeared at the binding energies of 284.8, 288.3, and 293.7 eV, which corresponded to the C=C bond in the graphite phase carbon nitride and the NC=N and C–NH2 bonds in the aromatic structure. Figure 10c is the N 1s spectrum of g-C3N4. It can be seen from the figure that peaks appeared at the binding energies of 398.7, 400.1, and 401.2 eV, respectively, corresponding to the CN = C bond in the triazine ring structure.
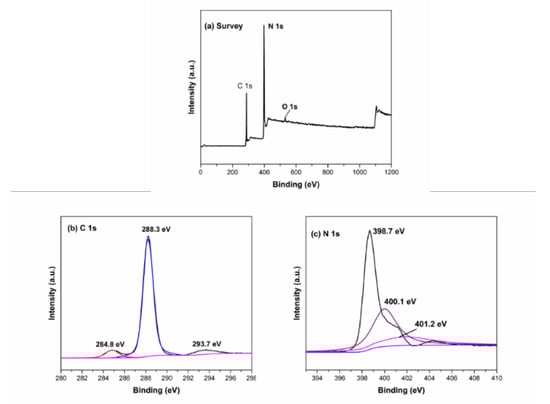
Figure 10.
XPS spectrum of g-C3N4: (a) survey, (b) C 1s and (c) N 1s.
Figure 11 is the XPS spectrum of g-C3N4/CeO2. Figure 11a is the full scan spectrum of the g-C3N4/CeO2 sample. It can be seen from the figure that only C, N, Ce and O were detected in the g-C3N4/CeO2 binary composite material. The prepared heterojunction composite was very pure, without other impurities. Figure 11b is the C 1s spectrum of the g-C3N4/CeO2 sample. It can be seen from the figure that the peaks appeared at the binding energies of 284.9, 286.2, and 287.4 eV, which corresponded to the C–C, C–NH2, and N=C–N2 bonds in the s-triazine ring, respectively. Figure 11c is the N 1s spectrum of the g-C3N4/CeO2 sample. It can be seen from the figure that the binding energy appeared peaks at 398.3, 400.2 and 401.8 eV. Among them, the main peak at the binding energy of 398.3 eV was an sp2 heterocyclic nitrogen atom in the C=N bond. The peak at a binding energy of 400.2 eV corresponded to the nitrogen atom in the N–(C)3 group. The corresponding peak at 401.8 eV was the nitrogen atom in the -NH2 bond. Figure 11d is the O 1s spectrum of the g-C3N4/CeO2 sample. It can be seen from the figure that the binding energy peaks appeared at 523.6 and 530.5 eV, which corresponded to the OH bond in the surface-attached water and Ce–O bond, respectively. Figure 11e is the Ce 3d spectrum of the g-C3N4/CeO2 sample. It can be seen from the figure that there were many peaks of Ce element. Through the analysis of the Gaussian–Lorentzian function, it is possible to conclude that the characteristic peaks of Ce4+ 3d5/2 and 3d3/2 were located at the binding energies of 883.5 and 902.5 eV. Moreover, the characteristic peaks of Ce3+ 3d5/2 and 3d3/2 were located at the binding energies of 891.5 and 910.3 eV. This indicated that Ce element mainly existed in the trivalent and tetravalent states in the material.
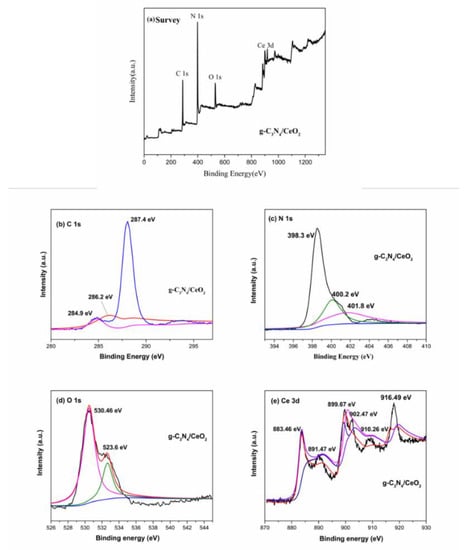
Figure 11.
XPS spectrum of g-C3N4/CeO2: (a) survey, (b) C 1s, (c) N 1s, (d) O 1s and (e) Ce 3d.
4. Conclusions
The main content of this work is that a g-C3N4/CeO2 heterostructure nanocomposite was prepared. The best mass ratio preparation of g-C3N4/CeO2 was obtained by indoor exhaust gas degradation. The degradation efficiency for HC, CO, CO2 and NOX were obtained under natural and ultraviolet light irradiation. Moreover, XRD, FI-IR, UV-Vis, TG-DSC, SEM, and XPS were conducted to investigate the morphology and structure of g-C3N4/CeO2 heterostructure binary composite. The main conclusions are as follows:
- (a)
- The exhaust gas purification efficiency of the g-C3N4/CeO2 composite under natural light irradiation was higher than that under ultraviolet light. The best mass ratio preparation of g-C3N4/CeO2 was 0.75.
- (b)
- The degradation efficiencies of the g-C3N4/CeO2 composite for HC, CO, CO2 and NOX in 60 min were 7.59%, 12.10%, 8.25% and 36.82%, respectively. Under natural light irradiation, the degradation efficiencies for HC, CO, CO2 and NOX in the 60 min were 15.88%, 16.22%, 10.45% and 40.58%, respectively.
- (c)
- The microstructure characterized the crystal structure and micro-morphology of g-C3N4/CeO2 composite. This indicated that g-C3N4/CeO2 heterostructure nanocomposite was successfully prepared.
Author Contributions
All authors have read and agree to the published version of the manuscript. Conceptualization, S.C. and R.L.; methodology, S.C.; software, Y.T.; validation, S.C., B.X., and X.X.; formal analysis, S.C.; investigation, S.C.; resources, J.P.; data curation, J.Z.; writing—original draft preparation, B.X.; writing—review and editing, S.C.; visualization, S.C.; supervision, J.Z.; project administration, R.L.; funding acquisition, J.P.
Funding
This research was funded by National Key R&D Program of China, grant number 2018YFE0103800; Innovation Talent Promotion Program-Scientific and Technological Innovation Team in Shaanxi Province, Grant No. 2017KCT-13; the Fundamental Research Funds for the Central Universities, Grant No. 300102219316.
Conflicts of Interest
The authors declare that they have no known competing financial interests or personal relationships that could have appeared to influence the work reported in this paper.
References
- Dong, F.; Sun, Y.J.; Zhang, Y.X. Micro-Nano Structure Regulation of Graphite Phase C3N4 and Application of Photocatalytic Environmental Purification, 1st ed.; Science Press: Beijing, China, 2018. [Google Scholar]
- Smith, T.W.; Axon, C.J.; Darton, R.C. The impact on human health of car-related air pollution in the UK, 1995–2005. Atmos. Environ. 2013, 77, 260–266. [Google Scholar] [CrossRef]
- Dong, P.Y.; Xi, X.G. Visible Light-Responsive Photocatalytic Material, 2nd ed.; Science Press: Beijing, China, 2017. [Google Scholar]
- Fujishima, A.; Honda, K. Electrochemical Photolysis of Water at a Semiconductor Electrode. Nature 1972, 238, 37–38. [Google Scholar] [CrossRef] [PubMed]
- Liu, B.S.; Zhao, X.J. Heterogeneous Photocatalysis in Semiconductors: Research and Experimental Demonstration of Thermodynamic Mechanism, 1st ed.; Science Press: Beijing, China, 2013. [Google Scholar]
- Cui, S.C.; Li, R.; Ma, W.S.; Li, M.M.; Cui, J.X.; Pei, J.Z. Preparation, photocatalytic properties investigation and degradation rate study on nano-TiO2 aerogels doped with Fe3+ for automobile emission purification. Mater. Res. Express 2018, 5, 115513. [Google Scholar] [CrossRef]
- Chen, Y.F.; Tang, X.N.; Zhang, B.; Luo, Y.; Li, Y. TiO2@SiO2 Composites: Preparation and Photocatalytic Antimicrobial Performance. J. Inorg. Mater. 2019, 34, 1325–1333. [Google Scholar] [CrossRef]
- Ton, N.Q.T.; Le, T.N.T.; Kim, S.; Dao, V.A.; Yi, J.; Vu, T.H.T. High-Efficiency Photo-Generated Charges of ZnO/TiO2 Heterojunction Thin Films for Photocatalytic and Antibacterial Performance. J. Nanosci. Nanotechnol. 2020, 20, 2214–2222. [Google Scholar] [CrossRef] [PubMed]
- Miao, Z.M.; Wang, G.L.; Li, L.J.; Wang, C.; Zhang, X.F. Fabrication of black TiO2/TiO2 homojunction for enhanced photocatalytic degradation. J. Mater. Sci. 2019, 54, 14320–14329. [Google Scholar] [CrossRef]
- Tao, W.; Wang, M.K.; Ali, R. Multi-layered porous hierarchical TiO2/g-C3N4 hybrid coating for enhanced visible light photocatalysis. Appl. Surf. Sci. 2019, 495, 143435. [Google Scholar] [CrossRef]
- Haga, Y.; An, H.; Yosomiya, R. Photoconductive properties of TiO2 films prepared by the sol–gel method and its application. J. Mater. Sci. 1997, 32, 3183–3188. [Google Scholar] [CrossRef]
- Zhang, Y.H.; Gong, M.D.; Liu, X.; Ji, L.J.; Yang, Z.L.; Zhu, X.S. Preparation of activated carbon nanotube foams loaded with Ag-doped TiO2 for highly efficient photocatalytic degradation under UV and visible light. J. Mater. Sci. 2019, 54, 975–2989. [Google Scholar] [CrossRef]
- Ma, L.P.; Gu, Y.S.; Duan, Z.J.; Yuan, L.; Pang, S.J. Scanning tunneling microscopy investigation of carbon nitride thin films grown by microwave plasma chemical vapor deposition. Thin Solid Films 1999, 349, 10–13. [Google Scholar] [CrossRef]
- Montigaud, H.; Tanguy, B.; Demazeau, G.; Alves, I.; Courjault, S. C3N4: Dream or reality? Solvothermal synthesis as macroscopic samples of the C3N4 graphitic form. J. Mater. Sci. 2000, 35, 2547–2552. [Google Scholar] [CrossRef]
- Guo, Q.X.; Xie, Y.; Wang, X.J.; Lv, S.C.; Hou, T.; Liu, X.M. Characterization of well-crystallized graphitic carbon nitride nanocrystallites via a benzene-thermal route at low temperatures. Chem. Phys. Lett. 2003, 308, 84–87. [Google Scholar] [CrossRef]
- Wang, X.C.; Maeda, K.; Thomas, A.; Takanabe, K.; Xin, G.; Carlsson, J.M.; Domen, K.; Antonietti, M. A metal-free polymeric photocatalyst for hydrogen production from water under visible light. Nat. Mater. 2009, 8, 76–80. [Google Scholar] [CrossRef] [PubMed]
- Naseri, A.; Samadi, M.; Pourjavadi, A.; Moshfegh, A.Z.; Ramakrishna, S. Graphitic carbon nitride (g-C3N4)-based photocatalysts for solar hydrogen generation: Recent advances and future development directions. J. Mater. Chem. A 2017, 5, 23406–23433. [Google Scholar] [CrossRef]
- Sun, S.D.; Gou, X.F.; Tao, S.S.; Cui, J.; Li, J.; Yang, Q.; Liang, S.H.; Yang, Z.M. Mesoporous graphitic carbon nitride (g-C3N4) nanosheets synthesized from carbonated beverage-reformed commercial melamine for enhanced photocatalytic hydrogen evolution. Mater. Chem. Front. 2019, 3, 597–605. [Google Scholar] [CrossRef]
- Jourshabani, M.; Shariatinia, Z.; Badiei, A. In situ fabrication of SnO2/S-doped g-C3N4 nanocomposites and improved visible light driven photodegradation of methylene blue. J. Mol. Liq. 2017, 248, 688–702. [Google Scholar] [CrossRef]
- Jia, J.K.; Jiang, C.Y.; Zhang, X.R.; Li, P.J.; Xiong, J.X.; Zhang, Z.; Wu, T.; Wang, Y.P. Urea-modified carbon quantum dots as electron mediator decorated g-C3N4/WO3 with enhanced visible-light photocatalytic activity and mechanism insight. Appl. Surf. Sci. 2019, 498, 143524. [Google Scholar] [CrossRef]
- Tu, X.M.; Zhou, R.T.; Guo, H.L.; Tao, W.Y. Heterojunction semiconductor g-C3N4/BiVO4 with an enhanced photocatalytic activity based on the effective chemical bonding. J. Mater. Technol. 2019, 34, 827–837. [Google Scholar] [CrossRef]
- Yan, H.; Zhu, Z.W.; Long, Y.M.; Li, W.F. Single-source-precursor-assisted synthesis of porous WO3/g-C3N4 with enhanced photocatalytic property. J. Colloid Surf. A 2019, 582, 123857. [Google Scholar] [CrossRef]
- Li, T. Preparation and Electrochemical Performance of Cerium Oxide-Based Composites. Master’s Thesis, Shaanxi University of Science and Technology, Xi’an, China, 30 May 2018. [Google Scholar]
- He, L.Y.; Su, Y.M.; Jiang, L.H.; Shi, S.K. Recent advances of cerium oxide nanoparticles in synthesis. luminescence and biomedical studies: A review. J. Rare Earth 2015, 33, 791–799. [Google Scholar] [CrossRef]
- Xie, X.W.; Li, Y.; Liu, Z.Q.; Haruta, M.; Shen, W.J. Low-temperature oxidation of CO catalysed by Co3O4 nanorods. Nature 2009, 7239, 746–749. [Google Scholar] [CrossRef] [PubMed]
- Wang, F.; Li, W.; Feng, X.L.; Liu, D.P.; Zhang, Y. Decoration of Pt on Cu/Co double-doped CeO2 nanospheres and their greatly enhanced catalytic activity. Chem. Sci. 2016, 7, 1867–1873. [Google Scholar] [CrossRef] [PubMed]
- Dey, S.; Dhal, G.C.; Mohan, D.; Prasad, R. Application of hopcalite catalyst for controlling carbon monoxide emission at cold-start emission conditions. J. Traffic Transp. Eng. 2019, 6, 419–440. [Google Scholar] [CrossRef]
- Zhang, J.S.; Wang, B.; Wang, X.C. Carbon nitride polymeric semiconductor for photocatalysis. Prog. Chem. 2014, 26, 19–29. [Google Scholar]
- Cui, S.C.; Li, R.; Zhu, C.D.; Pei, J.Z.; Wen, Y. Cerium-bismuth solid solution material prepared and application in automobile exhaust purification. Sep. Purif. Technol. 2020, 239, 116520. [Google Scholar] [CrossRef]
- Yuan, X.Y.; Zhou, C.; Jin, Y.R.; Jing, Q.Y.; Yang, Y.L.; Shen, X.; Tang, Q.; Mu, Y.H.; Du, A.K. Facile synthesis of 3D porous thermally exfoliated g-C3N4 nanosheet with enhanced photocatalytic degradation of organic dye. J. Colloid Interface Sci. 2016, 468, 211–219. [Google Scholar] [CrossRef]
- Makula, P.; Pacia, M.; Macyk, W. How to Correctly Determine the Band Gap Energy of Modified Semiconductor Photocatalysts Based on UV-Vis Spectra. J. Phys. Chem. Lett. 2018, 9, 6814–6817. [Google Scholar] [CrossRef]
- Cui, P.P.; Hu, Y.; Zheng, M.M.; Wei, C.H. Enhancement of visible-light photocatalytic activities of BiVO4 coupled with g-C3N4 prepared using different precursors. Environ. Sci. Pollut. Res. 2018, 25, 32466–32477. [Google Scholar] [CrossRef]
- Cui, S.C.; Li, R.; Pei, J.Z.; Wen, Y.; Li, Y.; Xing, X.Y. Automobile exhaust purification over g-C3N4 catalyst material. Mater. Chem. Phys. 2020, 112867. [Google Scholar]


© 2020 by the authors. Licensee MDPI, Basel, Switzerland. This article is an open access article distributed under the terms and conditions of the Creative Commons Attribution (CC BY) license (http://creativecommons.org/licenses/by/4.0/).