3.1. Evaluation of the Foaming Process
The values of the start time and tack-free time for all samples equaled 10 and 0 s, respectively. this means that when foams reached their maximum volume, their surface was already not sticky. Therefore, in
Table 3 are presented only the values of the rise time and maximum temperatures reached by the foams during the reaction. It can be seen that the rise time was slightly reduced by the increase of biopolyol content in foams’ formulations, which could be related to the lower viscosity of biopolyol LB compared to Rokopol®RF551. Furthermore, a significant increase of the maximum temperature reached during foaming was noted, which could be associated with the enhanced reactivity of the systems with a higher content of biopolyol. The increased reactivity of biopolyol was associated with its chemical structure (higher hydroxyl number L
OH = 650 mg KOH/g) and higher viscosity polyols (η = 2236 mPa·s) compared to petrochemical polyol. Lower viscosity (greater mobility of chains, functional groups) and the higher concentration of reactive groups caused acceleration of the reaction of allophanate crosslinks, urethane, and urea linkages. A similar effect was noted in other works [
32].
The values of rise time and T
MAX were also affected by the isocyanate index. It could be seen that shortening of the rise time was noted, but the maximum temperature was reduced, when I
ISO was increased. Such an effect was probably associated with the increased loading of the blowing agent for higher isocyanate content, which was necessary to provide a similar level of the foams’ apparent density. The applied
n-pentane was the physical blowing agent, so it required heat to evaporate and generate a porous structure of PUR-PIR foam. Moreover, the reduction of T
MAX could be related to the lower enthalpy for the isocyanate trimerization reaction (ΔH = 80 kJ/kmol), compared to the generation of urethane bonds (ΔH = 105 kJ/kmol) [
33].
3.2. Microstructure of Rigid PUR-PIR Foams
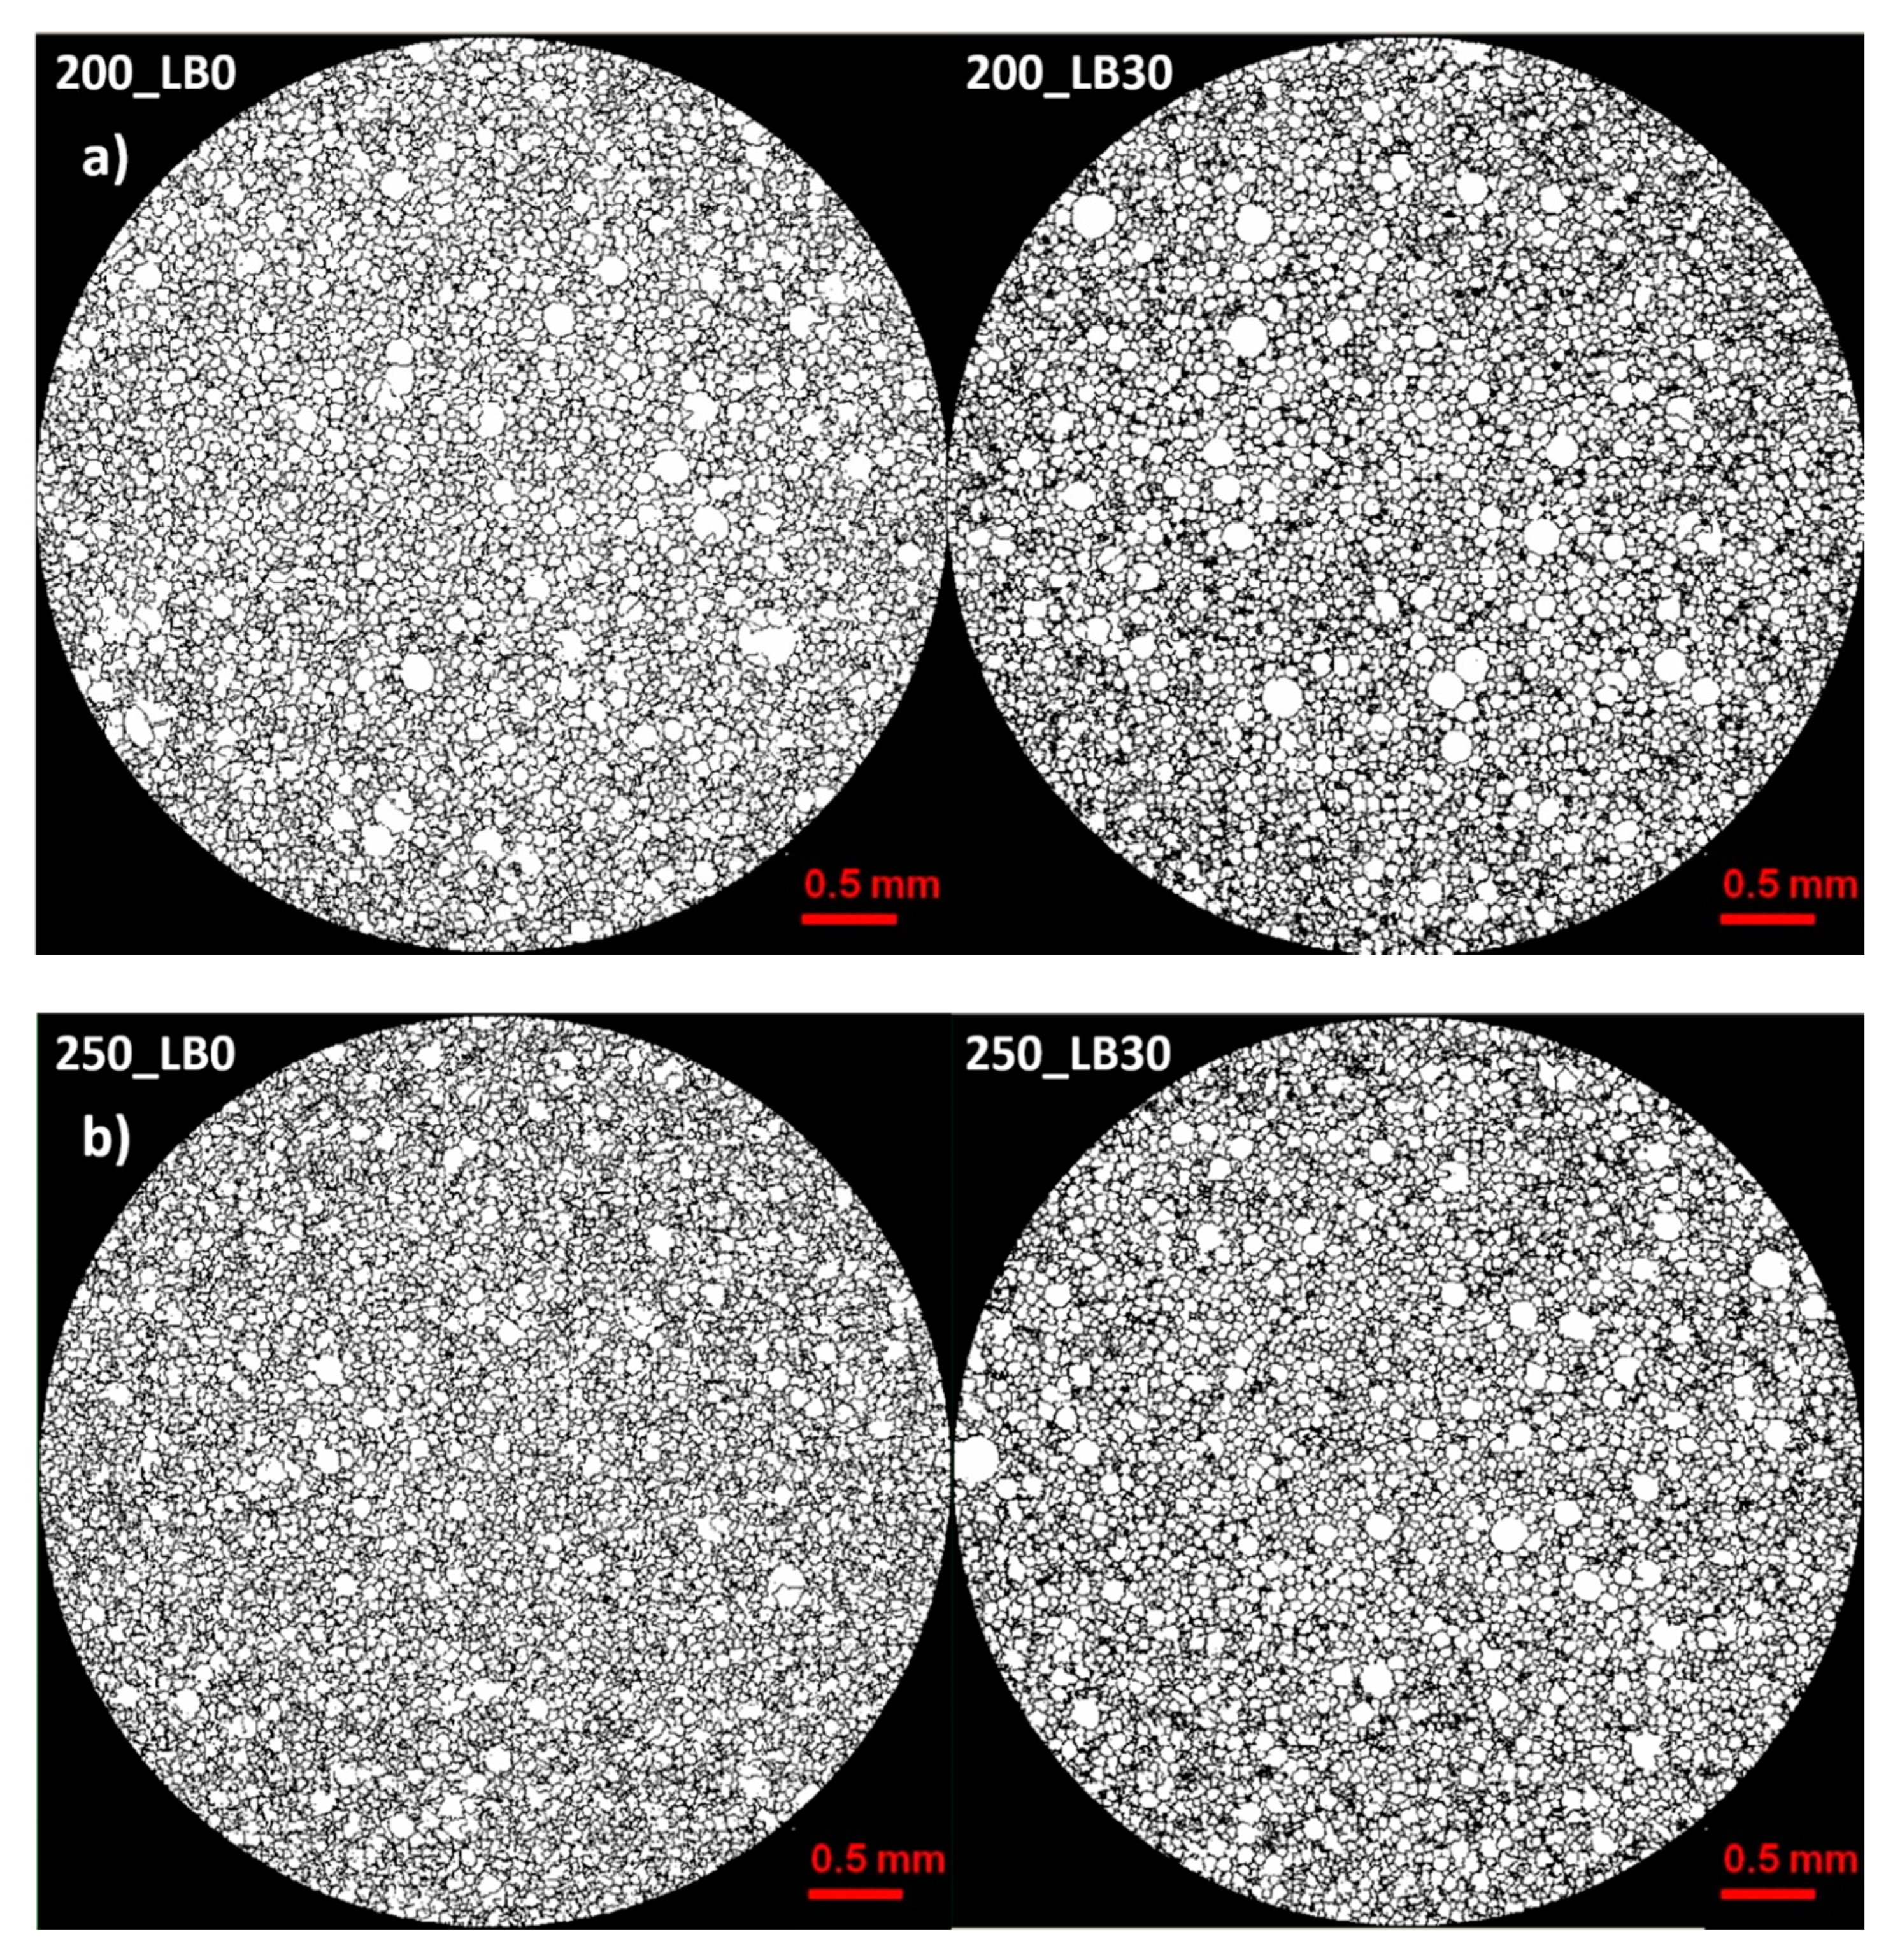
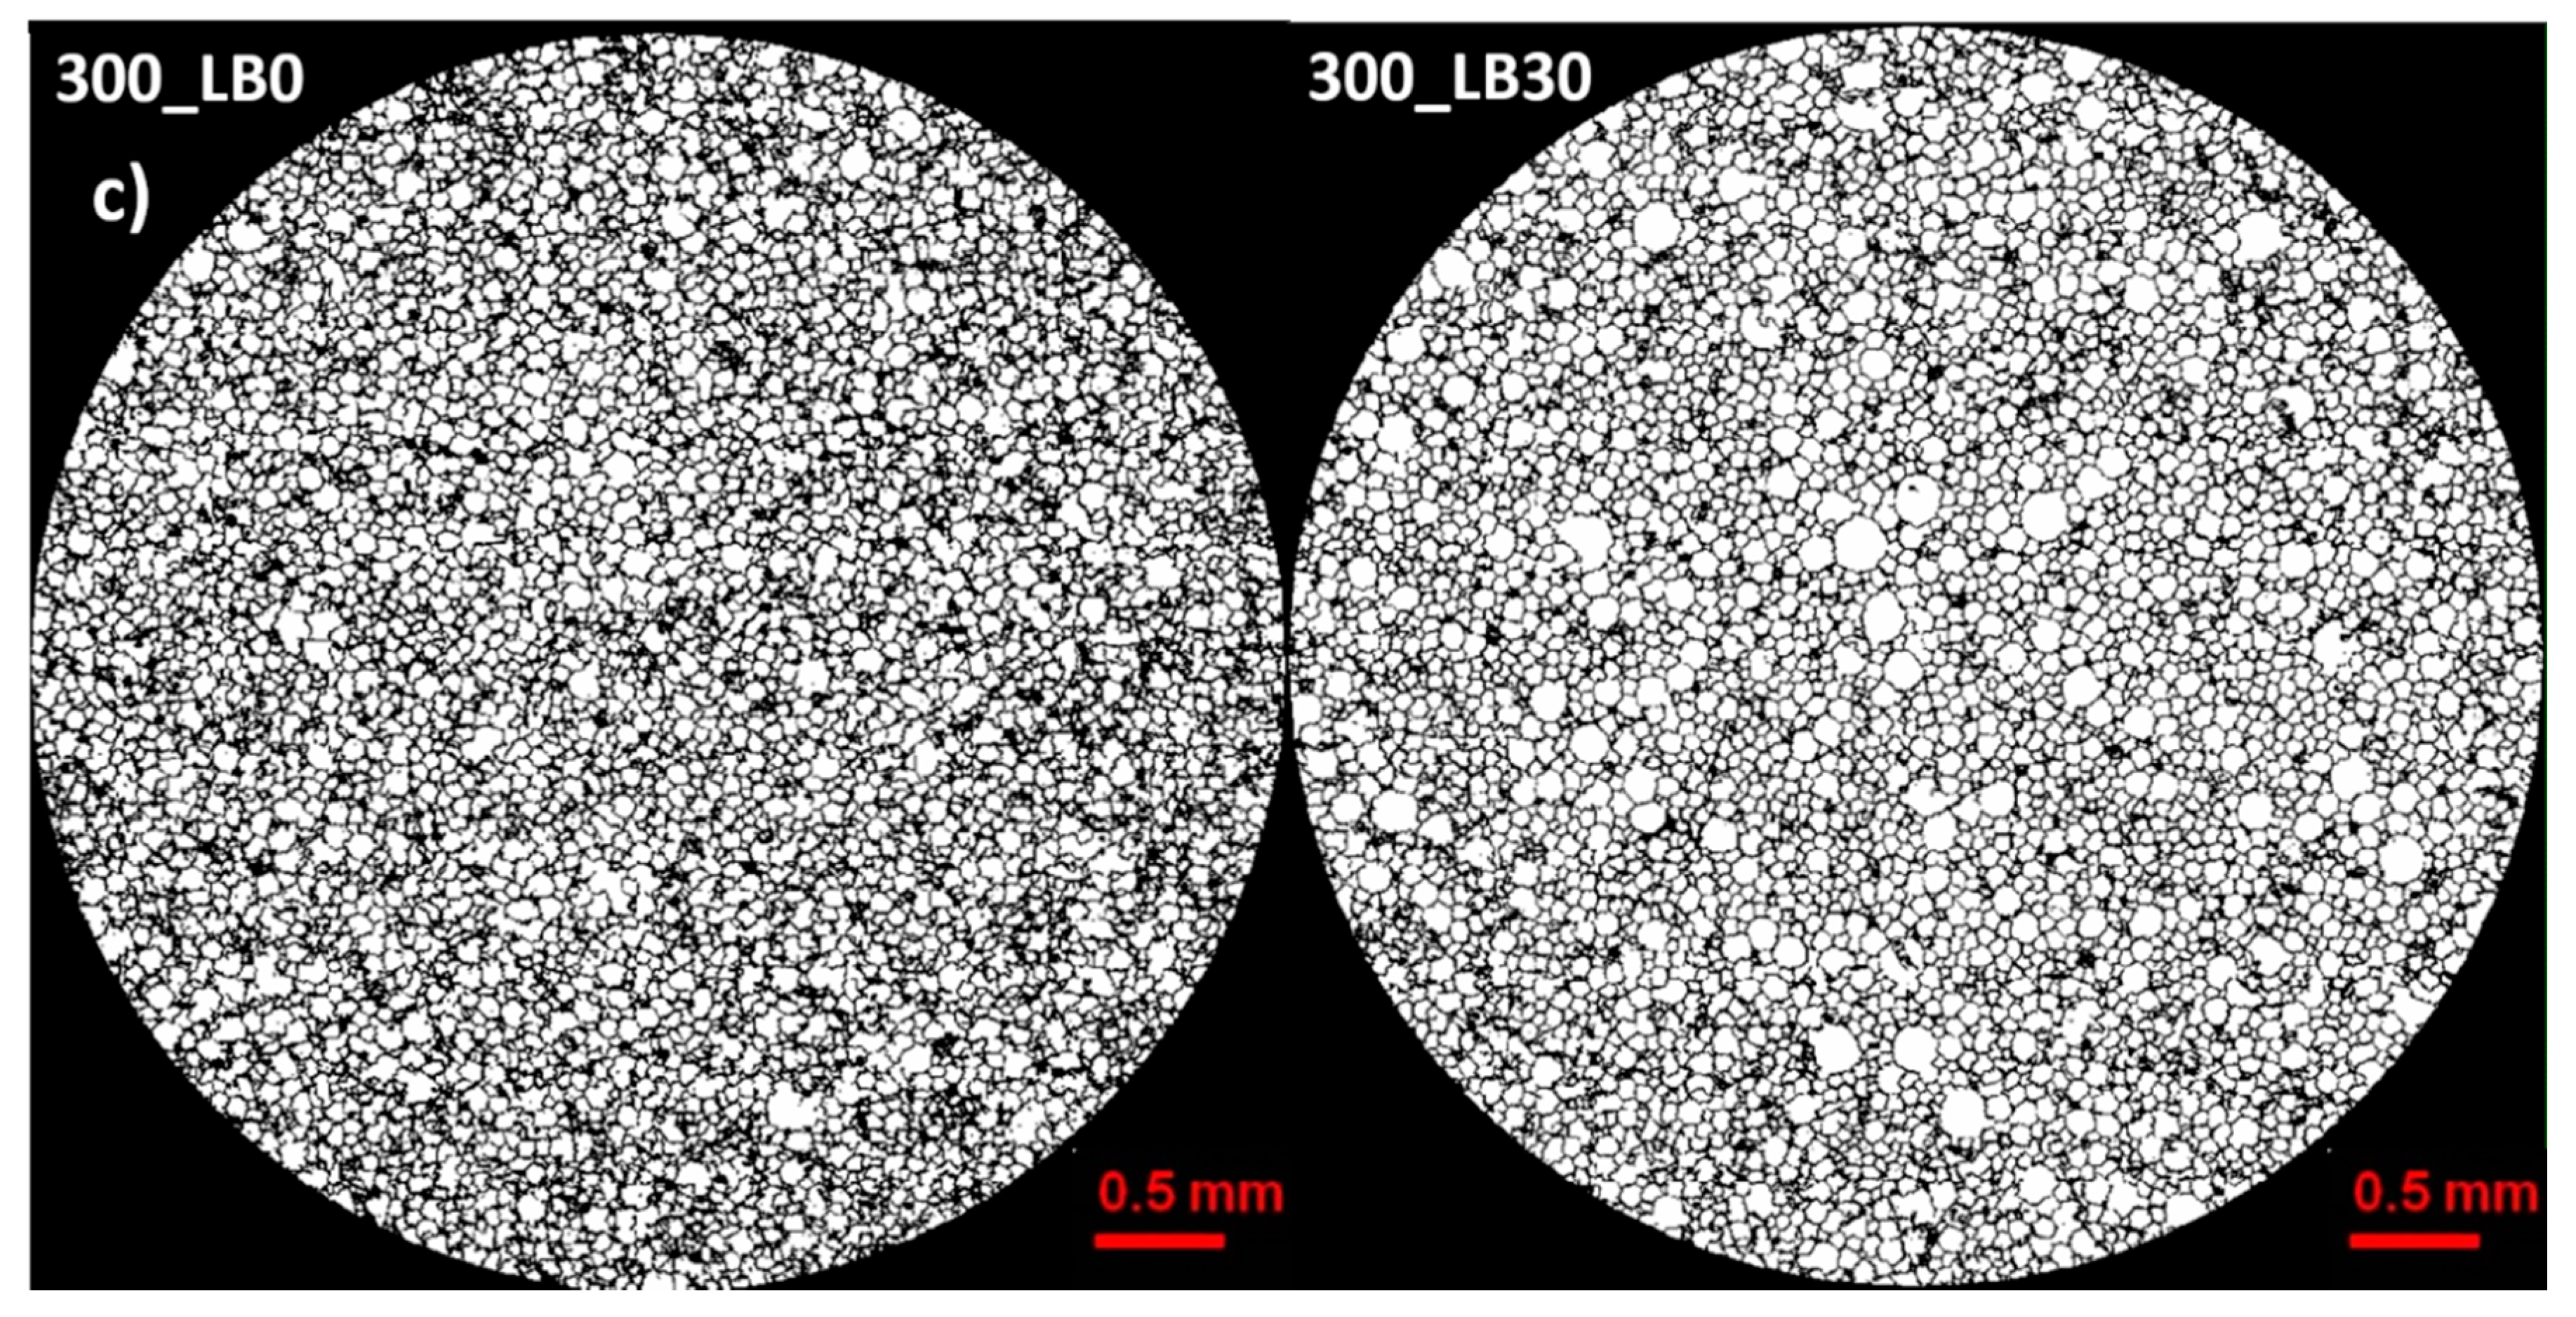
Micro-computed tomography (micro-CT or μCT) is a technique that enables three-dimensional imaging of a sample and the generation of virtual 3D models with the use of X-ray radiation. In
Figure 2 are presented two-dimensional cross-sections of PUR-PIR foams prepared solely from petrochemical polyol and with a 30 wt% share of biopolyol. A slight decrease of the average cell size was noted, which could be associated with the presence of solid particles in the applied biopolyol. The applied biopolyol was obtained with 78% biomass conversion, as mentioned in our previous work [
23]. Therefore, considering the applied formulations, foams with an isocyanate index of 200, 250, and 300 contained 1.8, 1.5, and 1.4 wt% of solid particles, which might act as nucleating agents, simultaneously reducing the average cell diameter. A similar effect was noted by Zhang et al. [
34]. Moreover, the values of porosity are presented, which were calculated as the ratio of the total cell volume and the volume of the measured sample. It could be seen that the porosity was slightly decreasing with the addition of biopolyol, which was probably associated with the lower viscosity of biopolyol LB compared to commercial Rokopol®RF551 (see
Table 1). Such an effect was related to the lower resistance of the foaming mixture to the cells’ coalescence. The more viscous polyol mixture showed a higher ability to trap gas inside [
35]. The effect was very significant in the case of the work presented by Fan et al. [
36]; however, they substituted conventional polyol with a viscosity of 9000 cP with a soy-based one, which showed a value of 31,351 cP. In the case of presented work, differences in the polyols’ viscosity were not so significant. A similar effect was observed in the work of Ciecierska et al. [
37], who analyzed the impact of the viscosity of a polyol mixture on the cellular structure of rigid PUR foams. Their results showed that the increase of the viscosity caused an increase in the porosity, without significant changes in cell diameters. Nevertheless, such changes in morphology caused the deterioration of the mechanical performance.
In
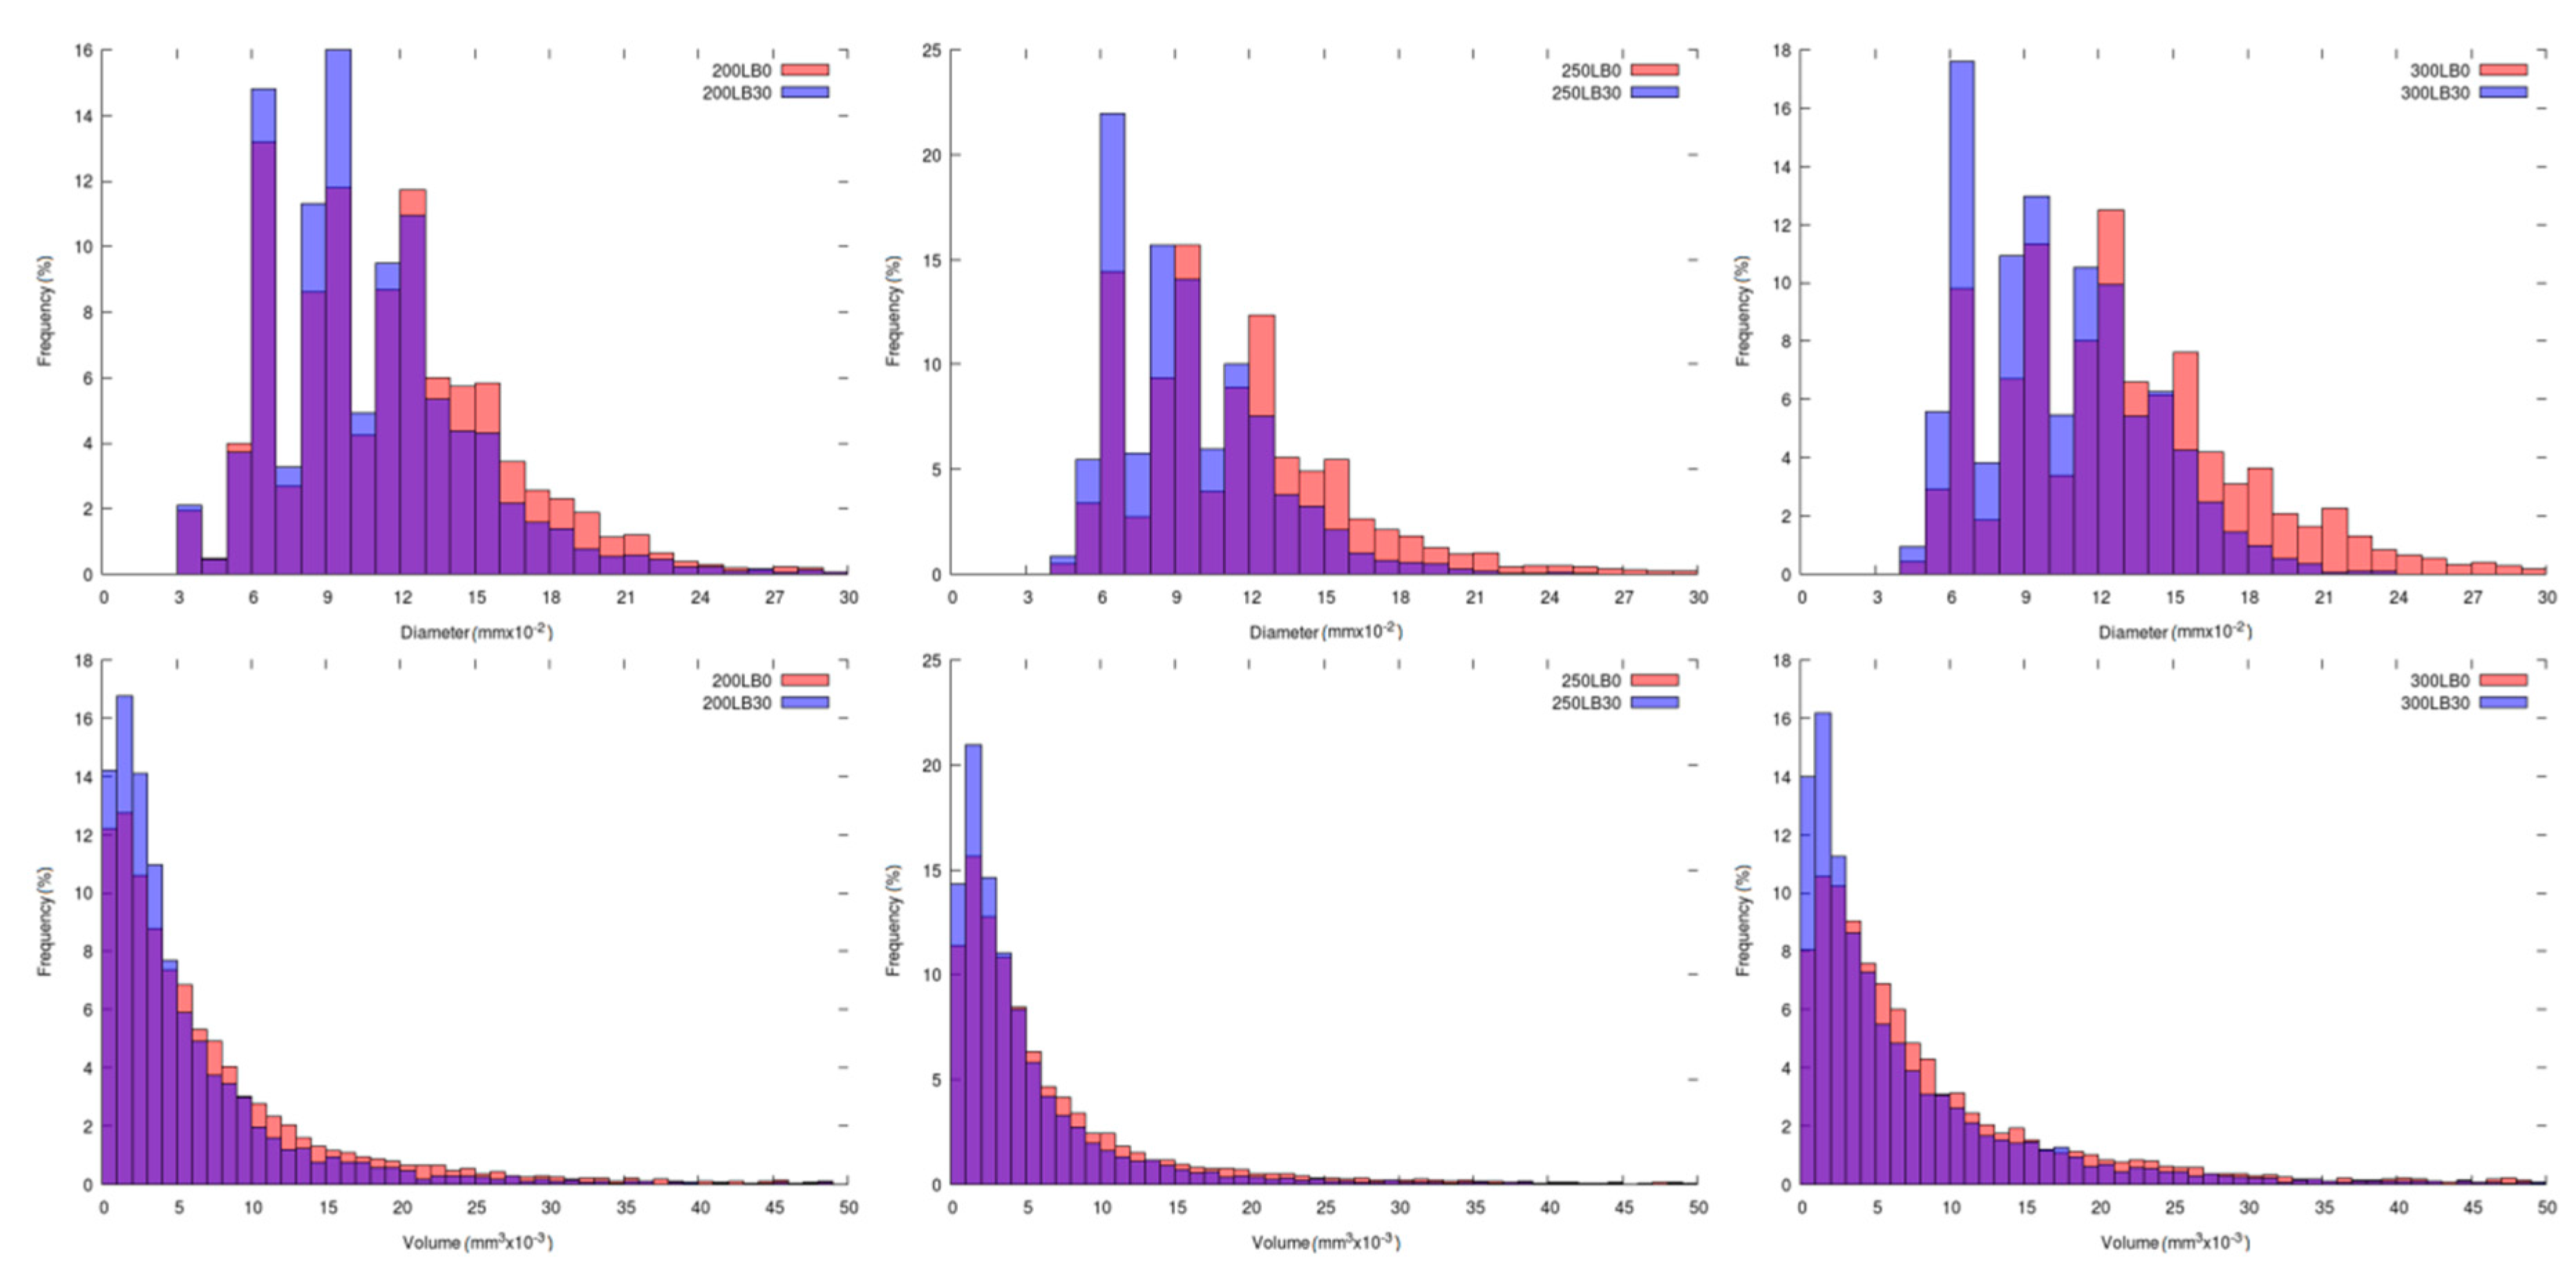
Table 4 are presented the parameters of the foams’ cellular structure. It could be seen that the incorporation of biopolyol resulted in the reduction of the average cell diameter and volume. Moreover, the increase of I
ISO resulted in the enhancement of the microstructure homogeneity, which was confirmed by the decrease of the standard deviation and the sharper shape of the histograms presented in
Figure 3. For all samples containing 30 wt% of biopolyol, a significant increase in the content of cells with a diameter of ~60 μm was observed. Regarding the influence of I
ISO, the highest homogeneity of structure and the lowest values of cell size and volume were noted for the ratio of isocyanate to hydroxyl groups equal to 250. Moreover, in
Table 5 are presented 3D images showing the distribution of cells with a particular volume inside foams.
In
Table 6 are presented the thermal insulation properties of prepared foams. The thermal conductivity coefficient (λ) and thermal resistance (R) are crucial for determining the possibility of the application of PUR-PIR foams as insulation materials. For these materials, the λ coefficient was composed of four components λ
gas, λ
PUR-PIR, λ
radiation, and λ
convection [
38]. The share of these components was strictly correlated with the cellular structure of the foams. With the increase of apparent density, the thermal conductivity of a solid part of the foam would have a more significant influence on the total λ value. Therefore, a low density was very beneficial for the performance of thermal insulation materials since the λ values for solid PUR-PIR, CO
2, and air were 220.0, 15.3, and 24.9, respectively [
25]. Other structural parameters, such as the cell size, also showed a significant impact on the thermal conductivity of foamed materials. According to Glicksman [
39], λ
radiation was proportional to cell diameter and inversely proportional to the density of the foam and solid polymer. Randall and Lee [
40] proved that the decrease in average cell diameter from 600 to 250 μm resulted in a drop in the thermal conductivity coefficient by almost 50%. Moreover, to show the lowest possible value of the λ parameter, foams should be characterized by a high content of closed cells, which reduced λ
convection by trapping gas inside the foam. Volatile hydrocarbons, commonly applied as blowing agents for PUR-PIR foams, showed thermal conductivity coefficient ~1.5 and ~2.5 lower than CO
2 and air.
It could be seen that the incorporation of biopolyol into the foams’ formulation resulted in the reduction of the average cell size, which was followed by a drop of the thermal conductivity coefficient. A similar effect was observed in our other works [
24,
25]. Changes of the isocyanate index did not result in significant differences in the thermal conductivity of prepared foams.
3.3. Physico-Mechanical and Thermal Properties Analysis
In
Table 7 are presented the values of the sol fraction, compressive strength, and glass transition temperature (T
g) of foams determined from the temperature dependence of the loss tangent. The addition of biopolyol into the formulations of PUR-PIR foams reduced the content of the sol fraction. This was associated with a decrease of the non-crosslinked fraction content, which suggested a higher crosslink density of prepared foams. The decrease of the sol fraction content was also affected by the increase of I
ISO, which confirmed other research works [
41]. Except for the primary condensation reaction, which led to the generation of urethane groups, at higher values of I
ISO, additional reactions may take place. They included the generation of allophanate and biuret groups or trimerization of isocyanates leading to the generation of polyisocyanurates. All of these groups could noticeably affect the level of crosslink density of PUR-PIR foams [
42].
In
Table 7 are also presented the values of the compressive strength of rigid PUR-PIR foams, measured in two directions, parallel and perpendicular to the rise direction. It was noted that the mechanical performance of the foams was significantly affected by their cellular structure, which was also proven in other works related to this type of material [
43,
44]. For the analyzed materials, the anisotropy of the mechanical properties was associated with the elongation of cells in the direction of the foam rise (see the 3D images in
Table 5). More significant differences between compressive strength parallel and perpendicular to the rise direction were noted for lower contents of biopolyol. This effect was not observed for the highest value of I
ISO, which could be related to the increased stiffness of the structure. Moreover, the increase of the isocyanate index caused a slight reduction of compressive strength, which was also observed by other researchers [
45]. Such an effect was associated with the higher friability of the foams’ structure, which was already noted by Modesti and Lorenzetti [
42].
Except for the decrease of anisotropy in the mechanical properties, a general enhancement of compressive strength was observed for the increase of biopolyol content. Such an effect was related to the reduced values of the sol fraction, suggesting the enhanced crosslink density of modified foams, as well as changes in the cellular structure (a decrease of the cell size and porosity). Generally, a decrease of the cell size with a similar level of the materials’ porosity resulted in the enhancement of the mechanical performance [
46].
The glass transition temperature of the foams was significantly affected by the changes in the foams’ formulations. The increase of the biopolyol content and isocyanate index led to the rise of T
g, which indicated the stiffening of the material, and together with a drop of the sol fraction content, indicated an increase of crosslink density. Ivani et al. [
47] stated that for rigid PUR-PIR foams, an increase of T
g with the addition of biopolyol was associated with the lower flexibility of macromolecular chains compared to the conventionally applied petrochemical polyols.
3.4. Thermogravimetric Analysis
In
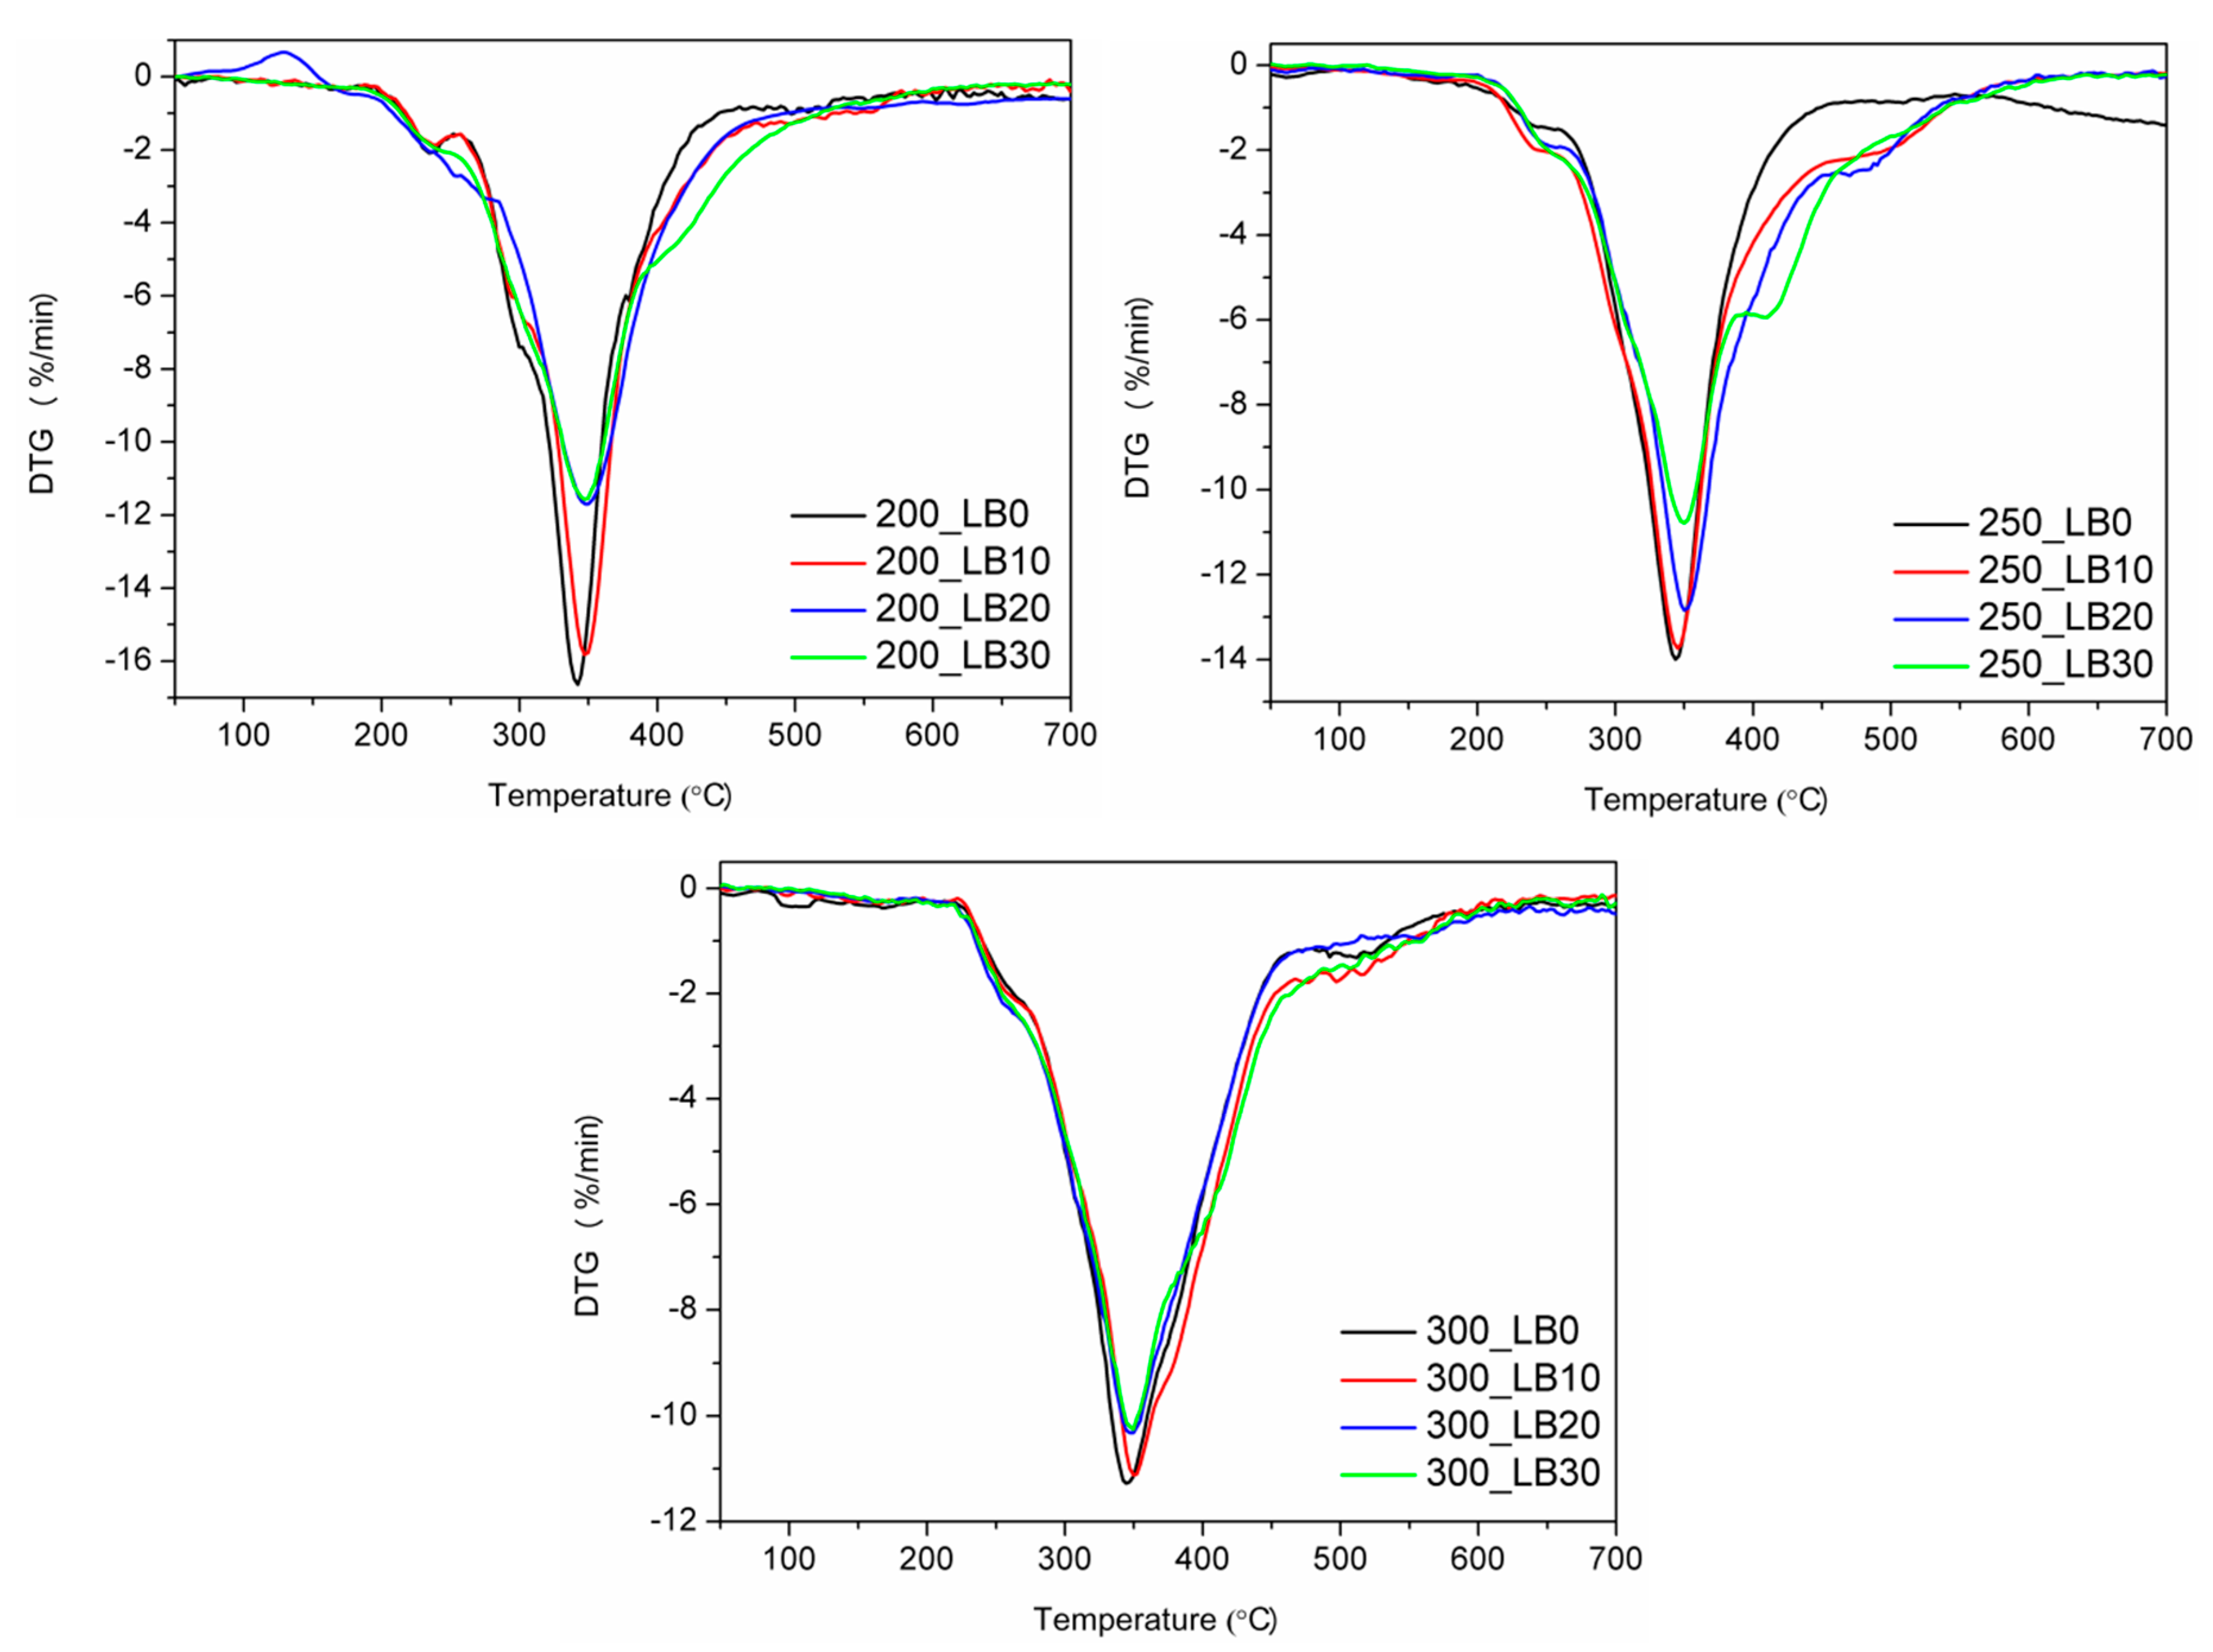
Figure 4 and
Table 8 are presented the results of the thermogravimetric analysis. The thermal decomposition of polyurethanes is a very complicated process, due to its complex structure, especially when also polyisocyanurate groups are present. Generally, it could be seen that the increase of biopolyol content shifted the onset of thermal degradation, measured by the temperature of 2 wt% mass loss, towards higher temperatures. The only exception was observed for I
ISO of 200 and the highest content of biopolyol. It could be considered as very beneficial because numerous literature reports pointed to the deterioration of thermal stability caused by the application of biopolyols [
48].
Differential thermogravimetric curves indicated the three-step decomposition process for all samples. The first step, observed at 220–280 °C, was associated with the decomposition of TCPP (degradation temperature of 224 °C), as well as the decomposition of soft segments. During the second step, with the temperature of the maximum degradation rate of 350 °C, hard segments of polyurethane were decomposed, and amines and carbon dioxide were formed [
49]. For sample 250_LB30, an additional peak around 410 °C was observed, which was associated with biopolyol decomposition [
32]. The third step of degradation, in the range of 430–570 °C, was related to the thermolysis of organic residues from previous steps [
50]. The incorporation of synthesized biopolyol into foams’ formulations caused a shift of peaks on DTG curves towards higher temperatures, which confirmed the enhancement of thermal stability.


 ,
, 


