A Structural Comparison of Ordered and Non-Ordered Ion Doped Silicate Bioactive Glasses


Abstract
1. Introduction
2. Materials and Methods
2.1. Materials
2.2. Method
2.2.1. Sol–gel Synthesis of Non-ordered mesoporous silicate glasses (MSGs)
2.2.2. Surfactant-Assisted Sol-gel Synthesis of Ordered MSGs
2.3. Characterization Methods
2.3.1. High Resolution Transmission Electron Microscopy (HRTEM)
2.3.2. Nitrogen Adsorption Analysis (Brunauer-Emmett-Teller (BET) and Barrett-Joyner-Halenda (BJH))
2.3.3. Fourier Transform Infrared Spectroscopy (FTIR)
2.3.4. Semi-quantitative X-ray Fluorescence (XRF)
2.3.5. Powder X-ray Diffraction (XRD)
3. Results
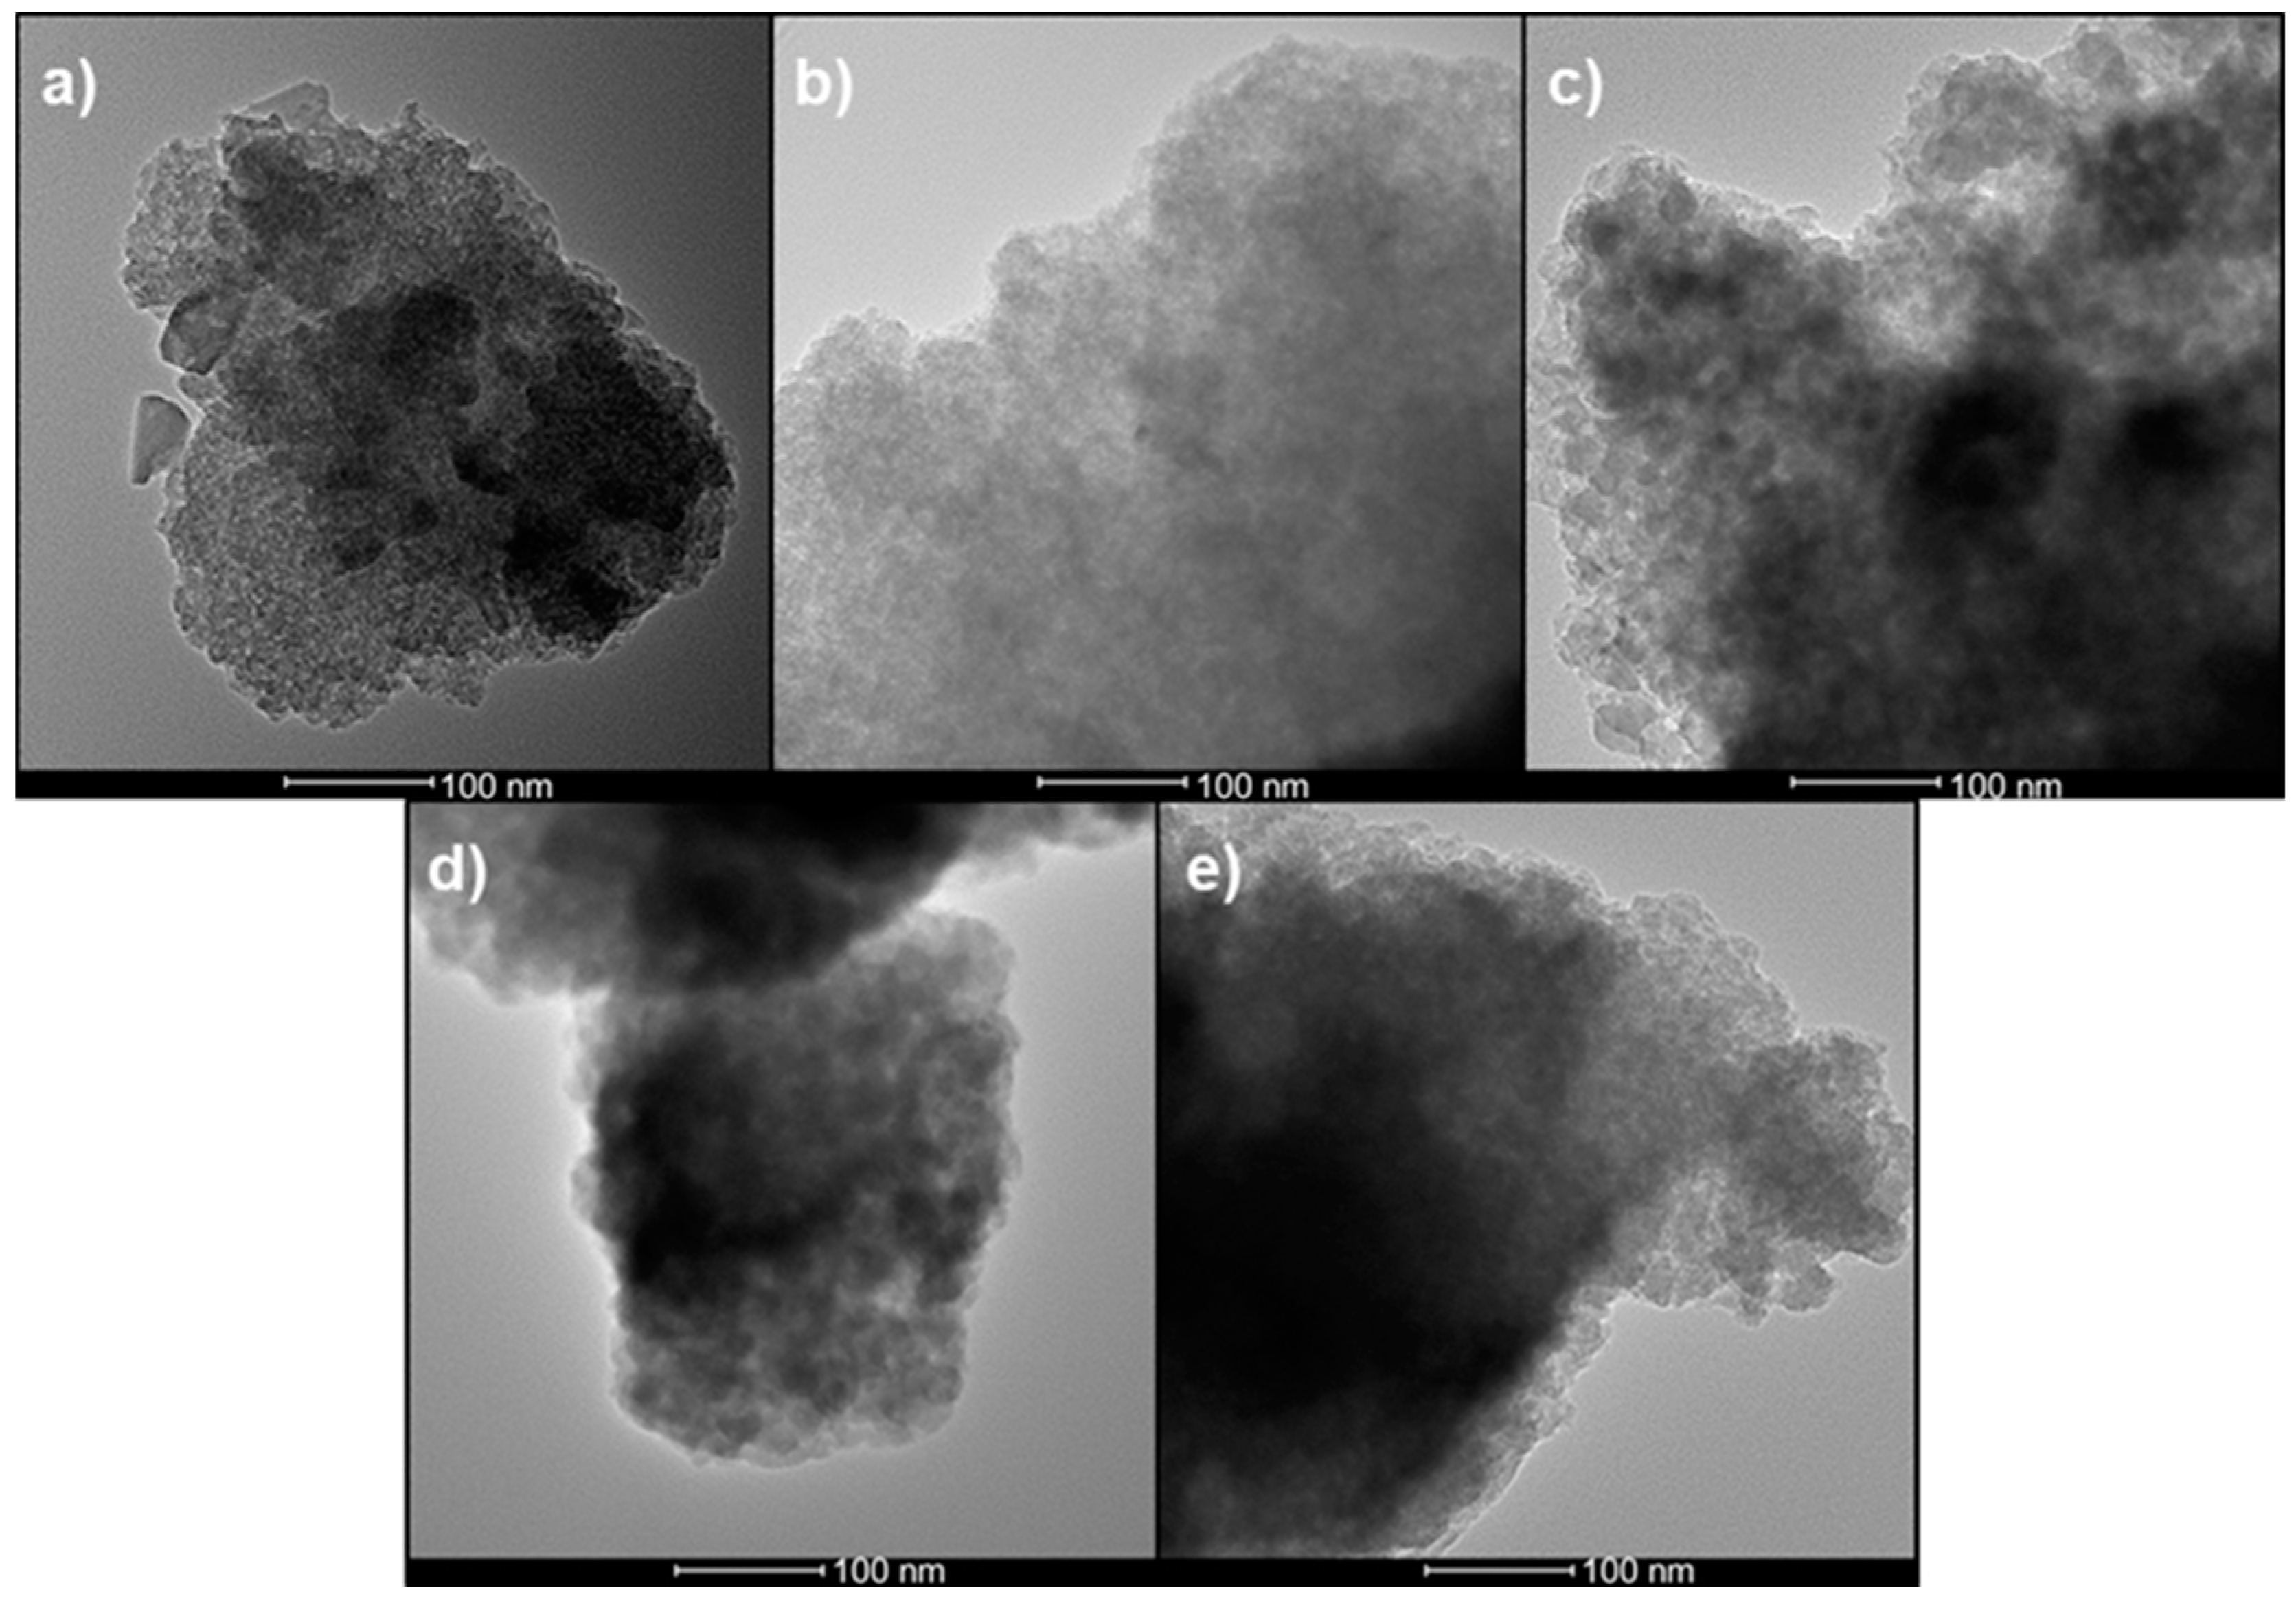
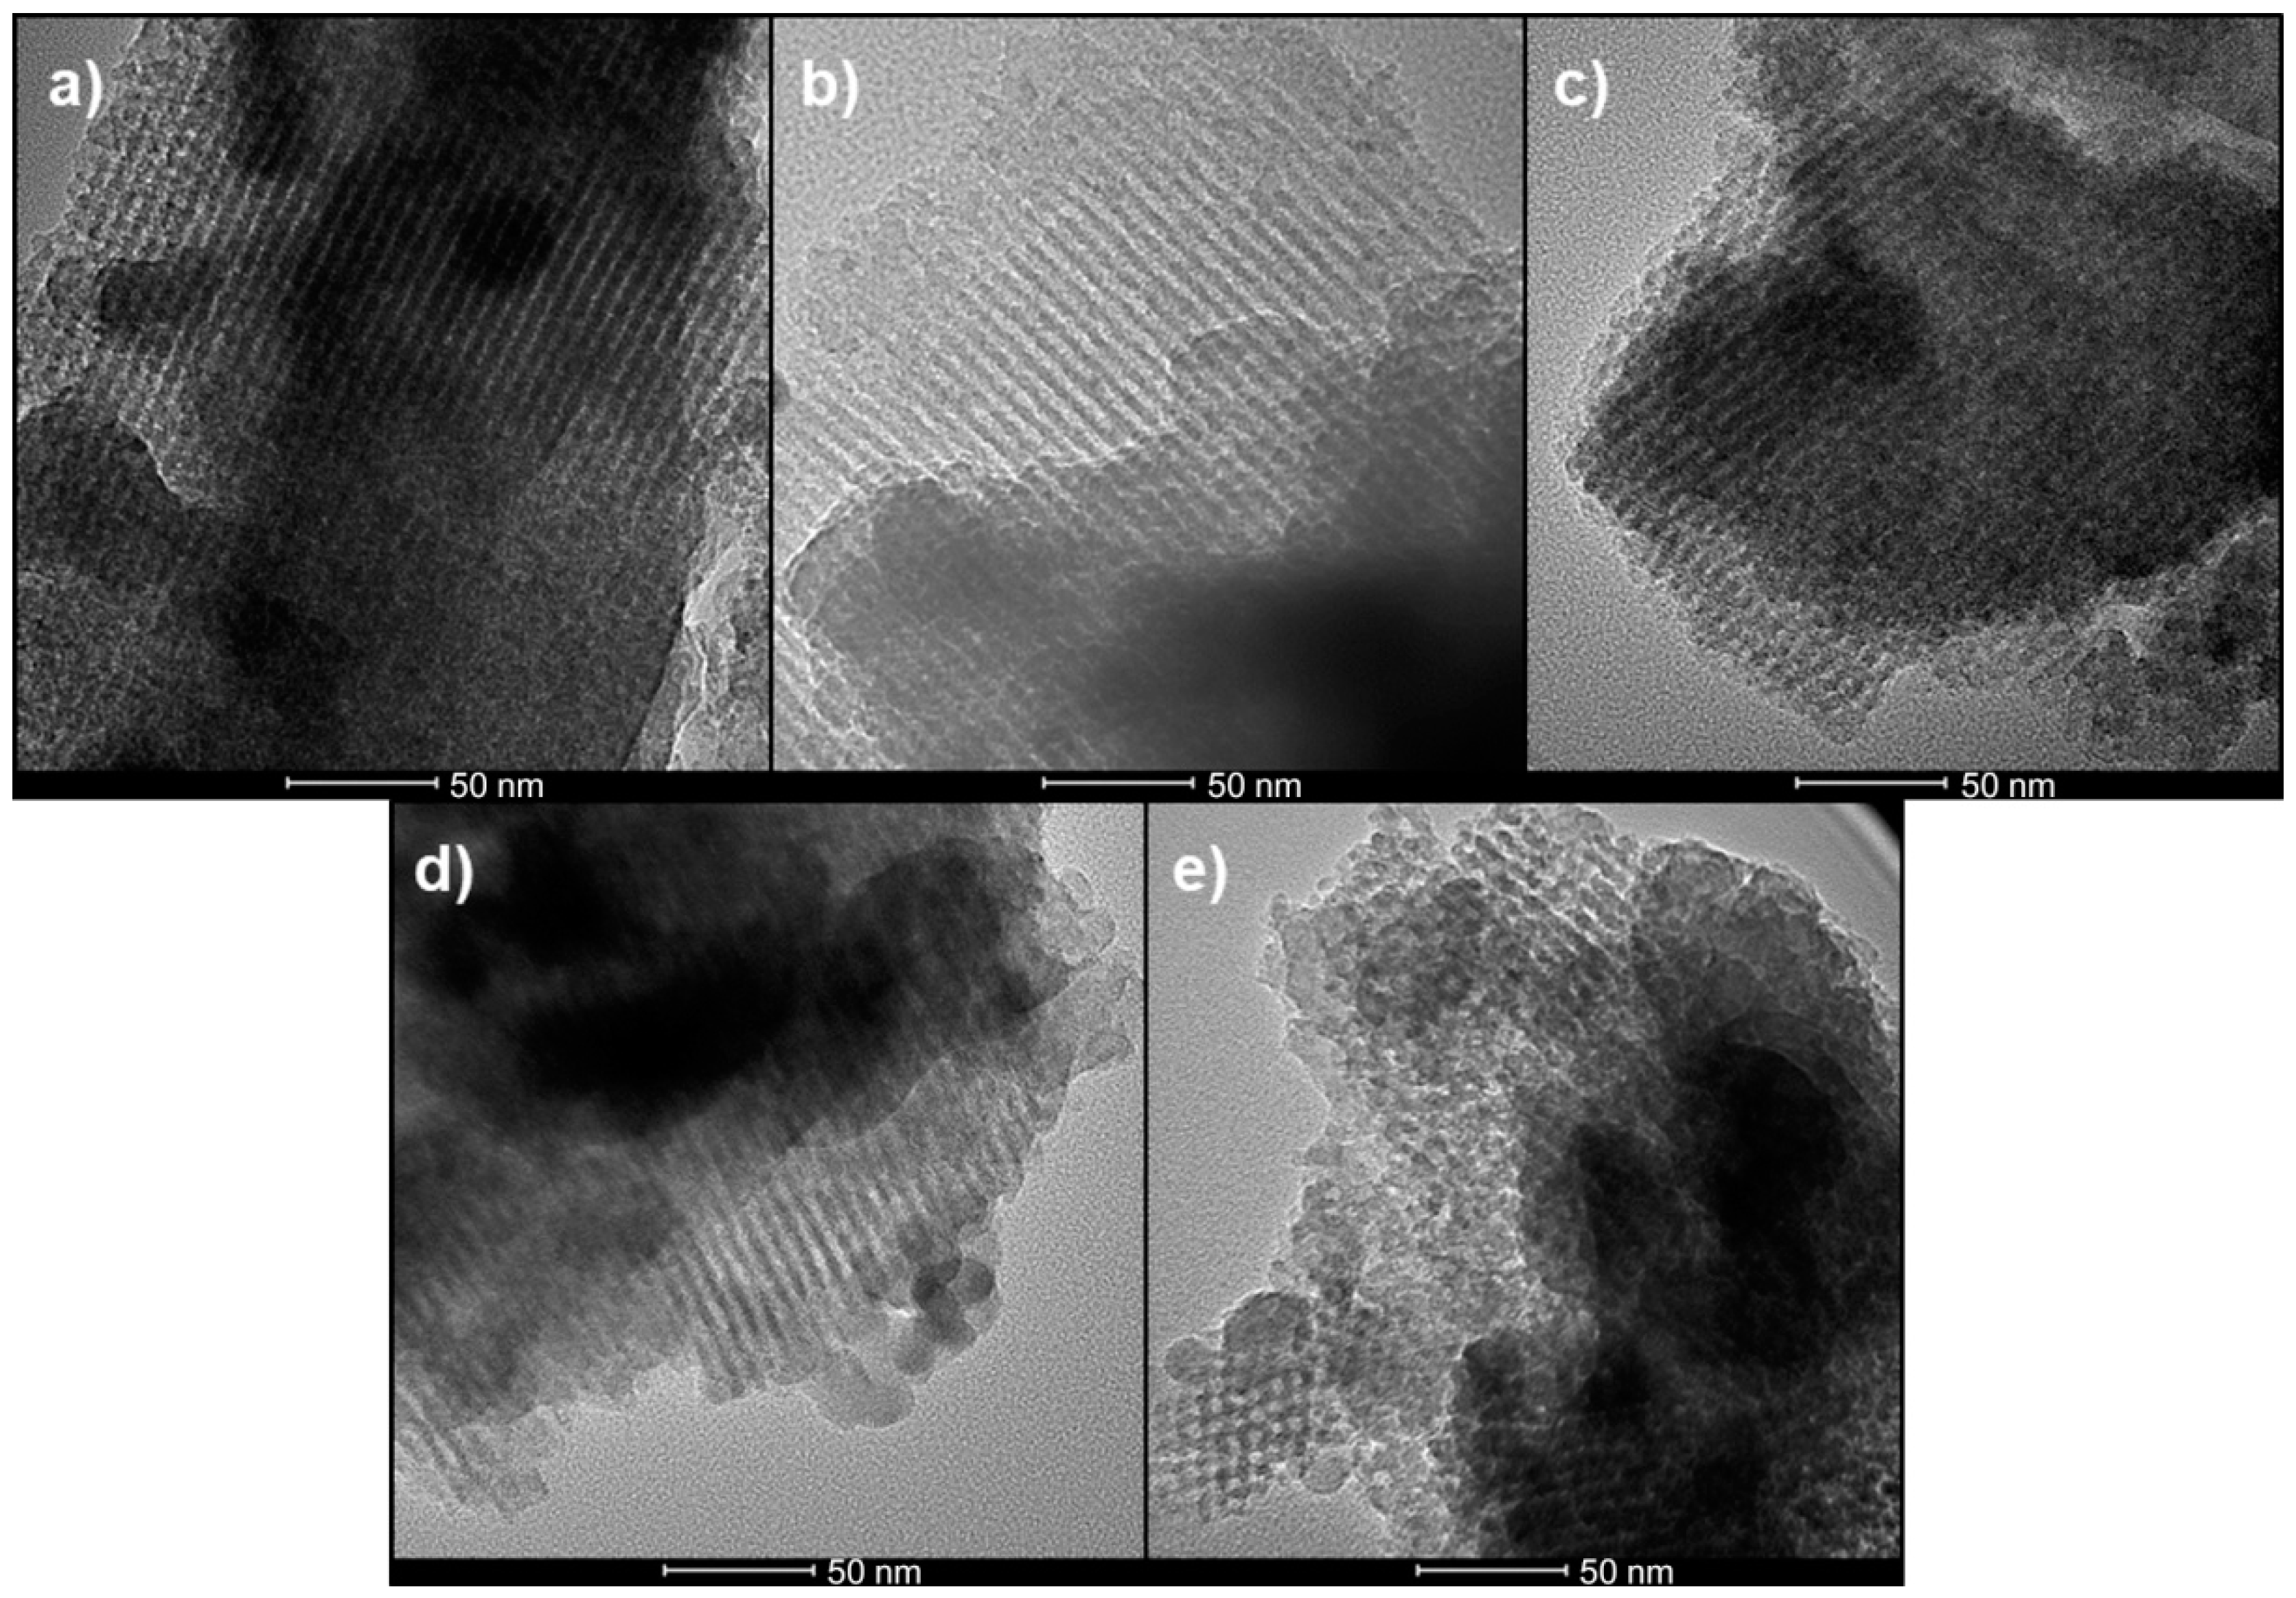
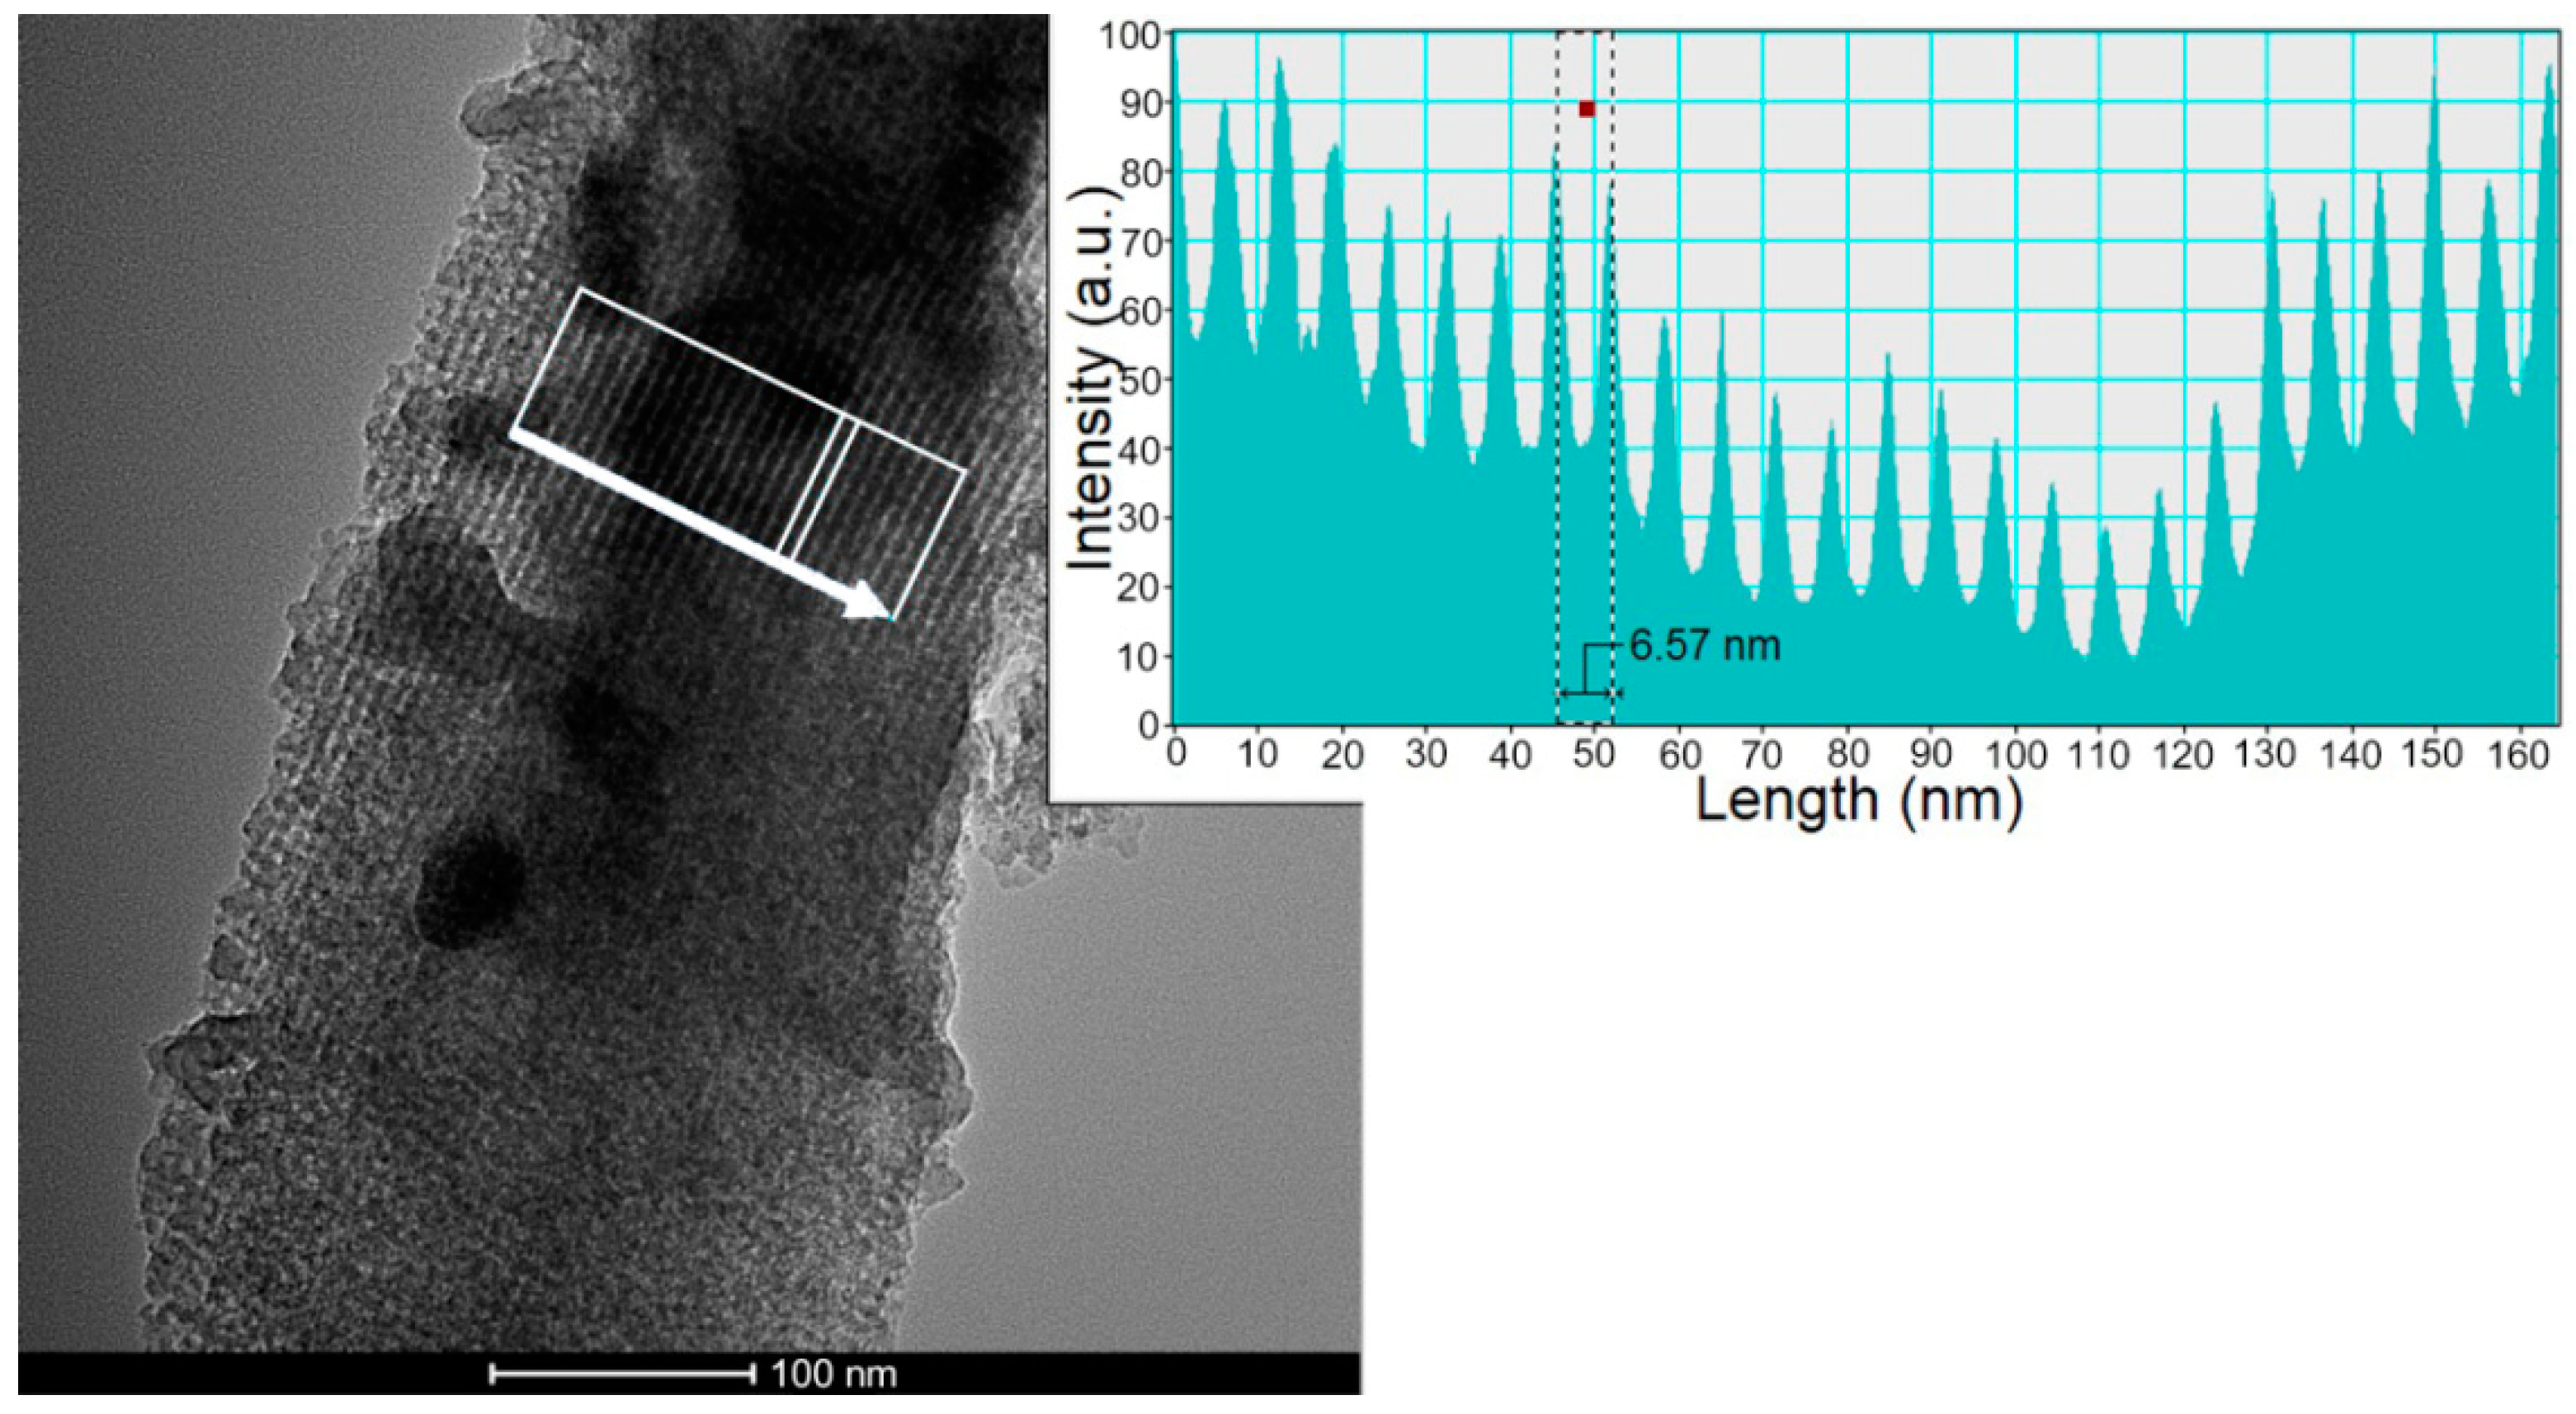
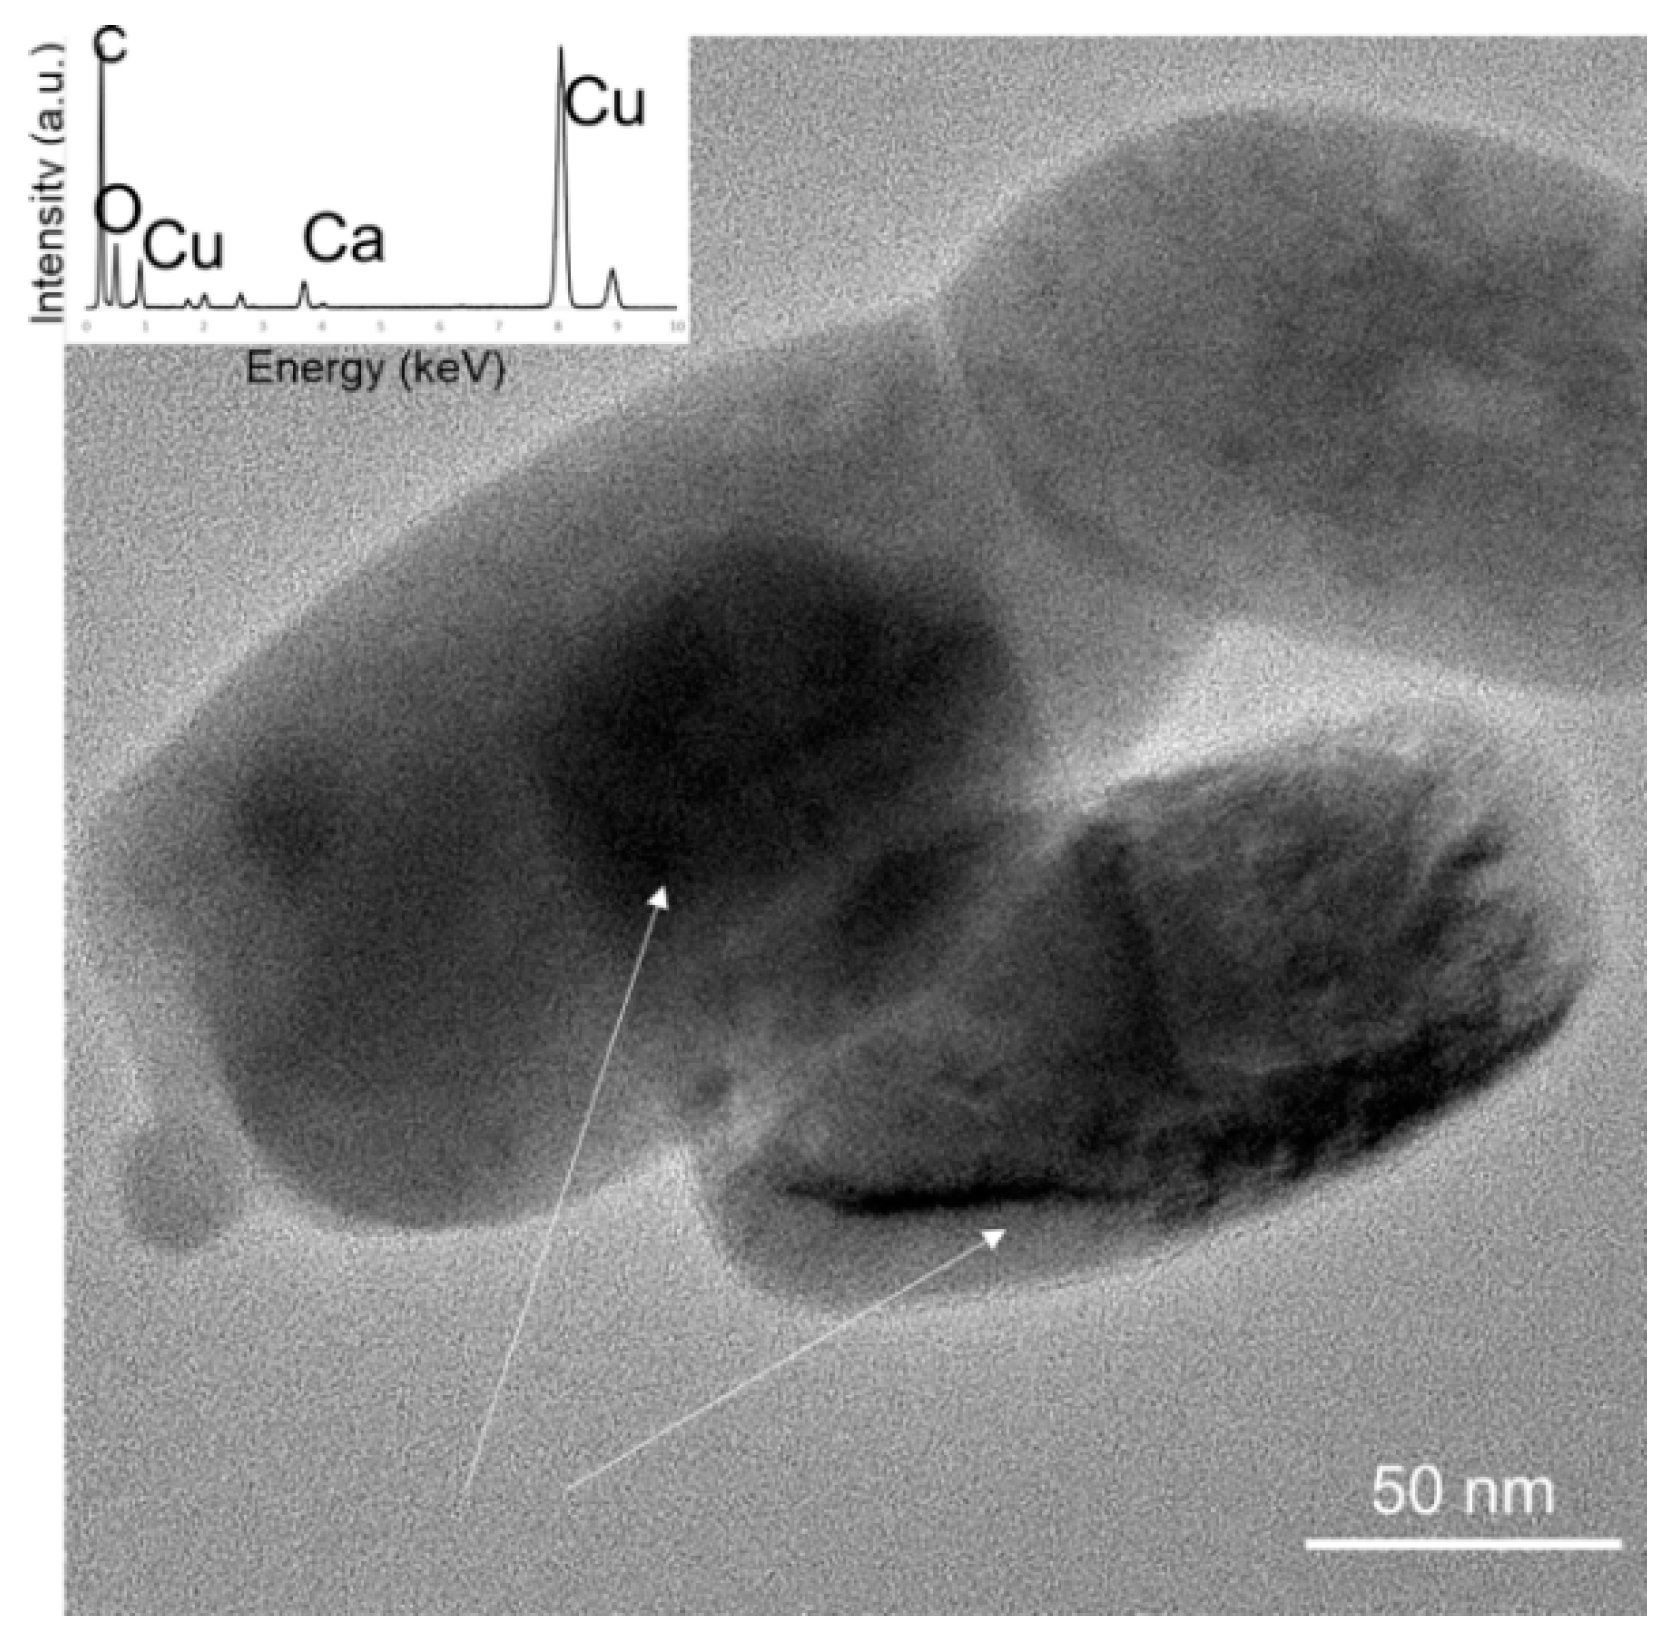
3.1. High Resolution Transmission Electron Microscopy (HRTEM)
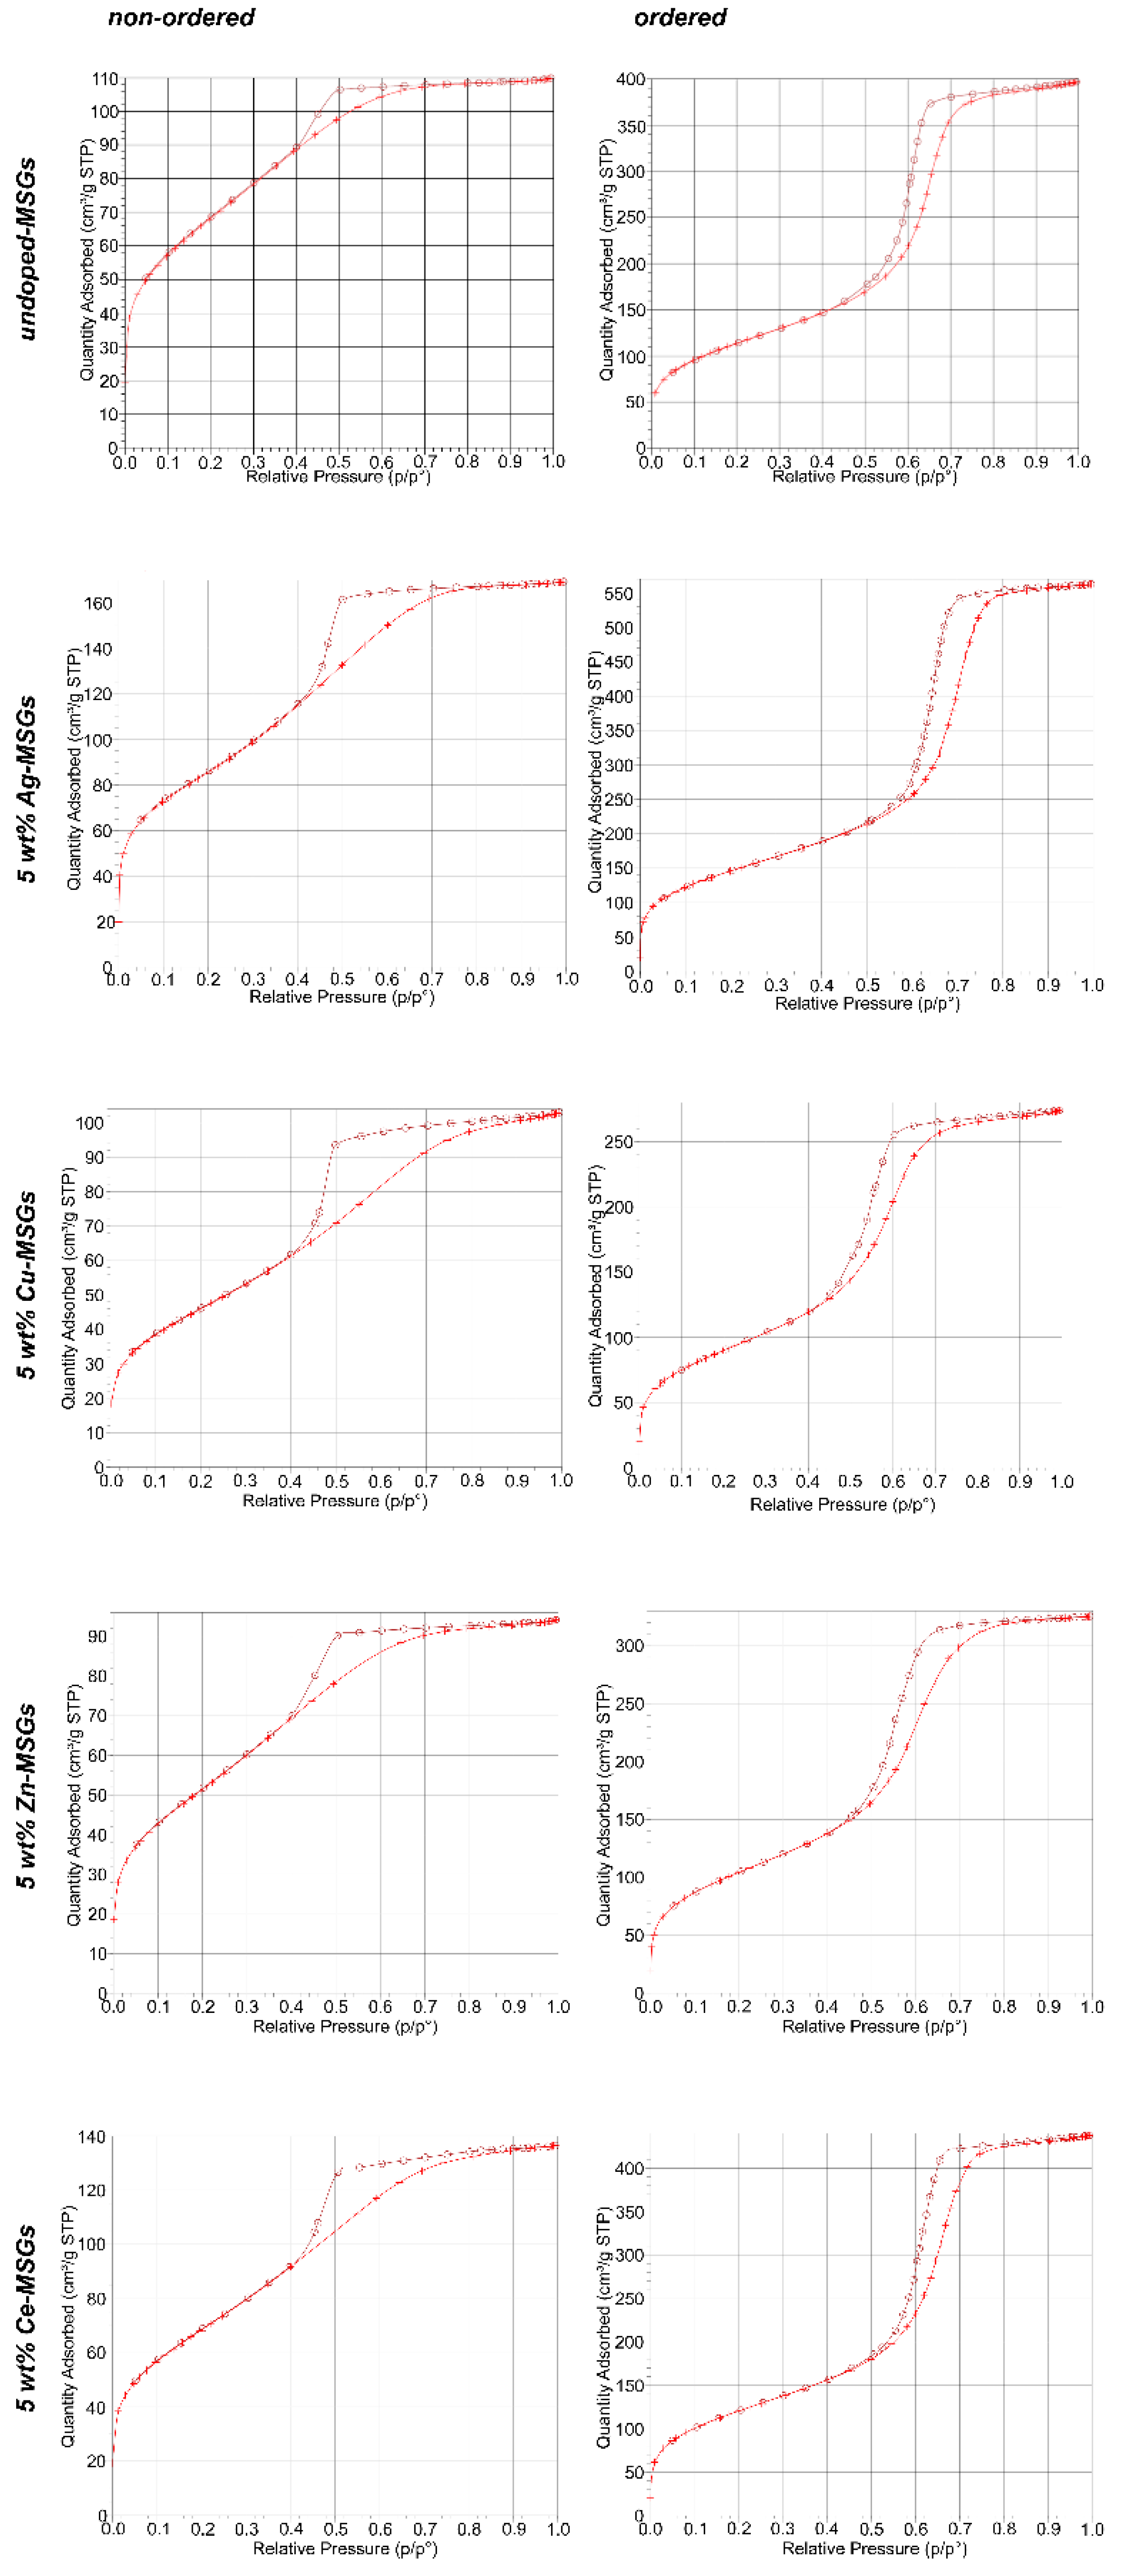
3.2. Nitrogen Adsorption—BET and BJH
3.2.1. Non-ordered and Ordered Undoped Mesoporous Glasses
3.2.2. Non-ordered and Ordered 5 wt% Ag-, Cu-, Zn, and Ce-doped Mesoporous Glasses
3.3. Fourier Transform Infrared Spectroscopy (FTIR)
3.4. Semi-quantitative X-ray Fluorescence
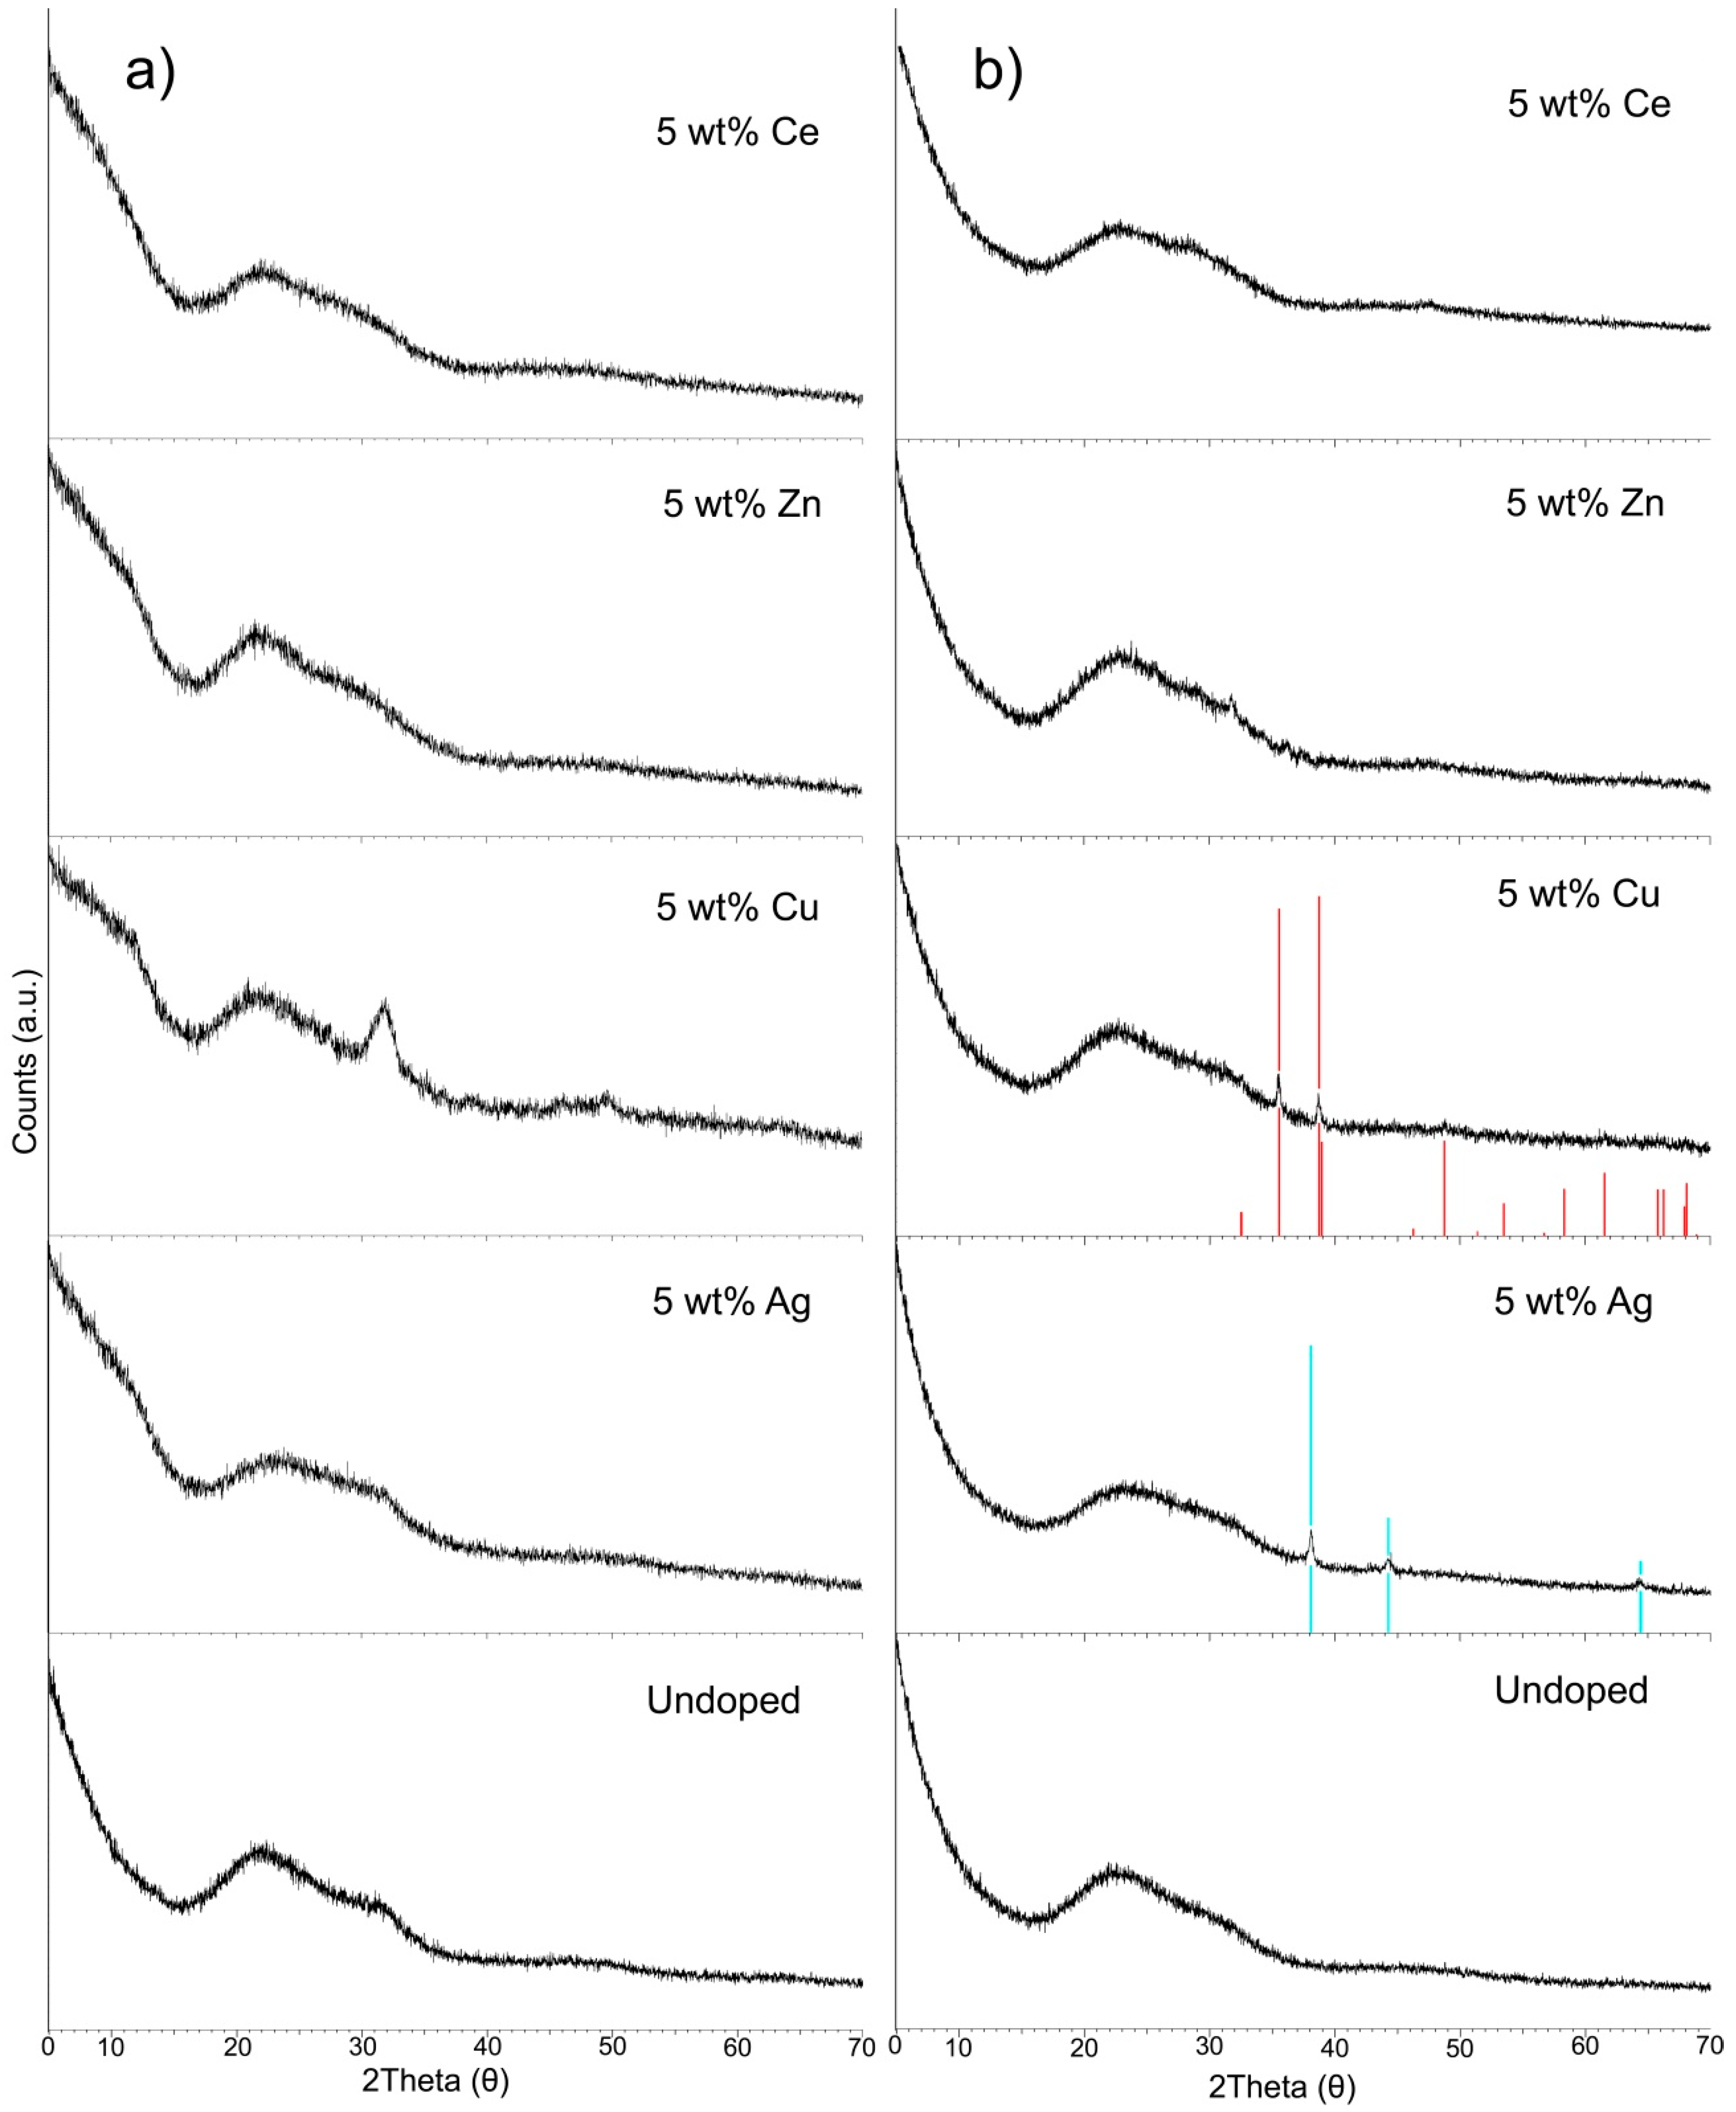
3.5. Powder X-ray Diffraction (XRD)
4. Discussion
5. Conclusions
Supplementary Materials
Author Contributions
Funding
Conflicts of Interest
References
- Rouquerol, J.; Avnir, D.; Fairbridge, C.W.; Everett, D.H.; Haynes, J.H.; Pernicone, N.; Ramsay, J.D.F.; Sing, K.S.W.; Unger, K.K. Recommendations for the characterization of porous solids (Technical Report). Pure Appl. Chem. 1994, 66, 1739–1758. [Google Scholar] [CrossRef]
- Taguchi, A.; Schüth, F. Ordered mesoporous materials in catalysis. Microporous Mesoporous Mater. 2005, 77, 1–45. [Google Scholar] [CrossRef]
- ALOthman, Z.A. A review: Fundamental aspects of silicate mesoporous materials. Materials 2012, 5, 2874–2902. [Google Scholar] [CrossRef]
- Wu, C.; Chang, J. Mesoporous bioactive glasses: Structure characteristics, drug/growth factor delivery and bone regeneration application. Interface Focus 2012, 2, 292–306. [Google Scholar] [CrossRef]
- López-Noriega, A.; Arcos, D.; Izquierdo-Barba, I.; Sakamoto, Y.; Terasaki, O.; Vallet-Regí, M. Ordered mesoporous bioactive glasses for bone tissue regeneration. Chem. Mater. 2006, 18, 3137–3144. [Google Scholar] [CrossRef]
- Kumar, S.; Malik, M.M.; Purohit, R. Synthesis Methods of Mesoporous Silica Materials. Mater. Today Proc. 2017, 4, 350–357. [Google Scholar] [CrossRef]
- Vallet-Regí, M.; Garcia, M.M. Chapter 1- Biocompatible and Bioactive Mesoporous Ceramics. In Biomedical Applications of Mesoporous Ceramics: Drug Delivery, Smart Materials and Bone Tissue Engineering; Vallet-Regí, M., Garcia, M.M., Colilla, M., Eds.; CRC Press: Boca Raton, FL, USA, 2013; pp. 1–66. ISBN 978-1-4398-8308-2. [Google Scholar]
- Zhao, D.; Wan, Y.; Zhou, W. Chapter 2- Synthesis Approach of Mesoporous Molecular Sieves. In Ordered Mesoporous Materials; Wiley-VCH Verlag & Co. KGaA: Weinheim, Germany, 2013; pp. 5–54. ISBN 978-3-527-64789-7. [Google Scholar]
- Yan, X.; Yu, C.; Zhou, X.; Tang, J.; Zhao, D. Highly ordered mesoporous bioactive glasses with superior in vitro bone-forming bioactivities. Angew. Chem. Int. Ed. 2004, 43, 5980–5984. [Google Scholar] [CrossRef]
- Manzano, M.; Vallet-Regí, M. New developments in ordered mesoporous materials for drug delivery. J. Mater. Chem. 2010, 20, 5593–5604. [Google Scholar] [CrossRef]
- Gargiulo, N.; Cusano, A.M.; Causa, F.; Caputo, D.; Netti, P.A. Silver-containing mesoporous bioactive glass with improved antibacterial properties. J. Mater. Sci. Mater. Med. 2013, 24, 2129–2135. [Google Scholar] [CrossRef]
- Wu, C.; Chang, J. Multifunctional mesoporous bioactive glasses for effective delivery of therapeutic ions and drug/growth factors. J. Control. Release 2014, 193, 282–295. [Google Scholar] [CrossRef]
- Yan, X.; Huang, X.; Yu, C.; Deng, H.; Wang, Y.; Zhang, Z.; Qiao, S.; Lu, G.; Zhao, D. The in-vitro bioactivity of mesoporous bioactive glasses. Biomaterials 2006, 27, 3396–3403. [Google Scholar] [CrossRef] [PubMed]
- Leonova, E.; Izquierdo-Barba, I.; Arcos, D.; López-Noriega, A.; Hedin, N.; Vallet-Regí, M.; Edén, M. Multinuclear Solid-State NMR Studies of Ordered Mesoporous Bioactive Glasses. J. Phys. Chem. C 2008, 112, 5552–5562. [Google Scholar] [CrossRef]
- García, A.; Cicuéndez, M.; Izquierdo-Barba, I.; Arcos, D.; Vallet-Regi, M. Essential role of calcium phosphate heterogeneities in 2D-hexagonal and 3D-cubic SiO2-CaO-P2O5 mesoporous bioactive glasses. Chem. Mater. 2009, 21, 5474–5484. [Google Scholar] [CrossRef]
- Alcaide, M.; Portolés, P.; López-Noriega, A.; Arcos, D.; Vallet-Regí, M.; Portolés, M.T. Interaction of an ordered mesoporous bioactive glass with osteoblasts, fibroblasts and lymphocytes, demonstrating its biocompatibility as a potential bone graft material. Acta Biomater. 2010, 6, 892–899. [Google Scholar] [CrossRef] [PubMed]
- Lansdown, A.B.G. Silver in health care: Antimicrobial effects and safety in use. Curr. Probl. Dermatol. 2006, 33, 17–34. [Google Scholar] [PubMed]
- Palza, H.; Escobar, B.; Bejarano, J.; Bravo, D.; Diaz-Dosque, M.; Perez, J. Designing antimicrobial bioactive glass materials with embedded metal ions synthesized by the sol-gel method. Mater. Sci. Eng. C 2013, 33, 3795–3801. [Google Scholar] [CrossRef]
- Goh, Y.F.; Alshemary, A.Z.; Akram, M.; Abdul Kadir, M.R.; Hussain, R. In-vitro characterization of antibacterial bioactive glass containing ceria. Ceram. Int. 2014, 40, 729–737. [Google Scholar] [CrossRef]
- Brinker, C.J.; Lu, Y.; Sellinger, A.; Fan, H. Evaporation-induced self-assembly: Nanostructures made easy. Adv. Mater. 1999, 11, 579–585. [Google Scholar] [CrossRef]
- Zhao, D.; Wan, Y.; Zhou, W. Chapter 4- Structural Characterization Methods. In Ordered Mesoporous Materials; Wiley-VCH Verlag & Co. KGaA: Weinheim, Germany, 2013; pp. 117–151. ISBN 978-3-527-64789-7. [Google Scholar]
- Aguiar, H.; Serra, J.; González, P.; León, B. Structural study of sol-gel silicate glasses by IR and Raman spectroscopies. J. Non-Cryst. Solids 2009, 355, 475–480. [Google Scholar] [CrossRef]
- Mariappan, C.R.; Ranga, N. Influence of silver on the structure, dielectric and antibacterial effect of silver doped bioglass-ceramic nanoparticles. Ceram. Int. 2017, 43, 2196–2201. [Google Scholar] [CrossRef]
- Kalampounias, A.G. IR and Raman spectroscopic studies of sol–gel derived alkaline-earth silicate glasses. Bull. Mater. Sci. 2011, 34, 299–303. [Google Scholar] [CrossRef]
- Notingher, I.; Jones, J.R.; Verrier, S.; Bisson, I.; Embanga, P.; Edwards, P.; Polak, J.M.; Hench, L.L. Application of FTIR and Raman spectroscopy to characterisation of bioactive materials and living cells. Spectroscopy 2003, 17, 275–288. [Google Scholar] [CrossRef]
- Gupta, N.; Santhiya, D.; Murugavel, S.; Kumar, A.; Aditya, A.; Ganguli, M.; Gupta, S. Effects of transition metal ion dopants (Ag, Cu and Fe) on the structural, mechanical and antibacterial properties of bioactive glass. Colloids Surf. A Physicochem. Eng. Asp. 2018, 538, 393–403. [Google Scholar] [CrossRef]
- Li, X.; Wang, X.; He, D.; Shi, J. Synthesis and characterization of mesoporous CaO–MO–SiO2–P2O5 (M = Mg, Zn, Cu) bioactive glasses/composites. J. Mater. Chem. 2008, 18, 4103–4109. [Google Scholar] [CrossRef]
- Yan, X.X.; Deng, H.X.; Huang, X.H.; Lu, G.Q.; Qiao, S.Z.; Zhao, D.Y.; Yu, C.Z. Mesoporous bioactive glasses. I. Synthesis and structural characterization. J. Non-Cryst. Solids 2005, 351, 3209–3217. [Google Scholar] [CrossRef]
- Thommes, M.; Kaneko, K.; Neimark, A.V.; Olivier, J.P.; Rodriguez-Reinoso, F.; Rouquerol, J.; Sing, K.S.W. Physisorption of gases, with special reference to the evaluation of surface area and pore size distribution (IUPAC Technical Report). Pure Appl. Chem. 2015, 87, 1051–1069. [Google Scholar] [CrossRef]
- Sing, K.S.W.; Everett, D.H.; Haul, R.A.W.; Moscou, L.; Pierotti, R.A.; Rouquerol, J.; Siemieniewska, T. Reporting physisorption data for gas/solid systems with special reference to the determination of surface area and porosity (Recommendations 1984). Pure Appl. Chem. 1985, 57, 603–619. [Google Scholar] [CrossRef]
- Grosman, A.; Ortega, C. Nature of Capillary Condensation and Evaporation Processes in Ordered Porous Materials. Am. Chem. Soc. 2005, 21, 10515–10521. [Google Scholar] [CrossRef]
- González, P.; Serra, J.; Liste, S.; Chiussi, S.; León, B.; Pérez-Amor, M. Raman spectroscopic study of bioactive silica based glasses. J. Non-Cryst. Solids 2003, 320, 92–99. [Google Scholar]
- El-Kady, A.M.; Ali, A.F.; Rizk, R.A.; Ahmed, M.M. Synthesis, characterization and microbiological response of silver doped bioactive glass nanoparticles. Ceram. Int. 2012, 38, 177–188. [Google Scholar] [CrossRef]
- Atkinson, I.; Anghel, E.M.; Petrescu, S.; Seciu, A.M.; Stefan, L.M.; Mocioiu, O.C.; Predoana, L.; Voicescu, M.; Somacescu, S.; Culita, D.; et al. Cerium-containing mesoporous bioactive glasses: Material characterization, in vitro bioactivity, biocompatibility and cytotoxicity evaluation. Microporous Mesoporous Mater. 2019, 276, 76–88. [Google Scholar] [CrossRef]
- Salinas, A.J.; Shruti, S.; Malavasi, G.; Menabue, L.; Vallet-Regí, M. Substitutions of cerium, gallium and zinc in ordered mesoporous bioactive glasses. Acta Biomater. 2011, 7, 3452–3458. [Google Scholar] [CrossRef] [PubMed]
- Wers, E.; Oudadesse, H.; Lefeuvre, B.; Lucas-Girot, A.; Rocherullé, J.; Lebullenger, R. Excess entropy and thermal behavior of Cu- and Ti-doped bioactive glasses. J. Therm. Anal. Calorim. 2014, 117, 579–588. [Google Scholar] [CrossRef]
- Arcos, D.; López-Noriega, A.; Ruiz-Hernández, E.; Terasaki, O.; Vallet-Regí, M. Ordered mesoporous microspheres for bone grafting and drug delivery. Chem. Mater. 2009, 21, 1000–1009. [Google Scholar] [CrossRef]
- Rabiee, S.M.; Nazparvar, N.; Azizian, M.; Vashaee, D.; Tayebi, L. Effect of ion substitution on properties of bioactive glasses: A review. Ceram. Int. 2015, 41, 7241–7251. [Google Scholar] [CrossRef]
- Sayah, E.; Brouri, D.; Wu, Y.; Musi, A.; Da Costa, P.; Massiani, P. A TEM and UV-visible study of silver reduction by ethanol in Ag-alumina catalysts. Appl. Catal. A Gen. 2011, 406, 94–101. [Google Scholar] [CrossRef]


| Dopant | Pore Diameter (nm) ± Standard Deviation |
|---|---|
| — | 6.67 ± 0.33 |
| 5 wt% Ag | 6.66 ± 0.20 |
| 5 wt% Cu | 6.22 ± 0.63 |
| 5 wt% Zn | 6.58 ± 0.92 |
| 5 wt% Ce | 6.34 ± 0.15 |
| Mesopore Structure | Dopant | BET Surface Area (m2/g) | BJH Desorption Cumulative Pore Volume (cm3/g) | BJH Desorption Average Pore Size Diameter (nm) |
|---|---|---|---|---|
| Non-ordered | — | 246.7 | 0.1686 | 2.8019 |
| Non-ordered | 5 wt% Ag | 307.8 | 0.2659 | 3.1422 |
| Non-ordered | 5 wt% Cu | 167.1 | 0.1546 | 3.3767 |
| Non-ordered | 5 wt% Zn | 188.3 | 0.1460 | 2.8718 |
| Non-ordered | 5 wt% Ce | 250.5 | 0.1990 | 3.2015 |
| Ordered | — | 411.9 | 0.6119 | 4.7230 |
| Ordered | 5 wt% Ag | 528.6 | 0.8676 | 5.2439 |
| Ordered | 5 wt% Cu | 328.3 | 0.4232 | 4.0138 |
| Ordered | 5 wt% Zn | 380.9 | 0.5015 | 4.1182 |
| Ordered | 5 wt% Ce | 438.1 | 0.6747 | 4.8182 |
| Mesopore Structure | Dopant | νas (Si-O-Si) cm−1 | ν (Si-O NBO) cm−1 | νs (Si-O-Si) cm−1 | B (P-O) cm−1 | r (Si-O-Si) cm−1 |
|---|---|---|---|---|---|---|
| Non-ordered | — | 1047 | ns | 796 | 556 | 442 |
| Non-ordered | 5 wt% Ag | 1045 | 959 | 794 | 551 | 443 |
| Non-ordered | 5 wt% Cu | 1077 | 936 | 799 | 604/566 | 456 |
| Non-ordered | 5 wt% Zn | 1071 | ns | 801 | 559 | 445 |
| Non-ordered | 5 wt% Ce | 1050 | ns | 797 | 555 | 448 |
| Ordered | — | 1032 | ns | 804 | 568 | 441 |
| Ordered | 5 wt% Ag | 1035 | ns | 797 | 559 | 440 |
| Ordered | 5 wt% Cu | 1039 | ns | 801 | 557 | 443 |
| Ordered | 5 wt% Zn | 1034 | ns | 800 | 556 | 440 |
| Ordered | 5 wt% Ce | 1035 | ns | 800 | 558 | 441 |
| Mesopore Structure | Dopant | Theoretical Composition (wt%) | Composition by SQ XRF (wt%) | ||||||
|---|---|---|---|---|---|---|---|---|---|
| SiO2 | CaO | P2O5 | Dopant | SiO2 | CaO | P2O5 | Dopant | ||
| Non-ordered | — | 76 | 13 | 11 | — | 73 | 14 | 13 | — |
| Non-ordered | 5 wt% Ag | 71 | 13 | 11 | 5 | 69 | 14 | 13 | 4 |
| Non-ordered | 5 wt% Cu | 71 | 13 | 11 | 5 | 68 | 14 | 13 | 5 |
| Non-ordered | 5 wt% Zn | 71 | 13 | 11 | 5 | 70 | 13 | 14 | 3 |
| Non-ordered | 5 wt% Ce | 71 | 13 | 11 | 5 | 68 | 13 | 14 | 5 |
| Ordered | — | 76 | 13 | 11 | — | 76 | 15 | 9 | — |
| Ordered | 5 wt% Ag | 71 | 13 | 11 | 5 | 78 | 10 | 10 | 2 |
| Ordered | 5 wt% Cu | 71 | 13 | 11 | 5 | 80 | 9 | 9 | 2 |
| Ordered | 5 wt% Zn | 71 | 13 | 11 | 5 | 72 | 13 | 13 | 2 |
| Ordered | 5 wt% Ce | 71 | 13 | 11 | 5 | 77 | 11 | 8 | 4 |
| Mesopore Structure | Dopant | Theoretical Composition (mol%) | Composition by SQ XRF (mol%) | ||||||
|---|---|---|---|---|---|---|---|---|---|
| SiO2 | CaO | P2O5 | Dopant | SiO2 | CaO | P2O5 | Dopant | ||
| Non-ordered | — | 80 | 15 | 5 | — | 78 | 16 | 6 | — |
| Non-ordered | 5 wt% Ag | 79 | 15 | 5 | 1 | 76 | 17 | 6 | 1 |
| Non-ordered | 5 wt% Cu | 76 | 15 | 5 | 4 | 74 | 16 | 6 | 4 |
| Non-ordered | 5 wt% Zn | 76 | 15 | 5 | 4 | 76 | 15 | 6 | 3 |
| Non-ordered | 5 wt% Ce | 78 | 15 | 5 | 2 | 76 | 15 | 7 | 2 |
| Ordered | — | 80 | 15 | 5 | — | 79 | 17 | 4 | — |
| Ordered | 5 wt% Ag | 79 | 15 | 5 | 1 | 83 | 12 | 4 | 1 |
| Ordered | 5 wt% Cu | 76 | 15 | 5 | 4 | 84 | 10 | 4 | 2 |
| Ordered | 5 wt% Zn | 76 | 15 | 5 | 4 | 78 | 15 | 6 | 1 |
| Ordered | 5 wt% Ce | 78 | 15 | 5 | 2 | 82 | 13 | 4 | 1 |
© 2020 by the authors. Licensee MDPI, Basel, Switzerland. This article is an open access article distributed under the terms and conditions of the Creative Commons Attribution (CC BY) license (http://creativecommons.org/licenses/by/4.0/).
Share and Cite
Schmitz, S.; Beltrán, A.M.; Cresswell, M.; Boccaccini, A.R. A Structural Comparison of Ordered and Non-Ordered Ion Doped Silicate Bioactive Glasses. Materials 2020, 13, 992. https://doi.org/10.3390/ma13040992
Schmitz S, Beltrán AM, Cresswell M, Boccaccini AR. A Structural Comparison of Ordered and Non-Ordered Ion Doped Silicate Bioactive Glasses. Materials. 2020; 13(4):992. https://doi.org/10.3390/ma13040992
Chicago/Turabian StyleSchmitz, Seray, Ana M. Beltrán, Mark Cresswell, and Aldo R. Boccaccini. 2020. "A Structural Comparison of Ordered and Non-Ordered Ion Doped Silicate Bioactive Glasses" Materials 13, no. 4: 992. https://doi.org/10.3390/ma13040992
APA StyleSchmitz, S., Beltrán, A. M., Cresswell, M., & Boccaccini, A. R. (2020). A Structural Comparison of Ordered and Non-Ordered Ion Doped Silicate Bioactive Glasses. Materials, 13(4), 992. https://doi.org/10.3390/ma13040992