Article

Relative Permeability Characteristics During Carbon Capture and Sequestration Process in Low-Permeable Reservoirs

1
Department of Petroleum Engineering, Northeast Petroleum University, Daqing 163318, China
2
Department of Petroleum Engineering, Xi’an Shiyou University, Xi’an 710065, China
3
China University of Petroleum (Beijing), Beijing 102249, China
*
Author to whom correspondence should be addressed.
Materials 2020, 13(4), 990; https://doi.org/10.3390/ma13040990
Submission received: 18 December 2019 / Revised: 19 February 2020 / Accepted: 20 February 2020 / Published: 22 February 2020
(This article belongs to the Section Porous Materials)

Abstract

:
The injection of carbon dioxide (CO2) in low-permeable reservoirs can not only mitigate the greenhouse effect on the environment, but also enhance oil and gas recovery (EOR). For numerical simulation work of this process, relative permeability can help predict the capacity for the flow of CO2 throughout the life of the reservoir, and reflect the changes induced by the injected CO2. In this paper, the experimental methods and empirical correlations to determine relative permeability are reviewed and discussed. Specifically, for a low-permeable reservoir in China, a core displacement experiment is performed for both natural and artificial low-permeable cores to study the relative permeability characteristics. The results show that for immiscible CO2 flooding, when considering the threshold pressure and gas slippage, the relative permeability decreases to some extent, and the relative permeability of oil/water does not reduce as much as that of CO2. In miscible flooding, the curves have different shapes for cores with a different permeability. By comparing the relative permeability curves under immiscible and miscible CO2 flooding, it is found that the two-phase span of miscible flooding is wider, and the relative permeability at the gas endpoint becomes larger.

1. Introduction

The injection of carbon dioxide (CO2) in depleted oil and gas reservoirs, saline aquifers, or coal seams, is an important means of reducing air pollution and mitigating the greenhouse effect on the environment, and it has been extensively discussed in previous studies [1,2,3,4,5,6,7]. Figure 1 shows some typical Carbon Capture and Sequestration (CCS) projects around the globe. For developing countries such as China, it can serve as an important measure to enhance oil and gas recovery, especially in low- or ultralow-permeable reservoirs, since the oil in low-permeable reservoirs accounts for approximately 60% of the proven reserve which has not been developed [8]. For example, the injected CO2 in the ultralow-permeable reservoir in the Jilin oilfield, whose permeability is less than 0.01 × 10⁻³ μm2, can not only fracture the near the wellbore region and also improve the oil recovery in the reservoir.
Water flooding in low-permeable reservoirs results in a very unsatisfactory recovery, due to serious heterogeneity, tight lithology, high filtration resistance, poor pressure transmissibility and water sensitive minerals, and so on. With this regard, CO2 flooding is superior to water flooding, because it can not only maintain the reservoir pressure, but also improve the displacement efficiency [9,10,11]. There are several known reasons for that. For example, CO2 can easily dissolve into crude oil, so as to reduce the interfacial tension, the viscosity of crude oil and the residual oil saturation. In order to increase oil production and CO2 injection efficiency, a number of methods are used, and among them, horizontal wells play a vital role due to their large flow areas [12]. The CO2 flooding process in the subsurface takes place either in aquifers or sandstone reservoirs with a certain amount of oil. An important parameter for estimating the amount of oil and gas in a reservoir, and for predicting the capacity for fluid flow throughout the life of the reservoir, is the relative permeability, an indication of fluid distribution and movement, pore structure variation, and the chemistry of the solids and fluids. Moreover, all of the changes induced by the injected CO2 can also be observed in the relative permeability curves [13,14]. For the determination of relative permeability in low-permeable reservoirs, several concepts have to be explained. A Minimum Miscibility Pressure or MMP, the boundary of miscible flooding and immiscible flooding, shall be determined when measuring the CO2/oil relative permeability curve. There are several commonly-used experimental methods for the MMP determination, such as the slim-tube test, core flooding, rising-bubble apparatus, and so on [15]. In this experiment, the slim tube method is adopted. A threshold pressure, the pressure that the injected gas has to overcome to displace the fluid, has to be measured prior to the relative permeability measurement, because the complex pore structures, narrow pore throat and large tortuosity in low permeable reservoirs lead to complex physical and chemical reactions between fluid and pore walls, which cannot be described by Darcy’s law. Last but not least, the fluid viscosity has to be paid special attention during the measurement and calculation, because CO2, no matter whether it is miscible or immiscible, has great impact on the oil viscosity.
In this paper, the typical experimental methods and empirical correlations are reviewed and discussed with regards to the determination of relative permeability. With special focus on CO2 flooding, the CO2/water and CO2/oil relative permeability measurement is performed using core displacement experiment for immiscible CO2 flooding scenarios. Since there is little study on relative permeability in miscible flooding, the experimental method for miscible CO2 flooding will also be introduced.

2. Experimental Methods for Relative Permeability Determination

A variety of methods to measure relative permeability in porous media are basically categorized as steady-state and unsteady-state methods

2.1. Steady-state Methods

In steady-state methods, both phases are injected simultaneously at constant rates. Injection continues until a steady-state is reached, as indicated by a constant pressure drop and constant saturations. The subcategories of the steady-state methods include the multiple-core method, high-rate method, stationary–liquid method and uniform–capillary–pressure method, and so on. It was used to measure the relative permeability relations of supercritical CO2 and brine, both in imbibition and drainage processes [16,17]. However, capillary entry and end effects during two-phase flow are not considered in their work. In Chen and Amir (2014), the capillary end effect was detected during the measurement of CO2-brine relative permeability in a sandstone core [18]. Robin G. and Daniel R.M. (2016) introduced a novel modified steady-state approach in which corrections for end-effect artifacts are applied as data are measured [19]. However, the method process is too complex. In many studies the influence of surface tension and viscosity on the behavior of fluids is considered, but the influence of the physical state is always ignored. Florian et al. (2015) conducted the measurement of relative permeability under High Temperature and Pressure conditions with gaseous CO2/water and supercritical CO2/water with a steady-state method, and the results show that the physical state does not influence very much [20].

2.2. Unsteady-state Methods

In unsteady-state methods, which is also known as external-drive methods or displacement methods, only one phase is injected at either a constant flow rate or a constant pressure drop. Its subcategories include the high-rate method, low-rate method, and centrifuge methods. Unsteady-state methods are much faster than steady-state methods, but many operational difficulties are involved in unsteady-state methods, such as capillary end effects. Therefore, some modifications have been developed to improve unsteady-state methods. The Johnson–Bossier–Naumann (JBN) method, or some modification of it, interprets that high-flow-rate displacements can eliminate the capillary pressure end effects [21,22]. It consists of injecting a displacing phase into a core fully saturated with a displaced phase; during the unsteady-state portion of the displacement, both the overall pressure drop and the effluent phase ratio are measured versus time. By using fractional flow theory and a mathematical inversion, relative permeability data to both phases are obtained at the outlet as the displaced phase saturate decreases. A unique and practical method, including the capillary end effects, has been presented using sufficiently high flow rates to minimize the rate of the capillary end effects in Janos et al. (2002) [23]. However, the high-flow-rate is usually difficult to accomplish, especially in tight cores, so the end effects are often neglected in some development of simplified interpretation methods [24]. For example, a new unsteady-state model for calculating the oil–water relative permeability of low-permeability has been established, which considers the effects of threshold pressure gradient and capillary pressure [25]. In addition, a method using genetic algorithms to estimate relative permeability and minimize adjustable parameters is suggested when the capillary end-effect is high [26].

3. Empirical Correlations for Relative Permeability Determination

Relationships for the relative permeability as a function of saturation are usually based on experimental data. However, in the absence of data, empirical correlations are often used. The empirical correlations use the effective wetting phase saturation as the correlating parameter. In 1949, Purcell proposed an equation to compute permeability by using capillary pressure measurement. Burdine (1953) introduced a tortuosity factor into the Purcell equation, and obtained the Burdine equation (Equations (1) and (2)) [27].
Mualem (1976) modified the Burdine model, and the modification is known as the Mualem model (Equations (3) and (4)) [28]. This section is an excerpt from Bai et al. (2014) [29].
Burdine Model (Burdine, 1953)
k r w = ( S w S w r 1 S w r ) 2 ( 0 S w 1 P c 2 d S w ) / ( 0 1 1 P c 2 d S w )
k r n w = ( S n w S w r 1 S n w r S w r ) 2 ( S w 1 1 P c 2 d S w ) / ( 0 1 1 P c 2 d S w )
Mualem Model (Mualem, 1976)
k r w = ( S w S w r 1 S w r ) 0.5 ( 0 S w 1 P c d S w ) 2 / ( 0 1 1 P c d S w ) 2
k r n w = ( S n w S w r 1 S n w r S w r ) 0.5 ( S w 1 1 P c d S w ) 2 / ( 0 1 1 P c d S w ) 2
Van Genuchten (1980) has proposed the classical capillary pressures, that is, saturation relations to describe the behavior of soils. By introducing them into the Burdine model and the Mualem model, there was obtained the famous van Genuchten/Burdine model and van Genuchten/Mualem model [30,31]. In 1966 Brooks and Corey proposed the second classical capillary pressure, namely, saturation relations to describe the behavior of petroleum reservoir rock [32]. By substituting it into the Burdine model and the Mualem model with Snwr = 0, one obtains the Brooks–Corey/Burdine and the Brooks–Corey/Burdine model. In earlier experiments, Corey (1954) had obtained a linear relationship between the reciprocal of the capillary pressure squared and the effective water saturation, which is known as Corey’s correlation [33]. Corey’s correlation has been widely used, and works well, not only in the lab, but also in field applications. It is a special Brooks and Corey equation. The limitations are, for instance, that the porous media must be well-sorted, and that it is only derived for drainage process.

4. Relative Permeability for CO2 Flooding in a Low-permeable Reservoir

For a CCS project in the Jilin oilfield, a typical low–permeable reservoir, both retrieved natural cores from the reservoir and artificial cores are used to determine relative permeability in the experiment, where the unsteady-state method was adopted during immiscible CO2 flooding, while the steady-state method was applied during miscible CO2 flooding, where the evenly mixed oil and CO2 was injected into the cores for the relative permeability measurement. Since the miscible CO2 flooding is actually achieved after multi-contact and gradual extraction, even if the pressure is higher than MMP, direct gas displacement cannot ensure a completely miscible state in the cores. Thus, live oil with dissolved gas in it is used for the experiment.

4.1. CO2/Oil Relative Permeability Curve in Immiscible CO2 Flooding

The unsteady-state method was adopted to conduct an immiscible CO2 flooding experiment based on the Buckley–Leverett theory. The immiscible flooding implies that the CO2 injection pressure is less than MMP of CO2 and oil, and CO2 and oil in the cores fail to reach the miscible state and are still two-phase fluid. The oil and gas flow rate versus time at the outlet of rock samples were recorded during the displacement process. Under the premise of considering the threshold pressure and gas slippage in low-permeable cores, the “JBN” method was used to calculate the oil and gas relative permeability.
The main experimental steps include the determination of the geometric data of the core samples and the air permeability, vacuumization of the core samples and saturation with formation water, the calculation of the porosity of the rock samples, determination of the oil saturation and irreducible water saturation by displacing water with oil until no water comes out, and the measurement of oil permeability corresponding to irreducible water saturation. After this, a proper displacement pressure is applied to displace the oil by CO2 to ensure that the flooding velocity is between 7–30 mL/min, and the pressure is smaller than MMP. The oil and gas rate versus time is recorded during the displacement process until the residual oil saturation is reached, and then the effective permeability to gas is measured. The oil and gas flow rate measured at the outlet under atmospheric pressure is modified to the one under the average pressure in the samples, according to Equation (5). The relative permeability curves can be obtained by performing calculations according to Equation (6).
V i = { Δ V i l + V i 1 , Δ V i g = 0 Δ V i g α l E l + ( Δ V i l Δ V i g α l ) + V i 1 , 0 < Δ V i g < α l Δ V i l Δ V i l E l + V i 1 l + [ 2 p a ( Δ p + 2 p a ) ] ( Δ V i g α l Δ V i l ) , Δ V i g α l Δ V i l
where, l denotes liquid (oil or water); Vi-1 and Vli denote cumulative oil and gas rate at time i-1 and i, respectively, mL; ΔVli denotes incremental liquid rate, mL; pa denotes atmospheric pressure, MPa; Δp denotes differential pressure, MPa; α l denotes solubility of CO2 in liquid, mL/mL; El denotes the volume expansion coefficient of liquid, dimensionless.
f l = d V ¯ i l d V ¯ i
k r l = f l d [ 1 / V ¯ i ] d [ 1 / V ¯ i I ]
I = Q i Q l Δ P 0 G Δ P i
k r g = k r l μ g μ l f g f l 1 1 + b / P a v e
b = 0.0955 ( k φ ) 0.53
S g = V ¯ i l V ¯ i f l
where, G denotes threshold pressure, MPa; ΔP0 denotes the initial pressure differential, MPa; Pave denotes the average pressure differential, MPa; b denotes gas slippage factor, dimensionless; I denotes relative injectivity, dimensionless; f denotes oil or water fractional content, dimensionless; Q0 denotes initial liquid rate at the outlet, cm3/s; Qi denotes liquid rate at the outlet at time I, cm3/s.
For the CO2/oil relative permeability measurement under an immiscible state, the oil is a mixture of dead oil and kerosene, and the formation water has a Total Dissolved Solid (TDS) of 5500 mg/L. Experimental temperature is 74.9 °C and 45 °C for natural and artificial cores, respectively. The basic geometric and physical properties of the cores are listed in Table 1. The experimental scenarios are listed in Table 2. In the tables hereunder, K permeability, L length of the core, D cross-sectional area, φ porosity, Pin injection pressure and T temperature, respectively.

4.2. CO2/Water Relative Permeability Curve in Immiscible CO2 Flooding

Similar to the CO2/oil relative permeability, the CO2/water relative permeability characteristics can also be obtained by injecting CO2 into the water-saturating cores and recording the oil and gas rate, etc., versus time at the outlet. The “JBN” method was used to calculate the oil and gas relative permeability and corresponding saturation. For the experiment, the first step is the measurement of air permeability, saturating the rocks with water and determination of the porosity. The next step is to adjust the injection pressure by regulating the pressure valve, and to inject CO2 into the cores under constant pressure. The differential pressure must overcome the end effect, without leading to turbulent flow. After that, the data, such as gas breakthrough time, cumulative water and gas flow rate versus time, are all recorded. When the water saturation reaches the irreducible value, the gas permeability is measured under the displacement pressure and 1/2 displacement pressure, respectively.
The total oil and gas flow rate measured under atmospheric pressure at the outlet is modified to the one under the average pressure of the rock sample, according to Equation (5). The relative permeability curves can be obtained by performing calculations according to Equation (6).
For CO2/water relative permeability measurement under an immiscible state, the formation water has a TDS of 5500 mg/L. Experimental temperature is 45 °C for artificial cubic cores. The basic geometric and physical properties of the cores are listed in Table 3. The experimental scenarios are listed in Table 4.

4.3. CO2/Oil Relative Permeability Curve in Miscible CO2 Flooding

The steady-state method for CO2 miscible flooding is based on Darcy’s law without consideration of capillary pressure and gravity effect. CO2 and live oil are fully mixed in a certain proportion under a pressure greater than MMP to reach the miscible state. The mixture is injected into the samples under a constant pressure, while keeping the inlet and outlet pressure constant and above the MMP as well.
When the oil and gas flow at the outlet is stable, it is deemed that the distribution of oil and CO2 in the sample is uniform and stable. At this time the effective permeability to oil and CO2 is constant, and the effective permeability and relative permeability value of oil and gas can be directly calculated with Darcy’s law by using the recorded data. A series of CO2/oil relative permeabilities under different oil saturations can be obtained by calculating the average oil saturation with the material balance method and by changing the mixing ratio of oil and CO2.
The first step is to put the core samples saturated with formation water into the core holders where the water is injected through the cores with a certain flow rate via a pump. The water permeability is measured for three times after the differential pressure and flow rate at the outlet are stable. The second step is to displace the water in the samples with live oil, and to measure the effective permeability of this oil at the irreducible water saturation. The third step is to inject the CO2/oil mixture into the cores and record the oil and gas volume at the outlet under ambient pressure, as well as the cumulative injection volume, until the oil and gas flow is stable. In order to keep the mixture miscible, the pressure at the outlet is set to be 30 MPa. The proportion of live oil and CO2 in the mixture is changed, and step 3 is repeated. The effective and relative permeability of CO2 and oil can be calculated based on Darcy’s law.
For the CO2/oil miscible phase, the live oil with dissolved GOR of 30 Sm3/m3 is used. The TDS of the formation water is 5500 mg/l, and the temperature is 45 °C. The basic core data is listed in Table 5. According to the indoor experiments, the bubble point pressure is 7 MPa, the MMP of CO2 and live oil is 24.5 MPa, so for the four cores, the injection pressure and discharge pressure are 35 MPa and 30 MPa, respectively. The scenarios are designed in Table 6.

5. Discussion of Experimental Results

5.1. Relative Permeability Curves for Immiscible CO2/Oil Displacement

The main experimental steps are described in Section 4.1. It includes mainly the determination of the oil saturation and irreducible water saturation by displacing water with oil until no water comes out, and then measurement of oil permeability corresponding to an irreducible water saturation.
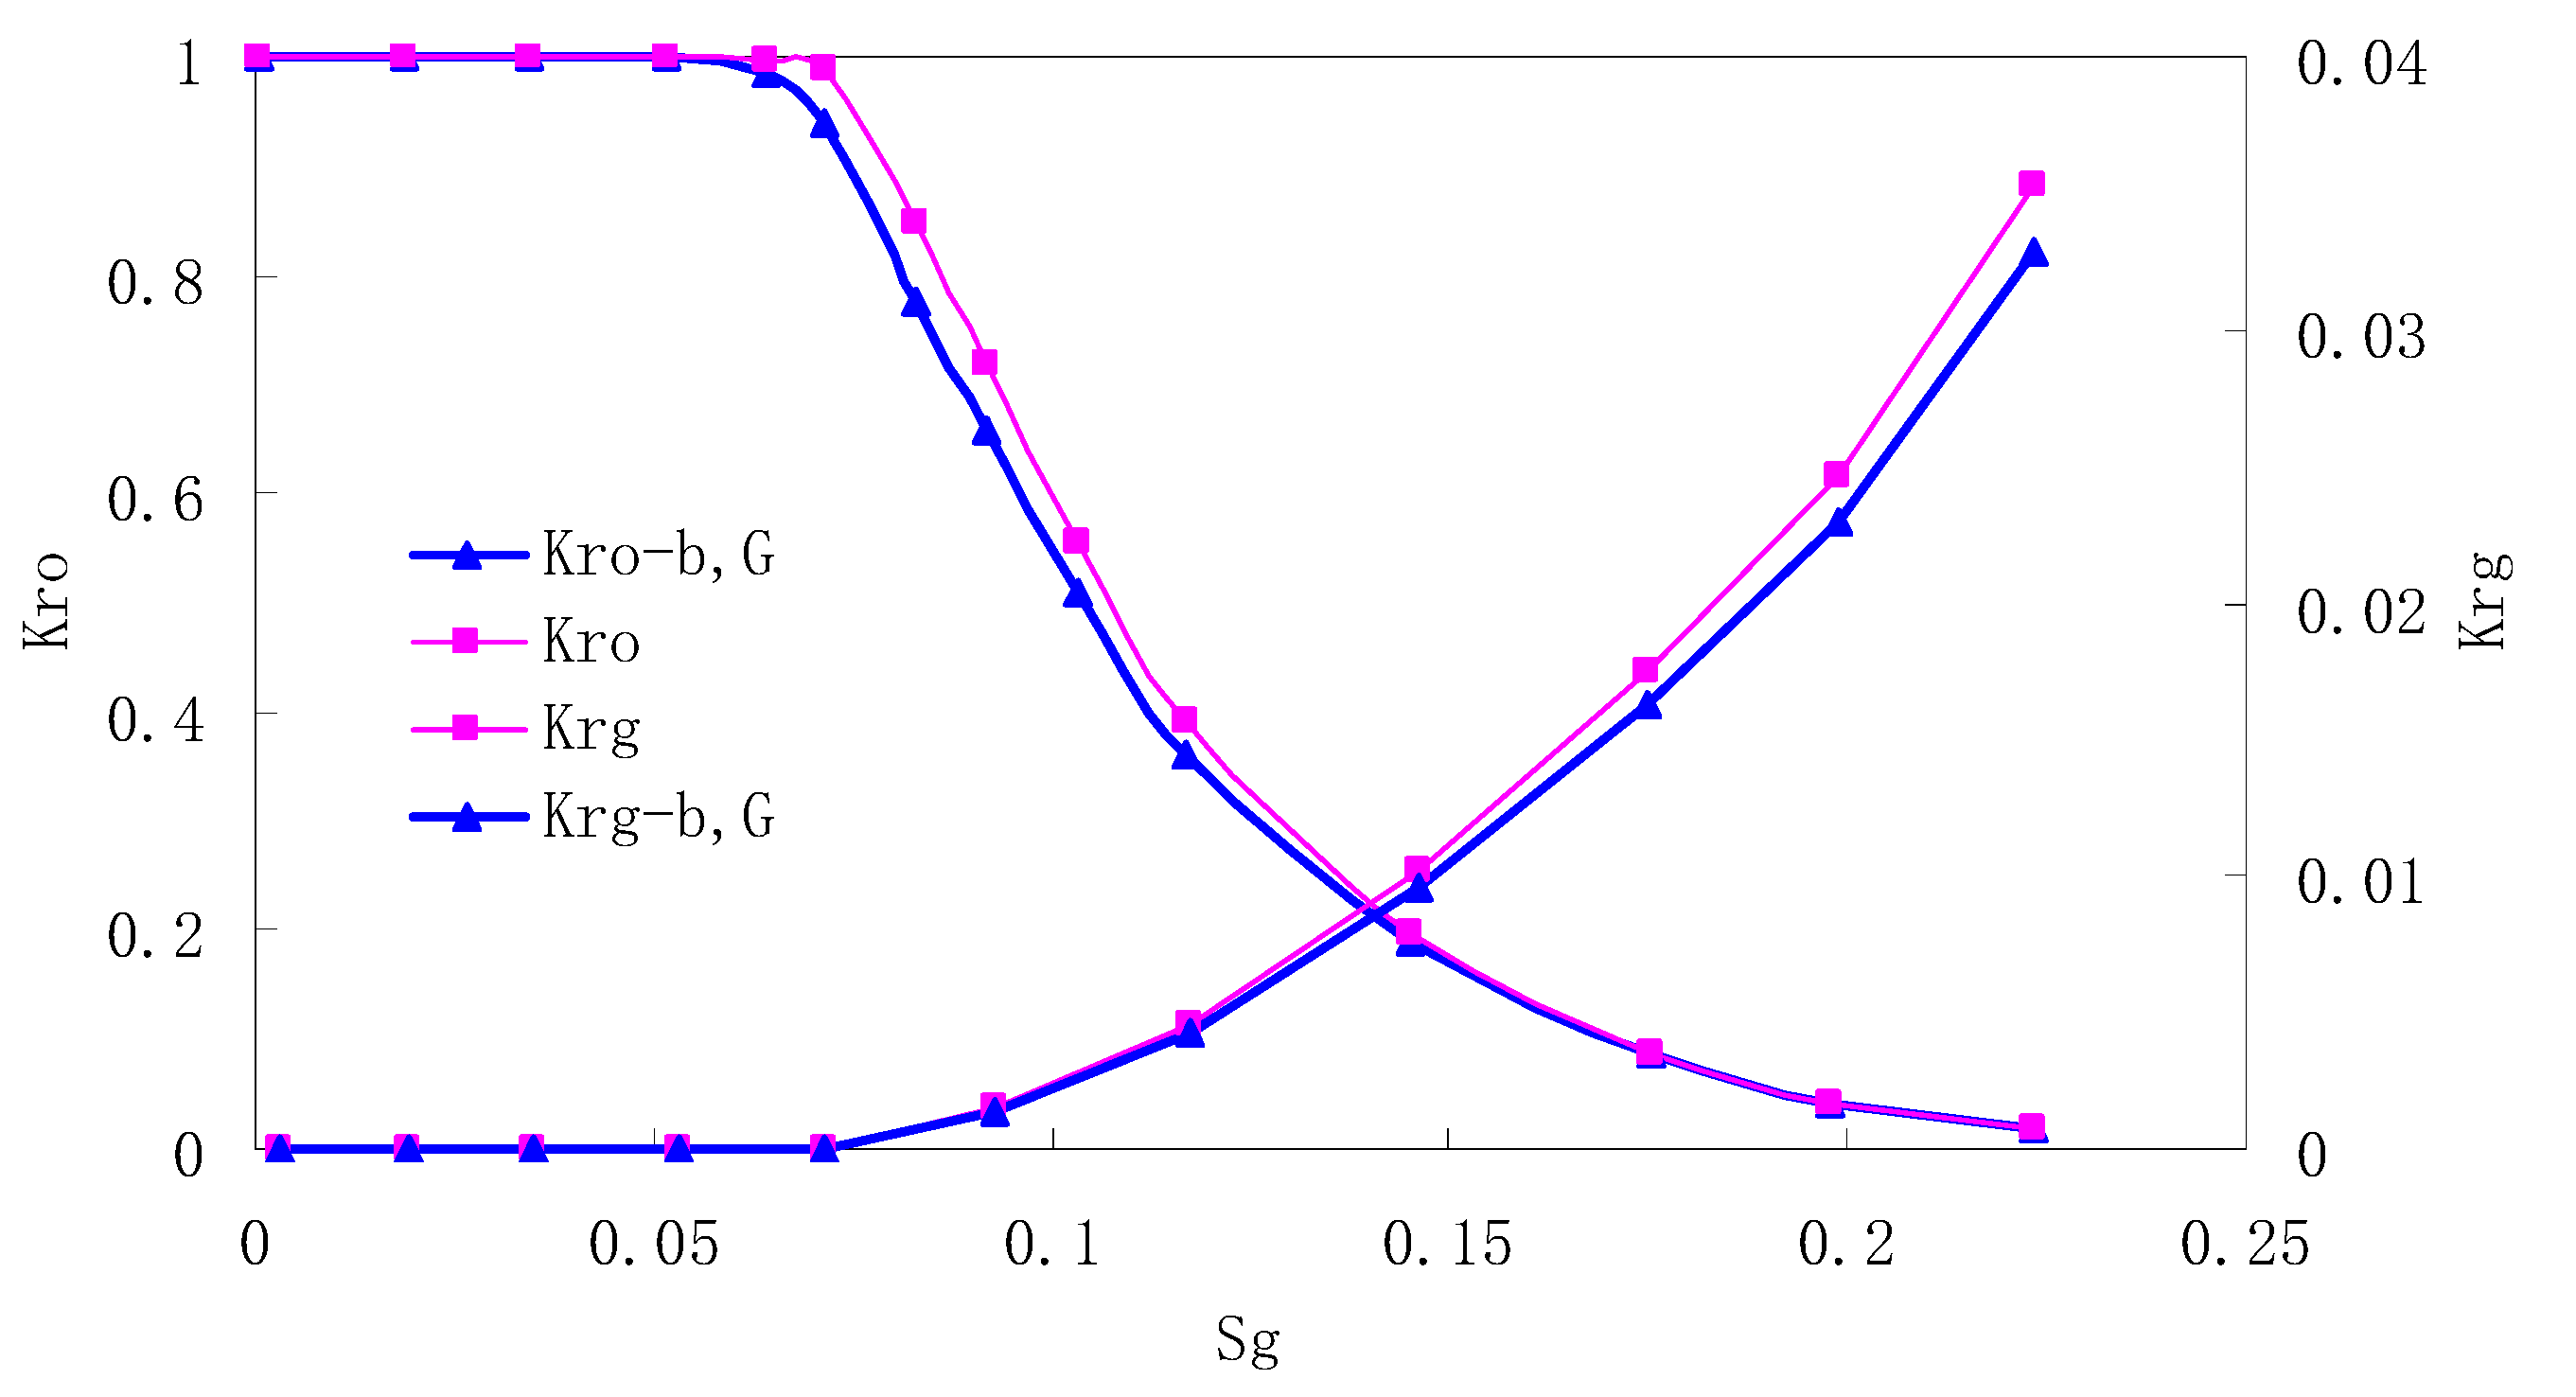
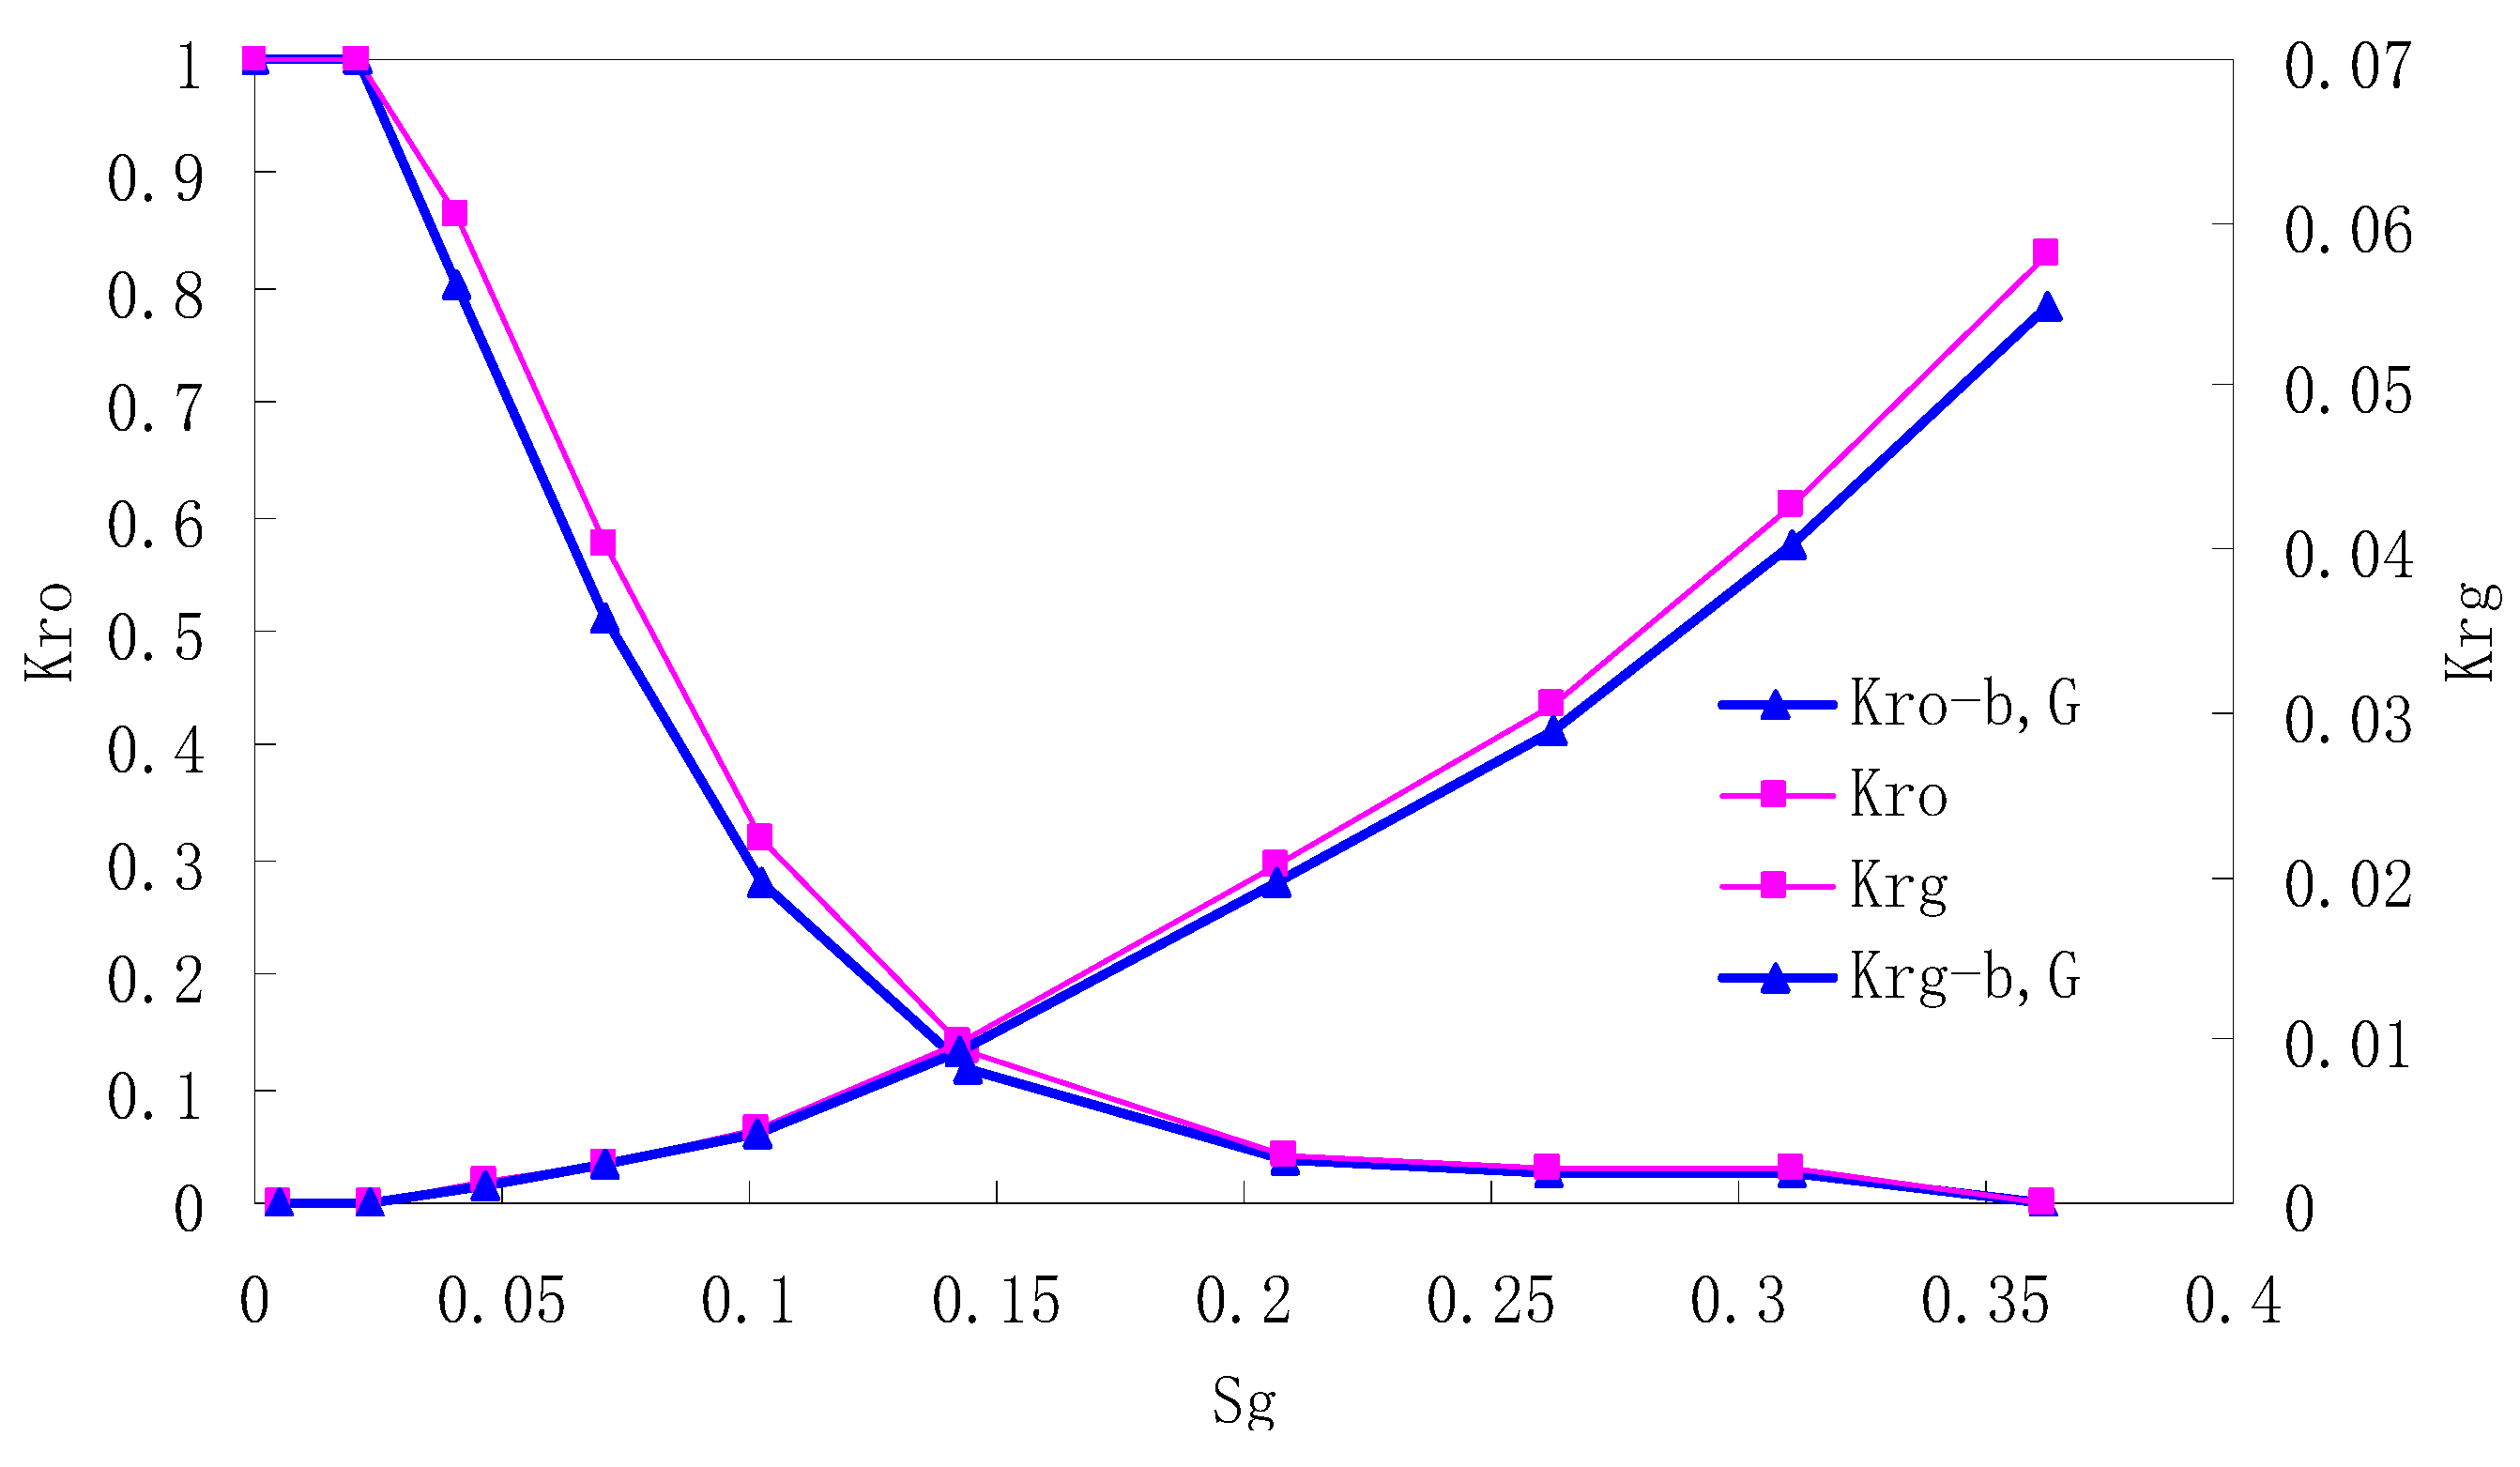
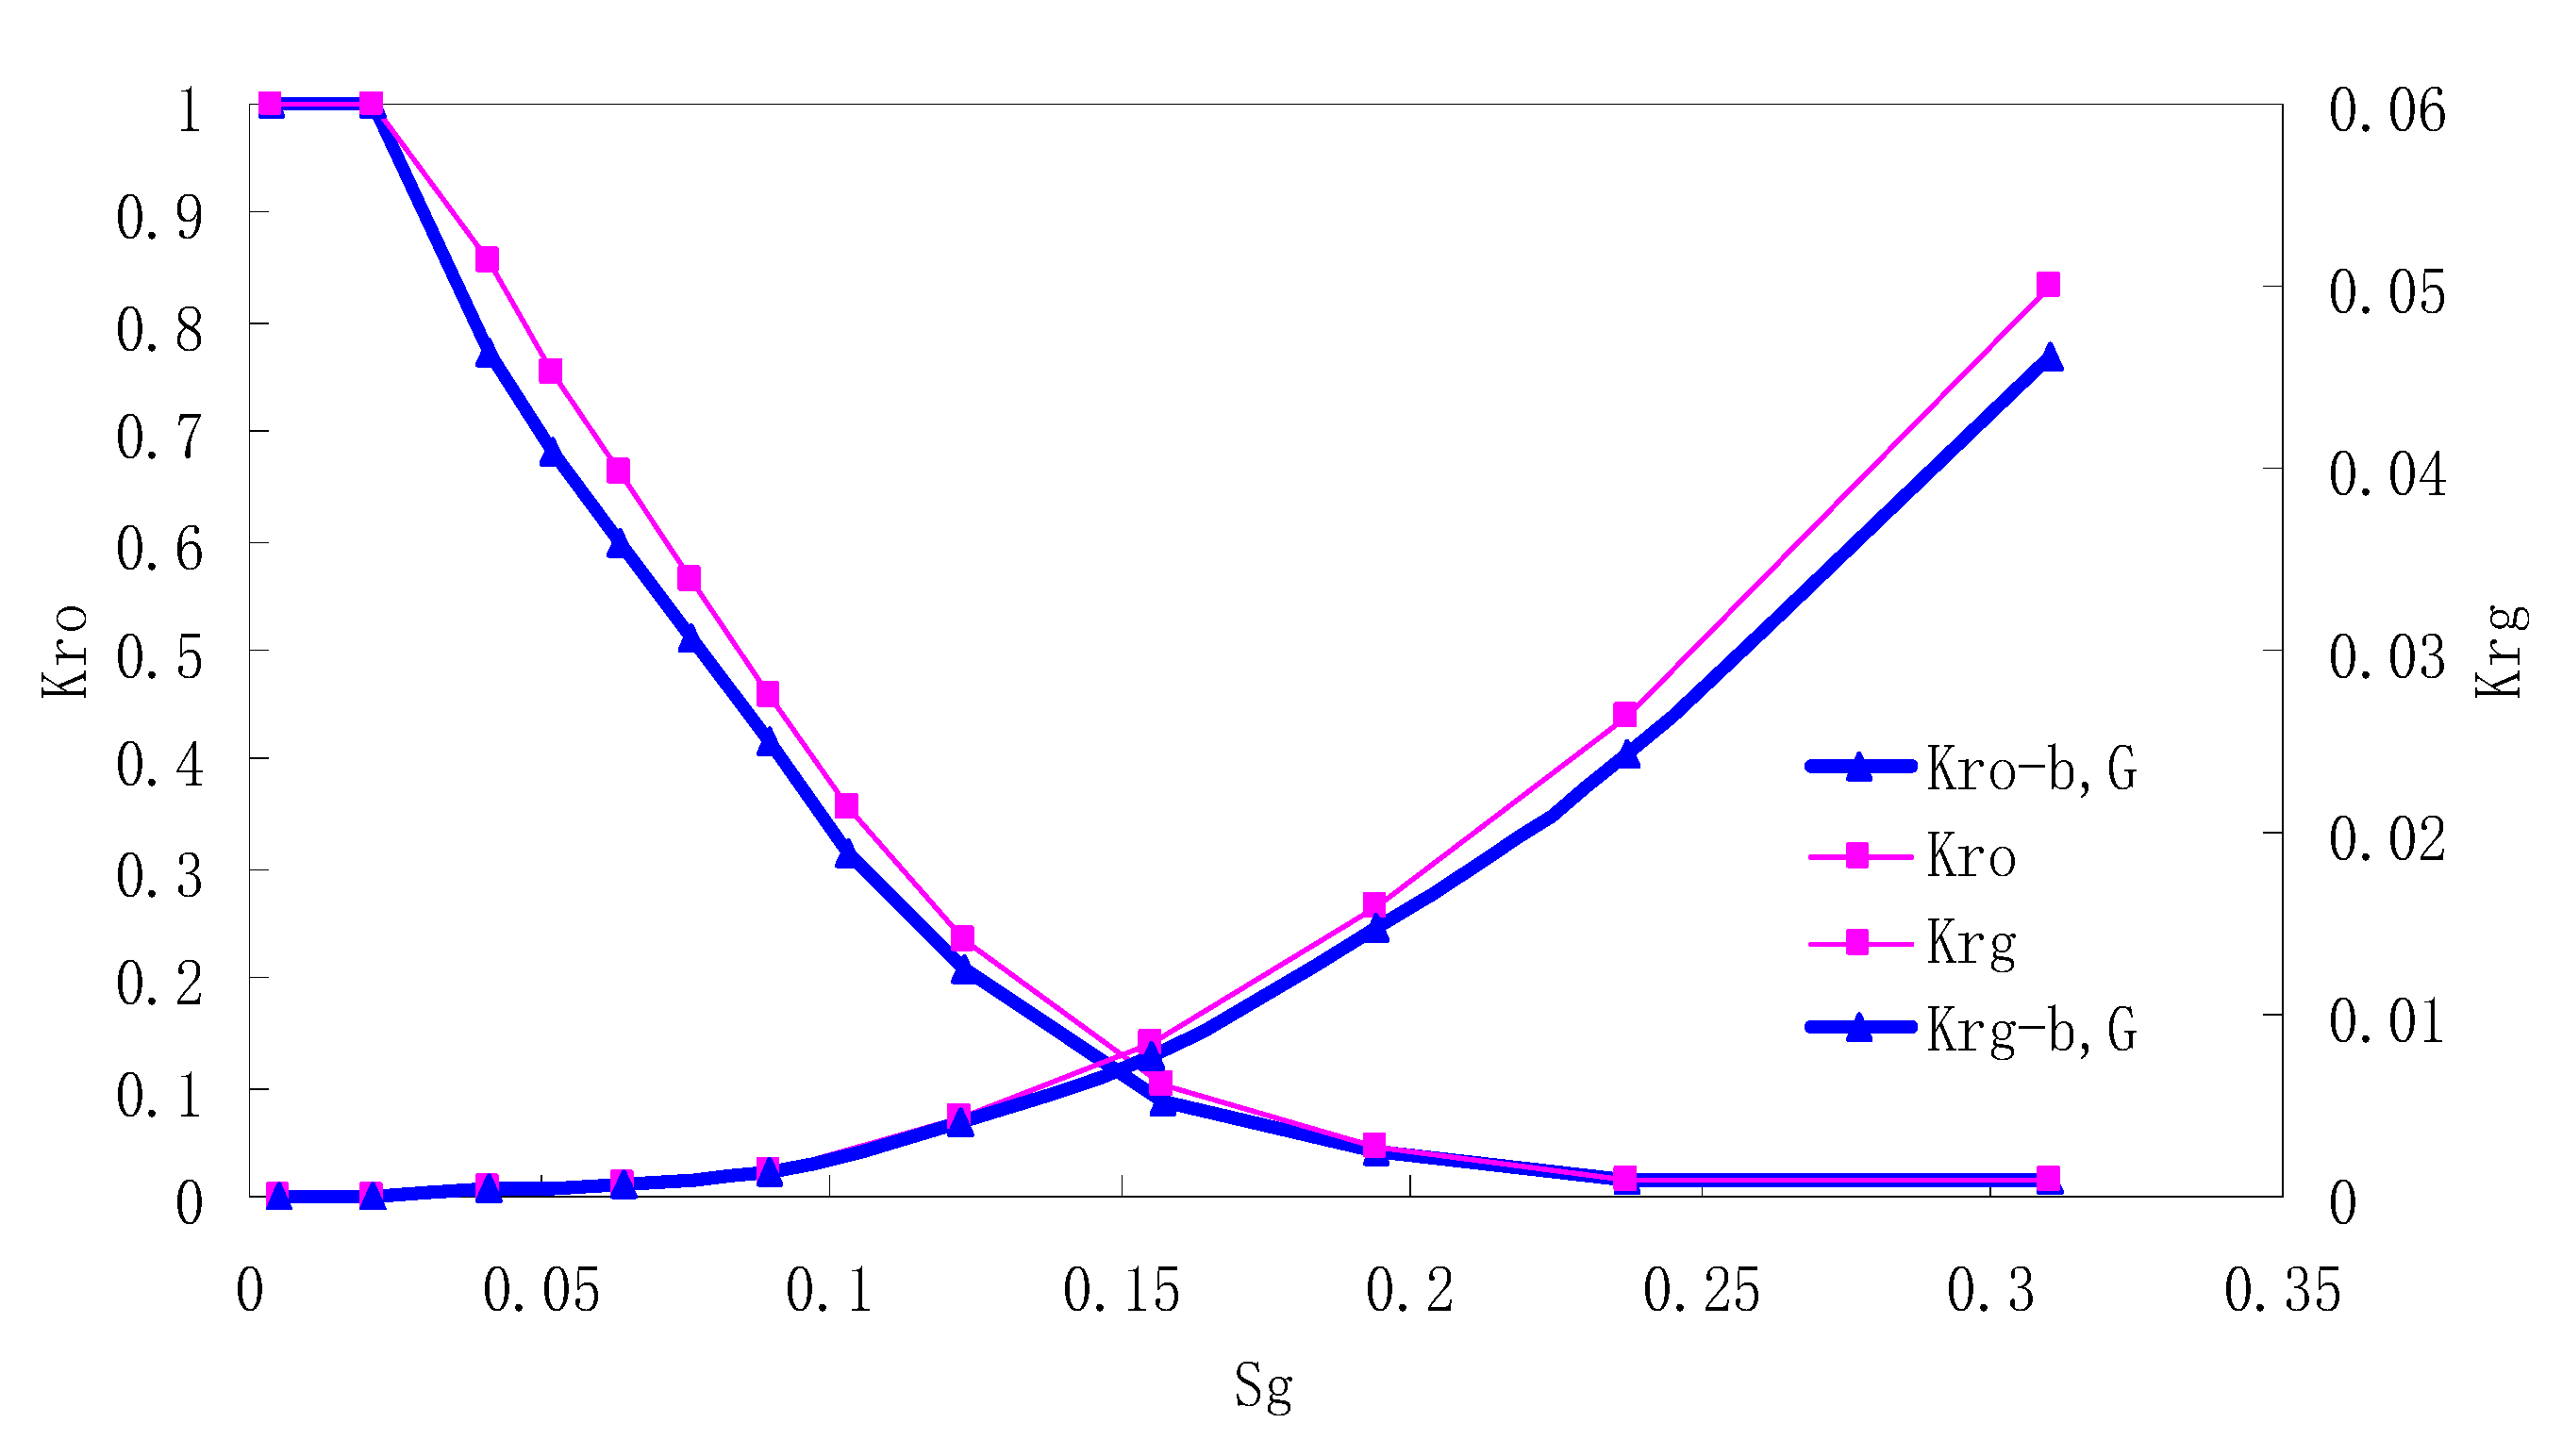
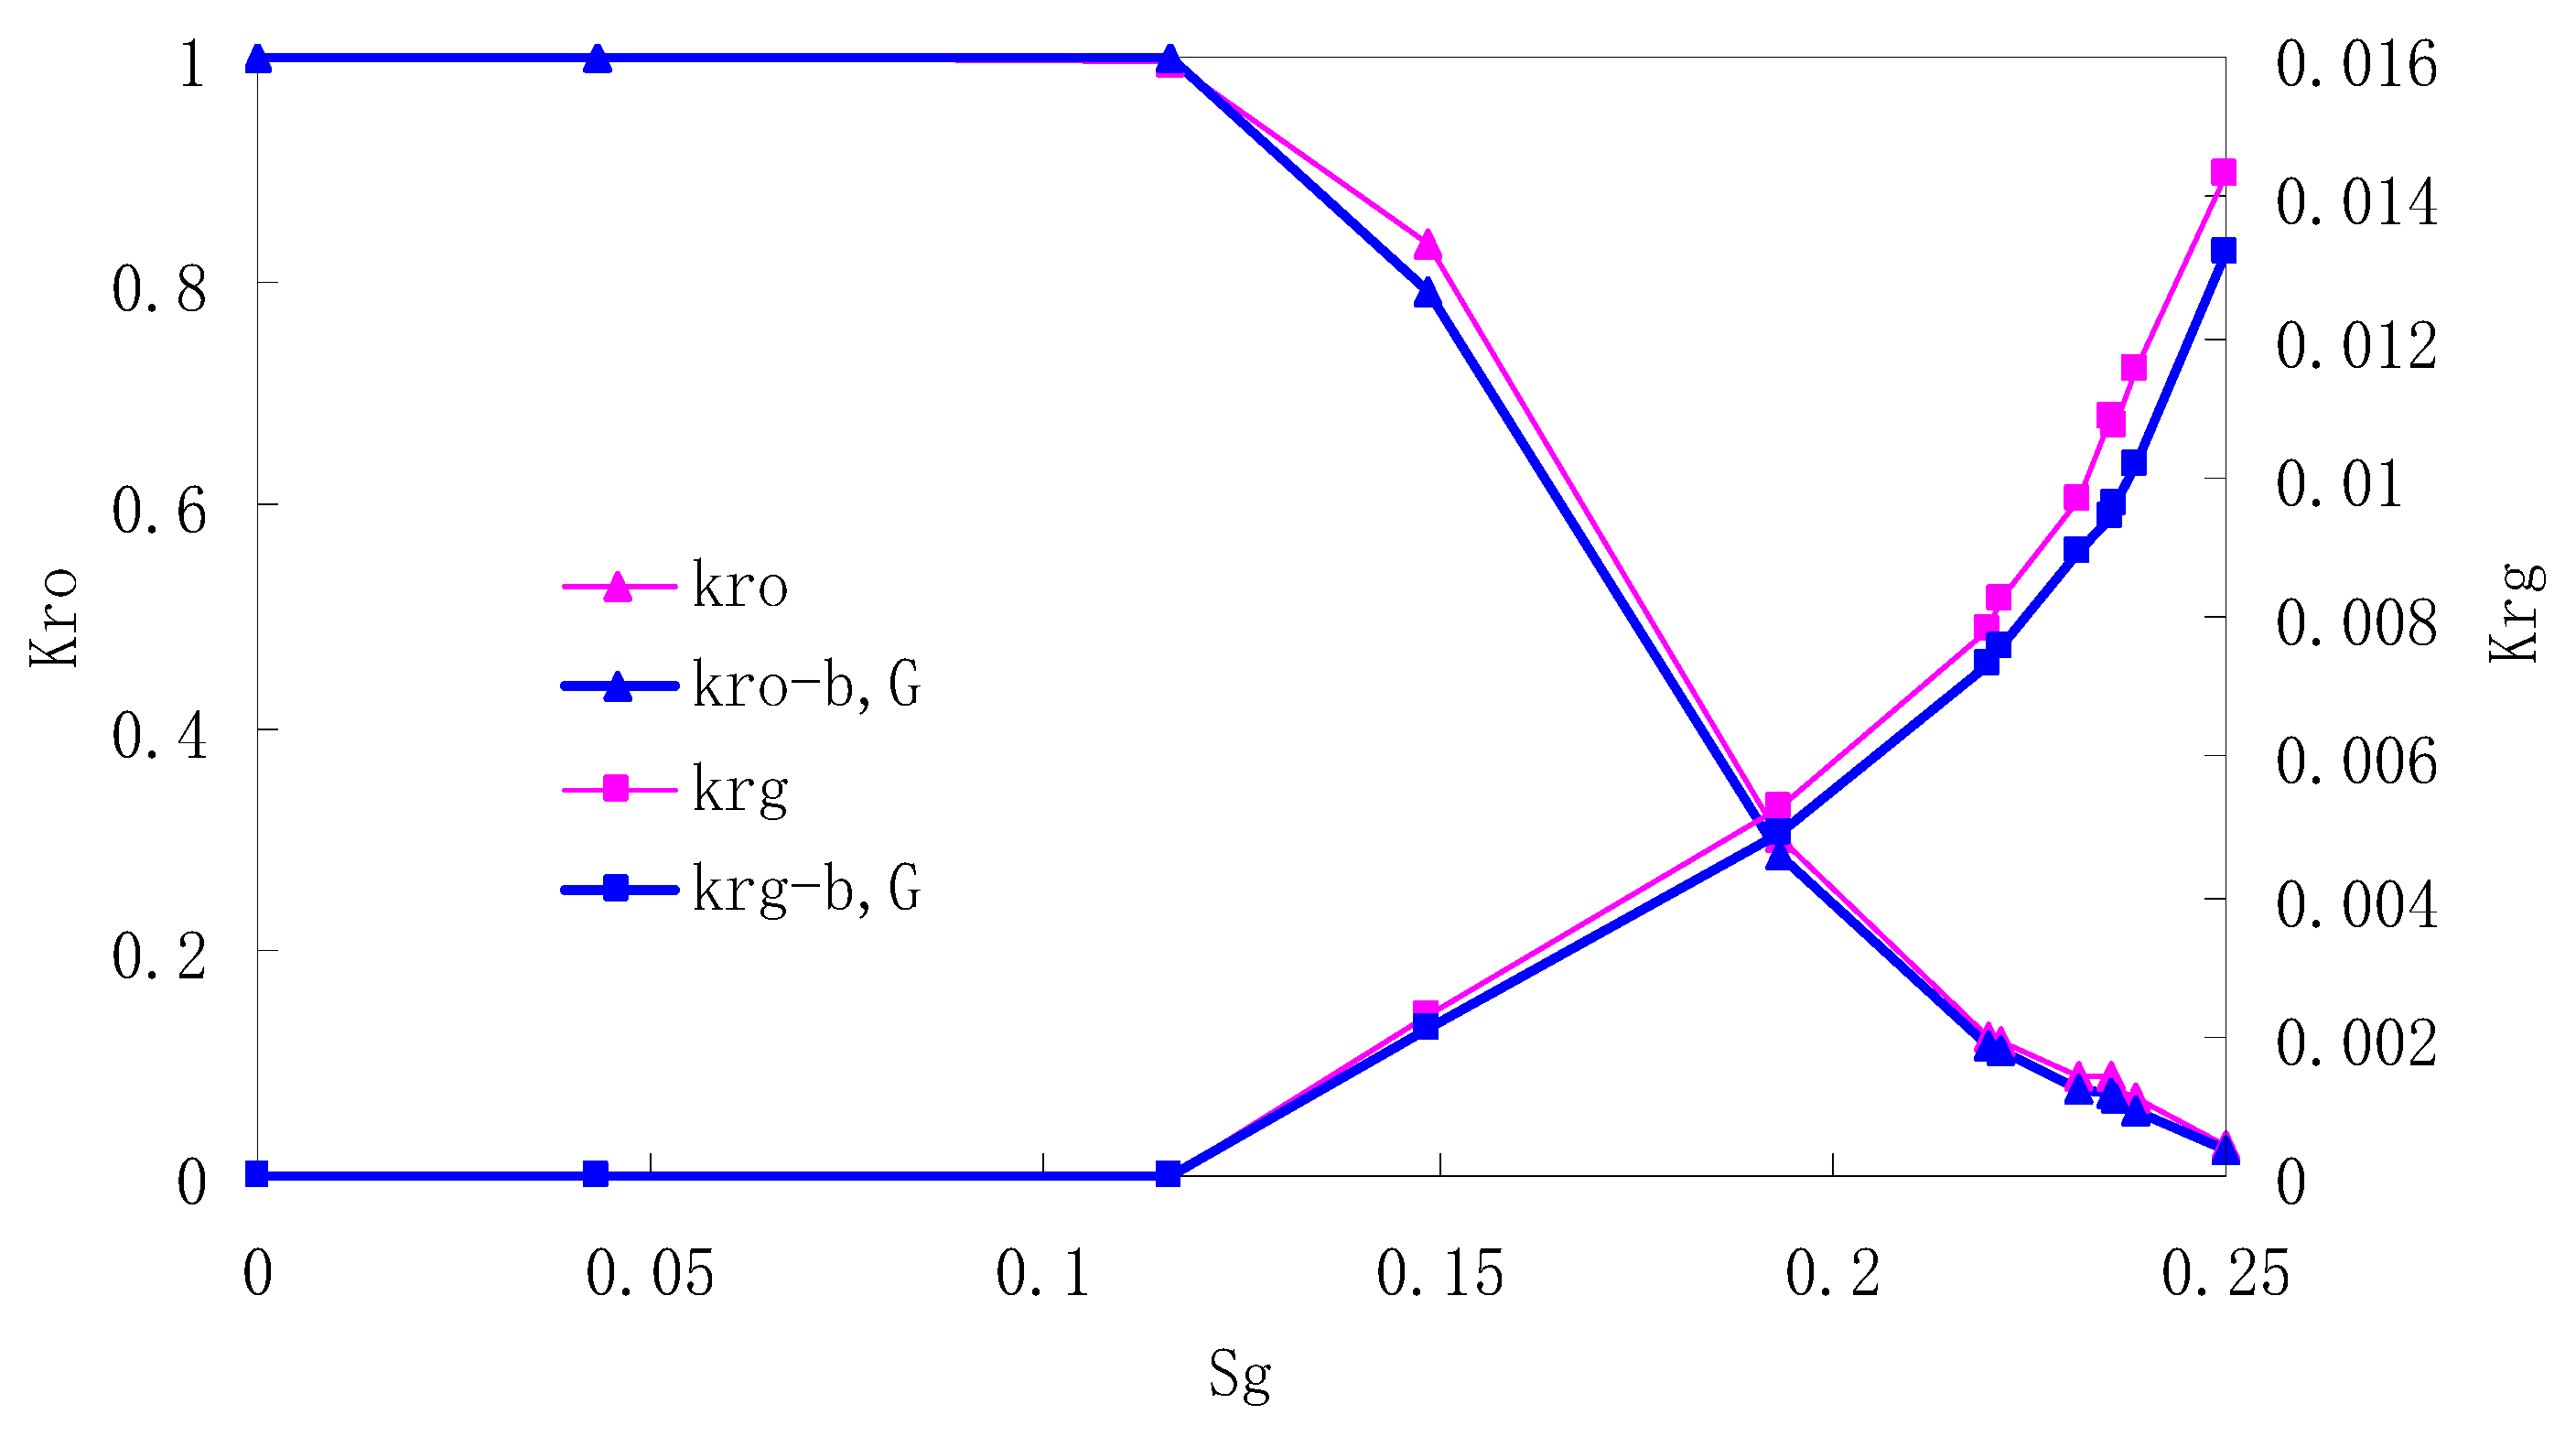
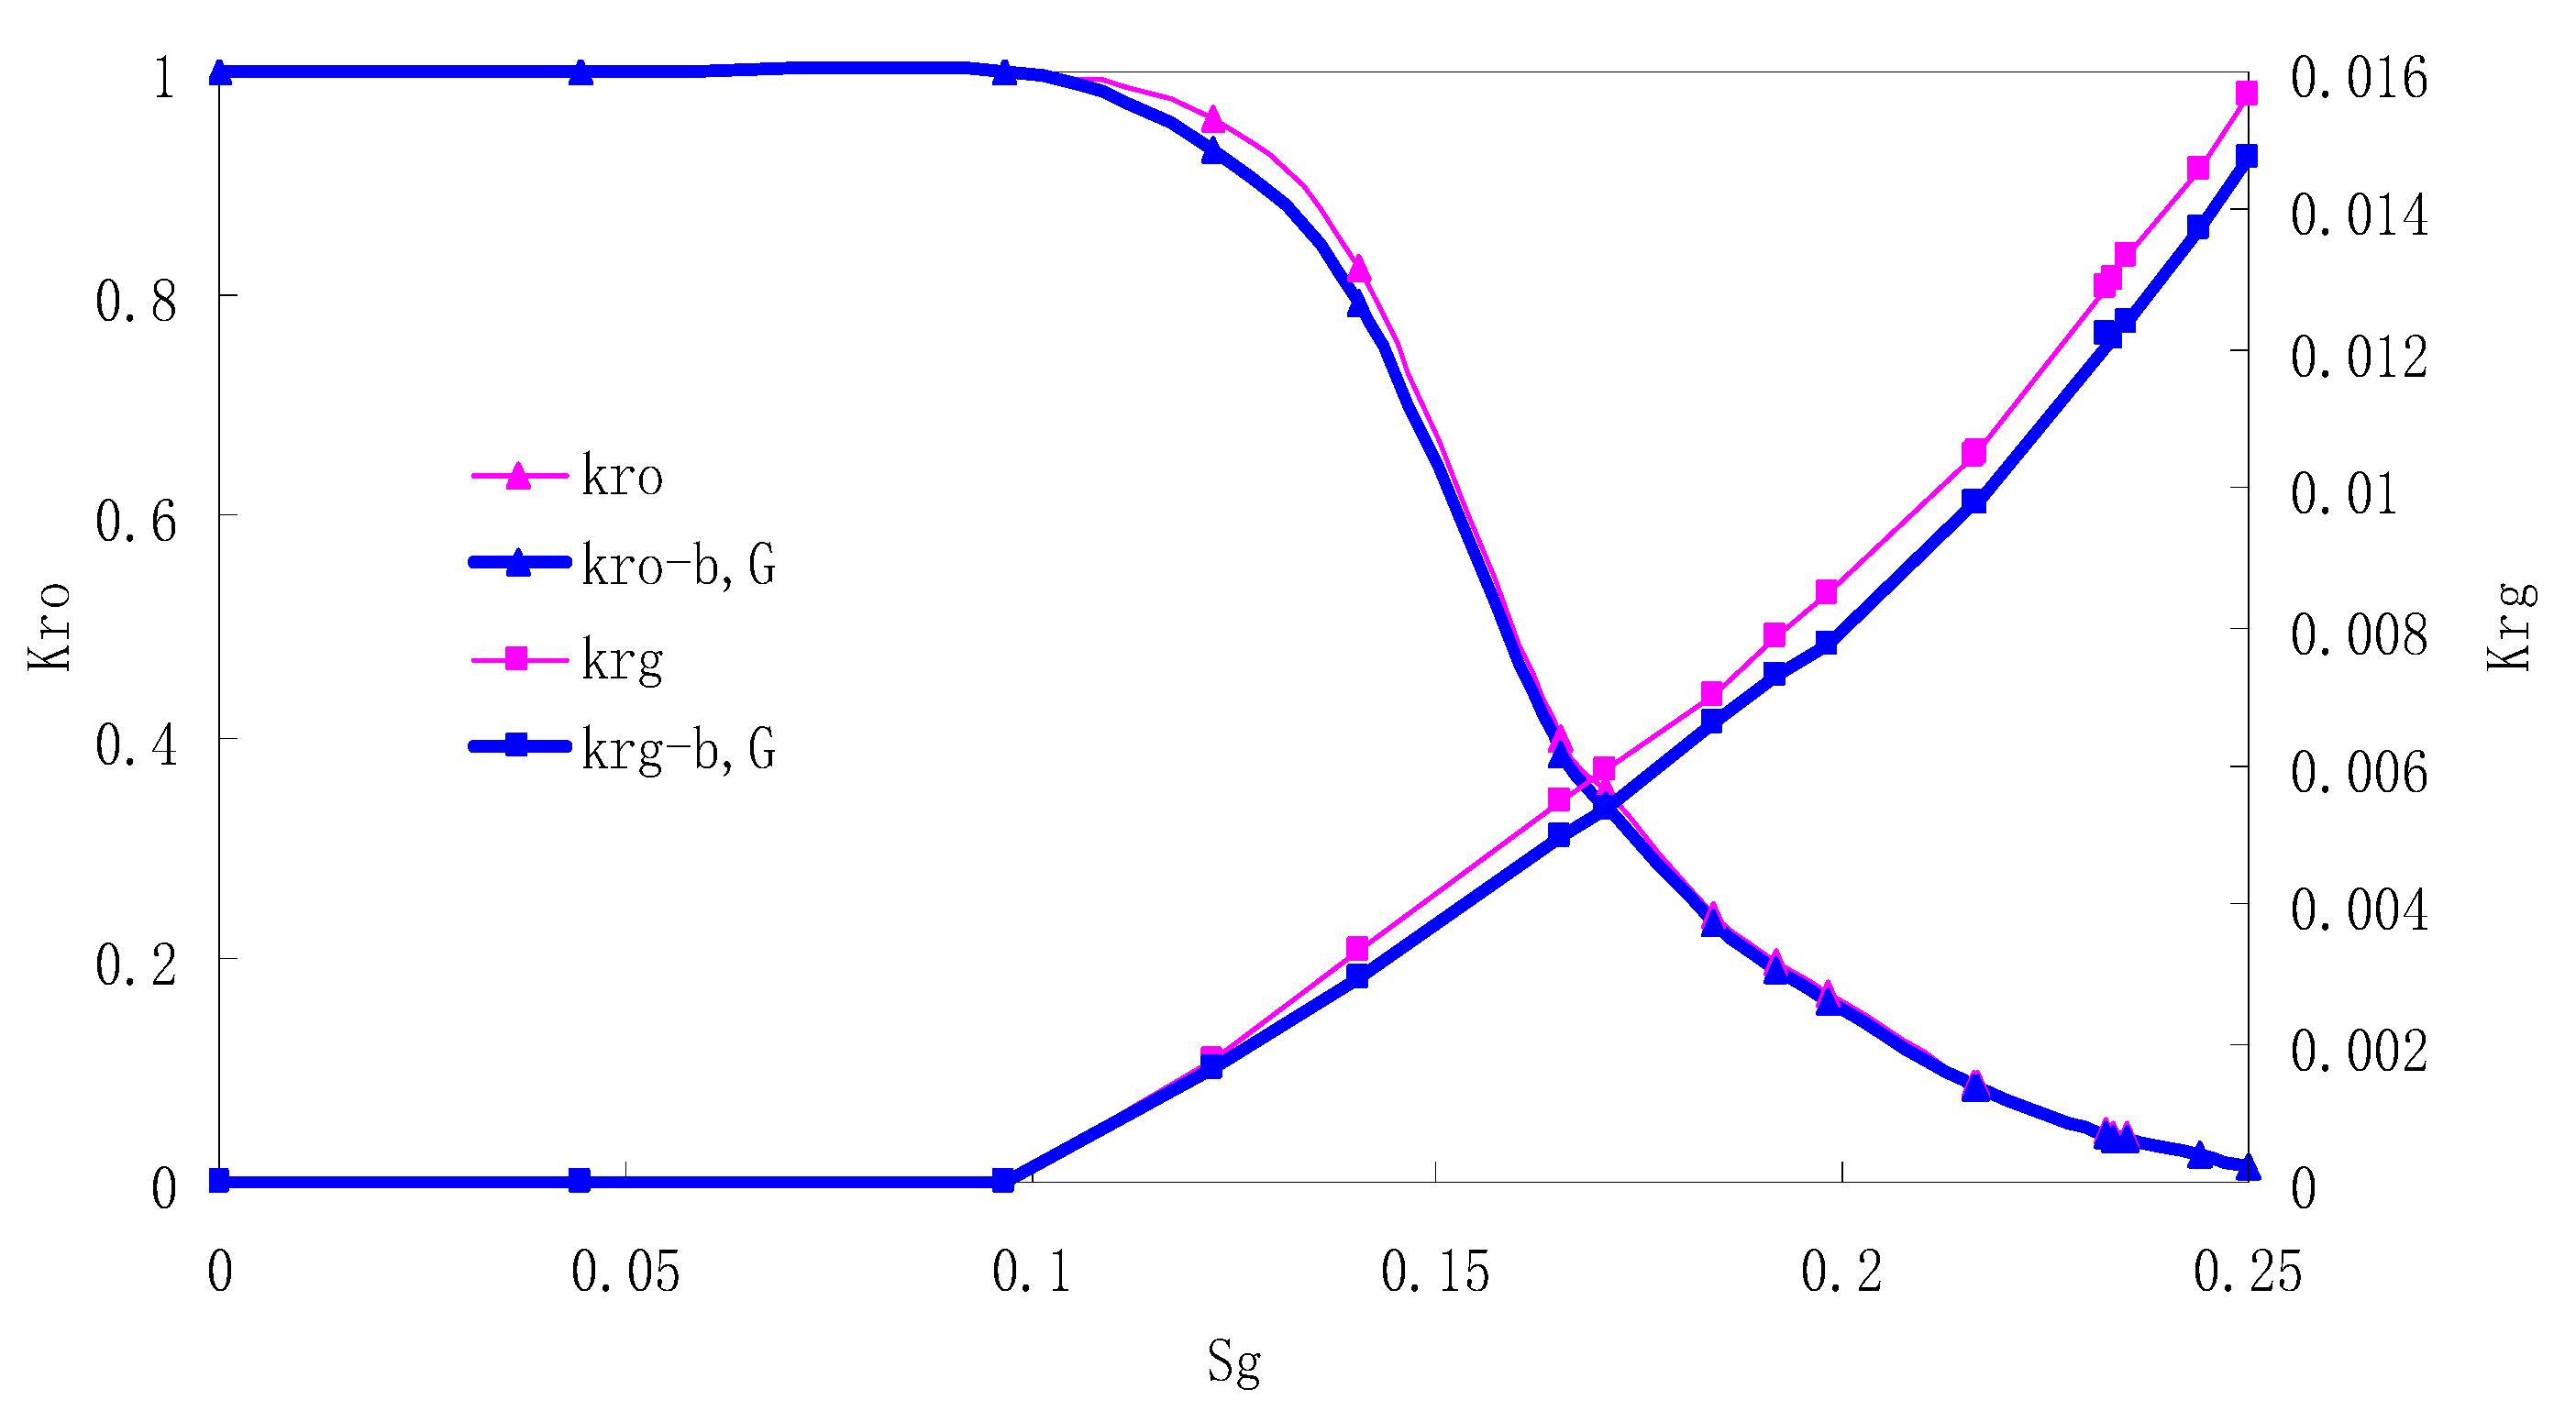
After this, a proper displacement pressure is applied to displace the oil by CO2 to ensure that the flooding velocity is between 7–30 mL/min and the pressure is smaller than MMP. The relative permeability curves are obtained by performing calculations for CO2/oil immiscible displacement. The results are shown in Figure 2, Figure 3, Figure 4 and Figure 5 for natural cores and Figure 6, Figure 7, Figure 8 and Figure 9 for artificial cores, respectively. In the figures, Kro-b,G and Krg-b,G represent the relative permeability considering gas slippage and threshold pressure, while Kro and Krg represent relative permeability without considering them.
It can be observed from the Figures that both Kro and Krg are greater than Kro-b, G and Krg-b, G, indicating that the relative permeability of both phases reduces when considering threshold pressure and gas slippage. But the relative permeability of oil does not reduce as much as that of CO2. When considering gas slippage, only the relative permeability of CO2 is modified, which has no influence on oil relative permeability. The decrease of the relative permeability of oil is because the energy exerted to displace oil is lowered when considering the threshold pressure in low permeable rocks, given that the total differential pressure is constant. When both the gas slippage and threshold pressure are considered, the relative permeability of CO2 decreases a little more than that to oil.
The situation of artificial cores is similar to that of natural cores. A typical feature is that the CO2 critical flow saturation of artificial cores is larger than that of natural cores as a whole. There are two reasons. Firstly, the natural rock sample is characterized by a wider distribution of pore size, complex pore structure and relatively strong heterogeneity, while the artificial cores have a uniform pore structure. Secondly, the porosity and size of artificial cubic cores are larger than that of natural cores, and the saturated oil quantity in it is relatively more, so the amount of the dissolved gas of CO2 in immiscible flooding is relatively greater.
The experimental data of natural and artificial cores are listed in Table 5 and Table 6. It can be observed from the table that no matter for natural core or artificial core, with decreasing permeability, the irreducible water saturation increases. Given that the injection pressure is the same (natural core), when the permeability decreases, the residual oil saturation will increase, and the range of the two-phase region will be narrower consequently.
The relative permeability of gas at the endpoint under immiscible flooding is relatively low due to the fact that irreducible water and residual oil in rock sample account for 61.81%–87.65% of pore space at the end of the experiment, thus the flowing space of gas is relatively small, which means the relative permeability value at the gas endpoint is relatively low.

5.2. CO2/Water Relative Permeability Curve Under Immiscible Phase

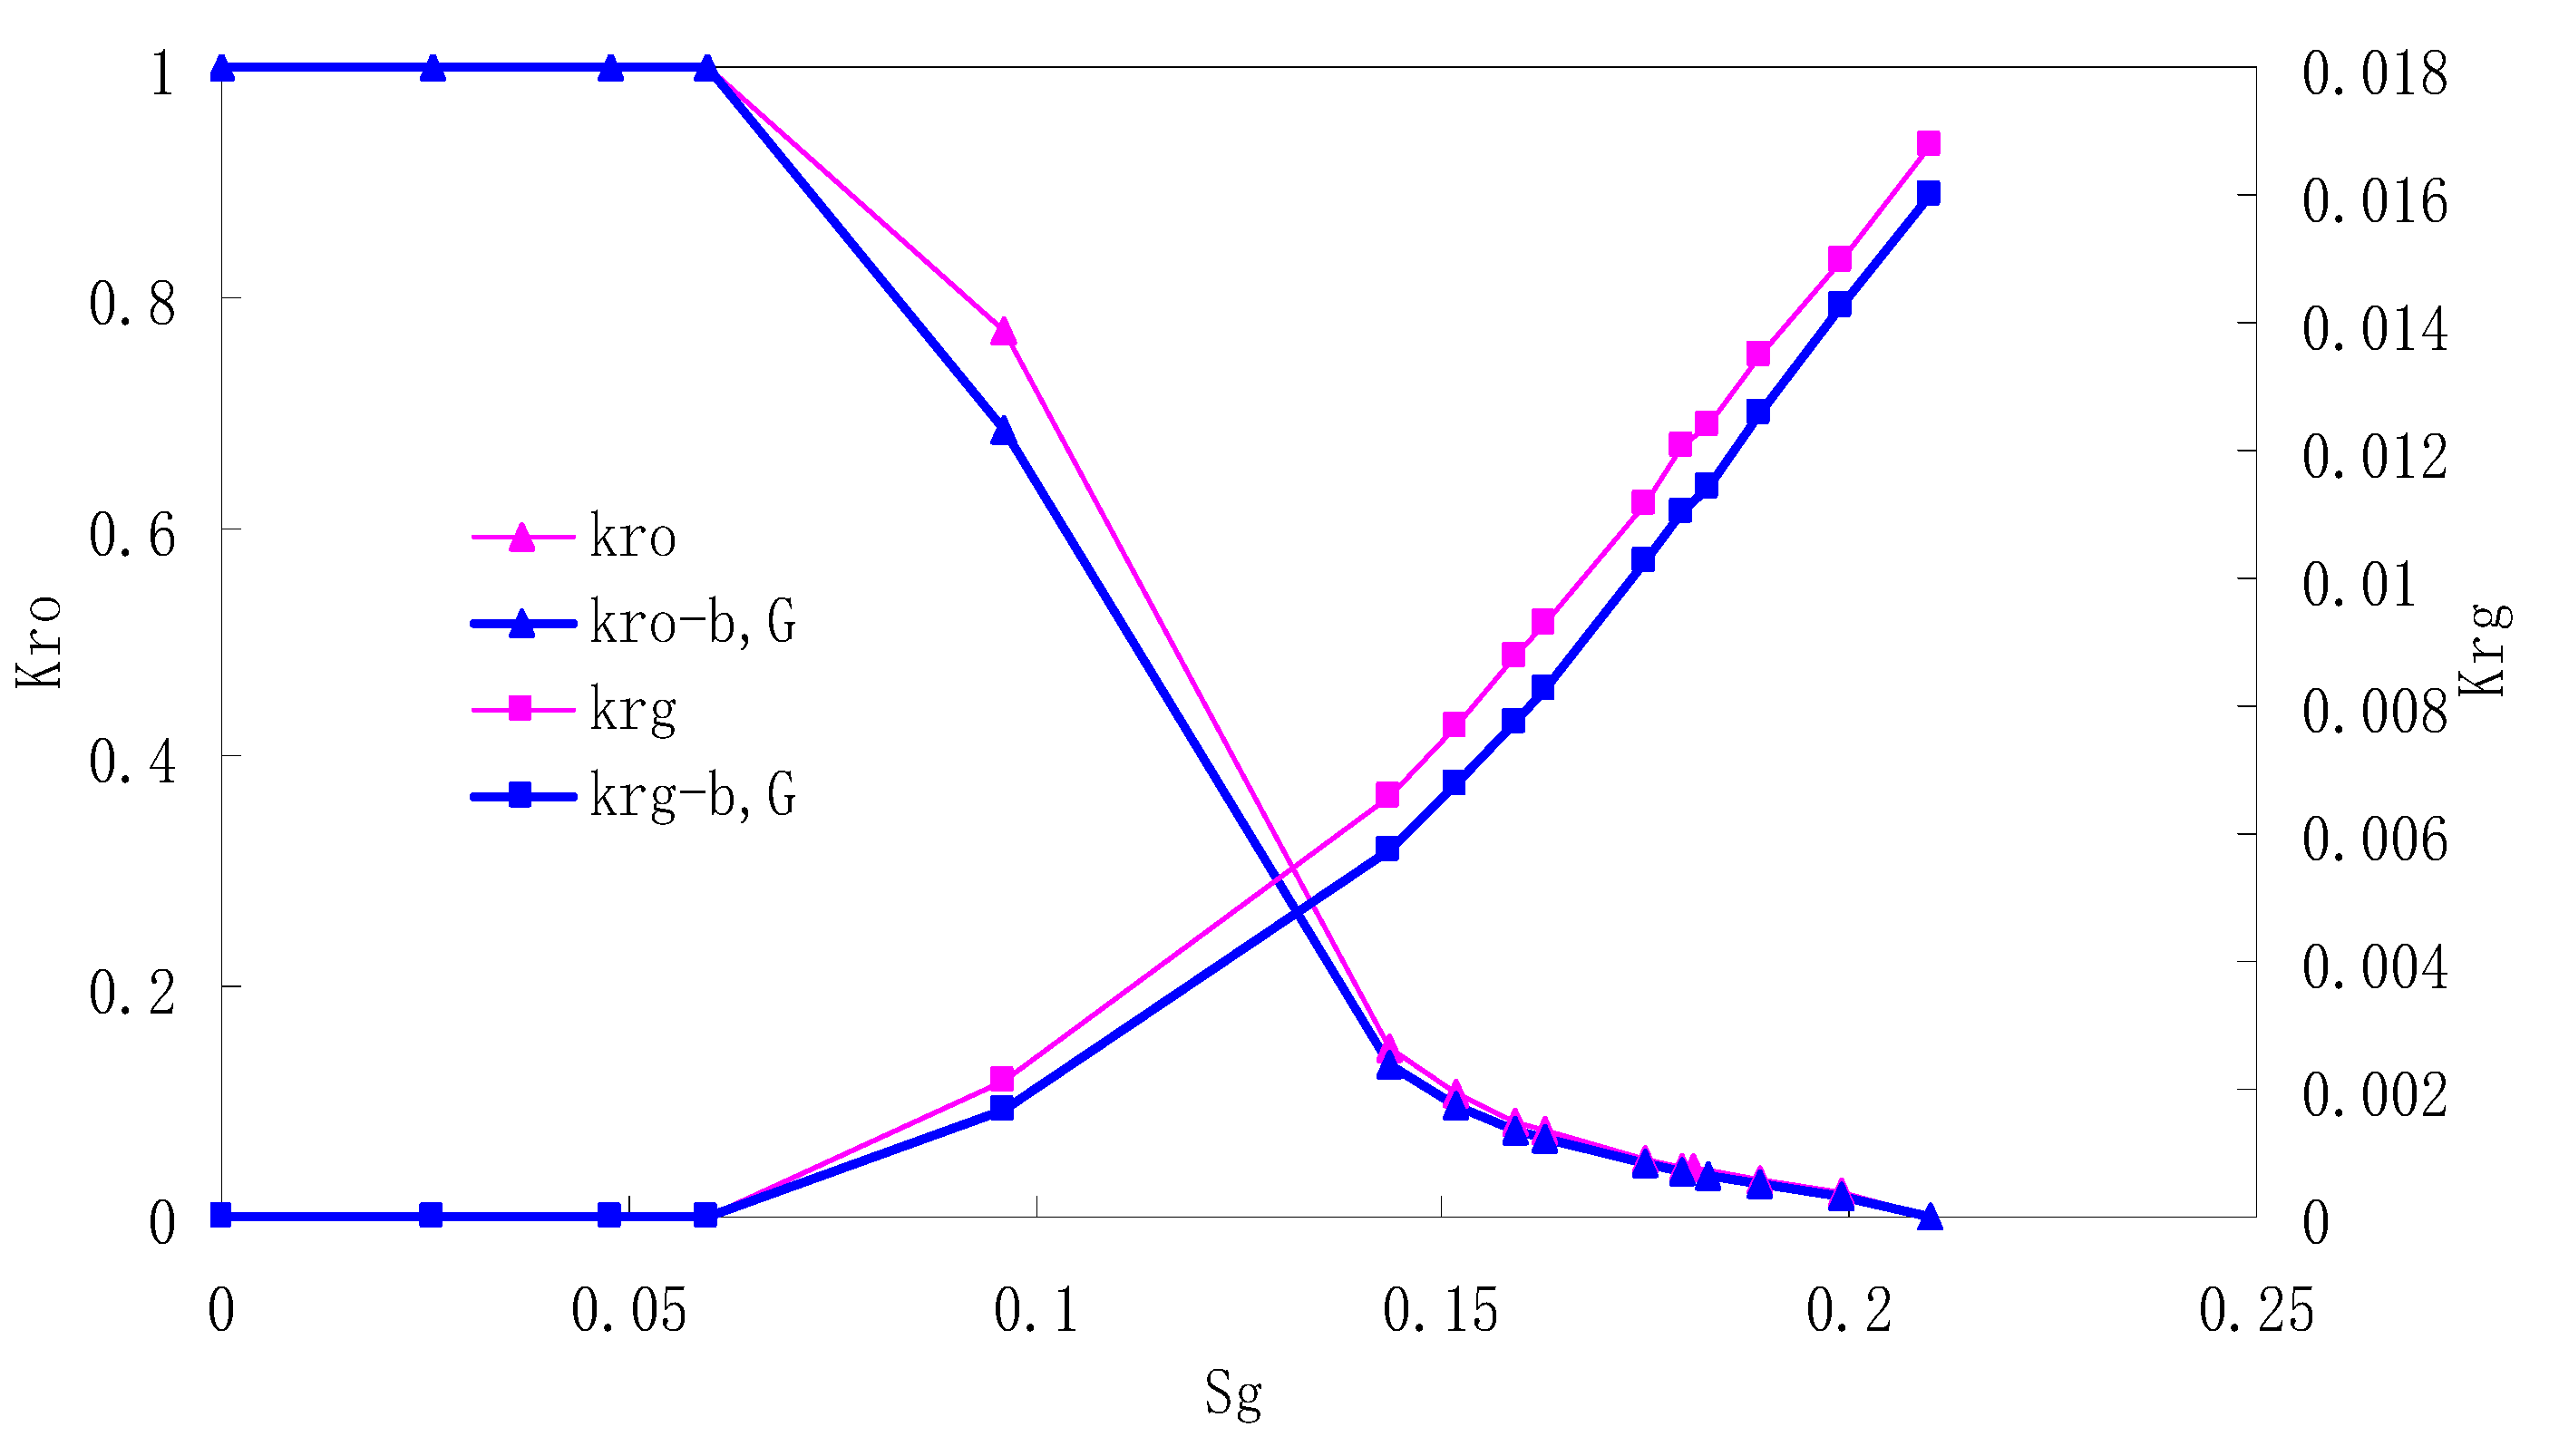
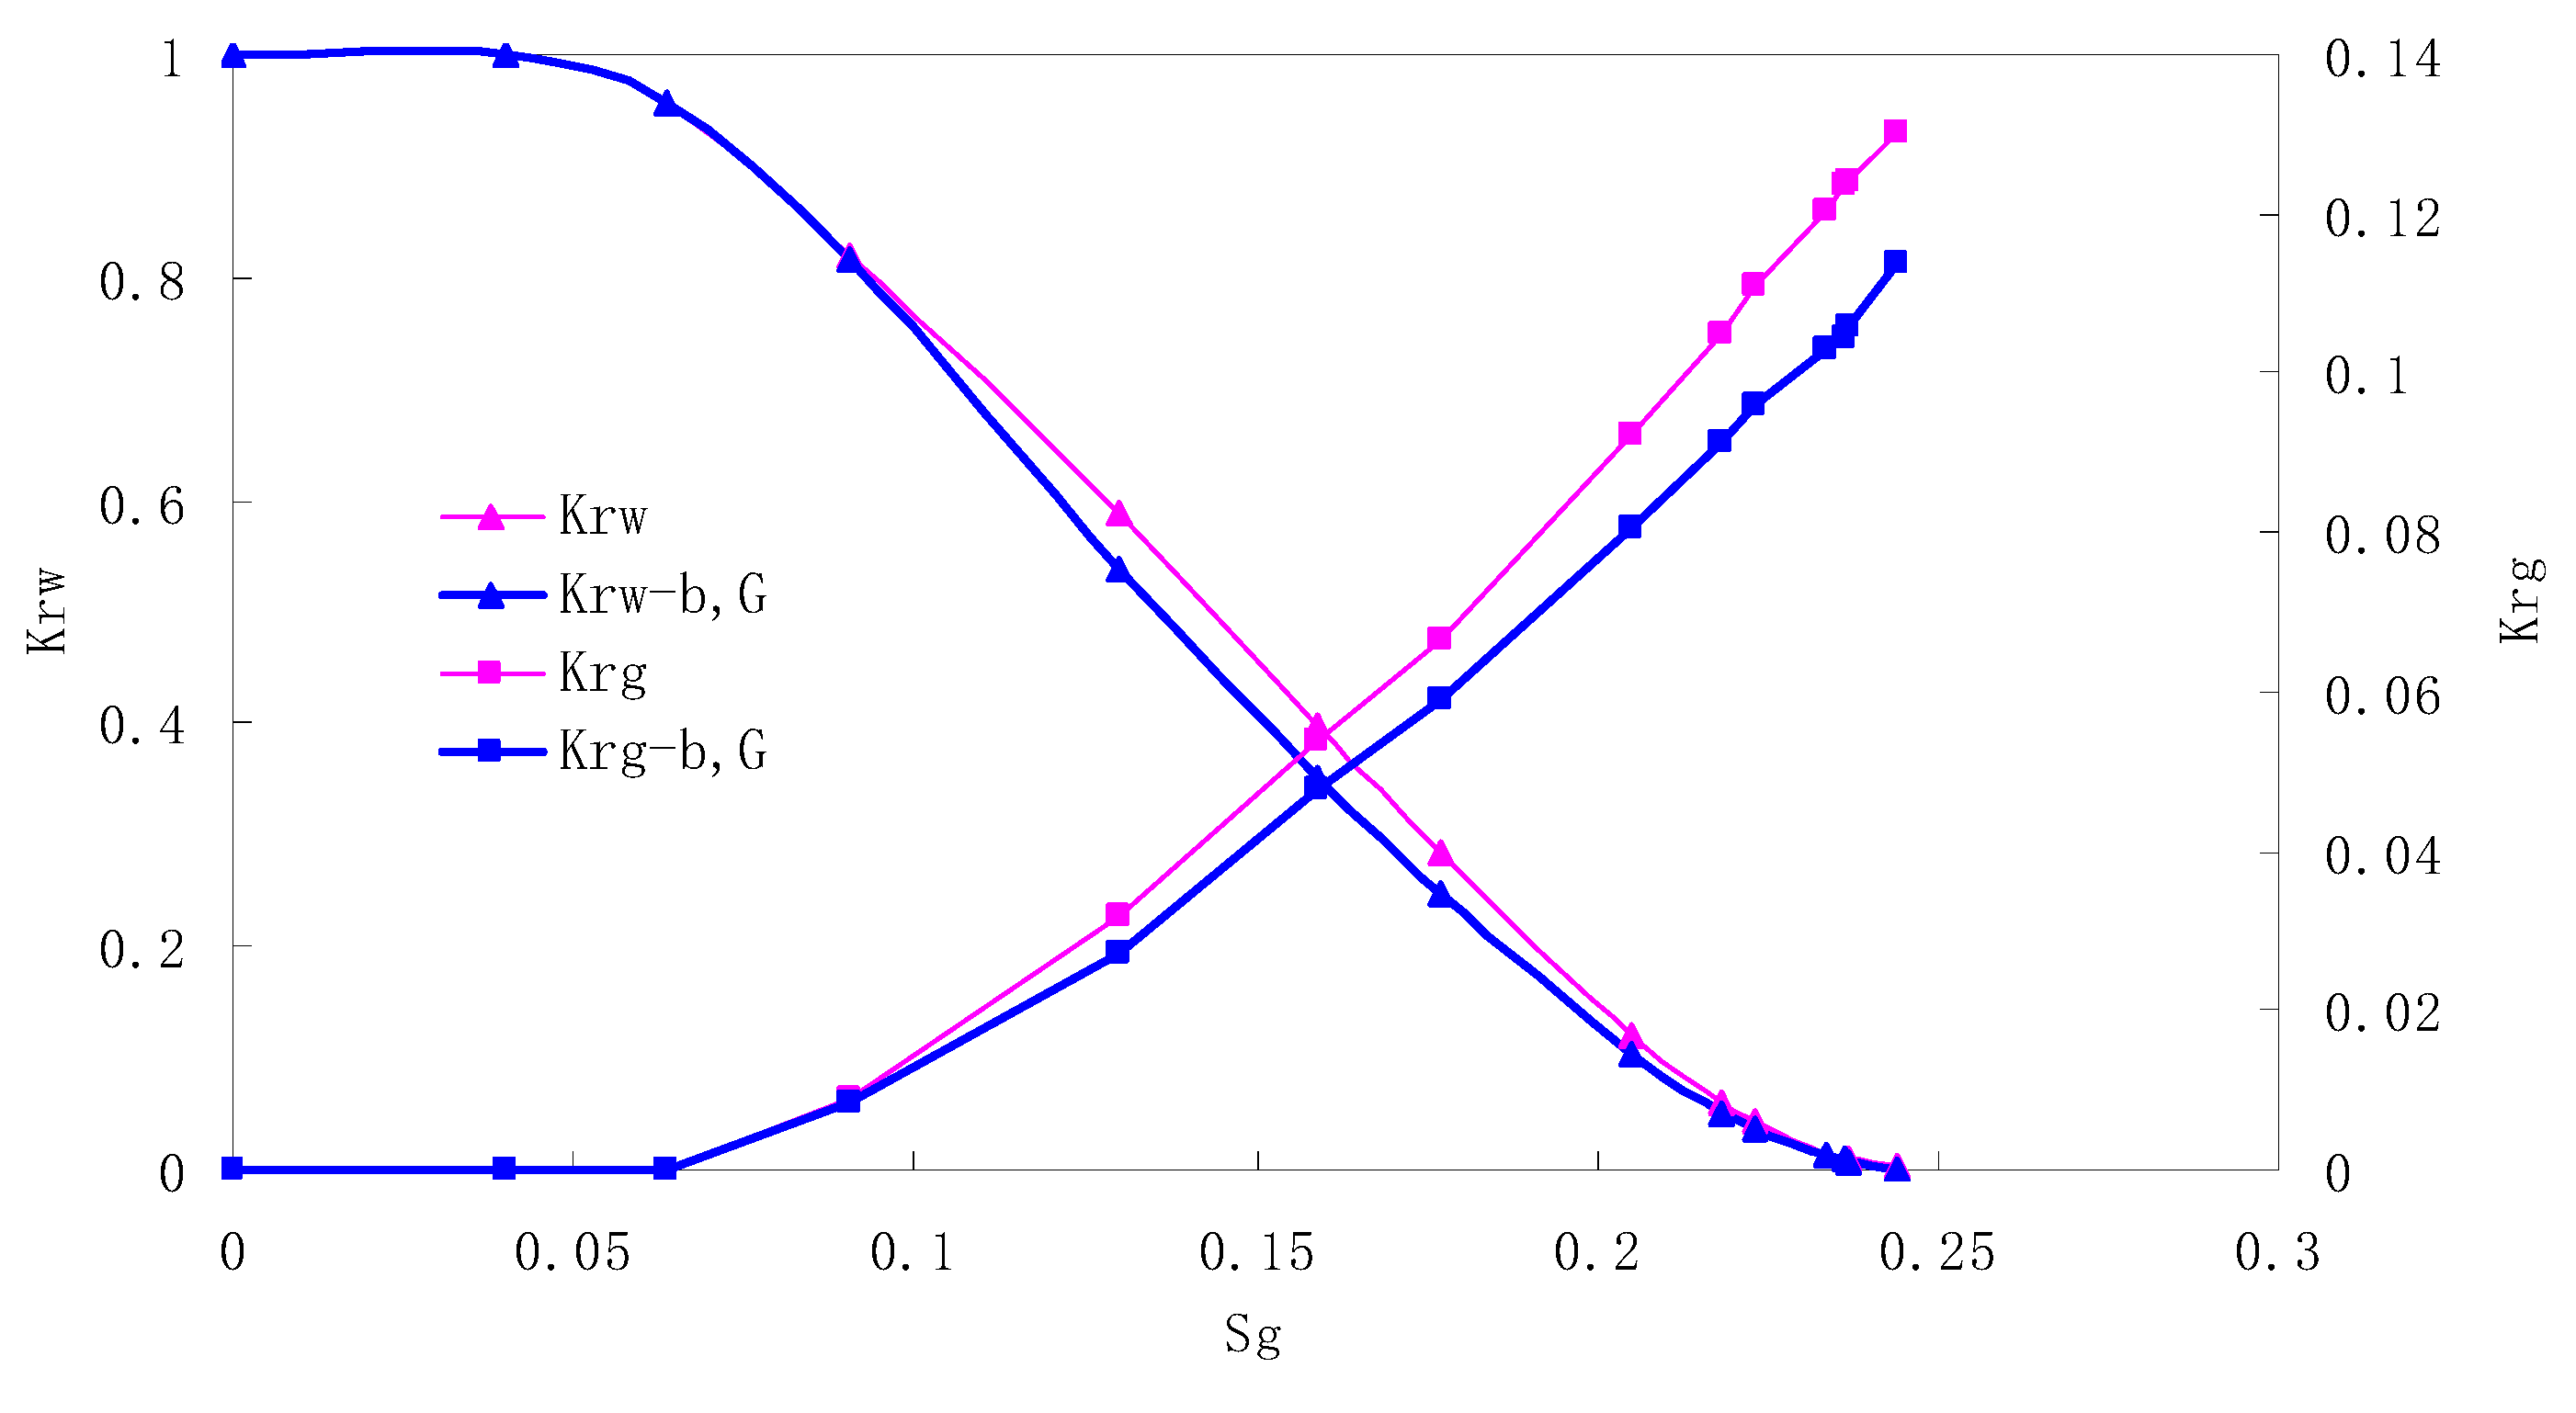
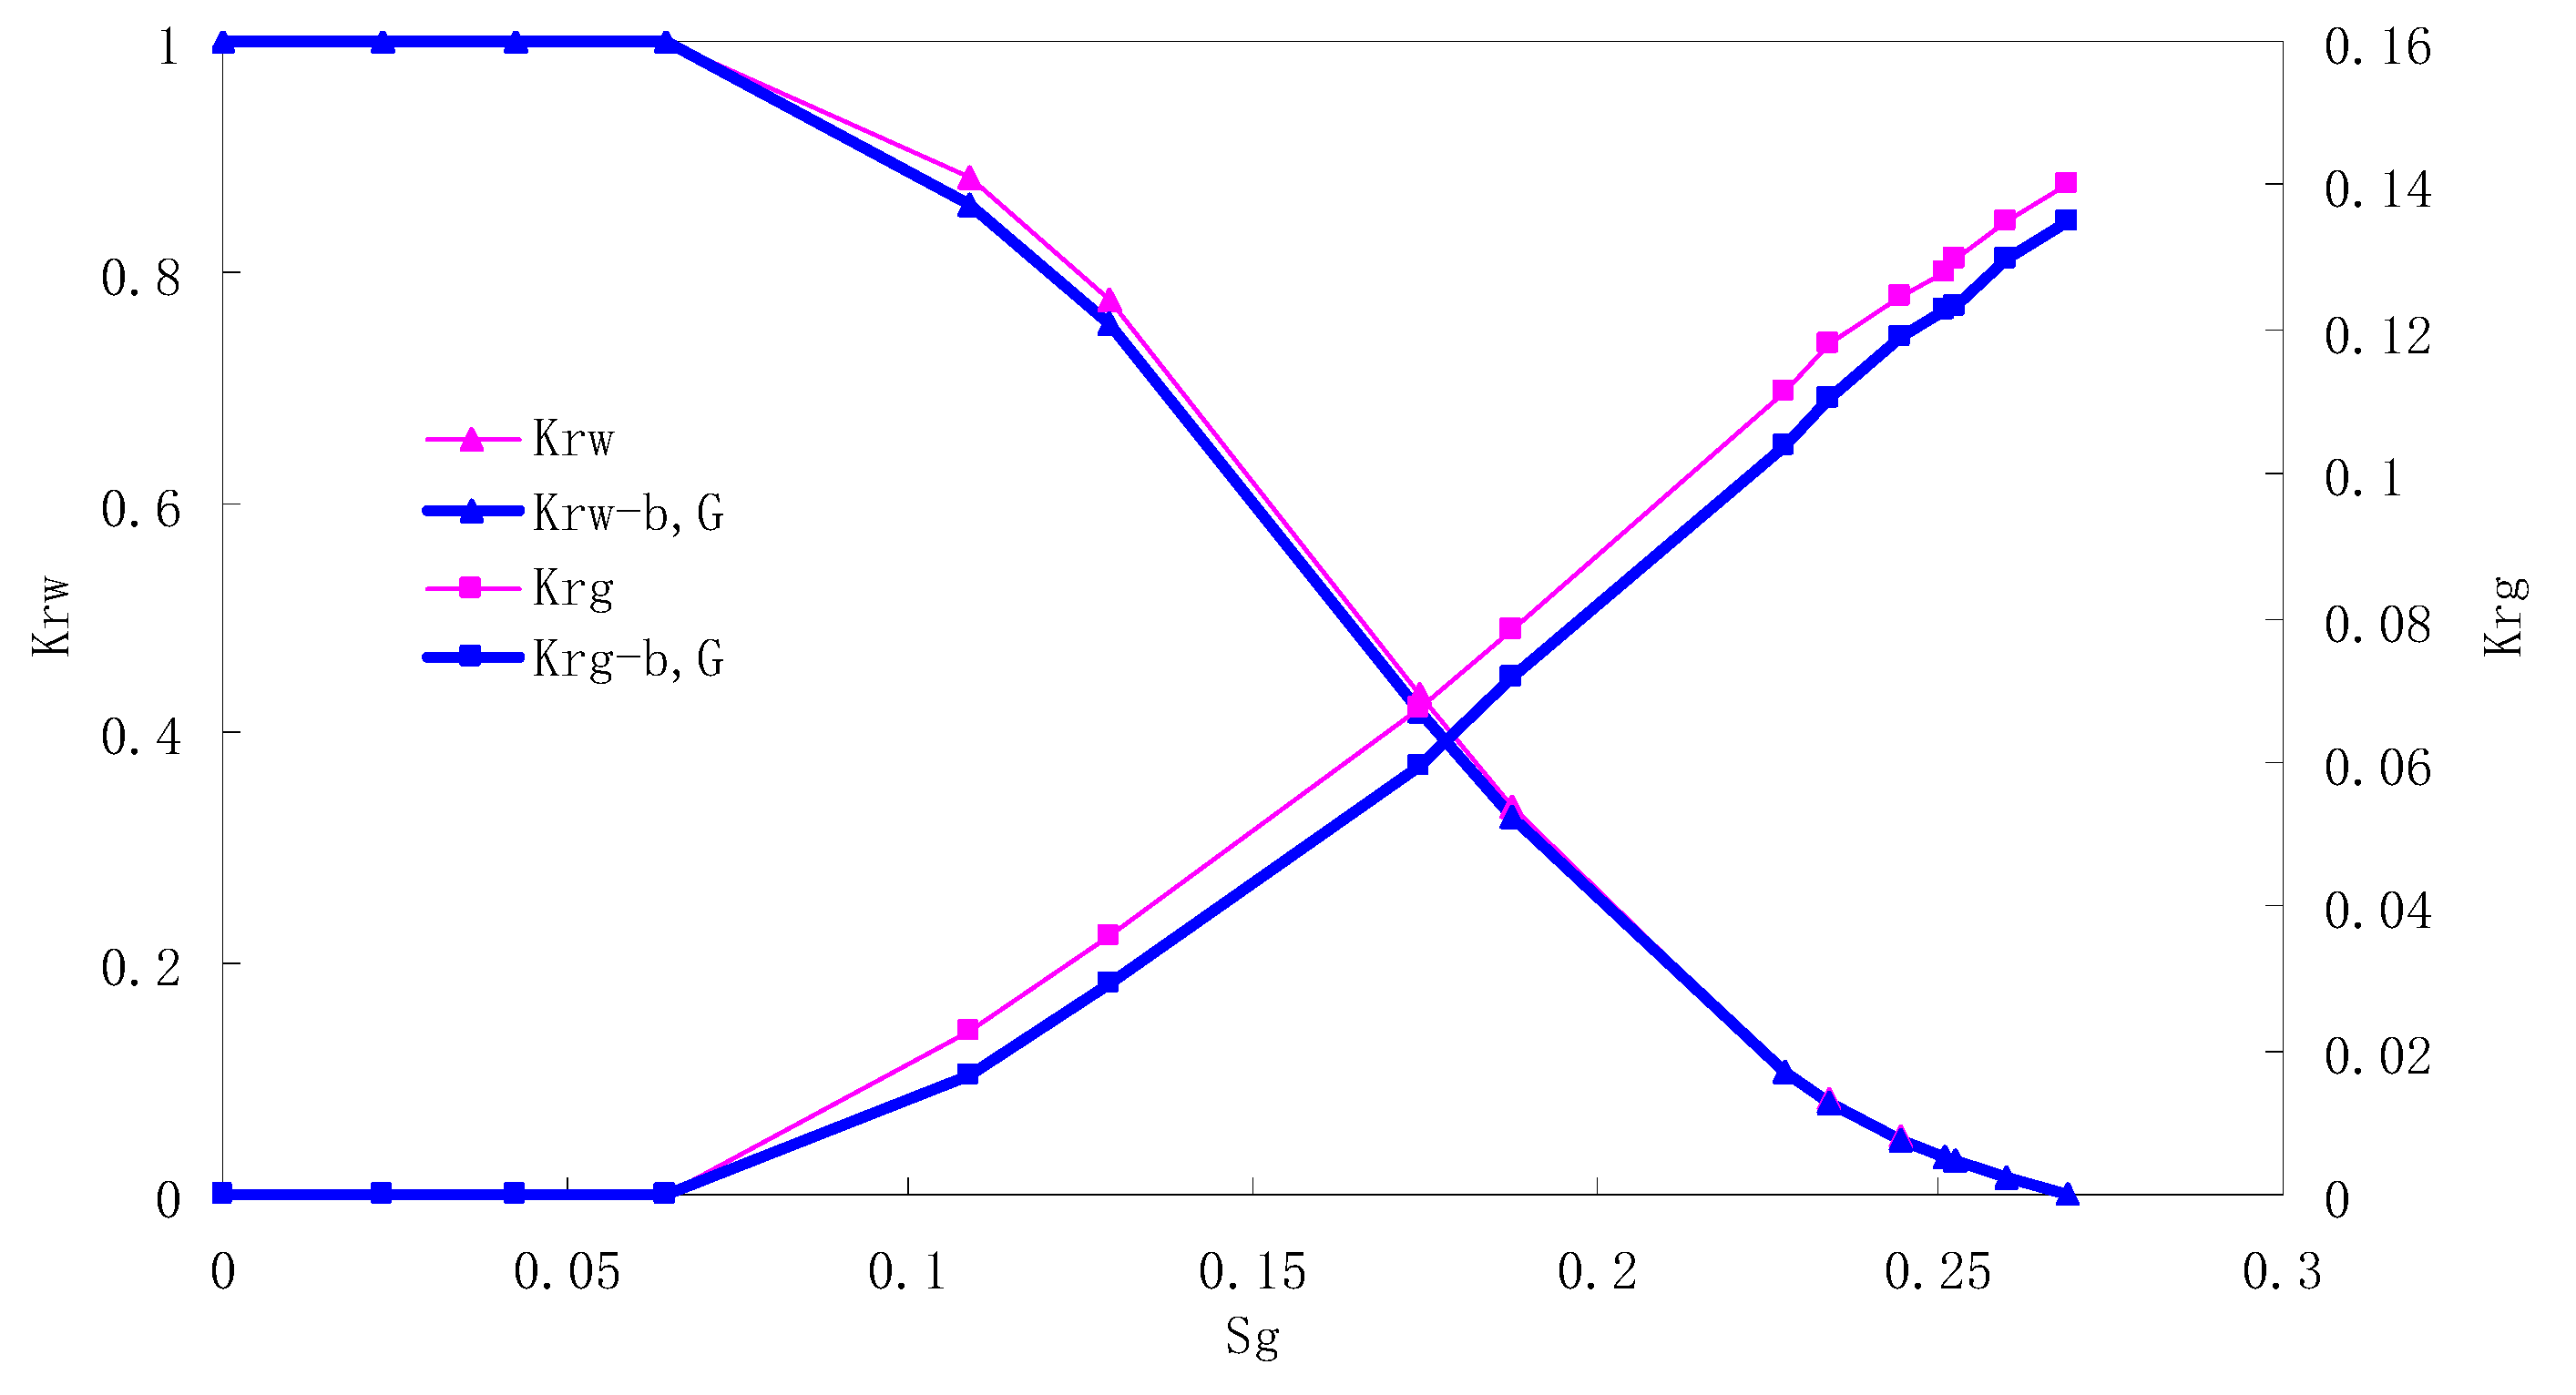
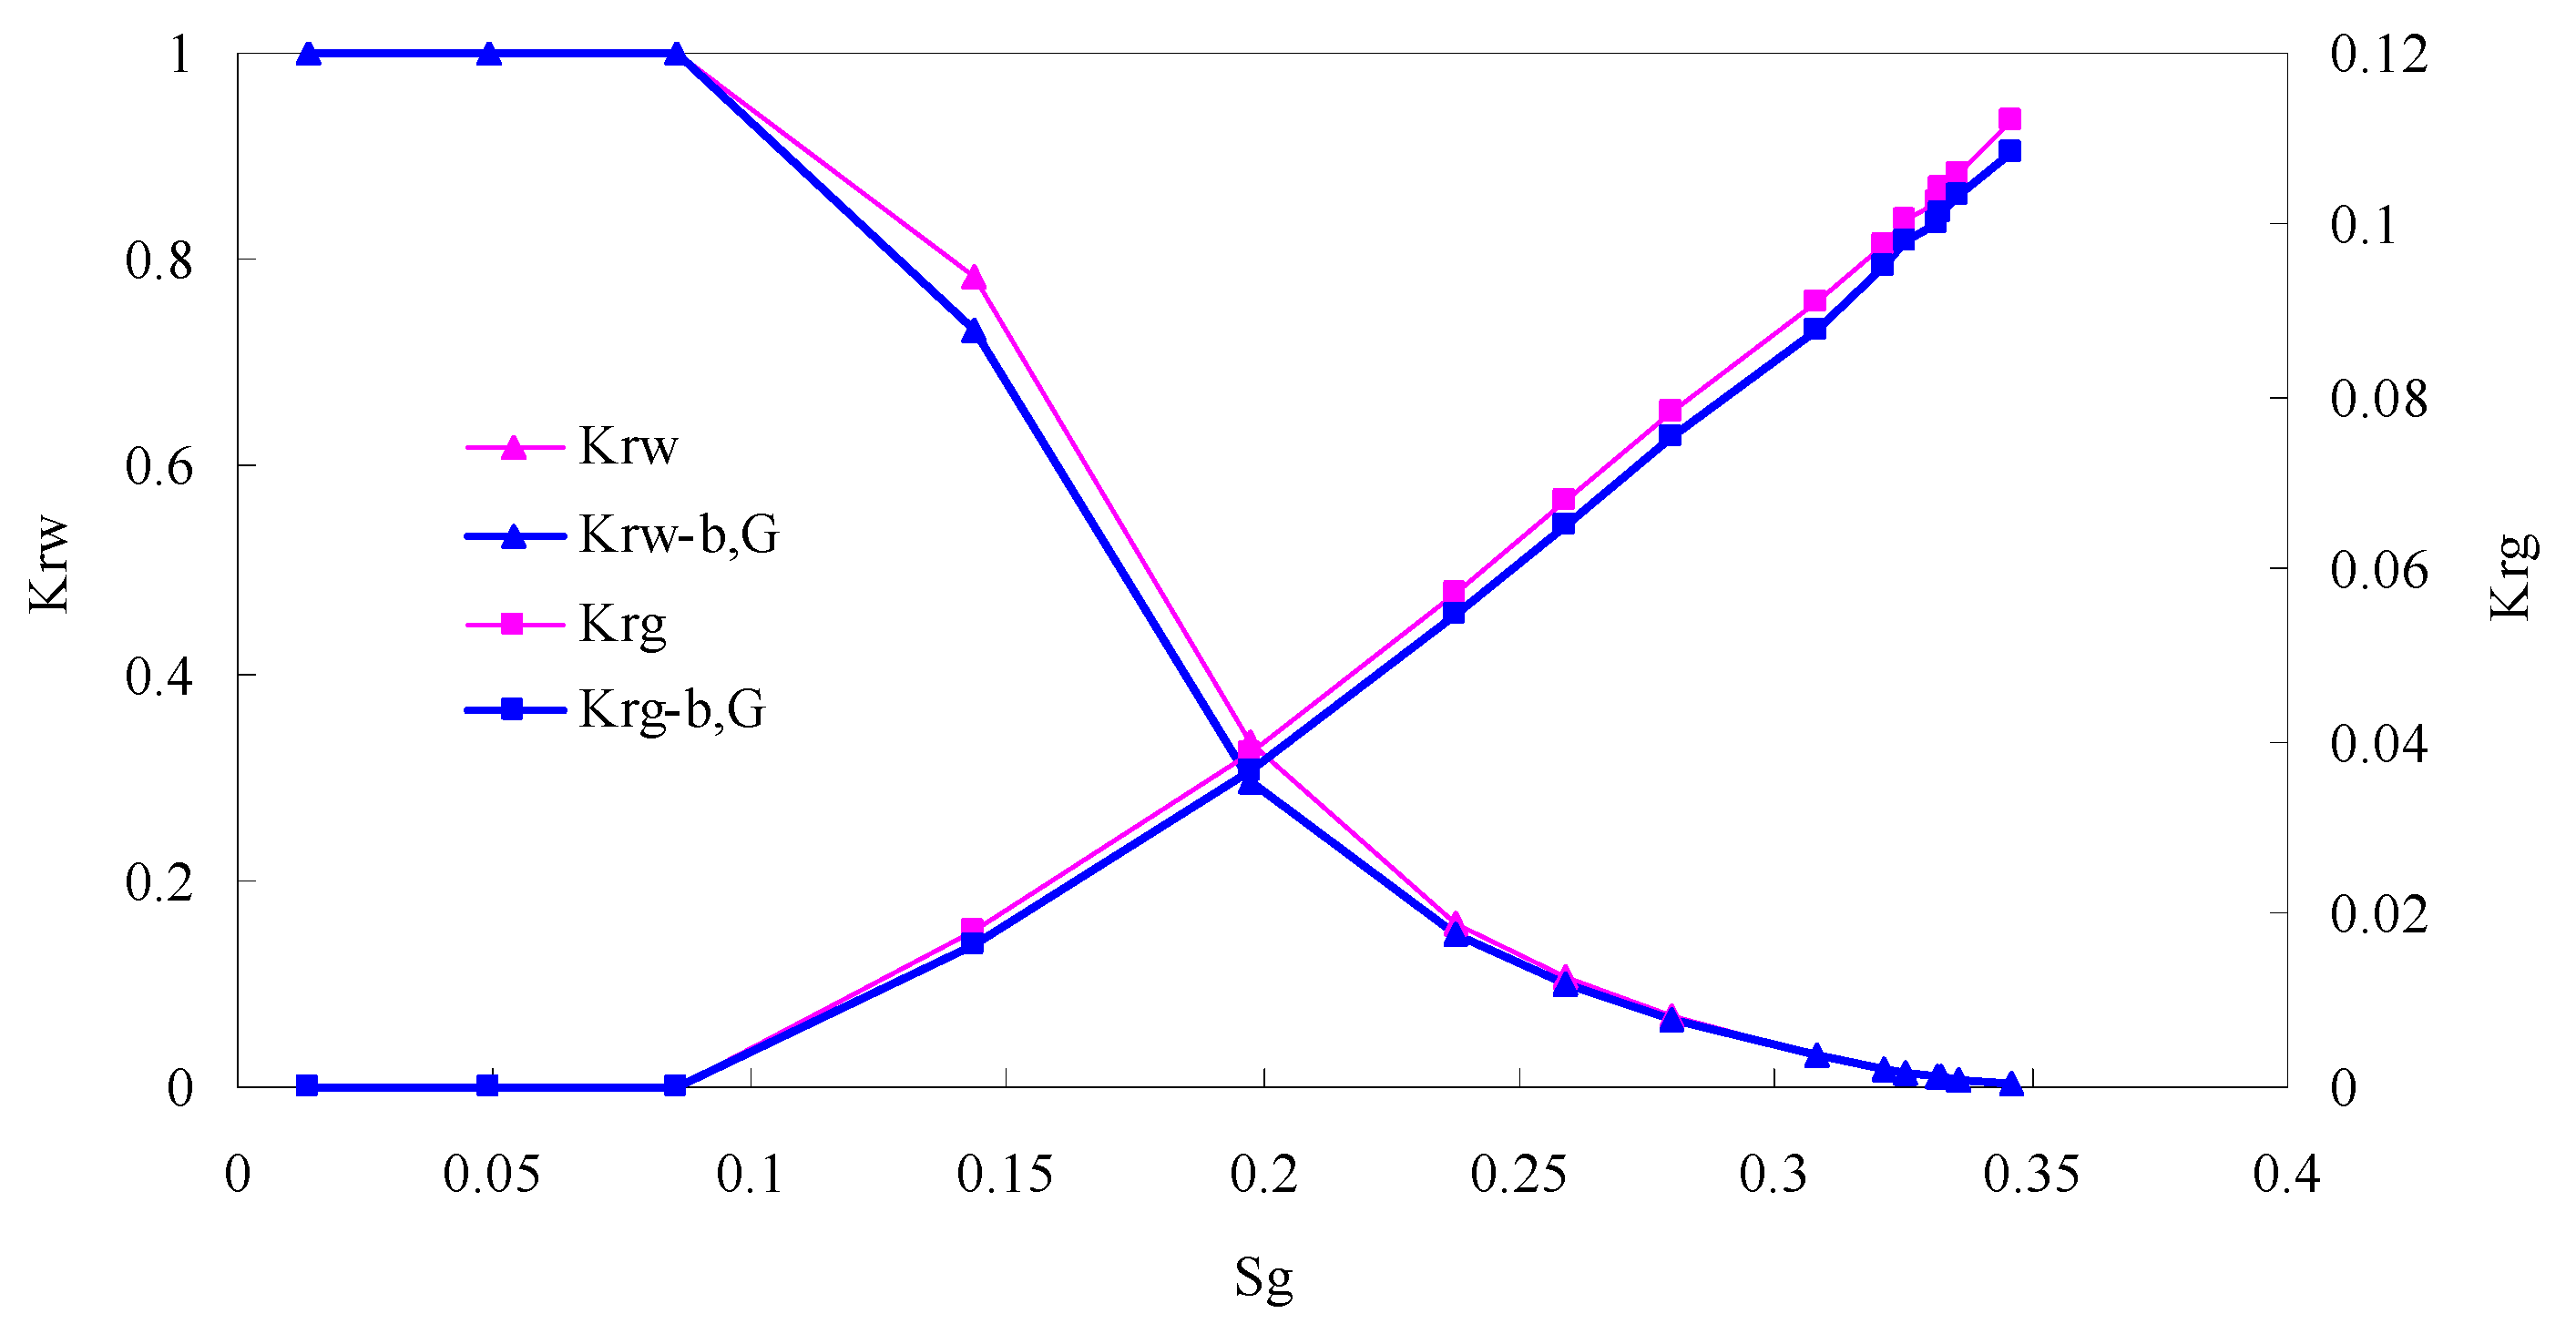
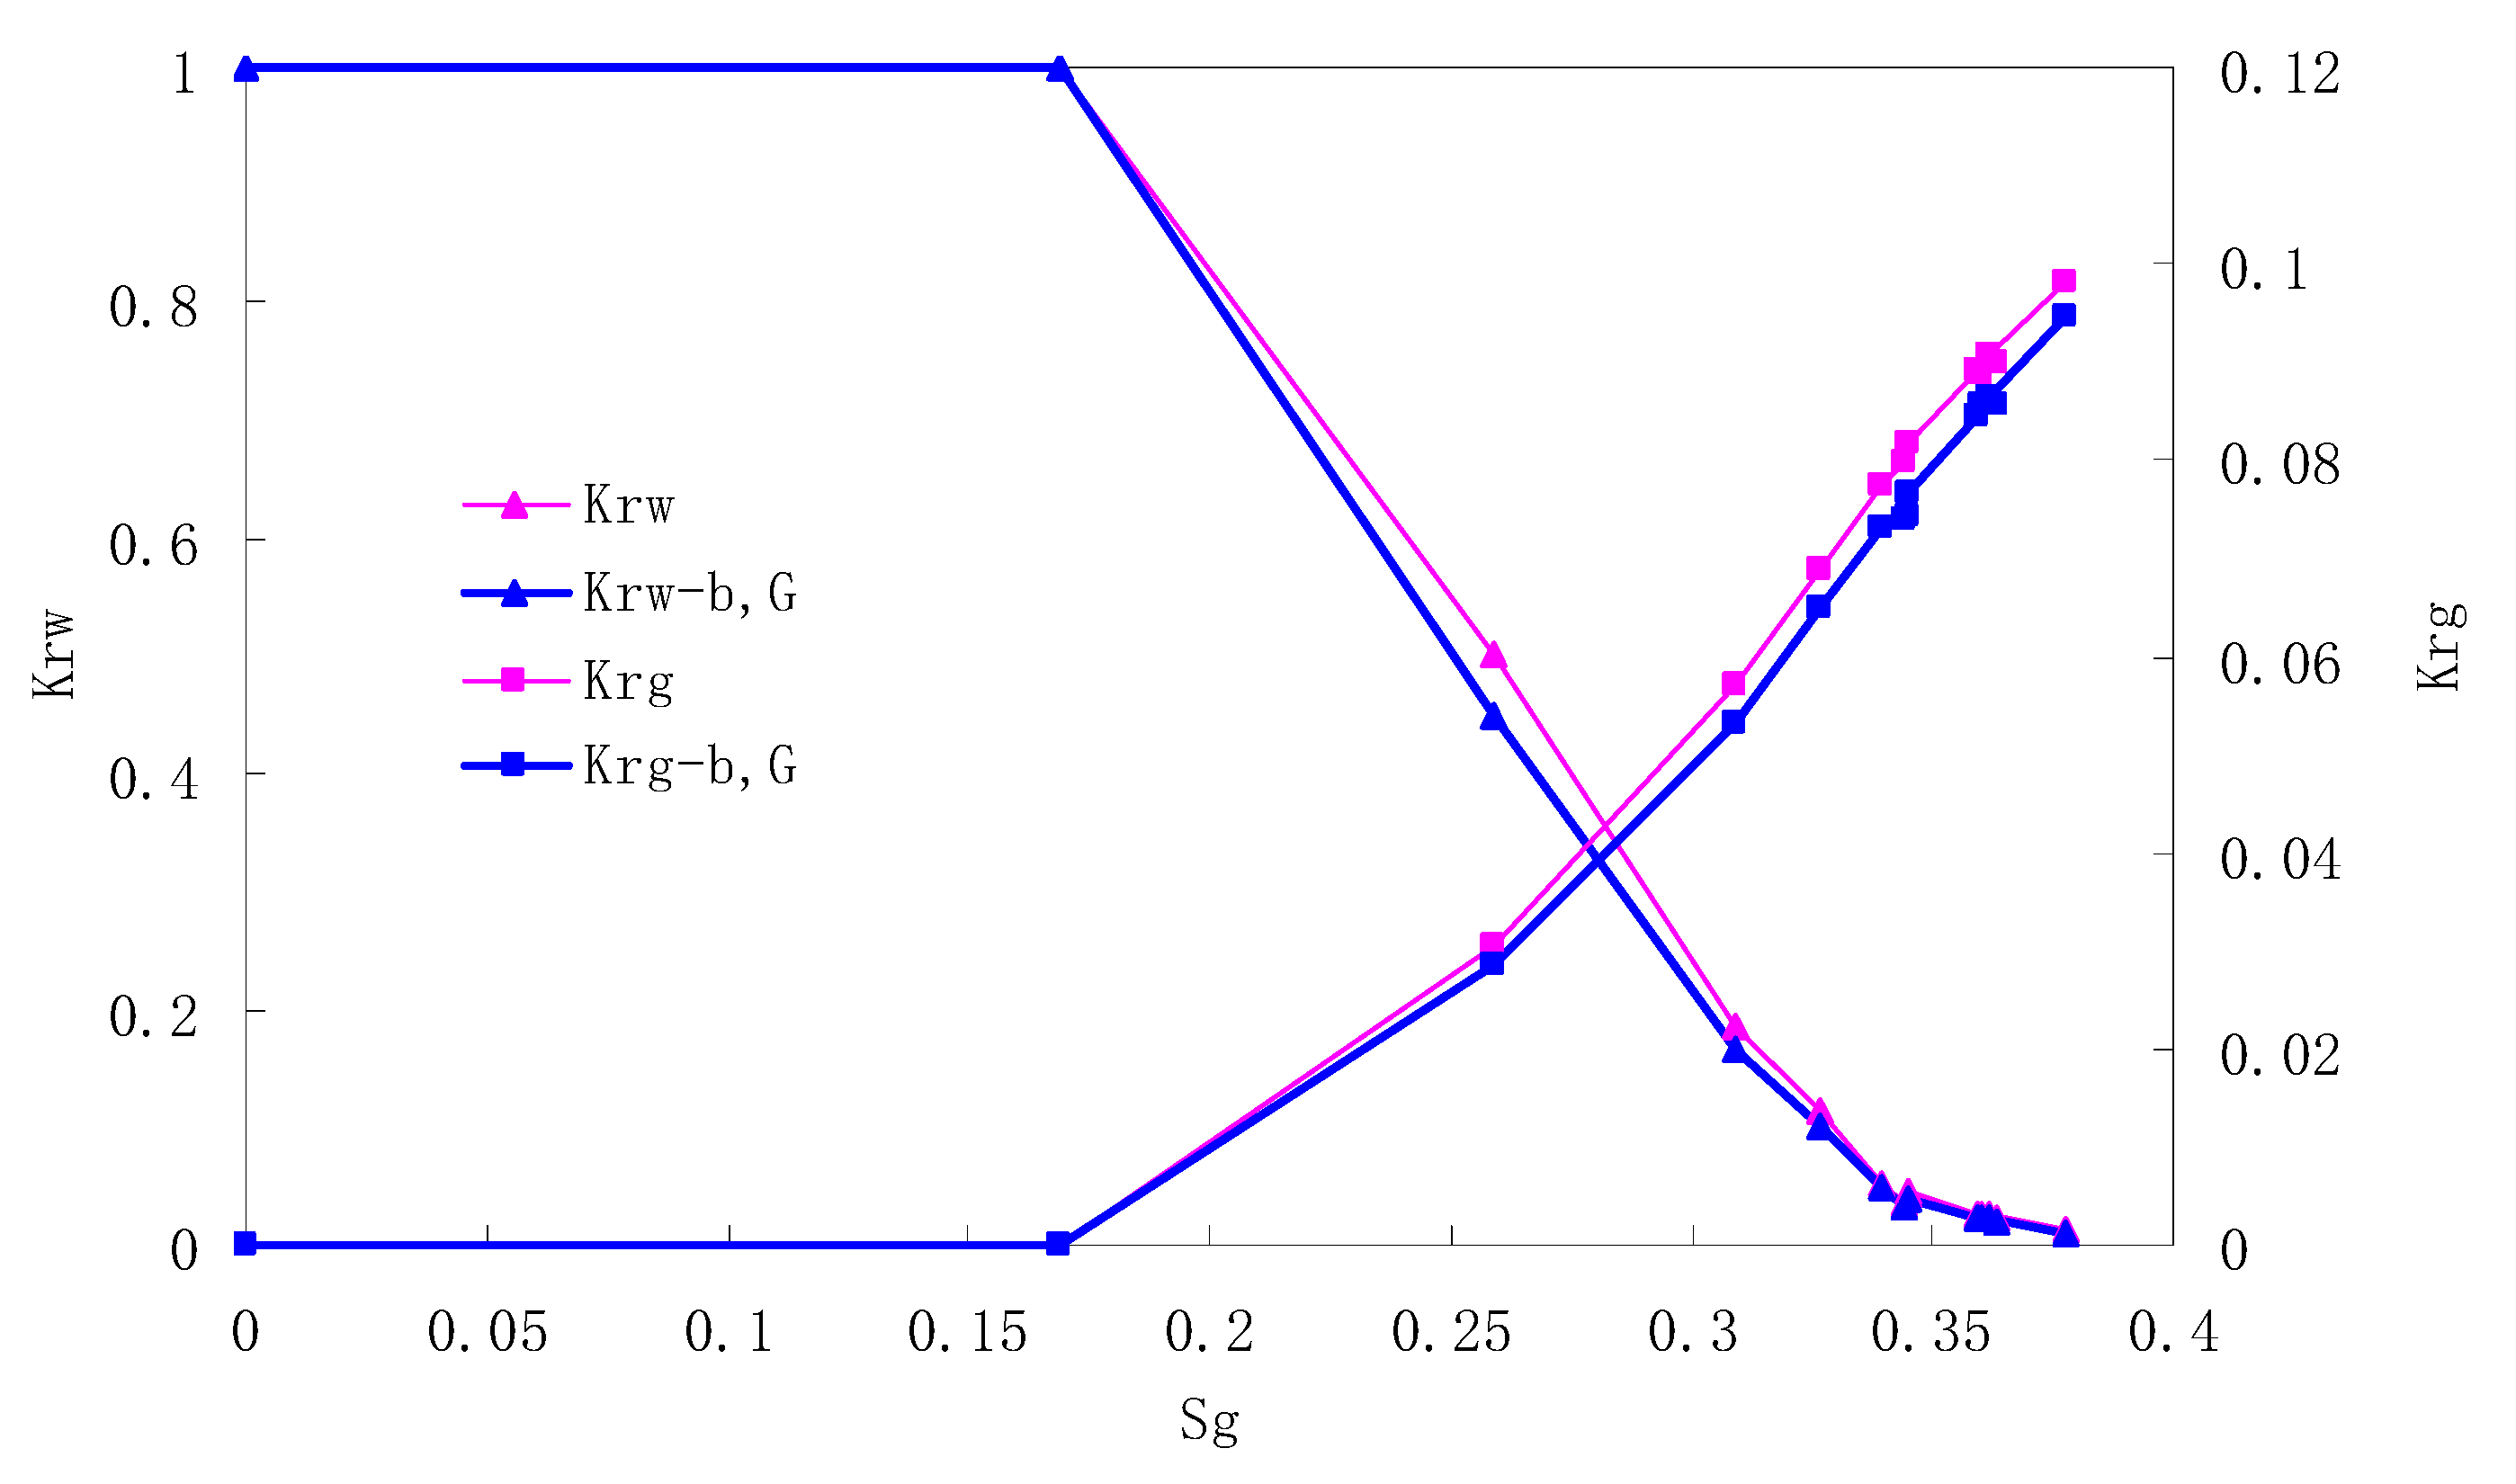
The relative permeability curves are obtained by performing calculations for the CO2/water immiscible situation. The results are shown in Figure 10, Figure 11, Figure 12 and Figure 13. In the figure, Kro-b,G and Krg-b,G represent the relative permeability considering the solubility of CO2, oil viscosity change, gas slippage and threshold pressure, while Kro and Krg represent relative permeability without considering the gas slippage or threshold pressure.
There is critical gas saturation when considering the CO2 solubility. A critical saturation of gas refers to the minimum saturation at which a phase becomes mobile. In the figure, the initial section value of gas relative permeability is zero. Meanwhile, it is observed that as to the cores with similar permeability, the larger the injection pressure is, the faster the gas will breakthrough, and consequently the narrower the two-phase region will be. In the figure, both Kro and Krg are greater than Kro-b, G and Krg-b, G, and it indicates that the water and gas relative permeability reduces when considering gas slippage and threshold pressure. In addition, the influence of gas slippage effect becomes smaller with the decrease of displacement pressure.

5.3. CO2/Live Oil Relative Permeability Curve under Miscible Phase

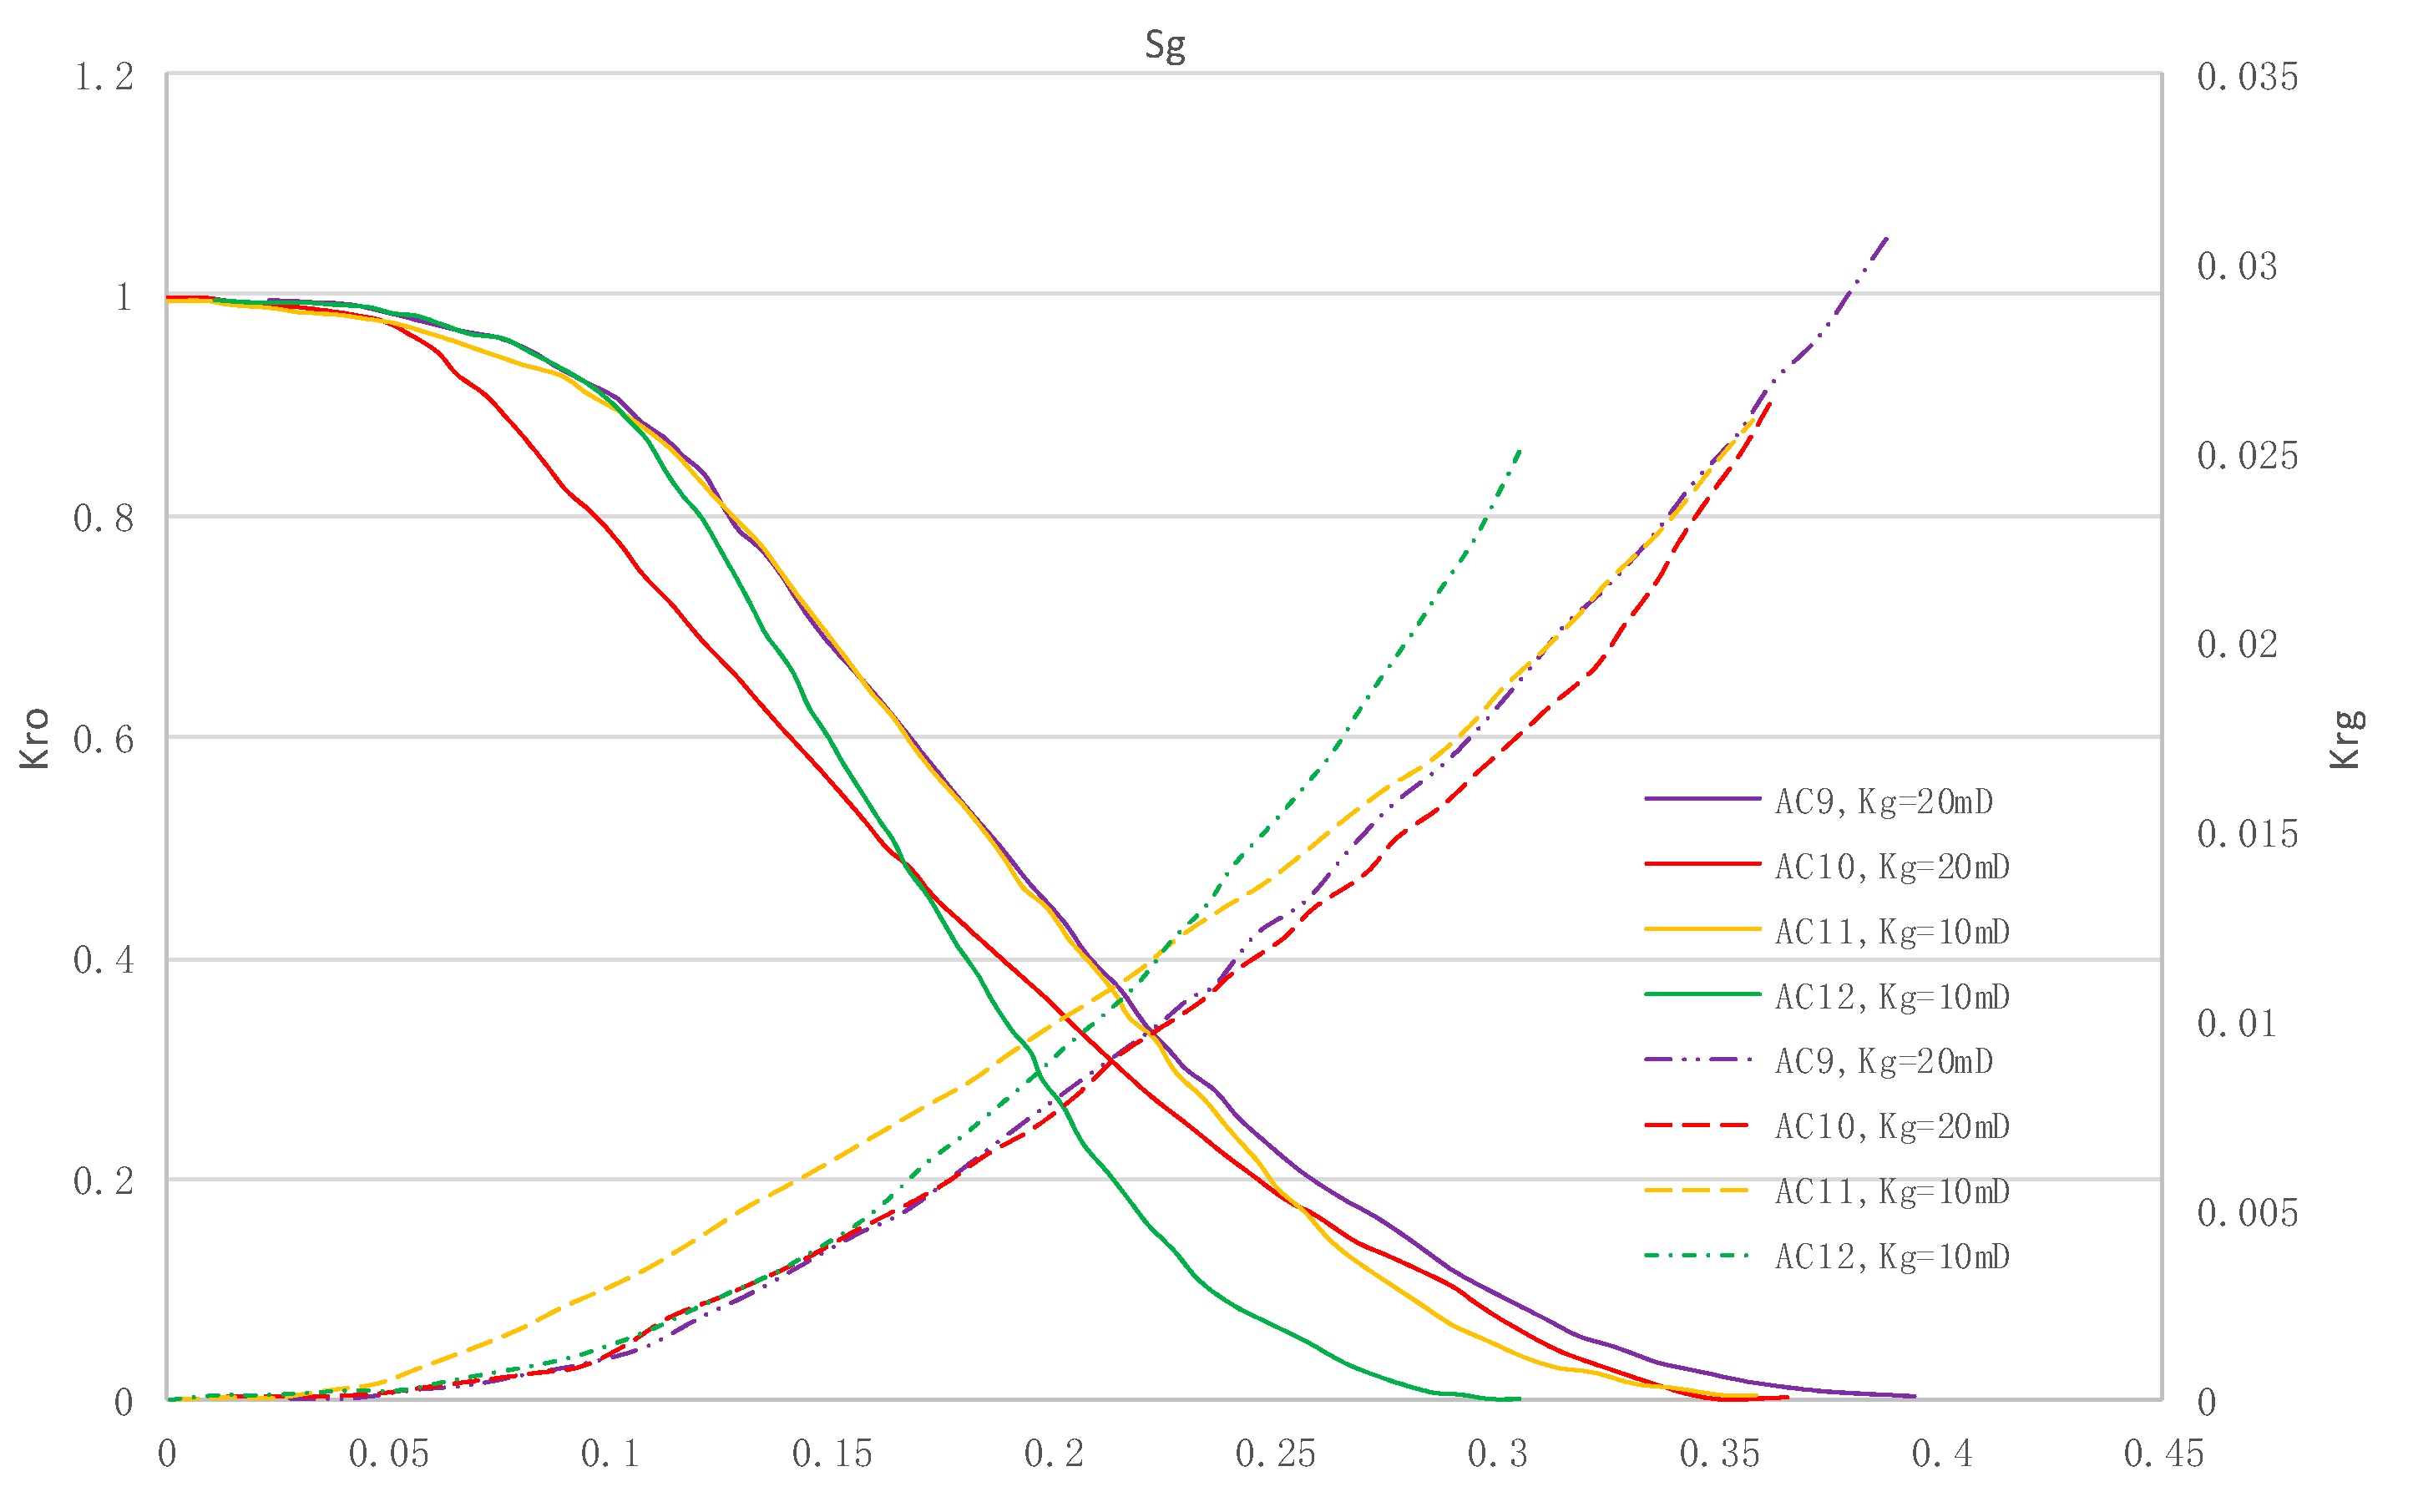
The relative permeability curves are obtained by performing calculations for CO2/oil miscible situation. The results are shown in Figure 14. It can be observed from the figures that as the permeability reduces, the pore throat becomes smaller. The outcome is the decrease of the mobility of CO2 and oil in the cores, and the oil relative permeability decreases fast.
By comparing the kr curves under immiscible and miscible flooding situations for core samples with similar permeability, which are shown in Figure 6 through Figure 9, and Figure 14, respectively, one can find that the two-phase span of miscible flooding is wider, and the relative permeability at the gas endpoint becomes larger. In miscible flooding, the kr curves have different shapes for cores with different permeability, even under the same pressure difference. As the permeability of rock sample decreases, the gas endpoint permeability decreases, the two-phase flow region becomes narrower, and the gas saturation at the isotonic point decreases.

6. Conclusions and Discussions

For immiscible flooding, the relative permeability of both phases decreases when considering threshold pressure and gas slippage, and the relative permeability of oil does not reduce as much as that of CO2. The relative permeability of gas phase at the endpoint is relatively low. The larger the injection pressure is, the faster the gas will breakthrough, and consequently the narrower the two-phase region will be.
In miscible CO2 flooding, the relative permeability curves have different shapes for cores with different permeability, even under the same pressure difference. As the permeability of the rock sample decreases, the gas endpoint permeability decreases, the two-phase flow region becomes narrower, and the gas saturation at the isotonic point decreases.
By comparing the kr curves under immiscible and miscible flooding situations, one can find that the two-phase span of miscible flooding is wider, and the relative permeability at the gas endpoint becomes larger.

Author Contributions

Conceptualization, M.B. and K.S.; methodology, M.B.; software, L.L.; validation, C.L.; formal analysis, M.B.; resources, L.L.; data curation, C.L.; writing—original draft preparation, M.B.; writing—review and editing, K.S.; project administration, K.S.; funding acquisition, K.S. All authors have read and agreed to the published version of the manuscript.

Funding

This work was financially supported by National Natural Science Foundation of China (Grant No.: 51774095) and PetroChina Innovation Foundation (Grant No.: 2018D-5007-0215).

Conflicts of Interest

The authors declare no conflict of interest.

References

  1. Bai, M.; Song, K.; Li, Y.; Sun, J.; Reinicke, K.M. Development of a novel method to evaluate well integrity during CO2 underground storage. SPE J. 2014, 20, 628–641, SPE 173000. [Google Scholar] [CrossRef]
  2. Bai, M.; Sun, J.; Song, K.; Reinicke, K.M.; Li, L.; Qiao, Z. Well completion and integrity evaluation for CO2 injection wells. Renew. Sustain. Energy Rev. 2015, 45, 556–564. [Google Scholar] [CrossRef]
  3. Bai, M.; Sun, J.; Song, K.; Reinicke, K.M.; Teodoriu, C. Evaluation of mechanical well integrity during CO2 underground storage. Environ. Earth Sci. 2015, 73, 6815–6825. [Google Scholar] [CrossRef]
  4. Lai, X.J.; Ye, Z.H.; Xu, Z.Z.; Husar, H.M.; Henry, L.W. Carbon capture and sequestration (CCS) technological innovation system in China: Structure, function evaluation and policy implication. Energy Policy. 2012, 50, 635–646. [Google Scholar] [CrossRef]
  5. Harrison, B.; Falcone, G. Carbon capture and sequestration versus carbon capture utilization and storage for enhanced oil recovery. Acta Geotechnica. 2014, 9, 29–38. [Google Scholar] [CrossRef]
  6. Shaw, J.; Bachu, S. Screening, evaluation, and ranking of oil reservoirs suitable for CO2-flood EOR and carbon dioxide sequestration. J. Can. Pet. Technol. 2002, 41, 51–61. [Google Scholar] [CrossRef]
  7. Jahangiri, H.R.; Zhang, D. Ensemble based co-optimization of carbon dioxide sequestration and enhanced oil recovery. Int. J. Greenh. Gas Control. 2012, 8, 22–33. [Google Scholar] [CrossRef]
  8. Li, C.; Li, H.; Yin, X.Q. Application of CO2 miscible flooding on Gao 89-1 low permeability reservoir. In Proceedings of the SPE Asia Pacific Oil and Gas Conference and Exhibition, Jakarta, Indonesia, 20–22 September 2011; pp. 1–10, SPE 144918-MS. [Google Scholar]
  9. Luo, P.; Meng, Y.; Shu, S.; Tang, L. Some problems in the exploration and exploitation low permeability of oil and gas resources in China. In Proceedings of the SPE International Oil and Gas Conference and Exhibition in China, Beijing, China, 2–6 November 1998; pp. 429–437, SPE 50923-MS. [Google Scholar]
  10. Li, F.; Yang, S.; Chen, H.; Zhang, X.; Nie, X.; Ding, J.; Zheng, A. Long core physical simulation for CO2 flooding in low permeability reservoir. Int. J. OilGas Coal Technol. 2014, 8, 251–261. [Google Scholar] [CrossRef]
  11. Bai, M.; Zhang, Z.; Fu, X. A review on well integrity issues for CO2 geological storage and enhanced gas recovery. Renew. Sustain. Energy Rev. 2016, 59, 920–926. [Google Scholar] [CrossRef]
  12. Czarnota, R.; Stopa, J.; Janiga, D.; Kosowski, P.; Wojnarowski, P. Semianalytical horizontal well length optimization under pseudosteady-state conditions. In Proceedings of the 2018 2nd International Conference on Smart Grid and Smart Cities (ICSGSC), Kuala Lumpur, Malaysia, 12–14 August 2018; IEEE: Piscataway, NJ, USA, 2018; pp. 68–72. [Google Scholar]
  13. Al-Wahaibi, Y.M.; Muggeridge, A.H.; Grattoni, C.A. Experimental and numerical studies of gas/oil multicontact miscible displacements in homogeneous porous media. In Proceedings of the 2005 SPE Reservoir Simulation Symposium held in Houston, Houston, TX, USA, 31 January–2 February 2005. SPE 92887. [Google Scholar]
  14. Al-Wahaibi, Y.M.; Muggeridge, A.H.; Grattoni, C.A. Gas-oil non-equilibrium in multicontact miscible displacements within homogeneous porous media. In Proceedings of the 2006 SPE/DOE Symposium on Improved Oil Recovery held in Tulsa, Tulsa, OK, USA, 22–26 April 2006. SPE 99727. [Google Scholar]
  15. Zhang, K.; Jia, N.; Zeng, F.; Li, S.; Liu, L. A review of experimental methods for determining the Oil-Gas minimum miscibility pressures. J. Pet. Sci. Eng. 2019, 183, 106366. [Google Scholar] [CrossRef]
  16. Krevor, S.C.M.; Pini, R.; Zuo, L.; Benson, S.M. Relative permeability and trapping of CO2 and water in sandstone rocks at reservoir conditions. Water Resour Res. 2012. [Google Scholar] [CrossRef]
  17. Akbarabadi, M.; Piri, M. Relative permeability hysteresis and capillary trapping characteristics of supercritical CO2/brine systems: An experimental study at reservoir conditions. Adv. Water Resour. 2013, 52, 190–206. [Google Scholar] [CrossRef]
  18. Chen, X.Y.; Amir, K. An experimental study of CO2-brine relative permeability in sandstone. In Proceedings of the SPE Improved Oil Recovery Symposium held in Tulsa, Tulsa, OK, USA, 12–16 April 2014. SPE 169137-MS. [Google Scholar]
  19. Robin, G.; Daniel, R.M. Intercept method—A novel technique to correct steady-state relative permeability data for capillary end effects. SPE Reserv. Eval. Eng. 2016, 19, 316–330, SPE 171797-PA. [Google Scholar]
  20. Florian, O.; Antonin, F.; Teddy, F.; Jean-Michel, P.; Arnault, L.; Patrick, D. Experimental investigation of the influence of supercritical state on the relative permeability of Vosges sandstone. Comptes Rendus Mec. 2015, 343, 495–502. [Google Scholar]
  21. Civan, F.; Donaldson, E.C. Relative permeability from unsteady-state displacements with capillary pressure included. SPE Form. Eval. 1989, 4, 189–193, SPE 16200-PA. [Google Scholar] [CrossRef]
  22. Zhang, Y.; Nishizawa, O.; Park, H.; Kiyama, T.; Xue, Z. Relative permeability of CO2 in a low-permeability rock: Implications for CO2 flow behavior in reservoirs with tight interlayers. Energy Procedia 2017, 114, 4822–4831. [Google Scholar] [CrossRef]
  23. Janos, T.; Tibor, B.; Peter, S.; Faruk, C. Convenient formulae for determination of relative permeability from unsteady-state fluid displacements in core plugs. J. Pet. Sci. Eng. 2002, 36, 33–44. [Google Scholar]
  24. Janos, T.; Tibor, B.; Peter, S.; Faruk, C. Direct determination of relative permeability from nonsteady-state constant pressure and rate displacements. In Proceedings of the SPE Production and Operations Symposium held in Oklahoma City, Oklahoma City, OK, USA, 24–27 March 2001. SPE 67318. [Google Scholar]
  25. Yang, Y.; Li, X.; Wu, K.; Lin, M.; Shi, J. A new unsteady-state model for calculating oil-water relative permeability of low-permeability/ultra-low permeability reservoirs. Adv. Mater. Res. Vols. 2012, 616, 964–969. [Google Scholar] [CrossRef]
  26. Ashrafi, M.; Helalizadeh, A. Genetic algorithm for estimating relative permeability and capillary pressure from unsteady-state displacement experiments including capillary end-effect. Energy Sources Part A. 2014, 36, 2443–2448. [Google Scholar] [CrossRef]
  27. Burdine, N.T. Relative permeability calculations from pore size distribution data. Trans. Am. Inst. Min. Metall. Eng. 1953, 198, 71–78. [Google Scholar] [CrossRef]
  28. Mualem, Y. A new model for predicting the hydraulic conductivity of unsaturated porous media. Water Resour. Res. 1976, 12, 513–522. [Google Scholar] [CrossRef] [Green Version]
  29. Bai, M.; Reinicke, K.M.; Song, K. Relative permeability model and CO2 leakage through abandoned wells during CO2 underground storage. Oil Gas-Eur. Mag. 2016, 40, 161–165. [Google Scholar]
  30. Van Genuchten, M.T. A closed-form equation for predicting the hydraulic conductivity of unsaturated soils. Soil Sci. Soc. Am. J. 1980, 44, 892–898. [Google Scholar] [CrossRef] [Green Version]
  31. Parker, J.C.; Lenhard, R.J.; Kuppusamy, T. A parametric model for constitutive properties governing multiphase flow in porous media. Water Res Res. 1987, 23, 618–624. [Google Scholar] [CrossRef]
  32. Brooks, R.H.; Corey, A.T. Properties of porous media affecting fluid flow. J. Irrig. Drain. Div. Proc. Am. Soc. Civil Eng. 1966, 92, 61–68. [Google Scholar]
  33. Corey, A.T. The interrelation between gas and oil relative permeabilities. Prod. Mon. 1954, 19, 38–41. [Google Scholar]
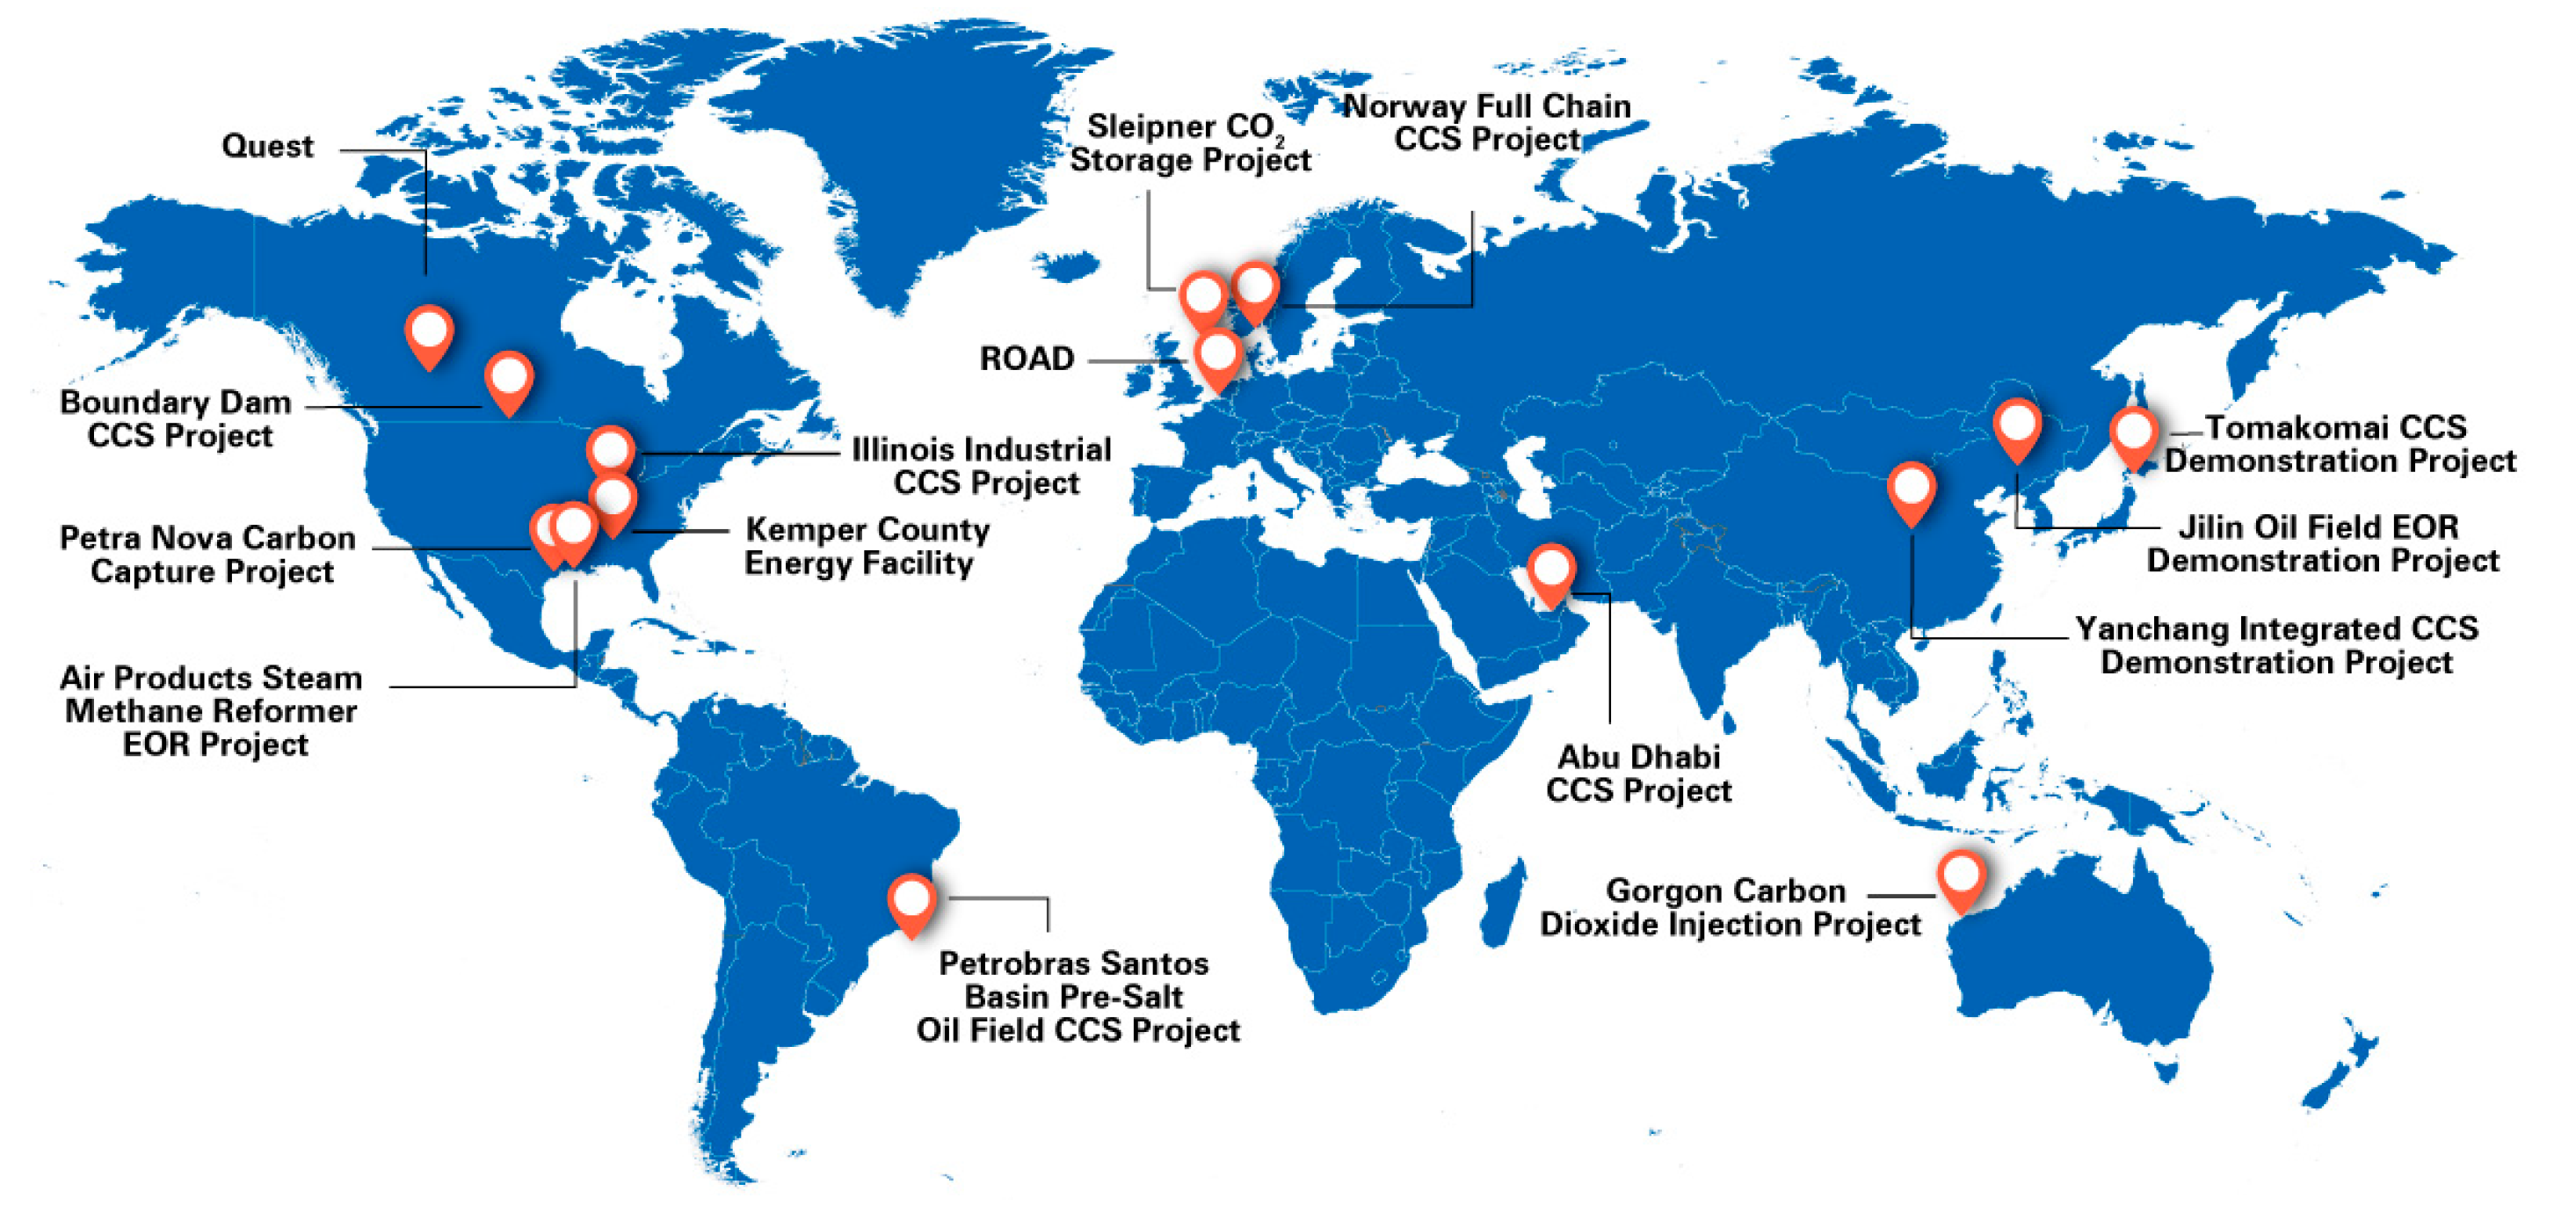
Figure 1. Key Carbon Capture and Sequestration (CCS) project developments and milestones.
Materials 13 00990 g001
Figure 2. CO2/oil relative permeability curve for Natural Core 1 (NC1) (1.0 MPa).
Materials 13 00990 g002
Figure 3. CO2/oil relative permeability curve for NC2 (1.0 MPa).
Materials 13 00990 g003
Figure 4. CO2/oil relative permeability curve for NC3 1.0 (MPa).
Materials 13 00990 g004
Figure 5. CO2/oil relative permeability curve for NC4 (1.0 MPa).
Materials 13 00990 g005
Figure 6. CO2/oil relative permeability curve for AC1.
Materials 13 00990 g006
Figure 7. CO2/oil relative permeability curve for AC2.
Materials 13 00990 g007
Figure 8. CO2/oil relative permeability curve for AC3.
Materials 13 00990 g008
Figure 9. CO2/oil relative permeability curve for AC4.
Materials 13 00990 g009
Figure 10. CO2/water relative permeability curve for AC5 (0.5 MPa).
Materials 13 00990 g010
Figure 11. CO2/water relative permeability curve for AC6 (0.4 MPa).
Materials 13 00990 g011
Figure 12. CO2/water relative permeability curve for AC7 (0.3 MPa).
Materials 13 00990 g012
Figure 13. CO2/water relative permeability curve for AC8 (0.2 MPa).
Materials 13 00990 g013
Figure 14. Kr curves for CO2 miscible flooding in AC9, AC10, AC11 and AC12 (P1 = 35 MPa).
Materials 13 00990 g014
Table 1. Geometric and physical properties of cores for immiscible CO2/oil displacement (NC denotes Natural Core, AC Artificial Core).
NC1NC2NC3NC4AC1AC2AC3AC4
K (× 10−3 μm2)0.44140.54852.71861.025310.1519.8610.7820.31
L (cm)26.527.628.227.330303030
D (cm)2.522.522.522.52
A (cm2)4.5 × 4.54.5 × 4.54.5 × 4.54.5 × 4.5
φ (%)13.0213.0715.5214.3815.3119.2515.8317.74
Table 2. Experiment scenarios design for immiscible CO2/oil displacement.
NC1NC2NC3NC4AC1AC2AC3AC4
Pin (MPa)1.01.01.01.01.10.51.10.5
T (°C)74.974.974.974.945454545
Table 3. Geometric and physical properties of cores for CO2 displacing water.
AC5AC6AC7AC8
K (× 10−3 μm2)20191921
L (cm)30303030
A (cm2)4.5 × 4.54.5 × 4.54.5 × 4.54.5 × 4.5
φ (%)15.9215.2015.4217.77
Table 4. Experiment scenarios design for CO2 displacing water.
AC5AC6AC7AC8
Pin (MPa)0.50.40.30.2
T (°C)45454545
Table 5. Geometric and physical properties of cores for the miscible CO2 displacement.
AC9AC10AC11AC12
K (× 10−3 μm2)19.7621.239.8910.45
L (cm)30303030
A (cm2)4.5 × 4.54.5 × 4.54.5 × 4.54.5 × 4.5
φ (%)16.8417.2315.6215.73
Table 6. Experiment scenarios design for the miscible CO2 displacement.
AC9AC10AC11AC12
Pin (MPa)35353535
Pout (MPa)30303030
T (°C)45454545