Article

Influence of Mg, Cu, and Ni Dopants on Amorphous TiO2 Thin Films Photocatalytic Activity

1
Department of Physics: Faculty of Mathematics and Natural Sciences, Kaunas University of Technology, Studentų str. 50, 51368 Kaunas, Lithuania
2
Graduate School of Science and Technology, Shizuoka University, 3-5-1 Johoku, Naka-Ku, Hamamatsu, Shizuoka 432-8011, Japan
3
Faculty of Chemical Technology, Kaunas University of Technology, Radvilėnų pl. 19, 50299 Kaunas, Lithuania
4
Research Institute of Electronics, Shizuoka University, 3-5-1 Johoku, Naka-Ku, Hamamatsu, Shizuoka 432-8011, Japan
*
Author to whom correspondence should be addressed.
Materials 2020, 13(4), 886; https://doi.org/10.3390/ma13040886
Submission received: 13 January 2020 / Revised: 12 February 2020 / Accepted: 14 February 2020 / Published: 17 February 2020

Abstract

:
The present study investigates Mg (0 ÷ 17.5 wt %), Cu (0 ÷ 21 wt %) and Ni (0 ÷ 20.2 wt %) dopants (M-doped) influence on photocatalytic activity of amorphous TiO2 thin films. Magnetron sputtering was used for the deposition of M-doped TiO2 thin films. According to SEM/EDS surface analysis, the magnetron sputtering technique allows making M-doped TiO2 thin films with high uniformity and high dopant dispersion. Photocatalysis efficiency analysis was set in oxalic acid under UV irradiation. In accordance with the TOC (total organic carbon) measurements followed by the apparent rate constant (kapp) results, the dopants’ concentration peak value was dopant-dependent; for Mg/TiO2, it is 0.9% (kapp—0.01866 cm−1), for Cu/TiO2, it is 0.6% (kapp—0.02221 cm−1), and for Ni/TiO2, it is 0.5% (kapp—0.01317 cm−1). The obtained results clearly state that a concentration of dopants in TiO2 between 0.1% and 0.9% results in optimal photocatalytic activity.

Graphical Abstract

1. Introduction

Photocatalysis and photocatalytic materials based on semiconductors have been studied for more than a decade [1,2,3]. By reason of higher efficiency and future potential in water treatment [4], air purification [5] and even hydrogen production [6], photocatalysis interest increased significantly. The number of articles related to photocatalysis has risen thousands of times over the past 20 years. Additionally, research based on TiO2 as a photocatalyst among other semiconductors also increased [7]. TiO2 manufacturing is affordable, which makes it economically favorable, especially when compared with materials having similar properties, such as SnO2, CeO2, CdS, and WO3. These semiconductors are also used for photocatalysis research because of their biocompatibility, stability in various conditions, and capability to generate excitons [8,9]. TiO2 achieves better photocatalytic activity than ZnO [10] or CdS [11] and under the same conditions; not only does it have better photochemical stability, but TiO2 is superior photocatalyst compared to WO3 [12]. TiO2 has great potential in energy and environmental research, such as uses in lithium-ion batteries, self-cleaning coatings, water purification, or as a catalyst for photocatalytic reactions [13,14,15,16]. As a result of its unique dielectric and optical properties, TiO2 is considered as a non-hazardous material and could be modified, depending on the requirements for specific applications [17]. It is known that the TiO2 band gap is approximately 3–3.2 eV (depending on phase) and its conduction band minimum (CBM) is almost as same as hydrogen potential, while the valence band maximum (VBM) is slightly lower than oxygen potential, at approximately 1.6 eV [18,19,20].
The efficiency and photocatalysis properties depend on the crystal structure of TiO2. TiO2 has three common phases: rutile, anatase, and brookite (least studied because of its instability). Rutile is the most thermodynamically stable phase, as demonstrated when anatase and brookite slowly change phases to rutile at 550–750 °C [21]. Both anatase and rutile have a tetragonal structure, which can be distinguished from one another because of their crystal habit. Anatase differs from rutile in that its octahedrons share four crystal edges, forming a four-fold axis. The TiO2 anatase phase particle surface possesses a triangular arrangement, which creates a reaction condition with the adsorbed molecules and achieves a slightly higher reduction rate and absorption of organic molecules. Studies show that the photocatalysis process is more efficient with rutile and anatase phases than brookite [22,23,24], and it is best with a mixture of anatase and rutile (70% and 30% respectively, called Degussa P25) [25,26,27]. Even though the chemical structure of the anatase or rutile phase seems to be more favorable for photocatalysis, it is still inefficient in its pure phase [26,28,29]. Nevertheless, based on research and interest, amorphous TiO2 stands alongside crystalline TiO2 as an alternative to crystalline structures [30,31,32]. According to Kaur et al. (2012), the electronic structure of amorphous TiO2 is similar to that of crystalline TiO2 but with a larger band gap [33]. Nonetheless, the energy band gap can be controlled with dopants. The study of Khramov et al. shows that the modification of Degussa P25 with other metals can lead to the amorphization of TiO2 structure [34]. Based on that, it appears that not only do the dopants change the electrical structure of TiO2 (by modifying the band gap) and increasing the photocatalytic efficiency, but this could also lead to changes in the TiO2 phase structure (amorphization), which would therefore decrease the photocatalytic efficiency because an amorphous structure has a higher number of recombination centers. According to Shu et al., the amorphous TiO2 films have many defects, which increases their conductivity. However, those defects appear mostly inside the film, which leaves TiO2 as a semiconductor with an energy band gap nearly to the dielectric. Despite that, doping the TiO2 with another metal can increase the surface conductivity, which allows easily transfering charge carriers [35]. This constructs the potential of amorphous TiO2 as a low-cost competitor to crystalline phase TiO2. Controversially, another study declares that amorphous TiO2 has negligible photocatalytic activity, due to its defective states [36]. Over the last two decades, studies of crystalline and amorphous TiO2 show debatable results when comparing the photocatalysis efficiency based on the TiO2 structure [31,37], which leaves this field of study open for further research.
The electrical properties are the main parameters for the semiconductor in the photocatalysis process. The efficiency of the process can be influenced by particle size, phase composition, crystal structure, or even purity of the samples [38,39]. Electrical properties can vary depending on the deposition technique and parameters [40,41,42]. Moreover, the photocatalytic properties can be modified by adding dopants to the film or on the surface [43,44], and/or by changing the surface/bulk structure of TiO2. Thus, metal ions act as electron trappers, generators of excitons, and/or as photosensitizers, raising light absorbance under visible light. Transition metal ions change the conduction band minimum (CBM) or valence band maximum (VBM) energy levels, which reduce the energy band gap or create additional levels in reducing exciton recombination time [45,46,47]. Furthermore, the electron work function of metal dopants must be considered beforehand. Metal dopants with an electron work function (Φm) similar to the amorphous TiO2 Fermi energy level (EF) could enhance the photocatalysis process significantly, and vice versa.
The aim of this research is to find an optimal concentration of Cu, Ni, and Mg dopants in amorphous TiO2 thin films, and to investigate the photocatalytic activity of the formed thin-film structures. Thin-film formation and analysis were done under the same conditions for a better comparison. TiO2 thin films with different concentrations of Mg, Cu, and Ni dopants were formed using the magnetron sputtering deposition method, and photocatalytic activity was tested using an oxalic acid solution.

2. Experimental Method

2.1. Films Preparation

Thin films were deposited using the Kurt J. Lesker PVD 75 vacuum system with four magnetron sputtering stages. Argon and oxygen gases (with 99.999% purity) were used during the plasma activation and deposition processes. Two titanium (Ti) targets (99.995% purity), a copper (Cu) target (99.99% purity), a magnesium (Mg) target (99.95% purity), and a nickel (Ni) target (99.995% purity), all purchased from Sigma Aldrich®, were used for thin-film formation. Power sources including direct current (DC), pulsed DC, and radio frequency (RF) were used. The DC source was used for the Ti and Ni targets, pulsed DC was used for the Mg target, and RF was used for the Cu target. TiO2 and Cu, Ni, and Mg-doped TiO2 films were deposited on stainless steel plates (304 series). The substrate was cleaned in pure acetone (for 10 min) using an ultrasonic bath in order to avoid any organic contamination. Thin films were deposited at 300 °C maintaining the ratio of oxygen and argon at 20/80. M-doped TiO2 were produced using two titanium cathodes (DC source) and one metal cathode (DC, pulsed DC, or RF source) target. Different output power and shutter open/close ratios were used to achieve different concentrations of M in TiO2 films. The total thickness of the formed thin films was around 100 nm; the structure based on the deposition procedure is shown in Figure 1. Different Cu, Ni, and Mg concentrations in TiO2 thin films were achieved (Table 1), i.e., Mg, 0 ÷ 17.5 wt %; Cu, 0 ÷ 21 wt %; and Ni, 0 ÷ 20.2 wt %. The concentration of dopants in TiO2 was analyzed via X-ray photoelectron spectrometer (XPS) and energy-dispersive X-ray spectroscopy (EDS).

2.2. The Morphology and Structural Analysis

The structure of the TiO2 phase was determined using an X-ray diffractometer (XRD) “Bruker D8 Discover” at 2Θ angle in a 20° to 70° range using Cu Kα (λ = 0.154059 nm) radiation, 0.01° step, and a Lynx eye position-sensitive detector (PSD).
The surface topography images were obtained via scanning electron microscope (FE-SEM; JEOL, SM-71010) using 8 kV accelerating voltage.
The distribution of elements (mapping) and a high concentration of dopants were measured using an energy-dispersive X-ray spectroscope “BrukerXFlash Quad 5040” (EDS) with an accelerating voltage of 10 kV.
The low concentration of dopants in TiO2 was determined by the X-ray photoelectron spectrometer (XPS, PHI Versaprobe 5000). Measurements were performed using monochromatic X-ray radiation (Al Kα, 1486.6 eV), 25 W power, 100 μm beam size, and the measurement angle was 45° during the experiments. The sample charging effect was compensated using the radiation of low energy electrons and ions. The resolution was 1 eV for Survey Spectrum and 0.1 eV for detailed chemical analysis. The pass energy was 187.580 eV. Thin films were sputtered in order to achieve the depth profile of the samples [48].

2.3. Photocatalysis Efficiency Evaluation

To maximize the efficiency of the photocatalysis process, a transparent solution must be chosen. There are many types of research where methylene blue (MB) [49,50], rhodamine B (RhB), [51,52] or other organic dyes were selected as a solution for this process. In that case, the light absorption of the solution itself and the degradation process happening without the photocatalyst should be considered as an extraneous effect, which could cause slightly inaccurate results of the semiconductor as a photocatalyst [53,54,55]. For this reason, measurements were set in oxalic acid solution (which is as well a product of RhB during the photodegradation process) made from water and oxalic acid powder (with an initial concentration of 100 mg/l) under UV light (light peak at 254 nm, 18 W power). According to the light source used in the experiment, absorption spectra were measured but not analyzed in this manuscript because of the same absorbance at 254 nm for all the samples. In this range of light, metal dopants do not have an effect on the absorption characteristics of TiO2. The samples (surface area—1600 mm2) were immersed in the solution and set for 30 min in the dark before every experiment. After that, the samples were irradiated for 80 min, and the solution was continuously stirred using a magnetic stirrer. The distance between the UV lamp and the sample was set to 50 mm, while the distance between the surface of the solution and the sample was 20 mm. Samples of solution were taken after 20, 40, 60, and 80 min of irradiation, and the degradation of the oxalic acid solution was measured in a Shimadzu TOC-L (Shimadzu Corp. Japan) analyzer according to the EN 1484:2002 procedure. To minimize errors, there were three measurements for each sample taken from the solution, and the average concentration was analyzed. The degradation steps of oxalic acid solution in water are shown in Figure 2. Initially, C2H2O4 decomposes into formic acid, and with further degradation into the innocuous compounds (H2O and CO2), through intramolecular dehydration.
The results were evaluated based on the thermodynamics and kinetics of the process. The driving force of photocatalysis is an organic solution and oxygen molecules. Oxygen is constant in photocatalysis because the experiment is set in the atmospheric ambient and the solution is surrounded by oxygen molecules. The adsorption of organic compounds on the surface of the photocatalyst is the kinetic driving force of the photocatalysis process. Adsorption and desorption equilibrium follows Langmuir isotherm [56,57]. In this case, under UV irradiation, there is an equilibrium in adsorbed and desorbed molecules.
This evaluation is useful when adsorption and desorption are in equilibrium [58], but because the photocatalysis efficiency is low, it could be applied as a universal equation for different solutions:
k a p p = 1 t ln ( C 0 C t ) ,
where kapp—apparent rate constant, CO—initial concentration, Ct—concentration in time, and t—time. Keeping in mind that kapp depends on the time and concentration differences in time, average meanings were calculated for the different concentrations of dopants in TiO2 (Table 1).

3. Results and Discussion

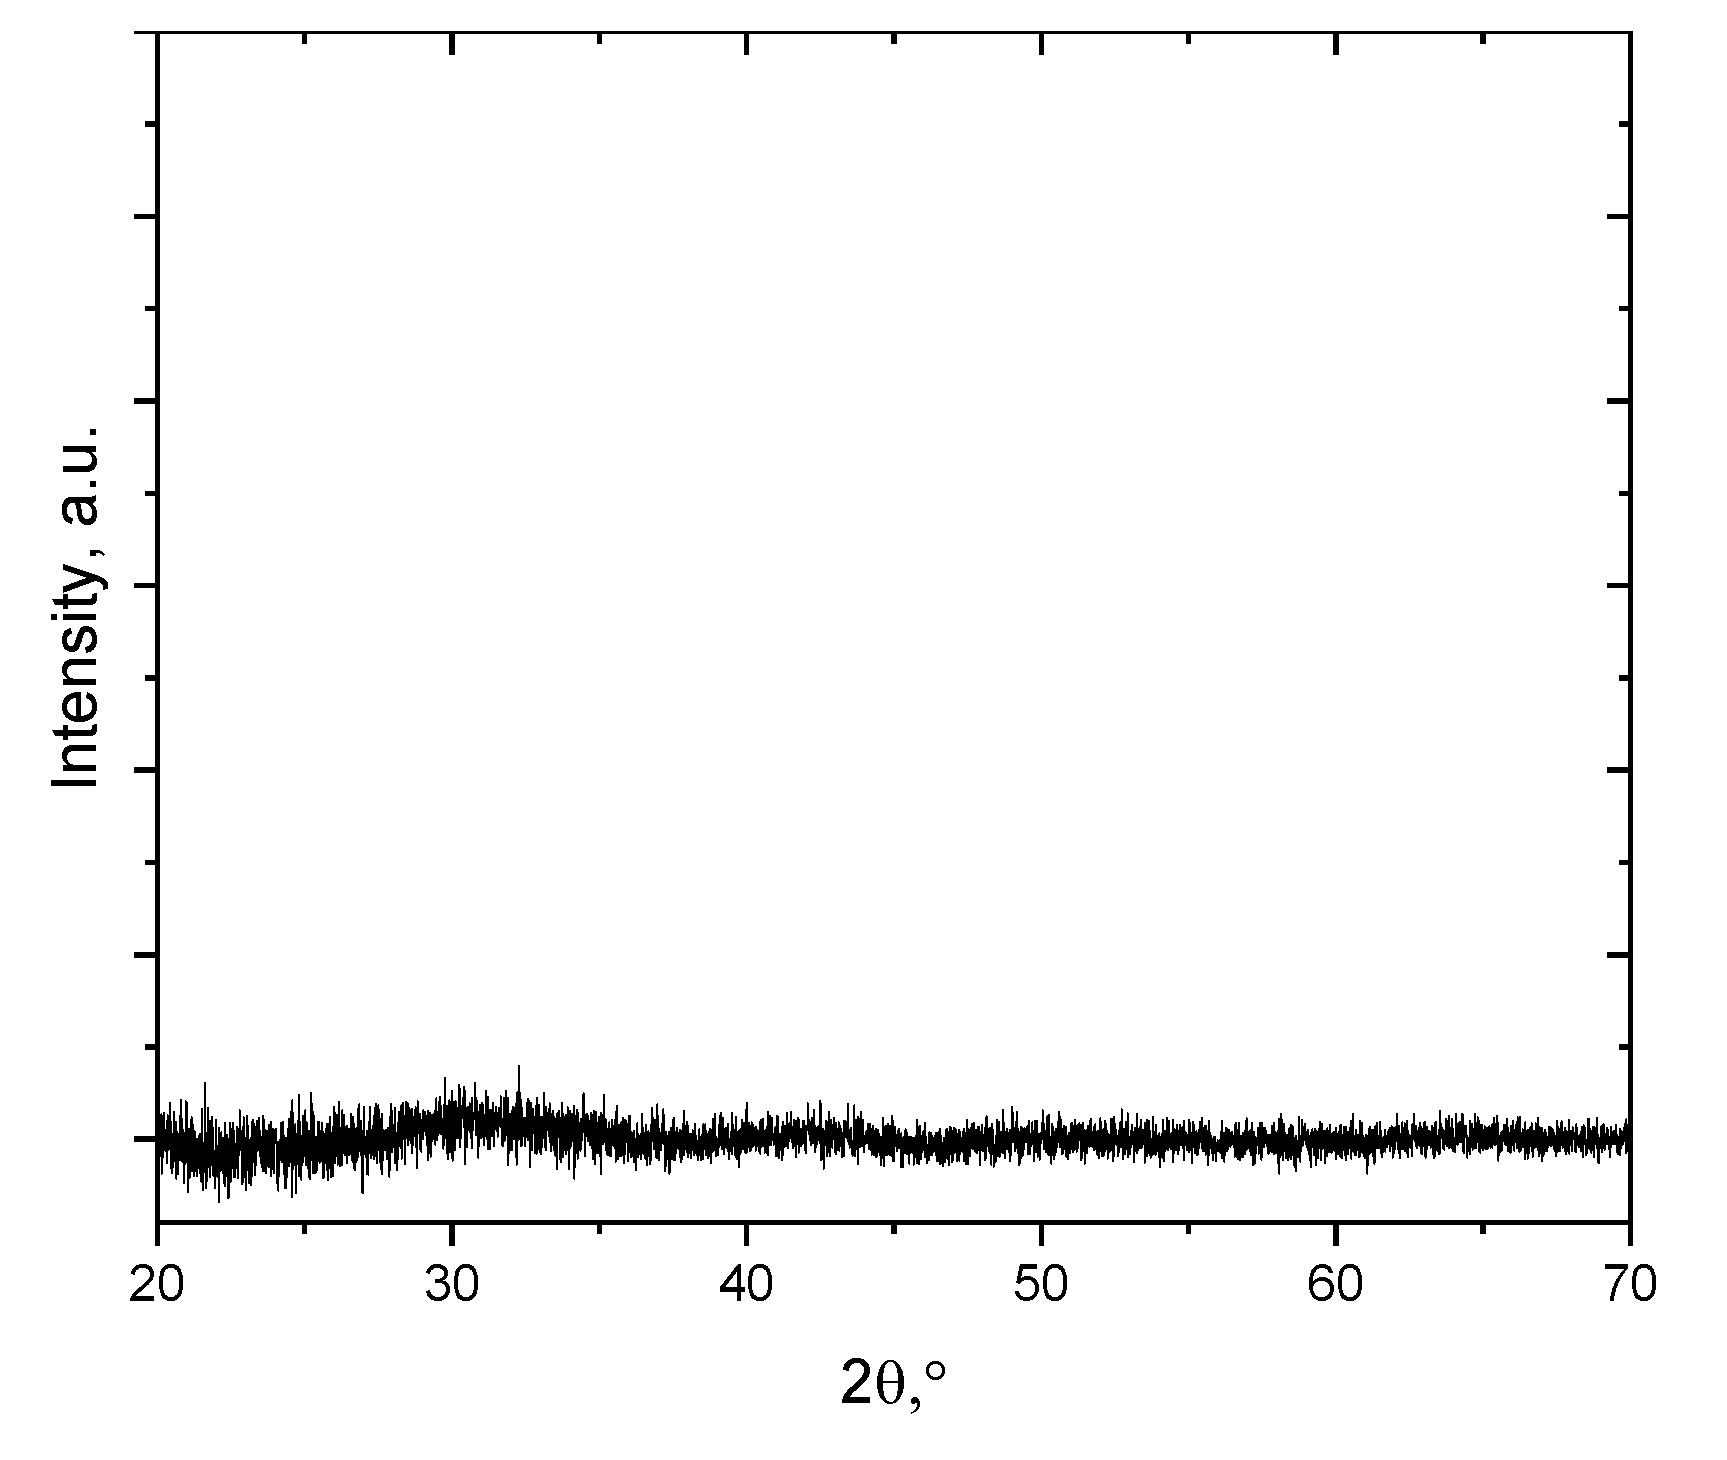
The main parameters for a dopant to be effective as a charge trapper are its concentration and dispersion in TiO2 lattice, as well as its electron configuration. X-ray Diffraction (XRD) analysis shows that deposited TiO2 thin films were amorphous (Figure 3).
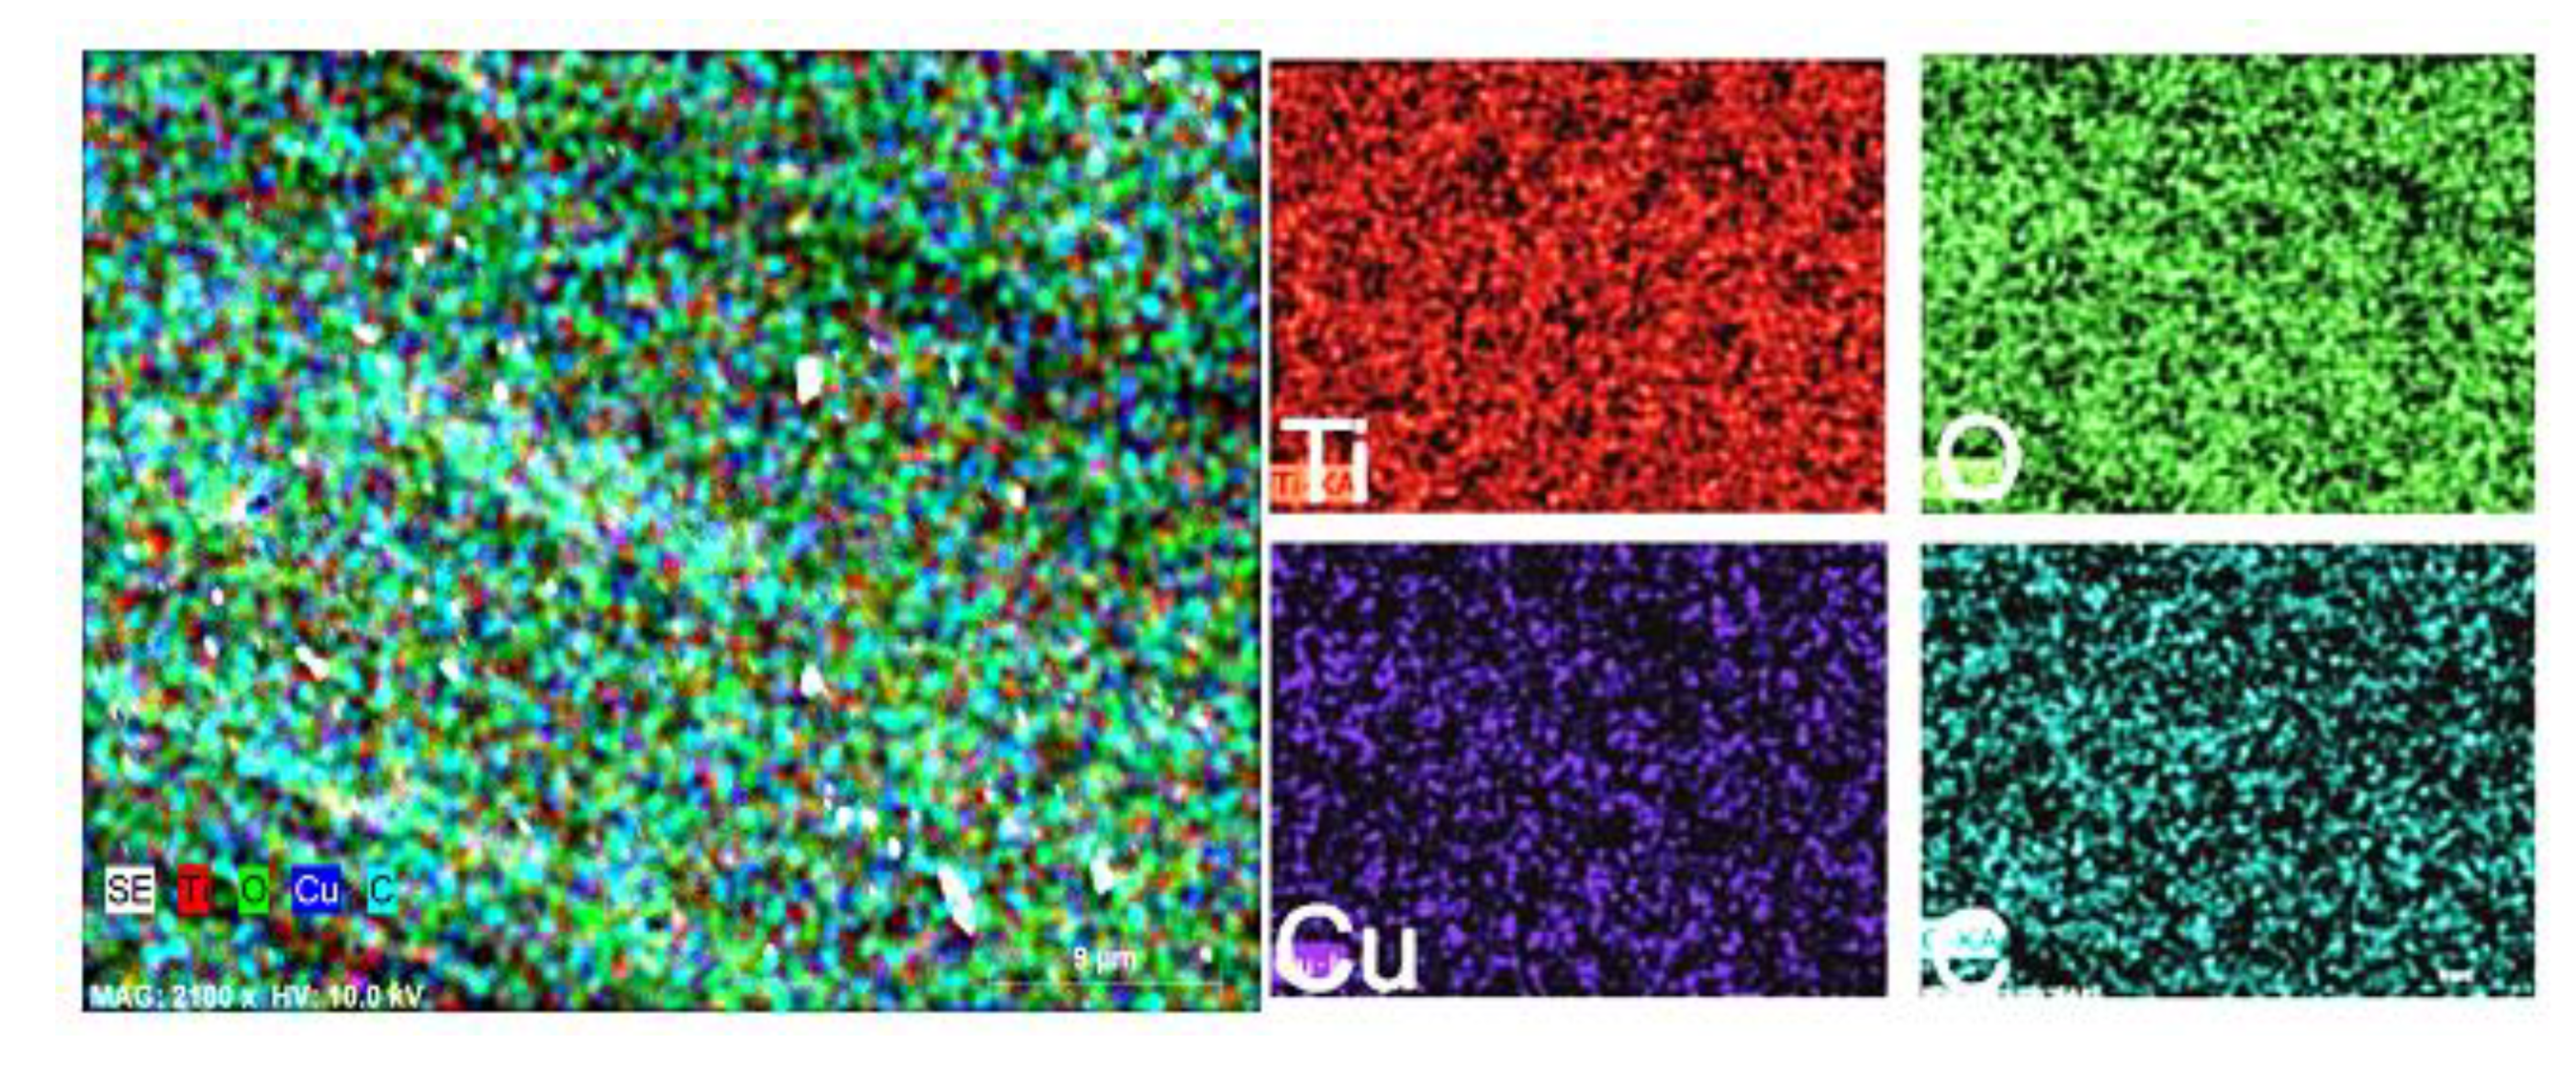
According to elemental analysis (Figure 4), there is a high dispersity of dopant clusters in TiO2 thin films. Cluster dispersity defines photocatalysis efficiency, since dopant clusters act as electron trappers. Based on the results (Table 1) and theory, cluster size and dispersity, as well as photocatalysis efficiency, depend on dopant concentration. Thus, theoretically, the same efficiency could also have a similar dependence on size and dispersity.
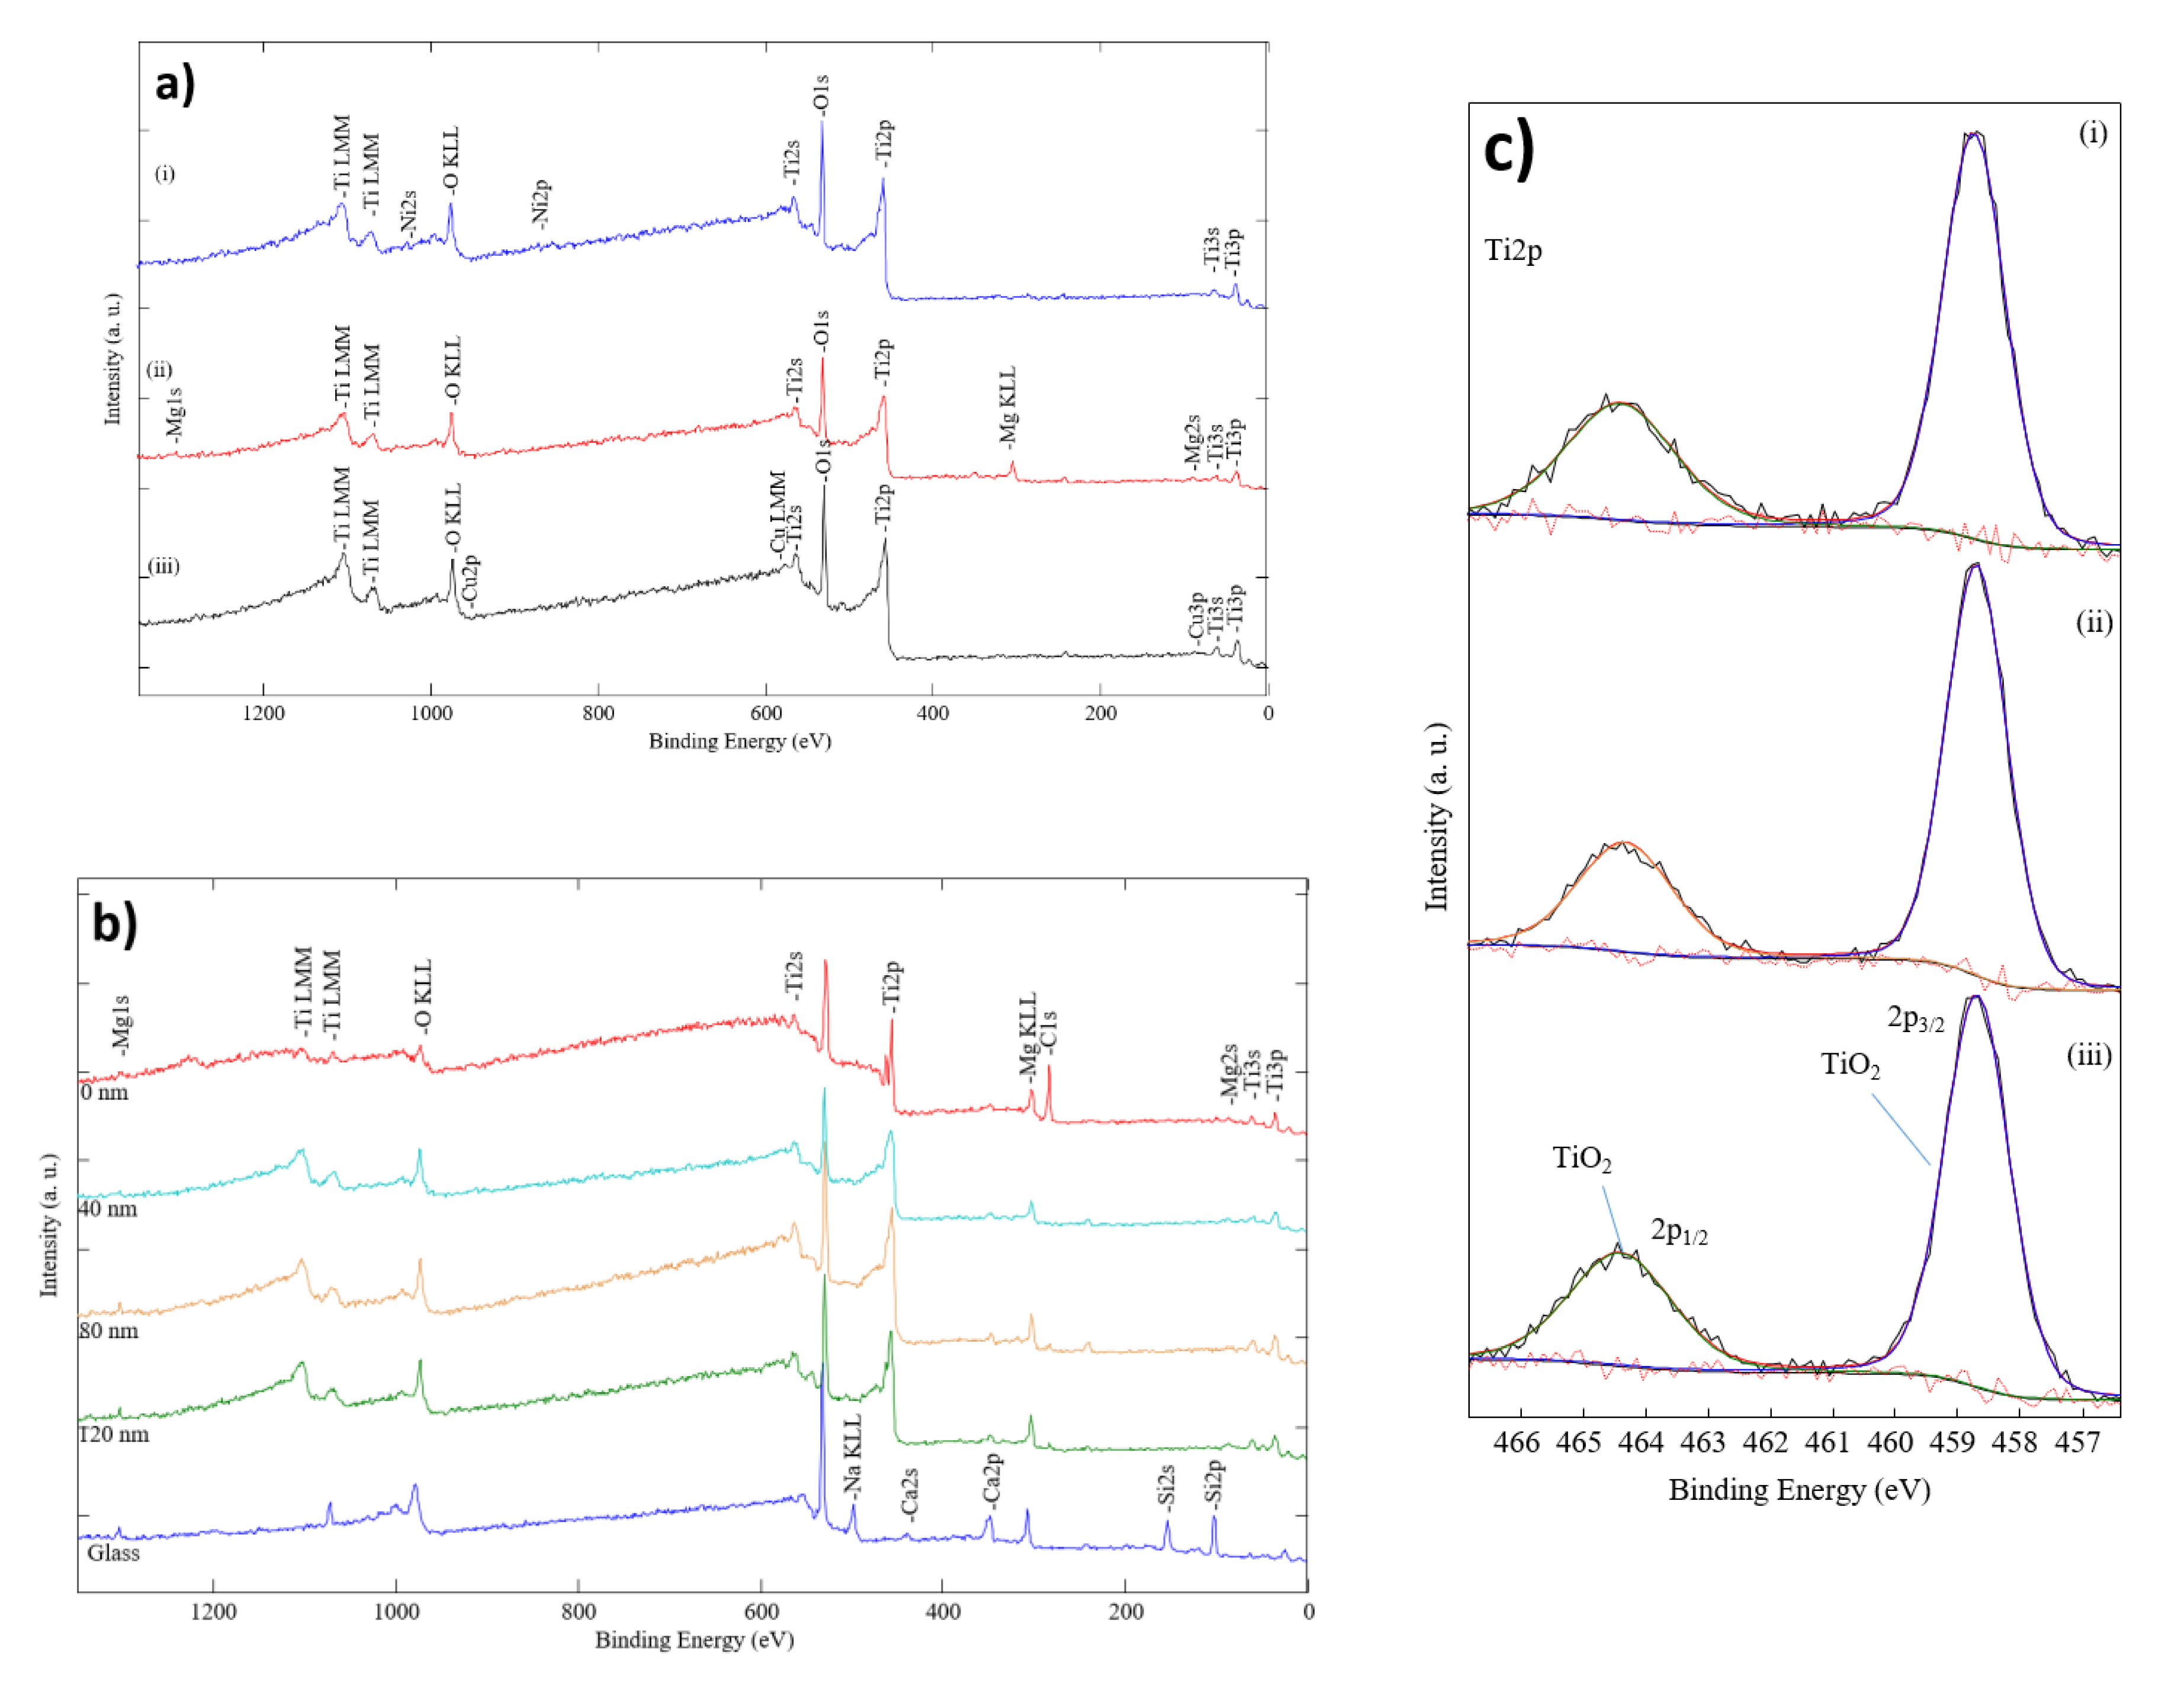
Additionally, XPS analysis was set for samples with a low concentration of dopant in TiO2. The calibration of XPS spectra was done according to the standard value of C 1s peak at 284.8 eV BE (binding energy). The reference data for XPS peaks were taken from the “Thermo Fisher” (Thermo Fisher Scientific Inc.) database. After the calibration, core level peaks of TiO2 (Figure 5c) and dopants (Figure 5a) were measured. Ti 2p3/2 and Ti 2p1/2 peaks are at 458.5 eV and 464.5 eV BE (compared to TiO2 Ti 2p3/2—458.5 eV BE and Ti 2p1/2—464.5 eV BE). The principal Mg KLL Auger peak is at 305 eV BE, accompanied with an Mg 1s peak at 1303 eV BE (ref. Mg 1s—1303 eV BE for Mg metal and 1304.5 eV BE for Mg native oxide). Furthermore, it is hard to distinguish Cu/TiO2 spectra if a Cu2O or Cu structure formed because of low concentration and low peak intensity. Cu 2p1/2 and Cu 2p3/2 peaks are at the same energy value of 933 eV BE and 955 eV BE (accordingly). There is also a weak satellite at 945 eV BE, which helps to separate Cu metal and Cu2O. The Ni 2p3/2 peak is at 855 eV BE (ref. Ni metal—852.6 eV BE; NiO at 853.7 eV BE). The depth profile of doped TiO2 thin films is shown in Figure 5b. In agreement with XPS results, dopants clusters are not oxidized, while the main dopant metal peaks are at the same energy value according to the reference. However, based on the deposition parameters, where an oxygen and argon ratio at 20/80 was used, we consider that at some points, the dopant material could be slightly oxidized.
The evaluation results (Table 1) show that increasing the concentration of dopant above 1 wt % in TiO2 thin films results in a decrease in the efficiency of the photocatalysis process. Although, if the concentration of dopant is lower than 1 wt %, the efficiency increases in the first 20 min of irradiation, while the optimal amount of concentration depends on the dopant itself. In this study, Cu-doped TiO2 reaches maximum efficiency at 0.6 wt %, Ni-doped TiO2 reaches maximum efficiency at 0.5 wt %, and Mg-doped TiO2 reaches maximum efficiency at 0.9 wt %. Therefore, the optimal concentration value suggests that there is an optimal cluster size for maximum efficiency.42 Efficiency dependence on cluster dispersity and size has not been investigated in this study.
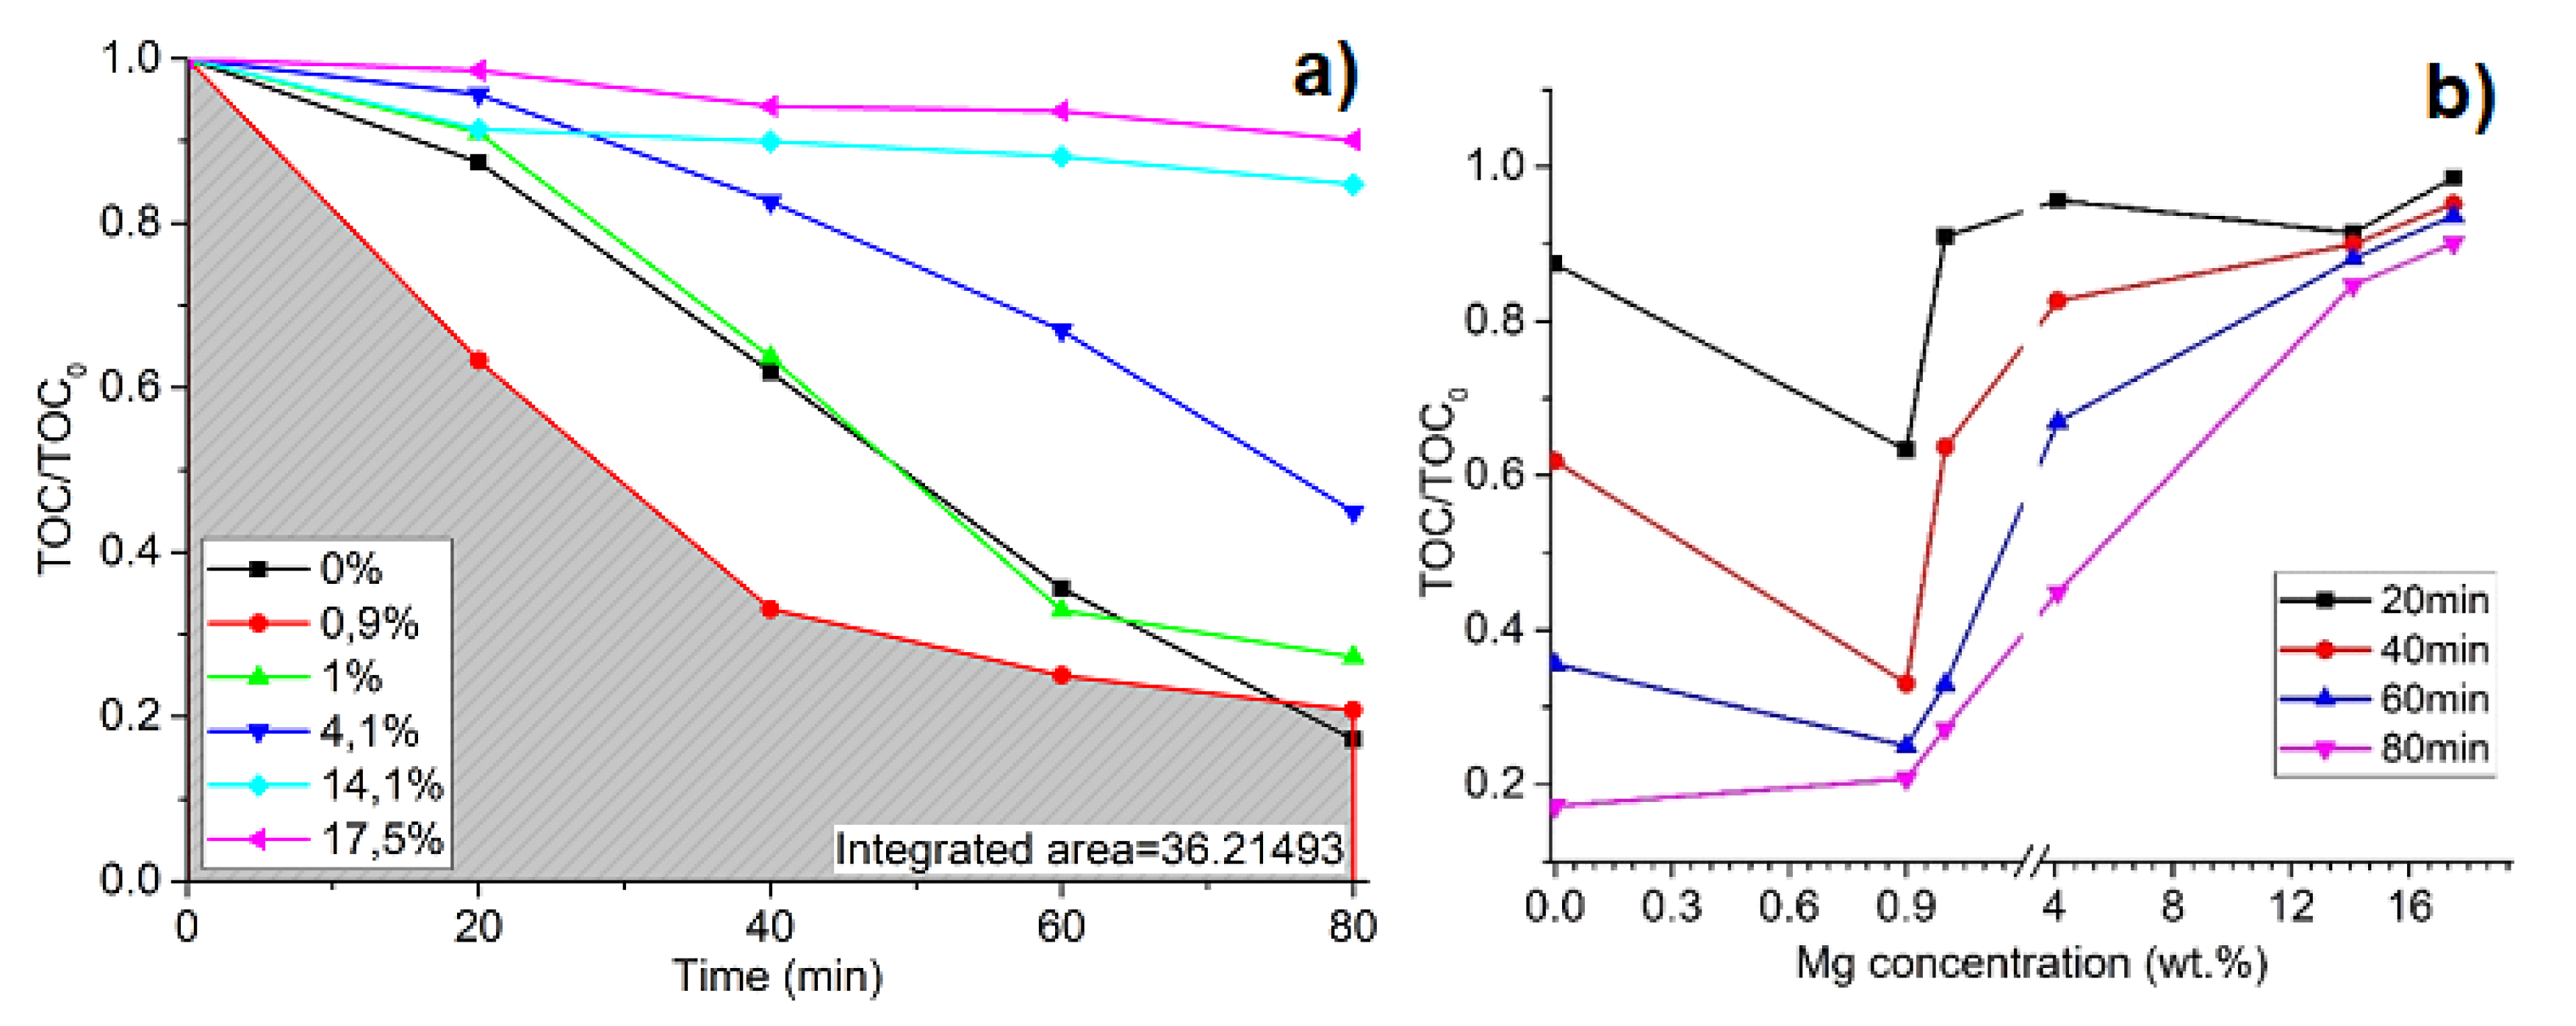
The degradation of oxalic acid in time at different Mg wt % concentrations is shown in Figure 6a. The integrated area under the curve (gray area) indicates the photocatalysis process efficiency as well as apparent rate constant kapp. The smaller the area and the higher the constant, the higher the process efficiency. The calculated values show that the higher efficiency of Mg/TiO2 as a photocatalyst is achieved when the dopant concentration in the TiO2 sample is 0.9 wt % (kapp = 0.01866 min−1). The photocatalysis process dependence on dopant concentration is shown in Figure 6b. Compared to pure TiO2 thin films, kapp drops significantly when the concentration of Mg is increased by more than 1 wt %. There is a peak in concentration where the photocatalysis efficiency reaches maximum values. It could be stated that there should be a peak with a lower concentration of Mg. As Manzanare’s research shows, a small amount of Mg dopant in the TiO2 lattice increases the electron trap (Ti3+) and hole trap (OS) concentration, providing a low recombination of electron–hole pairs [59]. On the other hand, Mg clusters on the TiO2 surface can act as an electron donor for TiO2. In this way, oxygen can be directly affected by injected electrons and followed by easily formed oxygen vacancies on the unstable TiO2 surface [60]. Different concentrations of Mg were used; the most efficient concentration was 0.9 wt %, while 1 wt % was lower but still higher than pure TiO2.
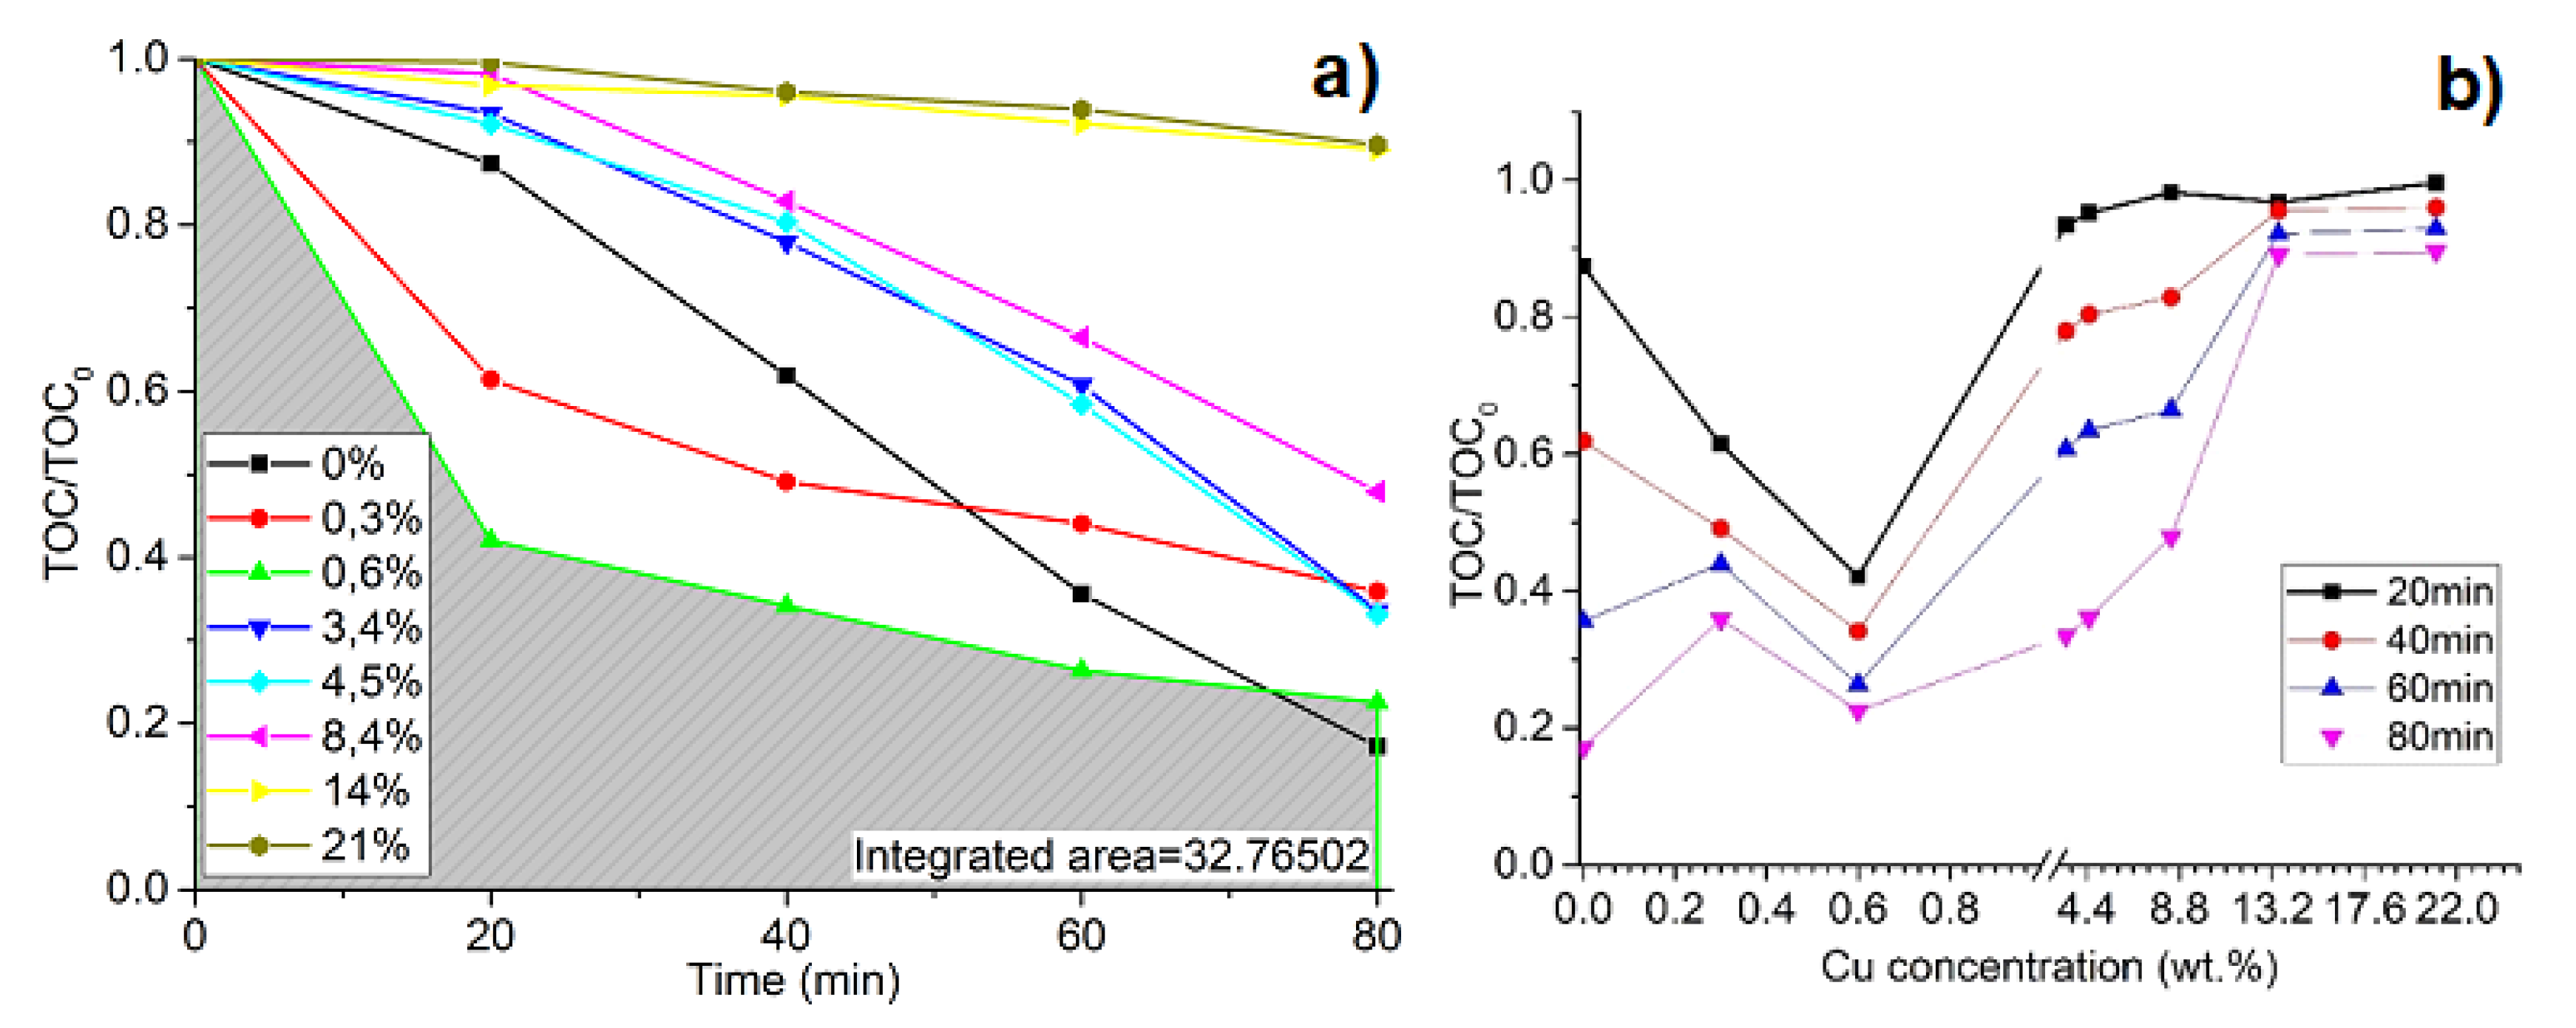
Accordingly, the same measurements were set with Cu and Ni dopants as well. Depending on the integrated area under the curve (Figure 7a), Cu (0.6 wt %) is more efficient as dopant compared to Mg (0.9 wt %). Furthermore, comparing the same samples, after the first 20 min, 58% of solution degraded with Cu/TiO2 and only 37% degraded with Mg/TiO2 (Figure 6b and Figure 7b). Cu concentration values between 0.5 and 0.7 are considered optimal concentrations where the degradation of oxalic acid increases drastically. Decreasing or increasing the Cu concentration in the TiO2 lattice negatively affects the efficiency of the process. The sample with 0.6 wt % of Cu reaches the maximum efficiency (kapp = 0.02221 min−1), while pure TiO2 reaches the maximum efficiency at kapp = 0.01160 min−1, and the sample with 0.3 wt % of Cu reaches the maximum efficiency at kapp = 0.01373 (Table 1). Bensouici’s studies show that the pure TiO2 reaction rate constant is kapp = 0.015 min−1, and it decreases to kapp = 0.001 min−1 for Cu 4 wt % and remains stable for 6–10 wt % Cu-doped TiO2 thin films [61]. In this study, there was a quite huge change in concentration between 0.3 wt % and 2 wt %, while in Minsu Jung’s research [62], a concentration of 0.5 wt % Cu in the TiO2 lattice reaches the highest H2 production rate, and decreasing or increasing this value lowers the production of H2. However, other research states that Cu is not an effective dopant for TiO2 modification. With the increased concentration of Cu in TiO2, the yield of a product decreases, as compared to pure TiO2 [63]. However, analyzing the dependency of dopant concentration on photocatalysis efficiency, low concentrations must be tested by slowly increasing them. According to this statement, Tashibi et al. analyzed 0.2 wt % and 0.9 wt % of Cu in TiO2, skipping the crucial point of approximately 0.5 wt % where photocatalysis efficiency reaches higher values when compared to pure TiO2. Despite that, this research explains the inactivity of Cu-doped TiO2 by the formed CuO on the surface, which decreases the number of active sites of TiO2 as well as becomes a recombination center and increases the rate of the charge carrier recombination. However, the optimal amount of clusters results in the dispersion of them enough to reduce recombination rates and act as charge trappers. The photodegradation of oxalic acid reaches its maximum efficiency when the Cu concentration is 0.6 wt % in TiO2 films, and similar to other studies, the efficiency drops when the concentration is raised or lowered. Different thin film deposition techniques, preparation, and materials (solid, liquid, or gas phase) can cause slightly different results in the experiment. Thin-film parameters such as the crystal size, purity, and surface area apart from the crystal phase rely on deposition techniques, as described earlier in this article. However, a different evaluation method can cause varied results in photocatalysis efficiency.
Ni/TiO2 thin films as photocatalyst results analysis show that the photodegradation of oxalic acid is efficient with 0.5 wt % of Ni in the TiO2 lattice (Figure 8a), but it is similar to pure TiO2 thin films results. After 20 min, only 34% of oxalic acid solution degrades, which is similar to 0.9 wt % Mg, but taking results after 40 min in comparison, for Mg, it is 67% (Figure 6b), and for Ni, it is 43% (Figure 8b). Chen’s [64] studies show that the Ni/TiO2 photocatalyst exhibits the highest photocatalytic activity when the optimal Ni concentration is 0.5 wt %. Experimental results, while using oxalic acid as a solution for the examination of photocatalytic properties, and Ni/TiO2 as the photocatalytic show the same results. Keeping in mind that the degradation process depends on the adsorption of the solution on the surface, increasing the concentration of Ni on TiO2 can result in a decrease in surface irrigation. Other research based on Ni concentration in crystal phase TiO2 shows that there is an optimal concentration of Ni on crystal phase TiO2 as well, with which the photocatalytic efficiency increases drastically. The decrease in efficiency based on the concentration is explained by decreasing the number of active sites of TiO2 on the surface with increased Ni concentration [65]. With the right amount of Ni clusters on the TiO2 surface, Ni acts as a co-catalyst by separating and transferring photogenerated charge carriers, thus decreasing the recombination rates compared to those of pure TiO2 [66].
Based on the results in Figure 6, Figure 7 and Figure 8a, the degradation rate of the oxalic acid solution, while using optimal dopant concentration, drops exponentially. In the first 20–40 min, the degradation rate is higher compared to degradation after 40 min, when the reaction almost stabilizes. After the experiment with Cu (0.3 and 0.6 wt %), Mg (0.9 wt %) and Ni (0.5 wt %) doped TiO2 films, visible surface area degradation was observed. The thin film degradation was not detected using TiO2 with higher dopant concentration. The reactivation of such catalysts has to be taken into account considering the economic implications [67]. The strength of TiO2 films and adherence are relevant for repetitive applications. Investigations on such parameters were done in previous reports [68,69,70,71].
According to EDS mapping results (Figure 4), it can be stated that the PVD method is suitable for the formation of doped TiO2. Figure 4 shows the dispersion uniformity of Cu in TiO2, which means that active centers are dispersed evenly throughout the surface and in inside layers. The top M/TiO2 layer thickness (depending on the dopant) does not exceed 5 nm, and no annealing is done after deposition in order to keep amorphous TiO2.
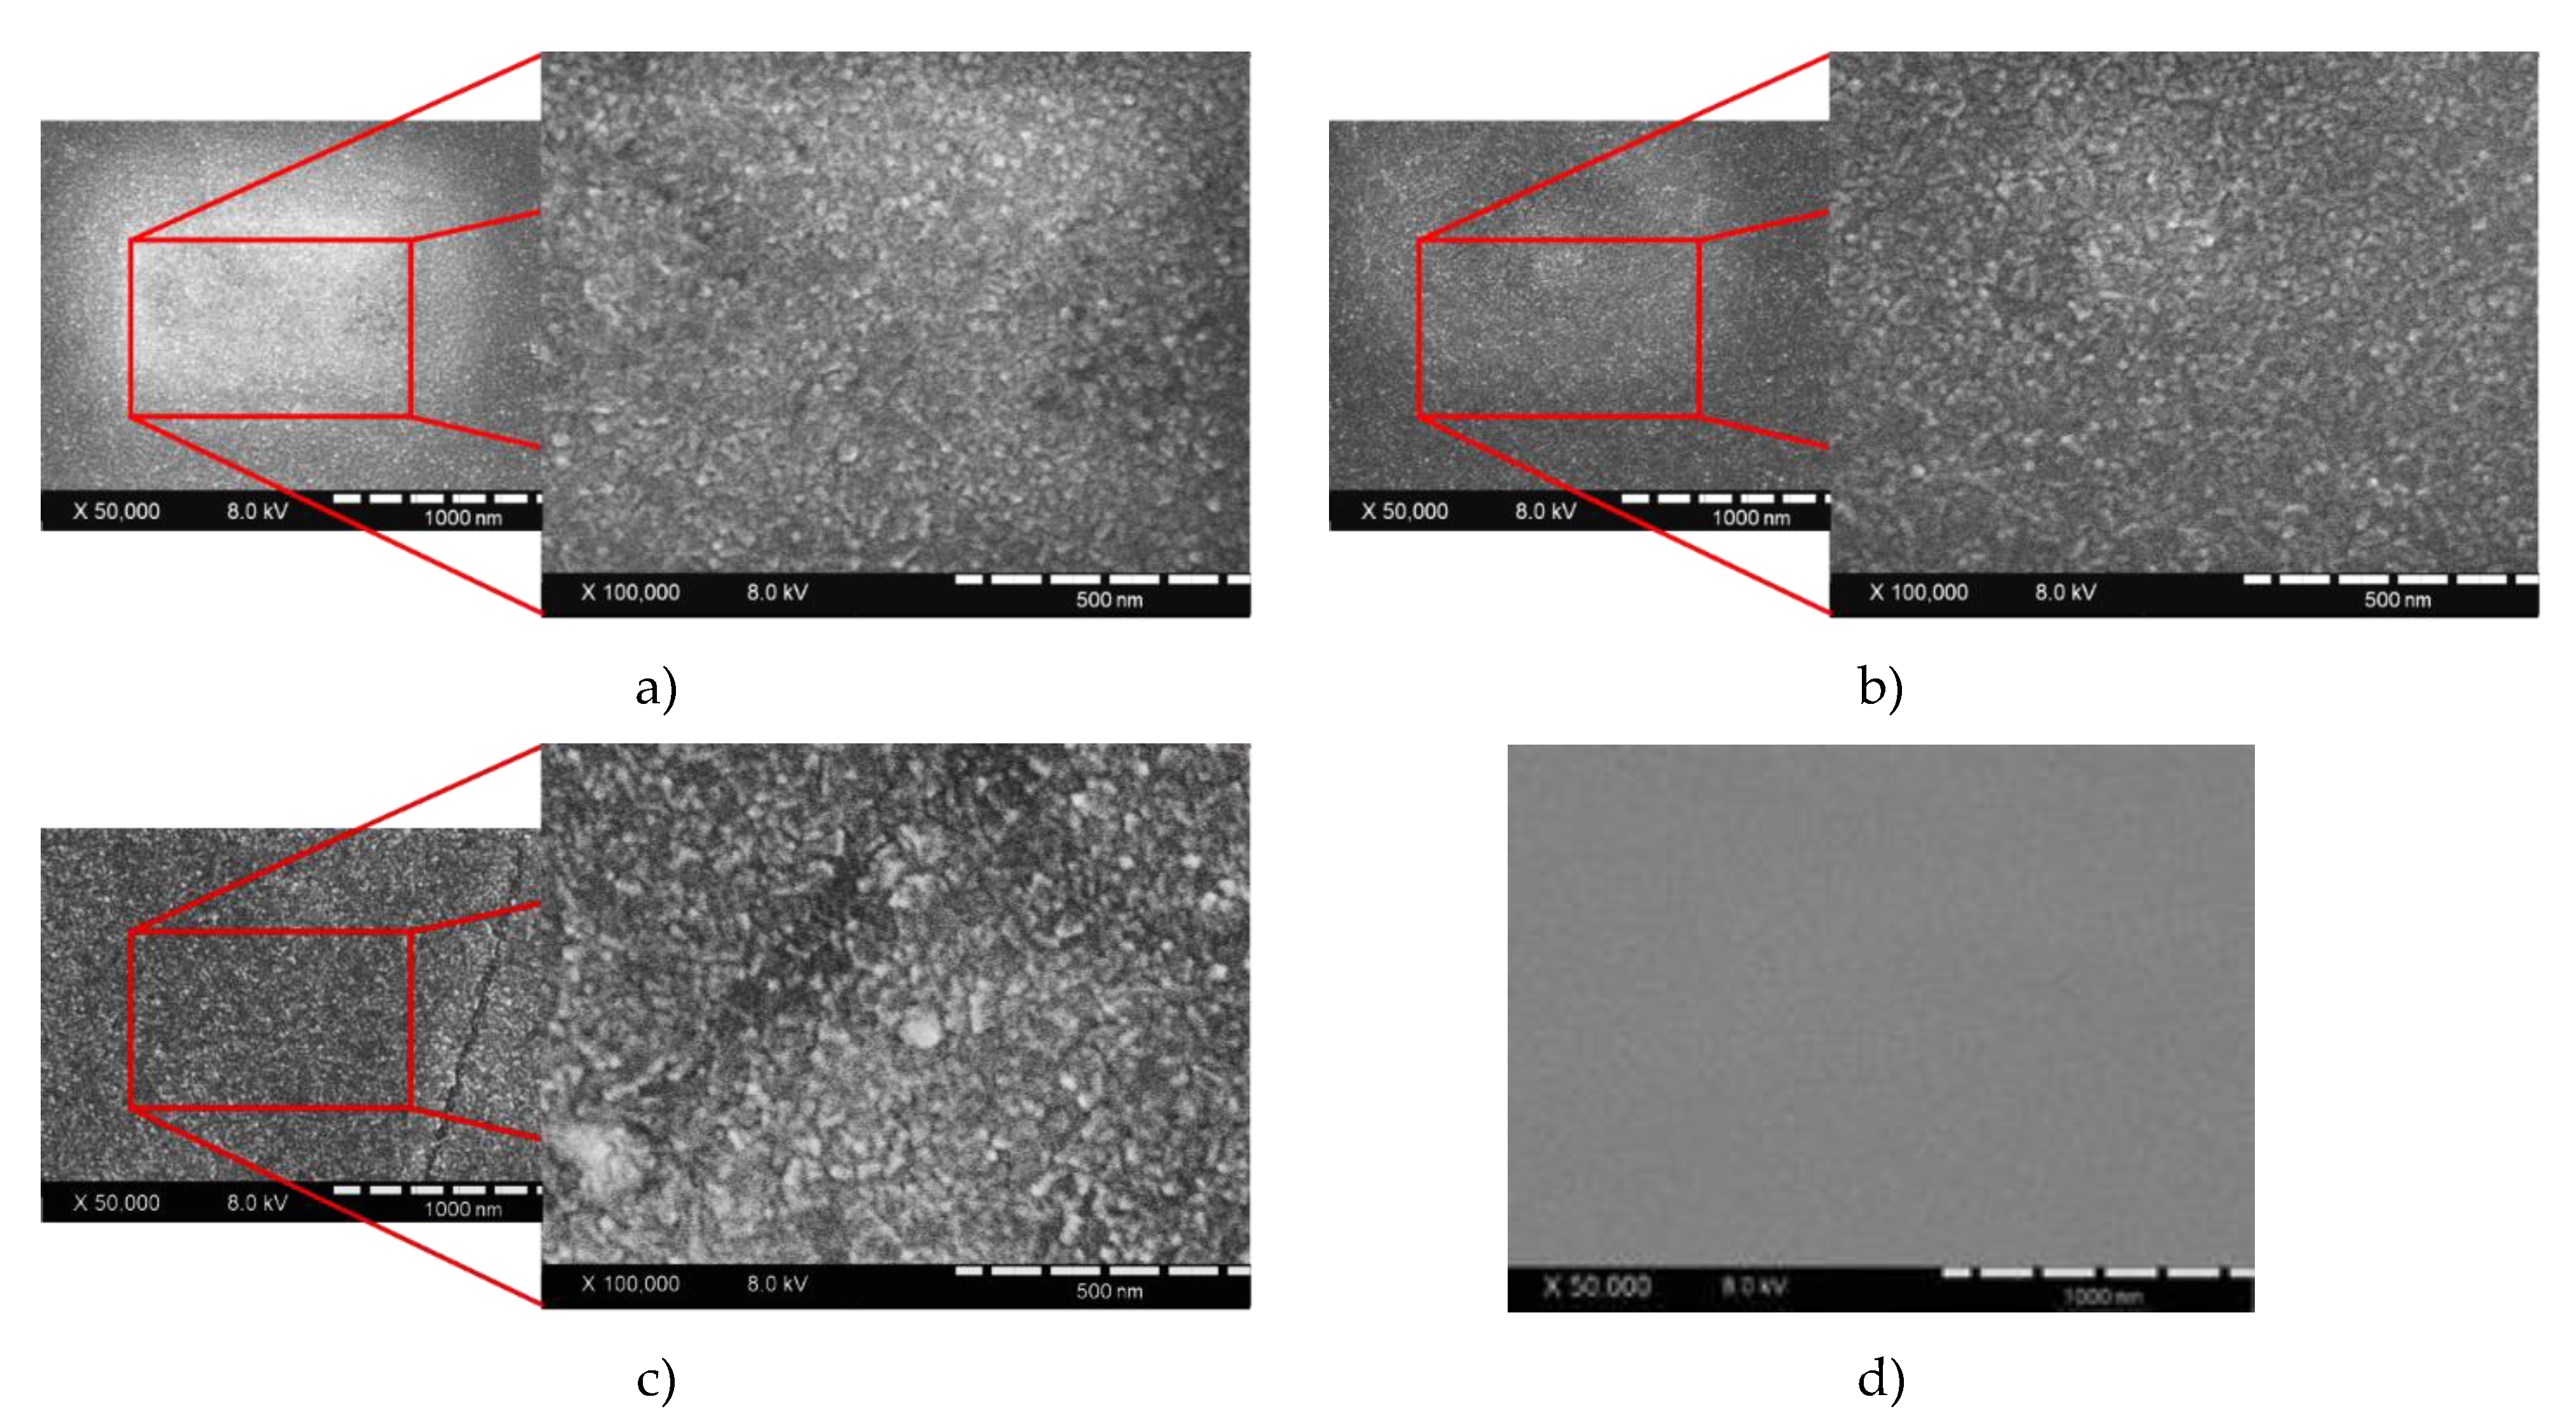
Since there are more charge trappers, a higher number of active centers lead to higher photocatalytic efficiency. Nevertheless, too many active centers can lead to small gaps between them and high recombination rates. It is known that the doping ratio depends on the particle size and cluster forming due to a high number of particles. On the other hand, having too many empty spaces leads to a lack of active centers, and recombination overcomes the charge-trapping process. Correlation between particle size and doping concentration is discussed by Jonathan et al. [72]. The SEM images show that the surface area of doped TiO2 has no defects, which emphasizes that high-quality films are formed via the PVD method. Moreover, according to SEM pictures, it can be noticed that the roughness of doped TiO2 is higher than that of pure TiO2 (Figure 9d). Moreover, the surface roughness of 0.6 wt % Cu/TiO2 (Figure 9c) is higher compared to others (Figure 9a,b), which can also lead to higher efficiency because of the increased surface area. The alignment between the electron work function of metal dopants and Fermi energy levels together with the CBM of TiO2 plays a big role in the photocatalysis mechanism.
The electron work function for dopants are ΦMg = 3.66 eV; ΦNi = 5.04 ÷ 5.35 eV; ΦCu = 4.53 ÷ 5.10 eV; and the TiO2 electron work function is around 4.4 eV (EFEC = 0.5 eV) [73]. Figure 10 shows a visual representation of the alignment of energy values. The differences in the electron work function work as a barrier and a certain amount of energy is required for an electron to overcome it. For Mg, it is 0.74 eV; for Ni, it is 0.64–0.82 eV; and for Cu, it is 0.13–0.5 eV. According to these results, the Mg dopant works as an electron donor, while Ni acts as an acceptor, and Cu could be a donor and acceptor at the same time, with Fermi energy almost aligned with the work function of Cu. These results coincide with previously stated results of the apparent rate constant, which showed that with a certain amount of Cu in TiO2, the photocatalytic activity was highest with the Cu dopant, followed by Mg and Ni [4].

4. Conclusions

The present research suggests that the magnetron sputtering technique is suitable for doped TiO2 film deposition because of its high purity, dopant dispersity in films, and the ability to deposit on a wide range of substrates. Mg-, Cu-, and Ni-doped TiO2 thin films were deposited as photocatalysts on alloy substrate, and the photocatalytic activity was determined by oxalic acid degradation under UV irradiation. Analysis revealed that based on the kapp, with an increased dopant concentration (Mg 0.9 wt % → 4.1 wt %; Cu 0.6 wt % → 3.4 wt %; Ni 0.5 wt % → 3.6 wt %) process efficiency significantly drops accordingly (Mg kapp 0.01866 min−1 → 0.00474 min−1; Cu kapp 0.02221 min−1 → 0.00631 min−1; Ni kapp 0.01317 min−1 → 0.00214 min−1). Equivalent results are with decreased dopant concentration: Cu 0.6 wt % → 0.3 wt %, efficiency drops kapp 0.02221 min−1 → 0.01373 min−1. High photocatalysis efficiency is achieved with low exciton recombination rates. Since high concentration leads to small gaps between the active centers and the recombination process occurs, low concentration leads to a few active centers formed in the sample. Nevertheless, according to the TOC results, followed by the apparent rate constant, the Cu dopant achieved better photocatalysis efficiency compared to the Mg and Ni dopants. This can be explained by the formation of impurity energy levels in the TiO2 band gap.

Author Contributions

Conceptualization, G.L., E.K. and M.S.; methodology, G.L., M.S., V.K. and E.K.; formal analysis, M.S., V.K.; investigation, V.K.; data curation, V.K., G.L.; writing—original draft preparation, V.K.; writing—review and editing, V.K., G.L., M.S., H.M., Y.H.; supervision, G.L., H.M. and Y.H.; project administration, G.L.; funding acquisition, G.L. All authors have read and agreed to the published version of the manuscript.

Funding

This project has received funding from the European Social Fund (project No 09.3.3-LMTK-712-01-0162) under a grant agreement with the Research Council of Lithuania (LMTLT).

Acknowledgments

The authors would like to express their gratitude for the following individuals for their expertise and contribution to the manuscript: Zilvinas Rinkevicius, Minvydas Ragulskis, Kristina Bockute, Marius Kaminskas, and Paulius Palevicius.

Conflicts of Interest

The authors declare no conflict of interest. The funders had no role in the design of the study; in the collection, analyses, or interpretation of data; in the writing of the manuscript, or in the decision to publish the results.

References

  1. European Food Safety Authority. Food Colours: Titanium Dioxide Marks Re-Evaluation Milestone. Available online: https://www.efsa.europa.eu/en/press/news/160914 (accessed on 14 September 2016).
  2. Binas, V.; Venieri, D.; Kotzias, D.; Kiriakidis, G. Modified TiO2 based photocatalysts for improved air and health quality. J. Mater. 2017, 3, 3–16. [Google Scholar]
  3. Daghrir, R.; Drogui, P.; Robert, D. Modified TiO2 for environmental photocatalytic applications: A Review. Ind. Eng. Chem. Res. 2013, 52, 3581–3599. [Google Scholar] [CrossRef]
  4. Khairy, M.; Zakaria, W. Effect of metal-doping of TiO2 nanoparticles on their photocatalytic activities toward removal of organic dyes. Egypt. J. Pet. 2014, 23, 419–426. [Google Scholar] [CrossRef] [Green Version]
  5. Zhao, J.; Yang, X. Photocatalytic oxidation for indoor air purification: A literature review. Build. Environ. 2003, 38, 645–654. [Google Scholar] [CrossRef]
  6. Li, R. Latest progress in hydrogen production from solar water splitting via photocatalysis, photoelectrochemical, and photovoltaic-photoelectrochemical solutions. Chinese J. Catal. 2017, 38, 5–12. [Google Scholar] [CrossRef]
  7. Nosaka, Y. Solar cells and photocatalysts. Compr. Nanosci. Technol. 2011, 1, 571–605. [Google Scholar]
  8. Mansoob Khan, M.; Farooq Adil, S.; Al-Mayouf, A. Metal oxides as photocatalysts. J. Saudi Chem. Soc. 2015, 19, 462–464. [Google Scholar] [CrossRef] [Green Version]
  9. Yu, S.; Zhou, Y. Photochemical decomposition of hydrogen sulfide. Adv. Catal. Mater. Photocatal. Other Curr. Trends 2016, 3, 269–293. [Google Scholar]
  10. Wu, C.-H. Comparison of azo dye degradation efficiency using UV/single semiconductor and UV/coupled semiconductor systems. Chemosphere 2004, 57, 601–608. [Google Scholar] [CrossRef]
  11. Okamoto, K.; Yamamoto, Y.; Tanaka, H.; Itaya, A. Kinetics of Heterogeneous Photocatalytic Decomposition of Phenol over Anatase TiO2 Powder. Bull. Chem. Soc. Jpn. 1985, 58, 2023–2028. [Google Scholar] [CrossRef] [Green Version]
  12. Sakthi, S.; Neppolian, B.; Arabindoo, B.; Palanichamy, M.; Murugesan, V. TiO2 catalysed photodegradation of leather dye, acid green 16. Journ al Sci. Ind. Res. 2000, 59, 556–562. [Google Scholar]
  13. Yildiz, A.; Lisesivdin, S.B.B.B.; Kasap, M.; Mardare, D. Electrical properties of TiO2 thin films. J. Non. Cryst. Solids 2008, 354, 4944–4947. [Google Scholar] [CrossRef]
  14. Kumar, S.G.; Devi, L.G. Review on modified TiO2 photocatalysis under UV/Visible light: Selected results and related mechanisms on interfacial charge carrier transfer dynamics. J. Phys. Chem. A 2011, 115, 13211–13241. [Google Scholar] [CrossRef] [PubMed]
  15. Dette, C.; Pérez-Osorio, M.A.; Kley, C.S.; Punke, P.; Patrick, C.E.; Jacobson, P.; Giustino, F.; Jung, S.J.; Kern, K. TiO2 anatase with a bandgap in the visible region. Nano Lett. 2014, 14, 6533–6538. [Google Scholar] [CrossRef]
  16. Abdullah, H.; Khan, M.M.R.; Ong, H.R.; Yaakob, Z. Modified TiO2 photocatalyst for CO2 photocatalytic reduction: An overview. J. CO2 Util. 2017, 22, 15–32. [Google Scholar] [CrossRef]
  17. Evtushenko, Y.M.; Romashkin, S.V.; Trofimov, N.S.; Chekhlova, T.K. Optical properties of TiO2 thin films. Phys. Procedia 2015, 73, 100–107. [Google Scholar] [CrossRef] [Green Version]
  18. Kaneco, S.; Shimizu, Y.; Ohta, K.; Mizuno, T. Photocatalytic reduction of high pressure carbon dioxide using TiO2 powders with a positive hole scavenger. J. Photochem. Photobiol. A Chem. 1998, 115, 223–226. [Google Scholar] [CrossRef]
  19. Chen, X.; Mao, S.S. Titanium dioxide nanomaterials: Synthesis, properties, modifications, and applications. Chem. Rev. 2007, 107, 2891–2959. [Google Scholar] [CrossRef]
  20. Castellote, M.; Bengtsson, N. Principles of TiO2 Photocatalysis. Applications of Titanium Dioxide Photocatalysis to Construction Materials: State-of-the-Art Report of the RILEM Technical Committee 194-TDP; Springer: Dordrecht, the Netherlands, 2011; pp. 5–10. [Google Scholar]
  21. Reyes-Coronado, D.; Rodríguez-Gattorno, G.; Espinosa-Pesqueira, M.E.; Cab, C.; de Coss, R.D.; Oskam, G. Phase-pure TiO2 nanoparticles: Anatase, brookite and rutile. IOP Publ. Nanotechnol. Nanotechnol. 2008, 19, 145605–145610. [Google Scholar]
  22. Wan, L.; Li, J.F.F.; Feng, J.Y.Y.; Sun, W.; Mao, Z.Q.Q. Anatase TiO2 films with 2.2 eV band gap prepared by micro-arc oxidation. Mater. Sci. Eng. B 2007, 139, 216–220. [Google Scholar] [CrossRef]
  23. Shang, C.; Zhao, W.-N.; Liu, Z.-P. Searching for new TiO2 crystal phases with better photoactivity. J. Phys. Condens. Matter 2015, 27, 134203. [Google Scholar] [CrossRef] [PubMed]
  24. De Angelis, F.; Di Valentin, C.; Fantacci, S.; Vittadini, A.; Selloni, A. Theoretical studies on anatase and less common TiO2 phases: Bulk, surfaces, and nanomaterials. Chem. Rev. 2014, 114, 9708–9753. [Google Scholar] [CrossRef] [PubMed]
  25. Zhou, X.-T.; Ji, H.-B.; Huang, X.-J. Photocatalytic degradation of methyl orange over metalloporphyrins supported on TiO2 Degussa P25. Molecules 2012, 17, 1149–1158. [Google Scholar] [CrossRef] [PubMed] [Green Version]
  26. Rui, Z.; Wu, S.; Peng, C.; Ji, H. Comparison of TiO2 Degussa P25 with anatase and rutile crystalline phases for methane combustion. Chem. Eng. J. 2014, 243, 254–264. [Google Scholar] [CrossRef]
  27. Bakardjieva, S.; Šubrt, J.; Štengl, V.; Dianez, M.J.; Sayagues, M.J. Photoactivity of anatase–rutile TiO2 nanocrystalline mixtures obtained by heat treatment of homogeneously precipitated anatase. Appl. Catal. B Environ. 2005, 58, 193–202. [Google Scholar] [CrossRef]
  28. Morgan, B.J.; Watson, G.W. Intrinsic n-type defect formation in TiO2: A comparison of rutile and anatase from GGA+U calculations. J. Phys. Chem. C 2010, 114, 2321–2328. [Google Scholar] [CrossRef]
  29. Ohno, T.; Tsubota, T.; Toyofuku, M.; Inaba, R. Photocatalytic activity of a TiO2 photocatalyst doped with C4+ and S4+ ions having a rutile phase under visible light. Catal. Letters 2004, 98, 255–258. [Google Scholar] [CrossRef] [Green Version]
  30. Prasai, B.; Cai, B.; Underwood, M.K.; Lewis, J.P.; Drabold, D.A. Properties of amorphous and crystalline titanium dioxide from first principles. J. Mater. Sci. 2012, 47, 7515–7521. [Google Scholar] [CrossRef]
  31. Huang, J.; Liu, Y.; Lu, L.; Li, L. The photocatalytic properties of amorphous TiO2 composite films deposited by magnetron sputtering. Res. Chem. Intermed. 2012, 38, 487–498. [Google Scholar] [CrossRef]
  32. Liu, H.Y.; Hsu, Y.L.; Su, H.Y.; Huang, R.C.; Hou, F.Y.; Tu, G.C.; Liu, W.H. A comparative study of amorphous, anatase, rutile, and mixed phase TiO2 films by mist chemical vapor deposition and ultraviolet photodetectors applications. IEEE Sens. J. 2018, 18, 4022–4029. [Google Scholar] [CrossRef]
  33. Kaur, K.; Singh, C.V. Amorphous TiO2 as a photocatalyst for hydrogen production: A DFT study of structural and electronic properties Selection and/or peer-review under responsibility of Canadian Hydrogen and Fuel Cell Association. Energy Procedia 2012, 29, 291–299. [Google Scholar] [CrossRef] [Green Version]
  34. Khramov, E.; Kotolevich, Y.; Ramos, J.G.; Pestryakov, A.; Zubavichus, Y.; Bogdanchikova, N. Amorphization of Degussa nanosized TiO2 caused by its modification. Fuel 2018, 234, 312–317. [Google Scholar] [CrossRef]
  35. Hu, S.; Shaner, M.R.; Beardslee, J.A.; Lichterman, M.; Brunschwig, B.S.; Lewis, N.S. Amorphous TiO2 coatings stabilize Si, GaAs, and GaP photoanodes for efficient water oxidation. Science 2014, 344, 1005–1009. [Google Scholar] [CrossRef] [PubMed] [Green Version]
  36. Nakamura, M.; Kato, S.; Aoki, T.; Sirghi, L.; Hatanaka, Y. Role of terminal OH groups on the electrical and hydrophilic properties of hydro-oxygenated amorphous TiOx: OH thin films. J. Appl. Phys. 2001, 90, 3391–3395. [Google Scholar] [CrossRef]
  37. Ohtani, B.; Ogawa, Y. Nishimoto, Photocatalytic Activity of Amorphous-Anatase Mixture of Titanium(IV) Oxide Particles Suspended in Aqueous Solutions. J. Phys. Chem. B 1997, 5647, 3746–3752. [Google Scholar] [CrossRef] [Green Version]
  38. Brinker, C.J.; Frye, G.C.; Hurd, A.J.; Ashley, C.S. Fundamentals of sol-gel dip coating. Thin Solid Films 1991, 201, 97–108. [Google Scholar] [CrossRef]
  39. Kavaliunas, V.; Sestakauskaite, A.; Sriubas, M.; Laukaitis, G. Influence of Deposition Parameters on the Structure of TiO2 thin Films Prepared by Reactive Magnetron Sputtering Technique. Recent Advances in Technology Research and Education; Springer: Cham, Switzerland, 2018; pp. 49–57. [Google Scholar]
  40. Senthil, T.S.; Muthukumarasamy, N.; Agilan, S.; Thambidurai, M.; Balasundaraprabhu, R. Preparation and characterization of nanocrystalline TiO2 thin films prepared By sol-gel spin coating method. Mater. Sci. Eng. B 2010, 174, 102–104. [Google Scholar] [CrossRef]
  41. Lin, H.; Huang, C.P.; Li, W.; Ni, C.; IsmatShah, S.; Yao-Hsuan, T. Size dependency of nanocrystalline TiO2 on its optical property and photocatalytic reactivity exemplified by 2-chlorophenol. Appl. Catal. B Environ. 2006, 68, 1–11. [Google Scholar] [CrossRef]
  42. Tan, R.-J.; Tseng, Y.-H.; Kuo, C.-H. Crystal size control of TiO2 using experimental strategies in sol–gel process. Micro Nano Lett. 2010, 5, 361. [Google Scholar] [CrossRef]
  43. Karkare, M.M. Estimation of band gap and particle size of TiO2 nanoparticle synthesized using sol gel technique. In Proceedings of the 2014 International Conference on Advances in Communication and Computing Technologies (ICACACT 2014), Mumbai, India, 10–11 August 2014; pp. 2–6. [Google Scholar]
  44. Schneider, J.; Matsuoka, M.; Takeuchi, M.; Zhang, J.; Horiuchi, Y.; Anpo, M.; Bahnemann, D.W. Understanding TiO2 photocatalysis: Mechanisms and materials. Chem. Rev. 2014, 114, 9919–9986. [Google Scholar] [CrossRef]
  45. Damm, C.; Herrmann, R.; Israel, G.; Müller, F.W. Acrylate photopolymerization on heterostructured TiO2 photocatalysts. Dye. Pigment. 2007, 74, 335–342. [Google Scholar] [CrossRef]
  46. Yuvaraj, H.; Park, E.J.; Gal, Y.-S.; Lim, K.T. Synthesis and characterization of polypyrrole–TiO2 nanocomposites in supercritical CO2. Colloids Surfaces A Physicochem. Eng. Asp. 2008, 313, 300–303. [Google Scholar] [CrossRef]
  47. Cho, S.; Choi, W. Solid-phase photocatalytic degradation of PVC–TiO2 polymer composites. J. Photochem. Photobiol. A Chem. 2001, 143, 221–228. [Google Scholar] [CrossRef]
  48. Varnagiris, S.; Medvids, A.; Lelis, M.; Milcius, D.; Antuzevics, A. Black carbon-doped TiO2 films: Synthesis, characterization and photocatalysis. J. Photochem. Photobiol. A Chem. 2019, 382, 111941. [Google Scholar] [CrossRef]
  49. Dariani, R.S.; Esmaeili, A.; Mortezaali, A.; Dehghanpour, S. Photocatalytic reaction and degradation of methylene blue on TiO2 nano-sized particles. Opt. Int. J. Light Electron Opt. 2016, 127, 7143–7154. [Google Scholar] [CrossRef]
  50. Al-Shamali, S.S. Photocatalytic degradation of methylene blue in the presence of TiO2 catalyst assisted solar radiation. Aust. J. Basic Appl. Sci. 2013, 7, 172–176. [Google Scholar]
  51. Huang, H.; Gu, X.; Zhou, J.; Ji, K.; Liu, H.; Feng, Y. Photocatalytic degradation of Rhodamine B on TiO2 nanoparticles modified with porphyrin and iron-porphyrin. Catal. Commun. 2009, 11, 58–61. [Google Scholar] [CrossRef]
  52. Mazlina, T.; Darus, M.; Muktar, J. Degradation of Rhodamine B dye by TiO2 nanotubes photocatalyst synthesized via alkaline hydrothermal method. MATEC Web Conf. 2015, 27. [Google Scholar] [CrossRef] [Green Version]
  53. Bin Mukhlish, M.Z.; Najnin, F.; Rahman, M.M.; Uddin, M.J. Photocatalytic degradation of different dyes using TiO2 with high surface area: A kinetic study. J. Sci. Res. 2013, 5, 301–314. [Google Scholar] [CrossRef] [Green Version]
  54. Guo, J.; Yuan, S.; Jiang, W.; Yue, H.; Cui, Z.; Liang, B. Adsorption and photocatalytic degradation behaviors of rhodamine dyes on surface-fluorinated TiO2 under visible irradiation. RSC Adv. 2016, 6, 4090–4100. [Google Scholar] [CrossRef]
  55. Barka, N.; Qourzal, S.; Assabbane, A.; Nounah, A.; Ait-Ichou, Y. Factors influencing the photocatalytic degradation of Rhodamine B by TiO2-coated non-woven paper. J. Photochem. Photobiol. A Chem. 2008, 195, 346–351. [Google Scholar] [CrossRef]
  56. Ollis, D.F. Kinetics of liquid phase photocatalyzed reactions: An illuminating approach. J. Phys. Chem. B 2005, 109, 2439–2444. [Google Scholar] [CrossRef] [PubMed]
  57. Emeline, A.V.; Rudakova, A.V.; Ryabchuk, V.K.; Serpone, N. Photostimulated reactions at the surface of wide band-gap metal oxides (ZrO2 and TiO2): Interdependence of rates of reactions on pressure−concentration and on light intensity. J. Phys. Chem. B 1998, 102, 10906–10916. [Google Scholar] [CrossRef]
  58. Villarreal, T.L.; Gomez, R.; Neumann-Spallart, M.; Alonso-Vante, N.; Salvador, P. Semiconductor photooxidation of pollutants dissolved in water: A kinetic model for distinguishing between direct and indirect interfacial hole transfer. I. Photoelectrochemical experiments with polycrystalline anatase electrodes under current doubling and absence of recombination. J. Phys. Chem. B 2004, 108, 15172–15181. [Google Scholar]
  59. Manzanares, M.; Fàbrega, C.; Ossó, J.O.; Vega, L.F.; Andreu, T.; Morante, J.R. Engineering the TiO2 outermost layers using magnesium for carbon dioxide photoreduction. Appl. Catal. B Environ. 2014, 150, 57–62. [Google Scholar] [CrossRef]
  60. Zu, D.; Xu, Z.; Zhang, A.; Wang, H.; Wei, H.; Ou, G.; Huang, K.; Zhang, R.; Li, L.; Hu, S.; et al. Room temperature Mg reduction of TiO2: Formation mechanism and application in photocatalysis. Chem. Commun. 2019, 55, 7675–7678. [Google Scholar] [CrossRef]
  61. Bensouici, F.; Bououdina, M.; Dakhel, A.A.; Tala-Ighil, R.; Tounane, M.; Iratni, A.; Souier, T.; Liu, S.; Cai, W. Optical, structural and photocatalysis properties of Cu-doped TiO2 thin films. Appl. Surf. Sci. 2017, 395, 110–116. [Google Scholar] [CrossRef]
  62. Jung, M.; Scott, J.; Ng, Y.H.; Jiang, Y.; Amal, R. CuOx dispersion and reducibility on TiO2 and its impact on photocatalytic hydrogen evolution. Int. J. Hydrogen Energy 2014, 39, 12499–12506. [Google Scholar] [CrossRef]
  63. Tasbihi, M.; Kočí, K.; Troppová, I.; Edelmannová, M.; Reli, M.; Čapek, L.; Schomäcker, R. Photocatalytic reduction of carbon dioxide over Cu/TiO2 photocatalysts. Environ. Sci. Pollut. Res. 2018, 25, 34903–34911. [Google Scholar] [CrossRef] [PubMed]
  64. Chen, W.T.; Chan, A.; Sun-Waterhouse, D.; Moriga, T.; Idriss, H.; Waterhouse, G.I. Ni/TiO2: A promising low-cost photocatalytic system for solar H2 production from ethanol-water mixtures. J. Catal. 2015, 326, 43–53. [Google Scholar] [CrossRef]
  65. Yu, J.; Hai, Y.; Cheng, B. Enhanced photocatalytic H2-production activity of TiO2 by Ni(OH)2 cluster modification. J. Phys. Chem. C 2011, 115, 4953–4958. [Google Scholar] [CrossRef]
  66. Wang, Y.; Zhao, J.; Xiong, X.; Liu, S.; Xu, Y. Role of Ni2+ ions in TiO2 and Pt/TiO2 photocatalysis for phenol degradation in aqueous suspensions. Appl. Catal. B Environ. 2019, 258, 117903. [Google Scholar] [CrossRef]
  67. Miranda-García, N.; Suárez, S.; Maldonado, M.I.; Malato, S.; Sánchez, B. Regeneration approaches for TiO2 immobilized photocatalyst used in the elimination of emerging contaminants in water. Catal. Today 2014, 230, 27–34. [Google Scholar] [CrossRef]
  68. Cunha, D.L.; Kuznetsov, A.; Achete, C.A.; da Hora Machado, A.E.; Marques, M. Immobilized TiO2 on glass spheres applied to heterogeneous photocatalysis: Photoactivity, leaching and regeneration process. PeerJ 2018, 6, e4464. [Google Scholar] [CrossRef] [Green Version]
  69. Nakata, K.; Fujishima, A. TiO2 photocatalysis: Design and applications. J. Photochem. Photobiol. C Photochem. Rev. 2012, 13, 169–189. [Google Scholar] [CrossRef]
  70. Srikanth, B.; Goutham, R.; Narayan, R.B.; Ramprasath, A.; Gopinath, K.P.; Sankaranarayanan, A.R. Recent advancements in supporting materials for immobilised photocatalytic applications in waste water treatment. J. Environ. Manage. 2017, 200, 60–78. [Google Scholar] [CrossRef]
  71. Navabpour, P.; Ostovarpour, S.; Tattershall, C.; Cooke, K.; Kelly, P.; Verran, J.; Whitehead, K.; Hill, C.; Raulio, M.; Priha, O. Photocatalytic TiO2 and doped TiO2 coatings to improve the hygiene of surfaces used in food and beverage processing—a study of the physical and chemical resistance of the coatings. Coatings 2014, 4, 433–449. [Google Scholar] [CrossRef] [Green Version]
  72. Bloh, J.Z.; Dillert, R.; Bahnemann, D.W. Designing optimal metal-doped photocatalysts: Correlation between photocatalytic activity, doping ratio, and particle size. J. Phys. Chem. C 2012, 116, 25558–25562. [Google Scholar] [CrossRef]
  73. Michaelson, H.B. The work function of the elements and its periodicity. J. Appl. Phys. 1977, 48, 4729–4733. [Google Scholar] [CrossRef] [Green Version]
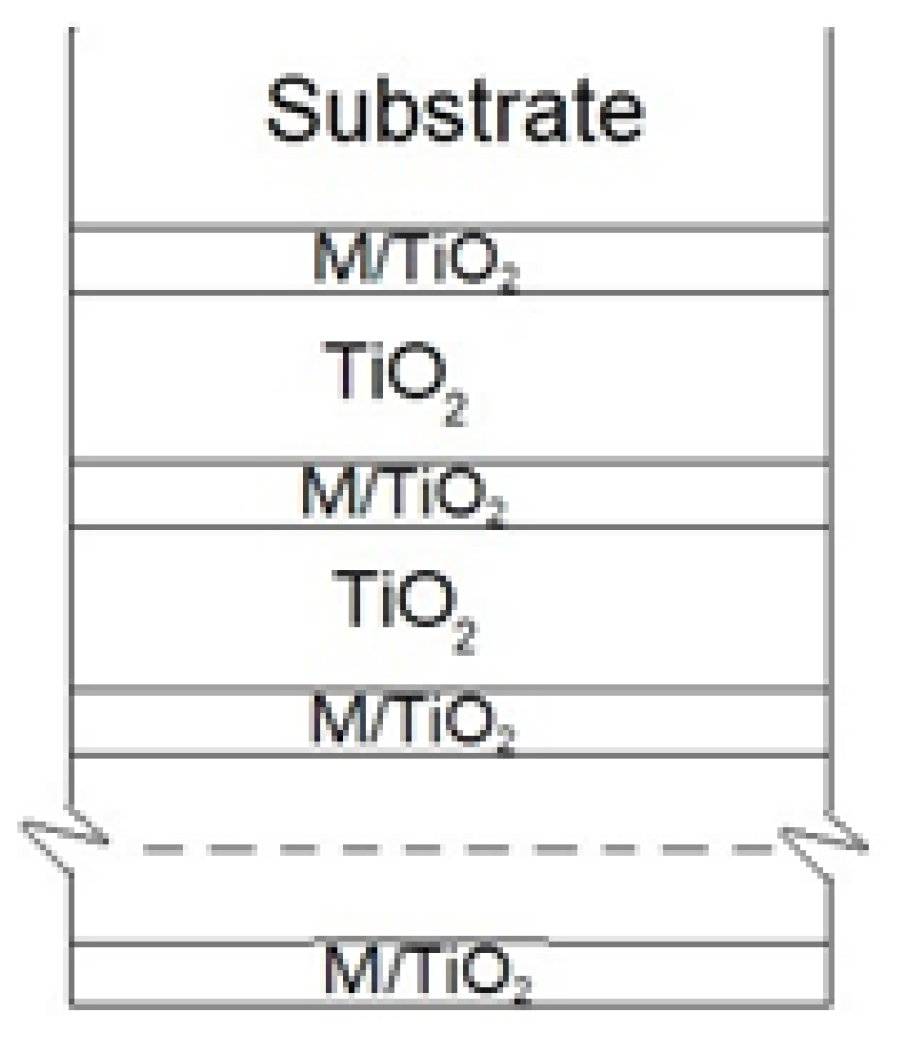
Figure 1. M-doped TiO2 thin film structure.
Materials 13 00886 g001
Figure 2. Dehydration of oxalic acid molecule.
Materials 13 00886 g002
Figure 3. XRD pattern spectra of amorphous TiO2 without dopants.
Materials 13 00886 g003
Figure 4. Cu (0.6 wt %) doped TiO2 sample surface elemental analysis.
Materials 13 00886 g004
Figure 5. XPS spectra of formed M-doped TiO2 thin films: (a) survey; (b) depth profiling of Mg-doped TiO2 thin films; and (c) Ti2p; dopant (i) Ni, (ii) Mg and (iii) Cu.
Materials 13 00886 g005
Figure 6. Degradation of oxalic acid in time as a function of Mg concentration in TiO2 thin films, where (a) degradation of oxalic acid in time at different Mg wt % concentrations and (b) photocatalysis process dependence on Mg wt % dopant concentration.
Materials 13 00886 g006
Figure 7. Degradation of oxalic acid in time as a function of Cu concentration in TiO2 thin films, where (a) the degradation of oxalic acid in time at different Cu wt % concentrations and (b) the photocatalysis process dependence on Cu wt % dopant concentration.
Materials 13 00886 g007
Figure 8. Degradation of oxalic acid in time as a function of Ni concentration in TiO2 thin films, where (a) degradation of oxalic acid in time at different Ni wt % concentrations and (b) photocatalysis process dependence on Ni wt % dopant concentration.
Materials 13 00886 g008
Figure 9. SEM pictures of (a) 0.9 wt % Mg/TiO2; (b) 0.5 wt % Ni/TiO2; (c) 0.6 wt % Cu/TiO2; (d) TiO2 thin films.
Materials 13 00886 g009
Figure 10. The alignment of the electron work function of metal dopants (Φm) and titanium dioxide (ΦTiO2).
Materials 13 00886 g010
Table 1. Dopants concentration in samples and apparent rate constant kapp (where OA is an oxalic acid solution). Dopants concentration was analyzed via X-ray photoelectron spectrometer (XPS) and energy-dispersive X-ray spectroscopy (EDS).
Mg/TiO2Cu/TiO2Ni/TiO2TiO2OA
Conc., %kapp, min−1Conc., %kapp, min−1Conc., %kapp, min−1kapp, min−1kapp, min−1
0.90.018660.30.013730.50.013170.011600.00080
10.010150.60.022211.40.00519
4.10.004743.40.006313.60.00214
14.10.002274.50.0064611.60.00170
17.50.000928.40.0043217.90.00152
13.50.0011120.20.00114
210.00073