Topography of the Interfacial Shear Strength and the Mean Intrinsic Tensile Strength of Hemp Fibers as a Reinforcement of Polypropylene

 , ,
, , 
 ,
,  and
and 
Abstract
1. Introduction
2. Materials and Methods
2.1. Materials
2.2. Hemp Strands Treatment
2.3. Composites Formulation and Preparation
2.4. Sample Obtaining and Testing
2.5. Extraction of the Hemp Strands from the Composite
2.6. Morphology of the Hemp Strands
3. Micromechanics
3.1. Modified Rule of Mixtures
3.2. Kelly and Tyson Modified Equation
3.3. Bowyer and Bader Method
3.4. Hirsch Model
4. Results and Discussion
5. Conclusions
Author Contributions
Funding
Acknowledgments
Conflicts of Interest
References
- Salem, S.; Oliver-Ortega, H.; Espinach, F.X.; Hamed, K.B.; Nasri, N.; Alcalà, M.; Mutjé, P. Study on the Tensile Strength and Micromechanical Analysis of Alfa Fibers Reinforced High Density Polyethylene Composites. Fibers Polym. 2019, 20, 602–610. [Google Scholar] [CrossRef]
- Oliver-Ortega, H.; Chamorro-Trenado, M.À.; Soler, J.; Mutjé, P.; Vilaseca, F.; Espinach, F.X. Macro and micromechanical preliminary assessment of the tensile strength of particulate rapeseed sawdust reinforced polypropylene copolymer biocomposites for its use as building material. Constr. Build. Mater. 2018, 168, 422–430. [Google Scholar] [CrossRef]
- Oliver-Ortega, H.; Granda, L.A.; Espinach, F.X.; Mendez, J.A.; Julian, F.; Mutjé, P. Tensile properties and micromechanical analysis of stone groundwood from softwood reinforced bio-based polyamide11 composites. Compos. Sci. Technol. 2016, 132, 123–130. [Google Scholar] [CrossRef]
- Granda, L.A.; Espinach, F.X.; Lopez, F.; Garcia, J.C.; Delgado-Aguilar, M.; Mutje, P. Semichemical fibres of Leucaena collinsii reinforced polypropylene: Macromechanical and micromechanical analysis. Compos. Part B Eng. 2016, 91, 384–391. [Google Scholar] [CrossRef]
- Sullins, T.; Pillay, S.; Komus, A.; Ning, H. Hemp fiber reinforced polypropylene composites: The effects of material treatments. Compos. Part B Eng. 2017, 114, 15–22. [Google Scholar] [CrossRef]
- Schirp, A.; Mannheim, M.; Plinke, B. Influence of refiner fibre quality and fibre modification treatments on properties of injection-moulded beech wood-plastic composites. Compos. Part A Appl. Sci. Manuf. 2014, 61, 245–257. [Google Scholar] [CrossRef]
- Karim, R.; Rahman, M.F.; Hasan, M.; Islam, M.S.; Hassan, A. Effect of Fiber Loading and Alkali Treatment on Physical and Mechanical Properties of Bagasse Fiber Reinforced Polypropylene Composites. J. Polym. Mater. 2013, 30, 423–433. [Google Scholar]
- Sawpan, M.A.; Pickering, K.L.; Fernyhough, A. Effect of fibre treatments on interfacial shear strength of hemp fibre reinforced polylactide and unsaturated polyester composites. Compos. Part A Appl. Sci. Manuf. 2011, 42, 1189–1196. [Google Scholar] [CrossRef]
- Suardana, N.; Piao, Y.; Lim, J. Mechanical Properties of Hemp Fibers and Hemp/PP composites: Effects of chemical surface treatment. Mater. Phys. Mech. 2011, 12, 113–125. [Google Scholar]
- Franco-Marques, E.; Mendez, J.A.; Pelach, M.A.; Vilaseca, F.; Bayer, J.; Mutje, P. Influence of coupling agents in the preparation of polypropylene composites reinforced with recycled fibers. Chem. Eng. J. 2011, 166, 1170–1178. [Google Scholar] [CrossRef]
- Zhou, Y.; Fan, M.; Chen, L. Interface and bonding mechanisms of plant fibre composites: An overview. Compos. Part B Eng. 2016, 101, 31–45. [Google Scholar] [CrossRef]
- Lopez, J.P.; Mendez, J.A.; Espinach, F.X.; Julian, F.; Mutje, P.; Vilaseca, F. Tensile Strength characteristics of Polypropylene composites reinforced with Stone Groundwood fibers from Softwood. BioResources 2012, 7, 3188–3200. [Google Scholar] [CrossRef]
- Lopez, J.P.; Mendez, J.A.; El Mansouri, N.E.; Mutje, P.; Vilaseca, F. Mean intrinsic tensile properties of stone groundwood fibers from softwood. BioResources 2011, 6, 5037–5049. [Google Scholar] [CrossRef]
- Vilaseca, F.; Del Rey, R.; Serrat, R.; Alba, J.; Mutje, P.; Espinach, F.X. Macro and micro-mechanics behavior of stifness in alkaline treated hemp core fibres polypropylene-based composites. Compos. Part B Eng. 2018, 144, 118–125. [Google Scholar] [CrossRef]
- Rouger, J.; Mutje, P. Correlation between the cellulose fibers beating and the fixation of a soluble cationic polymer. Br. Polym. J. 1984, 16, 83–86. [Google Scholar] [CrossRef]
- Birnin-Yauri, A.; Ibrahim, N.; Zainuddin, N.; Abdan, K.; Then, Y.; Chieng, B. Effect of Maleic Anhydride-Modified Poly(lactic acid) on the Properties of Its Hybrid Fiber Biocomposites. Polymers 2017, 9, 165. [Google Scholar] [CrossRef]
- Mendez, J.A.; Vilaseca, F.; Pelach, M.A.; Lopez, J.P.; Barbera, L.; Turon, X.; Girones, J.; Mutje, P. Evaluation of the reinforcing effect of ground wood pulp in the preparation of polypropylene-based composites coupled with maleic anhydride grafted polypropylene. J. Appl. Polym. Sci. 2007, 105, 3588–3596. [Google Scholar] [CrossRef]
- Reixach, R.; Franco-Marquès, E.; El Mansouri, N.-E.; de Cartagena, F.R.; Arbat, G.; Espinach, F.X.; Mutjé, P. Micromechanics of Mechanical, Thermomechanical, and Chemi-Thermomechanical Pulp from Orange Tree Pruning as Polypropylene Reinforcement: A Comparative Study. BioResources 2013, 8, 3231–3246. [Google Scholar] [CrossRef]
- Lopez, J.P.; Boufi, S.; El Mansouri, N.E.; Mutje, P.; Vilaseca, F. PP composites based on mechanical pulp, deinked newspaper and jute strands: A comparative study. Compos. Part B Eng. 2012, 43, 3453–3461. [Google Scholar] [CrossRef]
- Pickering, K.L.; Efendy, M.A.; Le, T.M. A review of recent developments in natural fibre composites and their mechanical performance. Compos. Part A Appl. Sci. Manuf. 2016, 83, 98–112. [Google Scholar] [CrossRef]
- Zini, E.; Scandola, M. Green Composites: An Overview. Polym. Compos. 2011, 32, 1905–1915. [Google Scholar] [CrossRef]
- Serra, A.; Tarrés, Q.; Claramunt, J.; Mutjé, P.; Ardanuy, M.; Espinach, F. Behavior of the interphase of dyed cotton residue flocks reinforced polypropylene composites. Compos. Part B Eng. 2017, 128, 200–207. [Google Scholar] [CrossRef]
- Tarrés, Q.; Vilaseca, F.; Herrera-Franco, P.J.; Espinach, F.X.; Delgado-Aguilar, M.; Mutjé, P. Interface and micromechanical characterization of tensile strength of bio-based composites from polypropylene and henequen strands. Ind. Crop. Prod. 2019, 132, 319–326. [Google Scholar] [CrossRef]
- Remadevi, R.; Gordon, S.; Wang, X.; Rajkhowa, R. Tensile, physical, and microstructure properties of glycine treated cotton fibers. Text. Res. J. 2018, 88, 1356–1366. [Google Scholar] [CrossRef]
- Vallejos, M.E.; Espinach, F.X.; Julian, F.; Torres, L.; Vilaseca, F.; Mutje, P. Micromechanics of hemp strands in polypropylene composites. Compos. Sci. Technol. 2012, 72, 1209–1213. [Google Scholar] [CrossRef]
- Li, Y.; Pickering, K.L.; Farrell, R.L. Determination of interfacial shear strength of white rot fungi treated hemp fibre reinforced polypropylene. Compos. Sci. Technol. 2009, 69, 1165–1171. [Google Scholar] [CrossRef]
- Espinach, F.X.; Granda, L.A.; Tarrés, Q.; Duran, J.; Fullana-i-Palmer, P.; Mutjé, P. Mechanical and micromechanical tensile strength of eucalyptus bleached fibers reinforced polyoxymethylene composites. Compos. Part B Eng. 2017, 116, 333–339. [Google Scholar] [CrossRef]
- Rodriguez, M.; Rodriguez, A.; Bayer, R.J.; Vilaseca, F.; Girones, J.; Mutje, P. Determination of corn stalk fibers’ strength through modeling of the mechanical properties of its composites. BioResources 2010, 5, 2535–2546. [Google Scholar] [CrossRef]
- Jiménez, A.M.; Espinach, F.X.; Delgado-Aguilar, M.; Reixach, R.; Quintana, G.; Fullana-i-Palmer, P.; Mutjé, P. Starch-Based Biopolymer Reinforced with High Yield Fibers from Sugarcane Bagasse as a Technical and Environmentally Friendly Alternative to High Density Polyethylene. BioResources 2016, 11, 9856–9868. [Google Scholar] [CrossRef]
- Jiménez, A.M.; Espinach, F.X.; Granda, L.; Delgado-Aguilar, M.; Quintana, G.; Fullana-i-Palmer, P.; Mutje, P. Tensile strength assessment of injection-molded high yield sugarcane bagasse-reinforced polypropyene. BioResources 2016, 11, 6346–6361. [Google Scholar] [CrossRef]
- Shah, D.U.; Nag, R.K.; Clifford, M.J. Why do we observe significant differences between measured and ‘back-calculated’ properties of natural fibres? Cellulose 2016, 23, 1481–1490. [Google Scholar] [CrossRef]
- Vilaseca, F.; Valadez-Gonzalez, A.; Herrera-Franco, P.J.; Pelach, M.A.; Lopez, J.P.; Mutje, P. Biocomposites from abaca strands and polypropylene. Part I: Evaluation of the tensile properties. Bioresour. Technol. 2010, 101, 387–395. [Google Scholar] [CrossRef] [PubMed]
- Templeton, P.A. Strength predictions of injection-molding compounds. J. Reinf. Plast. Compos. 1990, 9, 210–225. [Google Scholar] [CrossRef]
- Mittal, R.K.; Gupta, V.B.; Sharma, P. The effect of fibre orientation on the interfacial shear stress in short fibre-reinforced polypropylene. J. Mater. Sci. 1987, 22, 1949–1955. [Google Scholar] [CrossRef]
- Espinach, F.X.; Julian, F.; Verdaguer, N.; Torres, L.; Pelach, M.A.; Vilaseca, F.; Mutje, P. Analysis of tensile and flexural modulus in hemp strands/polypropylene composites. Compos. Part B Eng. 2013, 47, 339–343. [Google Scholar] [CrossRef]
- Paunikallio, T.; Suvanto, M.; Pakkanen, T.T. Composition, tensile properties, and dispersion of polypropylene composites reinforced with viscose fibers. J. Appl. Polym. Sci. 2004, 91, 2676–2684. [Google Scholar] [CrossRef]
- Oliver-Ortega, H.; Granda, L.A.; Espinach, F.X.; Delgado-Aguilar, M.; Duran, J.; Mutjé, P. Stiffness of bio-based polyamide 11 reinforced with softwood stone ground-wood fibres as an alternative to polypropylene-glass fibre composites. Eur. Polym. J. 2016, 84, 481–489. [Google Scholar] [CrossRef]
- Granda, L.A.; Espinach, F.X.; Mendez, J.A.; Tresserras, J.; Delgado-Aguilar, M.; Mutje, P. Semichemical fibres of Leucaena collinsii reinforced polypropylene composites: Young’s modulus analysis and fibre diameter effect on the stiffness. Compos. Part B Eng. 2016, 92, 332–337. [Google Scholar] [CrossRef]
- Reixach, R.; Espinach, F.X.; Arbat, G.; Julián, F.; Delgado-Aguilar, M.; Puig, J.; Mutjé, P. Tensile Properties of Polypropylene Composites Reinforced with Mechanical, Thermomechanical, and Chemi-Thermomechanical Pulps from Orange Pruning. BioResources 2015, 10, 4544–4556. [Google Scholar] [CrossRef]
- Lau, K.-T.; Hung, P.-Y.; Zhu, M.-H.; Hui, D. Properties of natural fibre composites for structural engineering applications. Compos. Part B Eng. 2018, 136, 222–233. [Google Scholar] [CrossRef]
- Vilaseca, F.; Lopez, A.; Llauro, X.; Pelach, M.A.; Mutje, P. Hemp strands as reinforcement of polystyrene composites. Chem. Eng. Res. Des. 2004, 82, 1425–1431. [Google Scholar] [CrossRef]
- ASTM International. Standard Test Method for Tensile Properties of Plastics; ASTM International: West Conshohocken, PA, USA, 2010; Volume ASTM D638-10. [Google Scholar]
- ASTM International. Standard Test Methods for Flexural Properties of Unreiforced and Reinforced Plastics and Electrical Insulating Materials; ASTM International: West Conshohocken, PA, USA, 2017; Volume ASTM D790-17. [Google Scholar]
- Thomason, J.L. Micromechanical parameters from macromechanical measurements on glass reinforced polypropylene. Compos. Sci. Technol. 2002, 62, 1455–1468. [Google Scholar] [CrossRef]
- Espinach, F.X.; Mendez, J.A.; Granda, L.A.; Pelach, M.A.; Delgado-Aguilar, M.; Mutje, P. Bleached kraft softwood fibers reinforced polylactic acid composites, tensile and flexural strengths. In Natural Fibre-Reinforced Biodegradable and Bioresorbable Polymer Composites; Lau, A., Ed.; Elsevier: Oxford, UK, 2017. [Google Scholar]
- Gironès, J.; Espinach, F.X.; Pellicer, N.; Tresserras, J.; Alcalà, M.; Mutjé, P. High-Performance-Tensile-Strength Alpha-Grass Reinforced Starch-Based Fully Biodegradable Composites. BioResources 2013, 8, 6121–6135. [Google Scholar] [CrossRef]
- Kelly, A.; Tyson, W. Tensile porperties of fibre-reinforced metals-copper/tungsten and copper/molybdenum. J. Mech. Phys. Solids 1965, 13, 329–338. [Google Scholar] [CrossRef]
- Serra, A.; Tarrés, Q.; Llop, M.; Reixach, R.; Mutjé, P.; Espinach, F.X. Recycling dyed cotton textile byproduct fibers as polypropylene reinforcement. Text. Res. J. 2018. [Google Scholar] [CrossRef]
- Bowyer, W.H.; Bader, H.G. On the reinforcement of thermoplastics by imperfectly aligned discontinuous fibres. J. Mater. Sci. 1972, 7, 1315–1321. [Google Scholar] [CrossRef]
- Hirsch, T. Modulus of elasticity of concrete affected by elastic moduli of cement paste matrix and aggregate. J. Am. Concr. Inst. 1962, 59, 427–451. [Google Scholar] [CrossRef]
- Reixach, R.; Espinach, F.X.; Franco-Marquès, E.; Ramirez de Cartagena, F.; Pellicer, N.; Tresserras, J.; Mutjé, P. Modeling of the tensile moduli of mechanical, thermomechanical, and chemi-thermomechanical pulps from orange tree pruning. Polym. Compos. 2013, 34, 1840–1846. [Google Scholar] [CrossRef]
- Karmaker, A.C.; Youngquist, J.A. Injection molding of polypropylene reinforced with short jute fibers. J. Appl. Polym. Sci. 1996, 62, 1147–1151. [Google Scholar] [CrossRef]


| Material | σtC (MPa) | EtC (GPa) | εtC (%) | σtm* (MPa) |
|---|---|---|---|---|
| PP | 27.6 ± 0.5 | 1.5 ± 0.1 | 9.3 ± 0.2 | – |
| 20HS0MAPP | 29.5 ± 0.7 | 2.9 ± 0.1 | 3.4 ± 0.1 | 24.2 |
| 20HS2MAPP | 30.7 ± 0.5 | 2.9 ± 0.1 | 3.3 ± 0.1 | 24.0 |
| 20HS4MAPP | 33.3 ± 0.4 | 2.9 ± 0.2 | 3.6 ± 0.2 | 24.7 |
| 20HS6MAPP | 34.7 ± 0.4 | 2.9 ± 0.1 | 4.0 ± 0.1 | 25.5 |
| 20HS8MAPP | 36.3 ± 0.9 | 3.0 ± 0.1 | 3.9 ± 0.1 | 25.3 |
| 30HS0MAPP | 32.7 ± 0.5 | 3.9 ± 0.2 | 3.1 ± 0.1 | 23.5 |
| 30HS2MAPP | 37.2 ± 1.0 | 4.0 ± 0.1 | 3.1 ± 0.2 | 23.5 |
| 30HS4MAPP | 43.4 ± 1.0 | 3.9 ± 0.1 | 3.7 ± 0.2 | 24.9 |
| 30HS6MAPP | 42.4 ± 1.5 | 3.9 ± 0.1 | 3.5 ± 0.3 | 24.5 |
| 30HS8MAPP | 39.8 ± 0.9 | 3.9 ± 0.1 | 3.4 ± 0.2 | 24.3 |
| 40HS0MAPP | 32.8 ± 0.9 | 5.2 ± 0.3 | 2.9 ± 0.2 | 22.9 |
| 40HS2MAPP | 44.1 ± 1.5 | 5.2 ± 0.2 | 3.5 ± 0.2 | 24.5 |
| 40HS4MAPP | 48.8 ± 1.9 | 5.2 ± 0.1 | 3.5 ± 0.1 | 24.5 |
| 40HS6MAPP | 48.7 ± 1.1 | 5.2 ± 0.1 | 3.7 ± 0.2 | 24.9 |
| 40HS8MAPP | 46.2 ± 2.0 | 5.2 ± 0.1 | 3.5 ± 0.2 | 24.5 |
| 50HS0MAPP | 31.4 ± 0.6 | 6.4 ± 0.2 | 3.3 ± 0.2 | 24.0 |
| 50HS2MAPP | 47.3 ± 1.1 | 6.3 ± 0.1 | 3.2 ± 0.1 | 23.7 |
| 50HS4MAPP | 55.2 ± 1.3 | 6.4 ± 0.3 | 3.2 ± 0.2 | 23.7 |
| 50HS6MAPP | 54.8 ± 1.6 | 6.4 ± 0.2 | 3.3 ± 0.2 | 24.0 |
| 50HS8MAPP | 51.7 ± 1.1 | 6.3 ± 0.1 | 3.2 ± 0.1 | 23.7 |
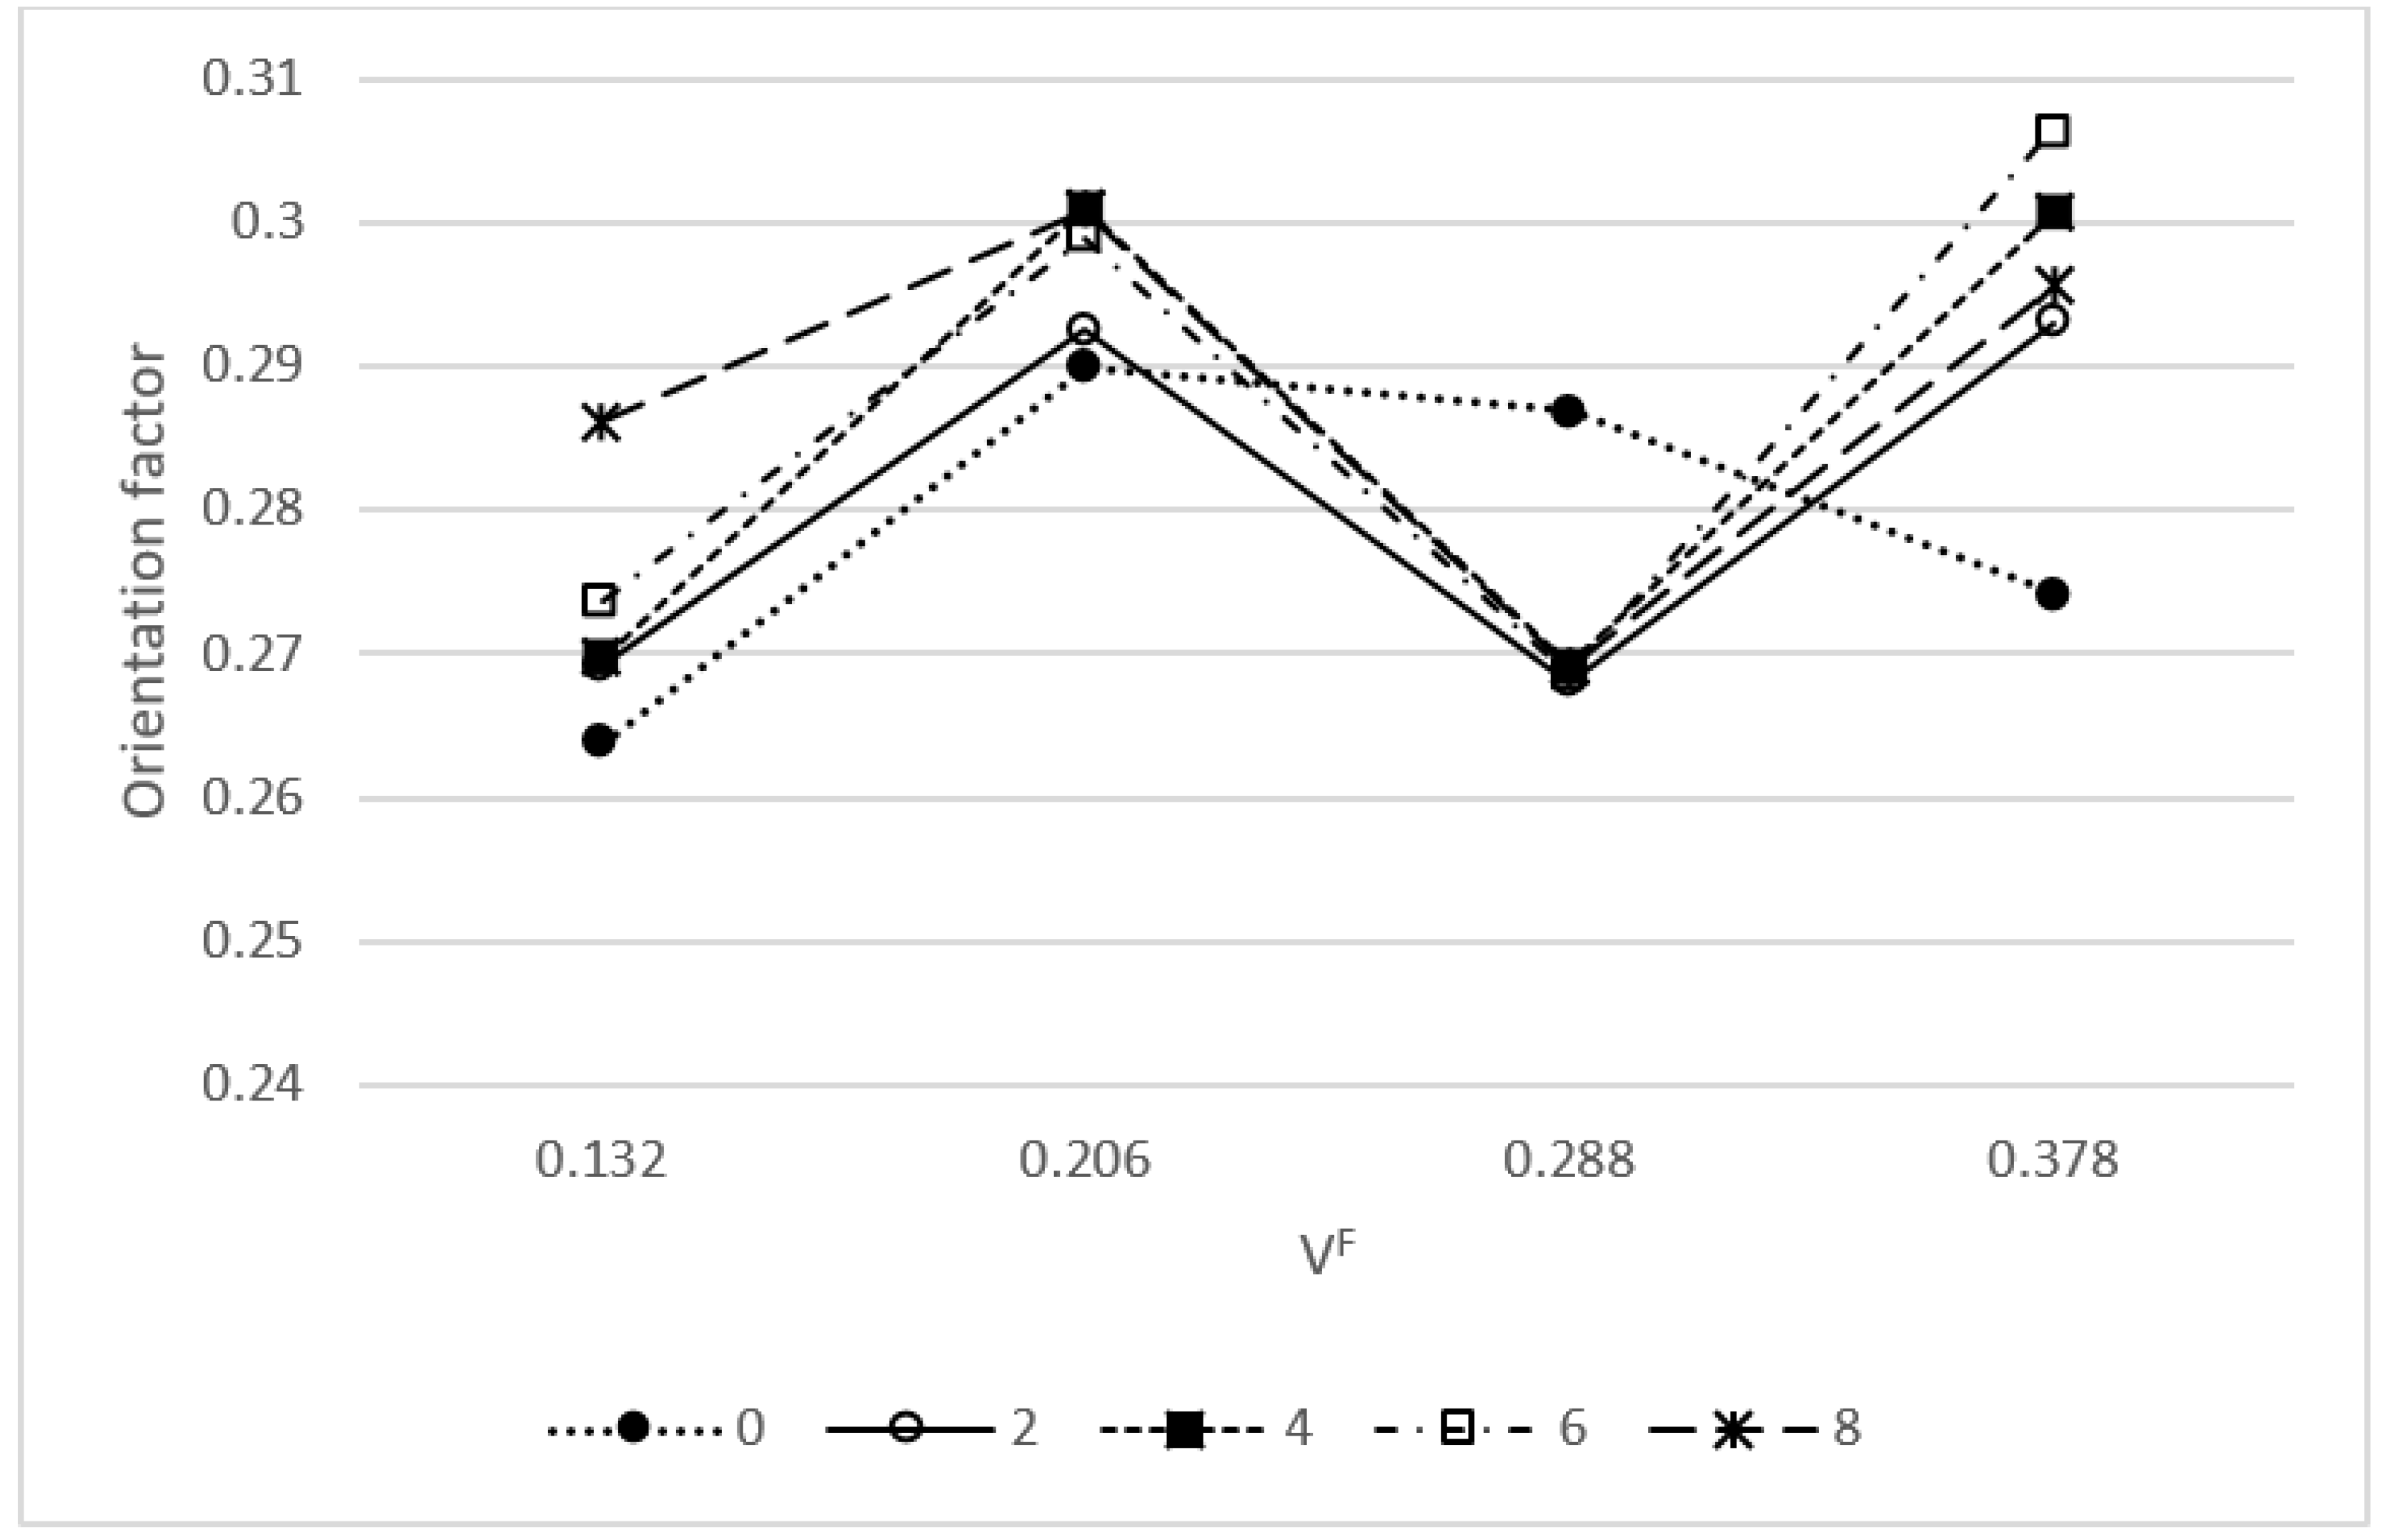
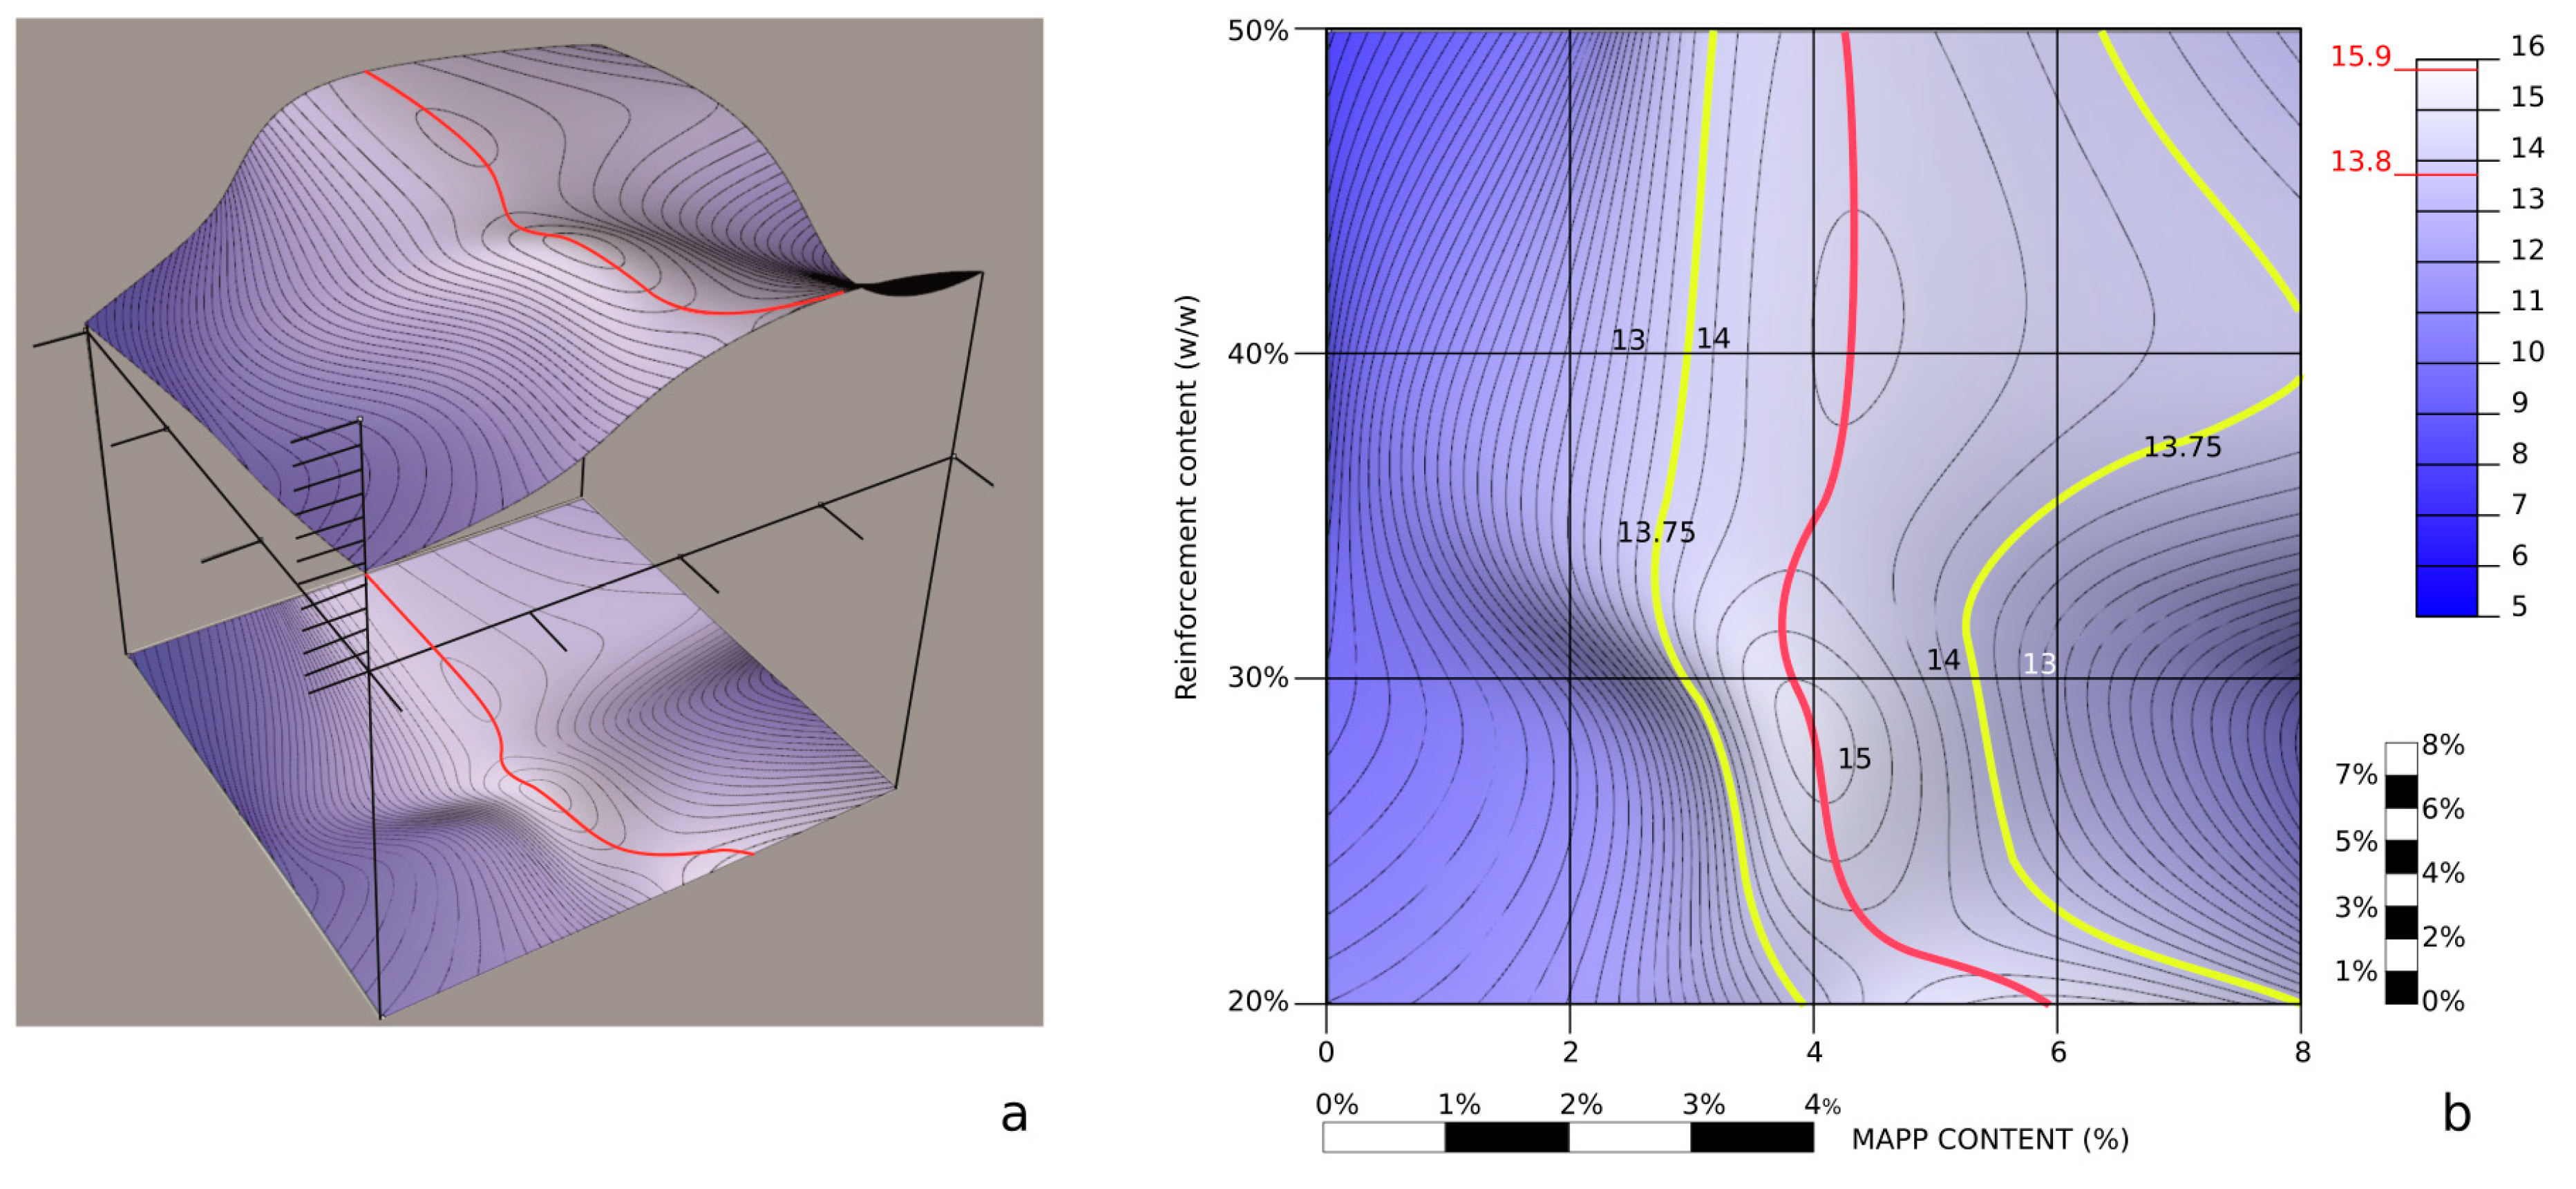
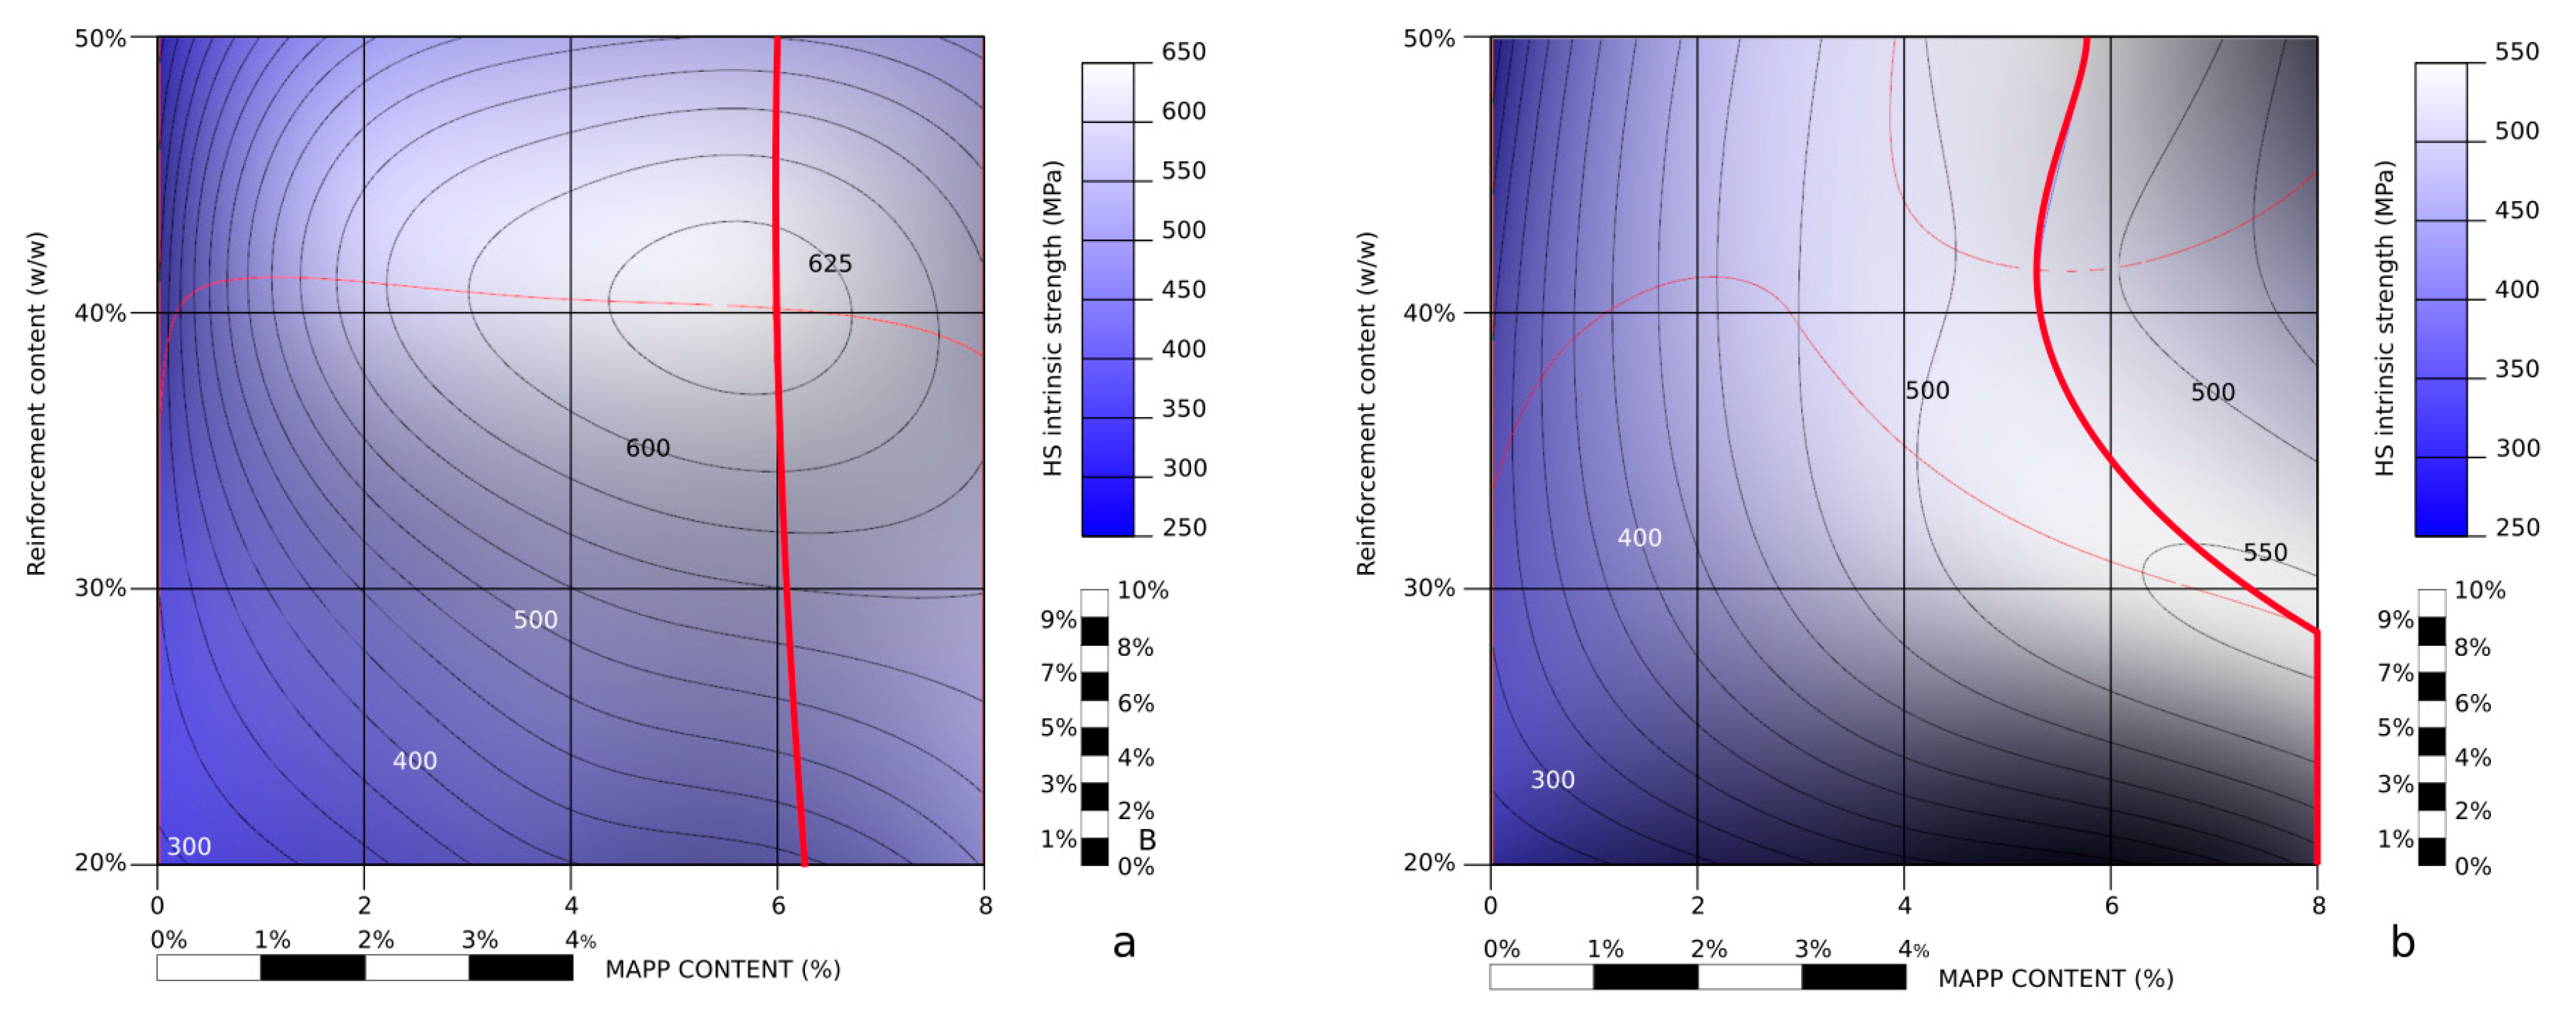
| Material | LF (µm) | χ1 | τ (MPa) | σtF (MPa) |
|---|---|---|---|---|
| 20HS0MAPP | 669 | 0.264 | 9.52 | 292.6 |
| 20HS2MAPP | 640 | 0.269 | 10.55 | 341.0 |
| 20HS4MAPP | 654 | 0.270 | 13.88 | 397.3 |
| 20HS6MAPP | 647 | 0.274 | 14.94 | 414.3 |
| 20HS8MAPP | 647 | 0.286 | 13.86 | 475.3 |
| 30HS0MAPP | 515 | 0.290 | 8.10 | 324.9 |
| 30HS2MAPP | 483 | 0.292 | 10.17 | 450.7 |
| 30HS4MAPP | 483 | 0.301 | 15.13 | 523.2 |
| 30HS6MAPP | 457 | 0.299 | 12.88 | 548.4 |
| 30HS8MAPP | 457 | 0.301 | 9.77 | 549.6 |
| 40HS0MAPP | 387 | 0.287 | 7.17 | 328.1 |
| 40HS2MAPP | 394 | 0.268 | 12.25 | 563.2 |
| 40HS4MAPP | 419 | 0.269 | 14.53 | 617.8 |
| 40HS6MAPP | 407 | 0.269 | 14.15 | 635.2 |
| 40HS8MAPP | 407 | 0.269 | 13.76 | 581.4 |
| 50HS0MAPP | 452 | 0.274 | 5.38 | 265.7 |
| 50HS2MAPP | 437 | 0.293 | 9.52 | 469.8 |
| 50HS4MAPP | 396 | 0.301 | 14.37 | 514.5 |
| 50HS6MAPP | 371 | 0.306 | 13.93 | 524.1 |
| 50HS8MAPP | 371 | 0.295 | 12.90 | 487.9 |
© 2020 by the authors. Licensee MDPI, Basel, Switzerland. This article is an open access article distributed under the terms and conditions of the Creative Commons Attribution (CC BY) license (http://creativecommons.org/licenses/by/4.0/).
Share and Cite
Hernández-Díaz, D.; Villar-Ribera, R.; Julián, F.; Tarrés, Q.; Espinach, F.X.; Delgado-Aguilar, M. Topography of the Interfacial Shear Strength and the Mean Intrinsic Tensile Strength of Hemp Fibers as a Reinforcement of Polypropylene. Materials 2020, 13, 1012. https://doi.org/10.3390/ma13041012
Hernández-Díaz D, Villar-Ribera R, Julián F, Tarrés Q, Espinach FX, Delgado-Aguilar M. Topography of the Interfacial Shear Strength and the Mean Intrinsic Tensile Strength of Hemp Fibers as a Reinforcement of Polypropylene. Materials. 2020; 13(4):1012. https://doi.org/10.3390/ma13041012
Chicago/Turabian StyleHernández-Díaz, David, Ricardo Villar-Ribera, Fernando Julián, Quim Tarrés, Francesc X. Espinach, and Marc Delgado-Aguilar. 2020. "Topography of the Interfacial Shear Strength and the Mean Intrinsic Tensile Strength of Hemp Fibers as a Reinforcement of Polypropylene" Materials 13, no. 4: 1012. https://doi.org/10.3390/ma13041012
APA StyleHernández-Díaz, D., Villar-Ribera, R., Julián, F., Tarrés, Q., Espinach, F. X., & Delgado-Aguilar, M. (2020). Topography of the Interfacial Shear Strength and the Mean Intrinsic Tensile Strength of Hemp Fibers as a Reinforcement of Polypropylene. Materials, 13(4), 1012. https://doi.org/10.3390/ma13041012