1. Introduction
In the later stages of oilfield development, the addition of an oil displacement agent into the oil well is a common technology used to increase oil recovery [
1]. Carbon dioxide (CO
2) has been studied for many years as a widely-used oil displacement agent [
2]. It can expand the volume and reduce the viscosity of crude oil [
3]. Much equipment employed in the production of oil and gas is made up of steel, such as pipelines. Dry CO
2 does not corrode steel. However, there is formation water in oil and gas extraction, and this can significantly promote electrochemical corrosion in steel in humid or water-containing environments, leading to uniform and/or local corrosion [
4].
CO
2 corrosion is an important degradation mechanism for tubing in the oil and gas industries. It could shorten the service life of pipelines and affect normal production [
5,
6,
7,
8,
9]. In flow systems, erosion occurs between corrosive media and pipeline materials due to their relative motion. Corrosion and erosion will affect each other, resulting in faster failure of the pipeline. A certain amount of alloying elements can be doped in the steel to enhance erosion-corrosion resistance. The first choice should be elements with good corrosion resistance and low price. Steel doped with chromium (Cr) is frequently employed to significantly increase the anti-CO
2 corrosion ability of the tubing material and decrease the probability of local corrosion and/or pitting. The service time of the material can be significantly extended by increasing the concentration of Cr. When the concentration of Cr reaches 3%, the corrosion rate decreases significantly [
10]. Therefore, 3Cr steel has been widely used as pipeline steel.
O
2 contamination will inevitably occur during oil and gas production by adding chemicals, shutdowns of newly-installed piping, leaky fittings, and oil recovery [
11,
12]. In addition, in the process of thickened oil thermal extraction, a high-temperature fluid which contains a great deal of oxygen (O
2) as well as water (H
2O), CO
2, and nitrogen (N
2) is injected into oil wells [
13]. O
2 coexisting with CO
2 can make environmental corrosiveness more severe and cause an increase in the erosion-corrosion rate of tubing steels [
14]. Great efforts have been made to minimize CO
2 corrosion [
5,
6,
7,
8,
9], but research on the erosion-corrosion performance of tubing steels under a CO
2–O
2 condition is far from adequate, especially in terms of erosion-corrosion performance comparisons between aqueous CO
2 systems with and without O
2. In this paper, the erosion-corrosion performance of 3Cr steel in a CO
2–O
2 environment was investigated in comparison with that of a CO
2 environment. The erosion-corrosion rates were obtained by observing weight loss. Macrographs of the erosion-corrosion scale were obtained using a digital camera. The microstructures and compositions of the erosion-corrosion scale were analyzed by scanning electron microscopy (SEM), energy spectrometer (EDS), and X-ray diffraction (XRD).
2. Materials and Methods
The erosion-corrosion test was conducted using high-temperature and high-pressure equipment (HTHPE) in environments of CO
2 and CO
2–O
2, respectively.
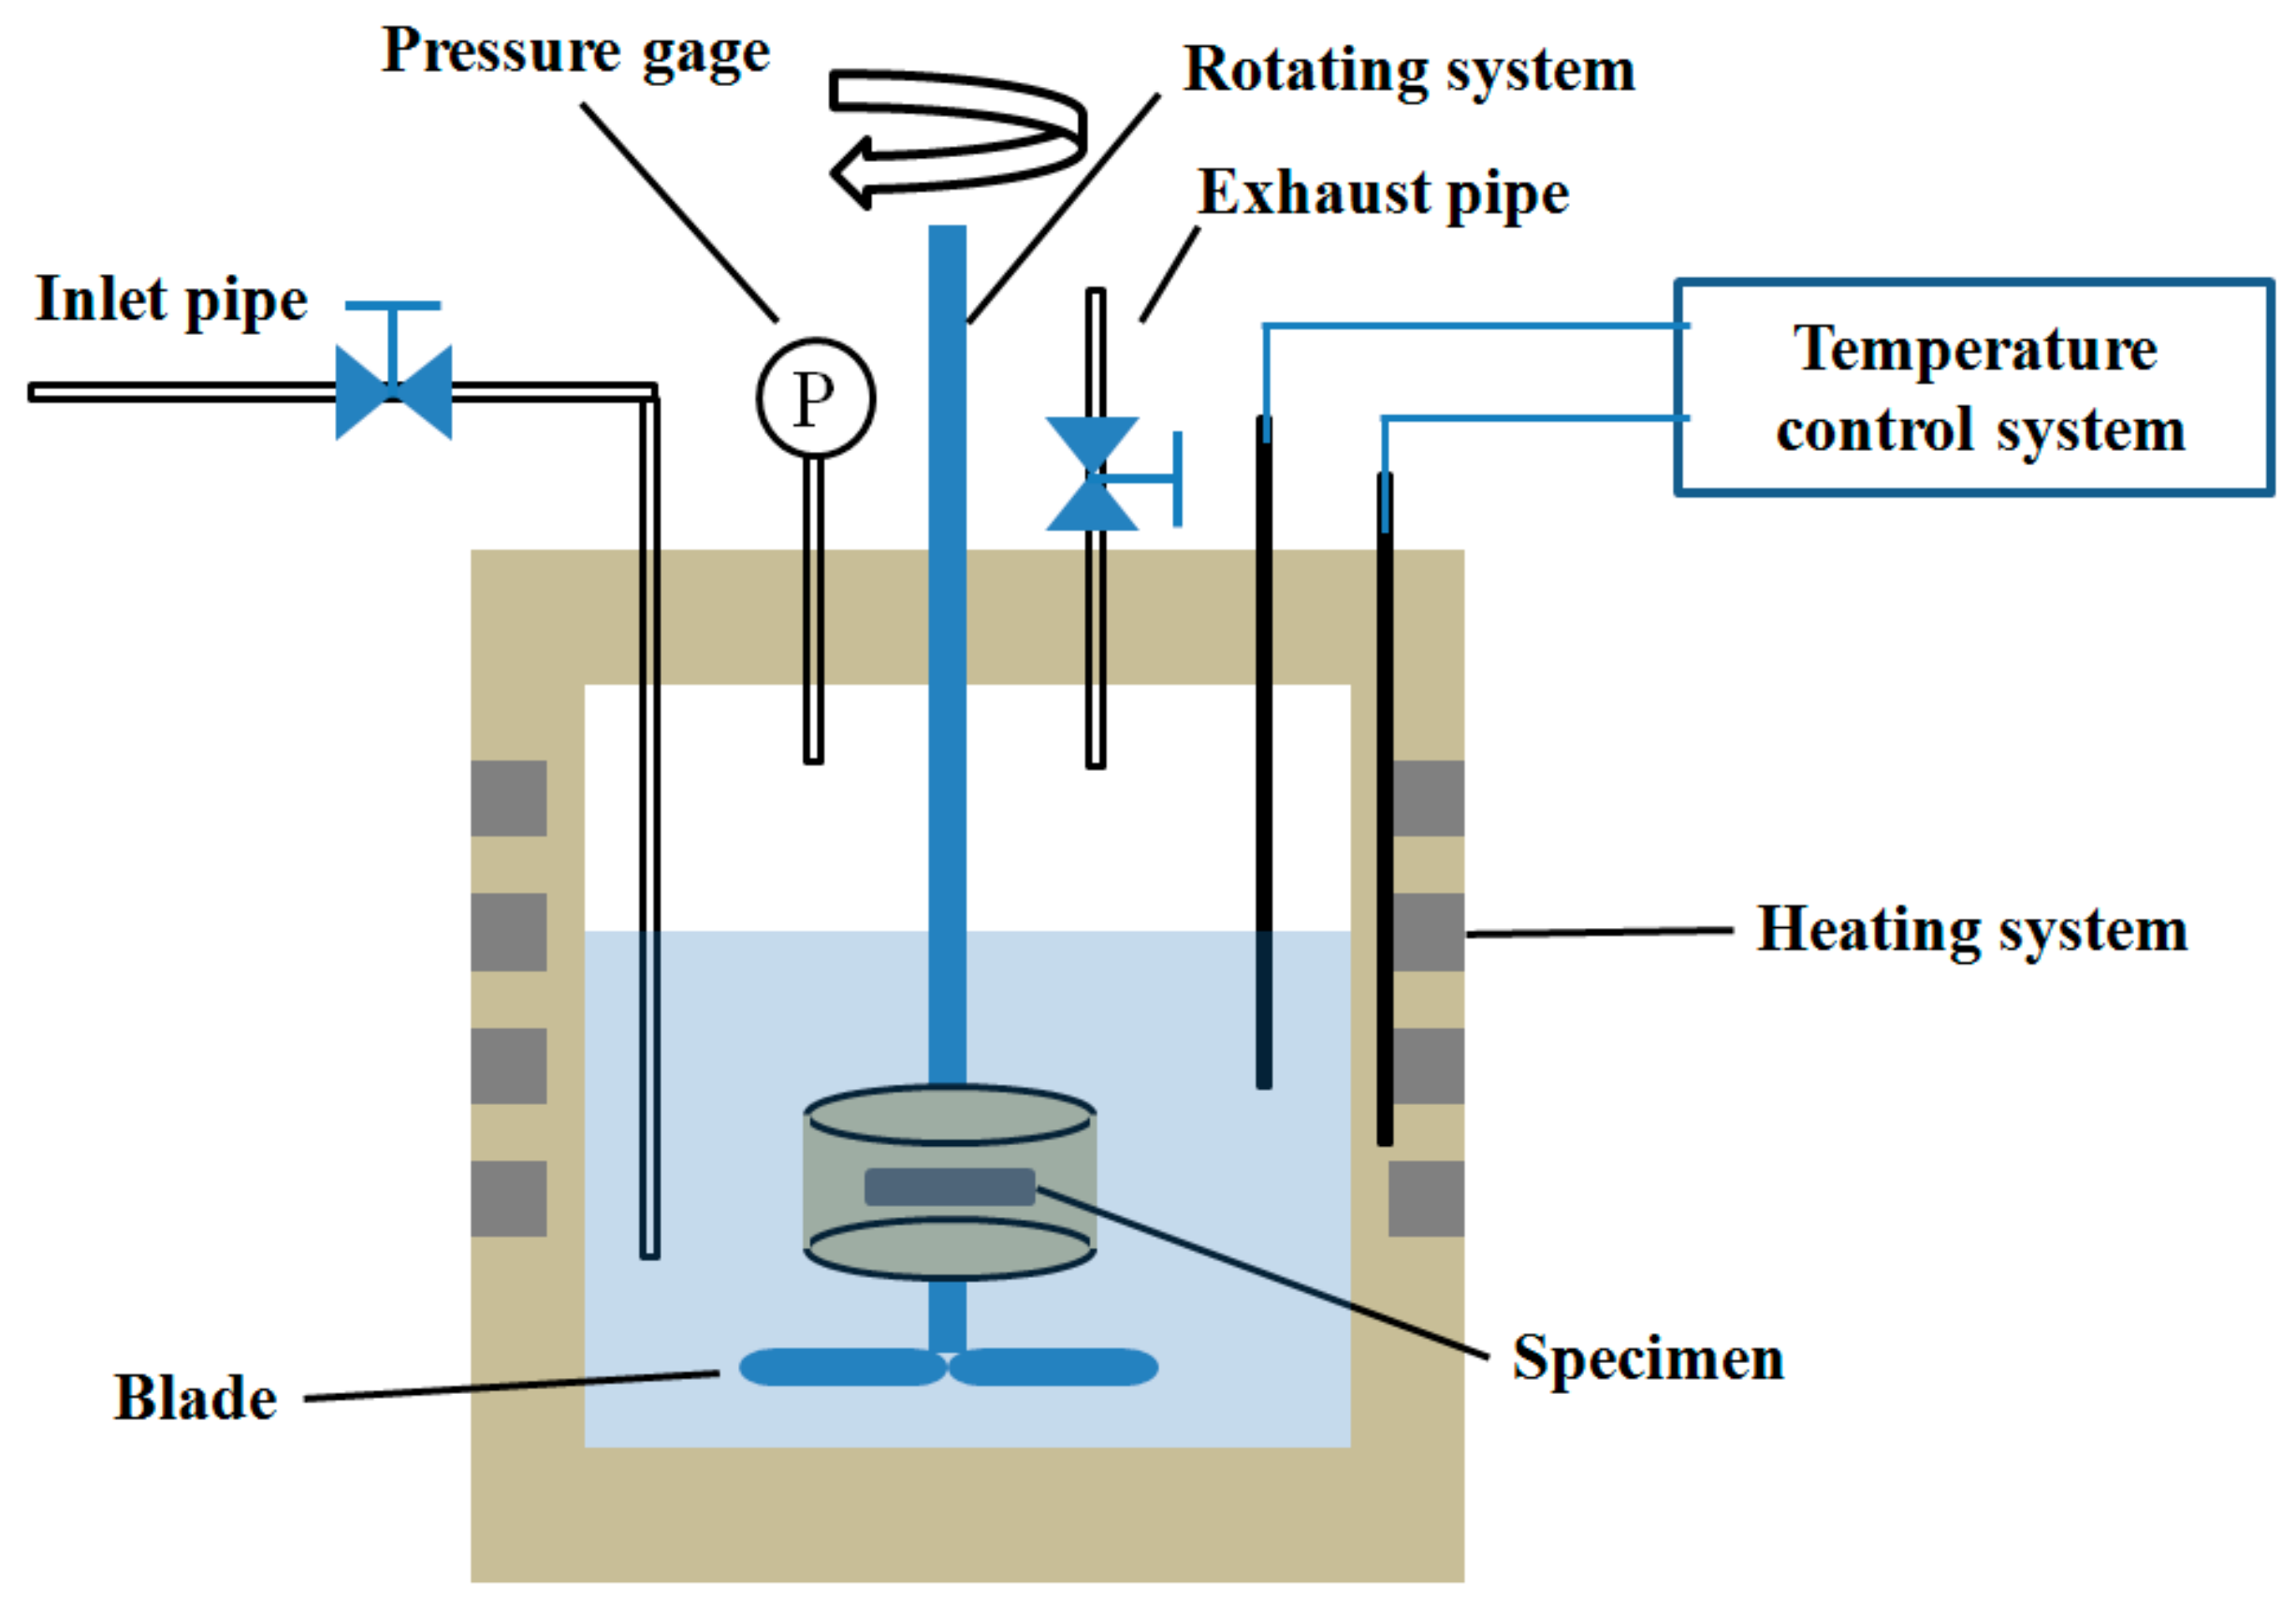
Figure 1 displays a schematic diagram of the HTHPE. It is principally composed of a gas control system, a heating system, a temperature control system, and a rotating system. The gas control system comprises an inlet pipe, an exhaust pipe, and a pressure gage. CO
2 and/or O
2 can enter the HTHPE through the air inlet pipe, and they can be discharged from the HTHPE through the exhaust pipe. The pressure of CO
2 and/or O
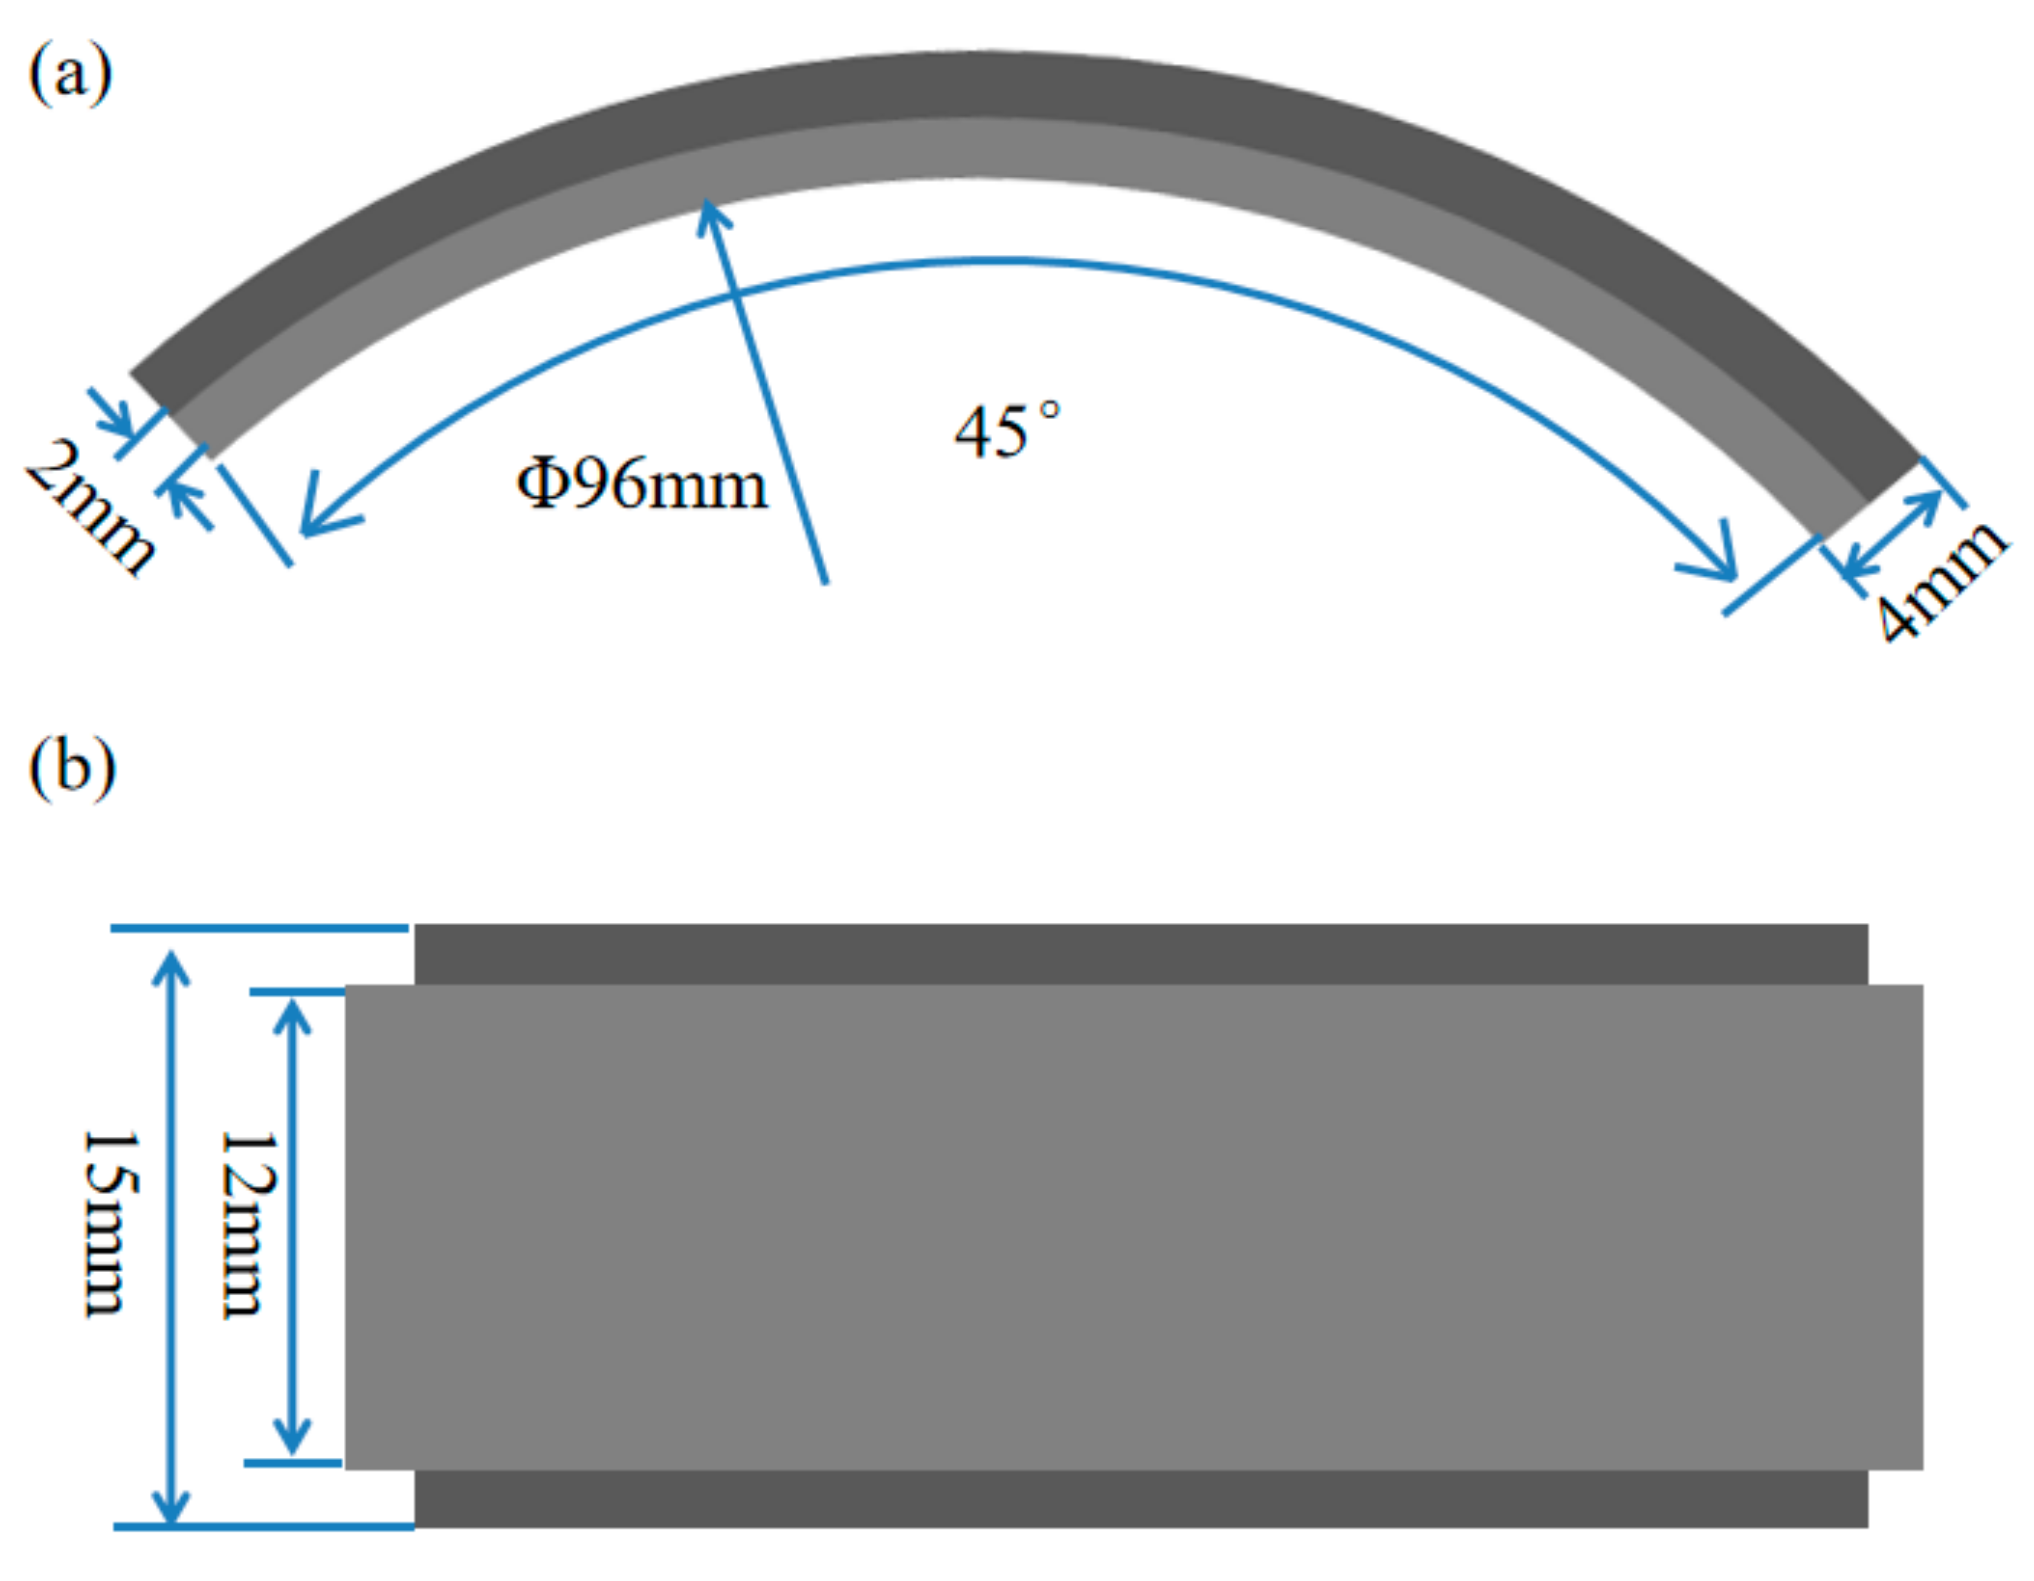
2 in the HTHPE is controlled by the pressure gage. The heating system can heat the HTHPE to elevate the system temperature; the temperature is controlled by a temperature control system. There is a rotating rod in the rotating system, and there are two stirring blades at the bottom of the rotating rod to stir the solution in the HTHPE. Specimens can be fixed on the rotating rod and rotate with it. The shape and size of the specimens are shown in
Figure 2; they comprised a 45° stepped circular arc with an inner diameter of 96 mm and a thickness of 4 mm. The width of the outer ring was 15 mm and that of the inner ring was 12 mm.
The specimens were made of 3Cr steel. The chemical compositions of the tested material are as follows: C 0.37 at.%, Si 0.48 at.%, Mn 0.51 at.%, S < 0.009 at.%, P < 0.02 at.%, Cr 3.37 at.%, Ni 0.03 at.%, Ti 0.01 at.%; the rest is Fe.
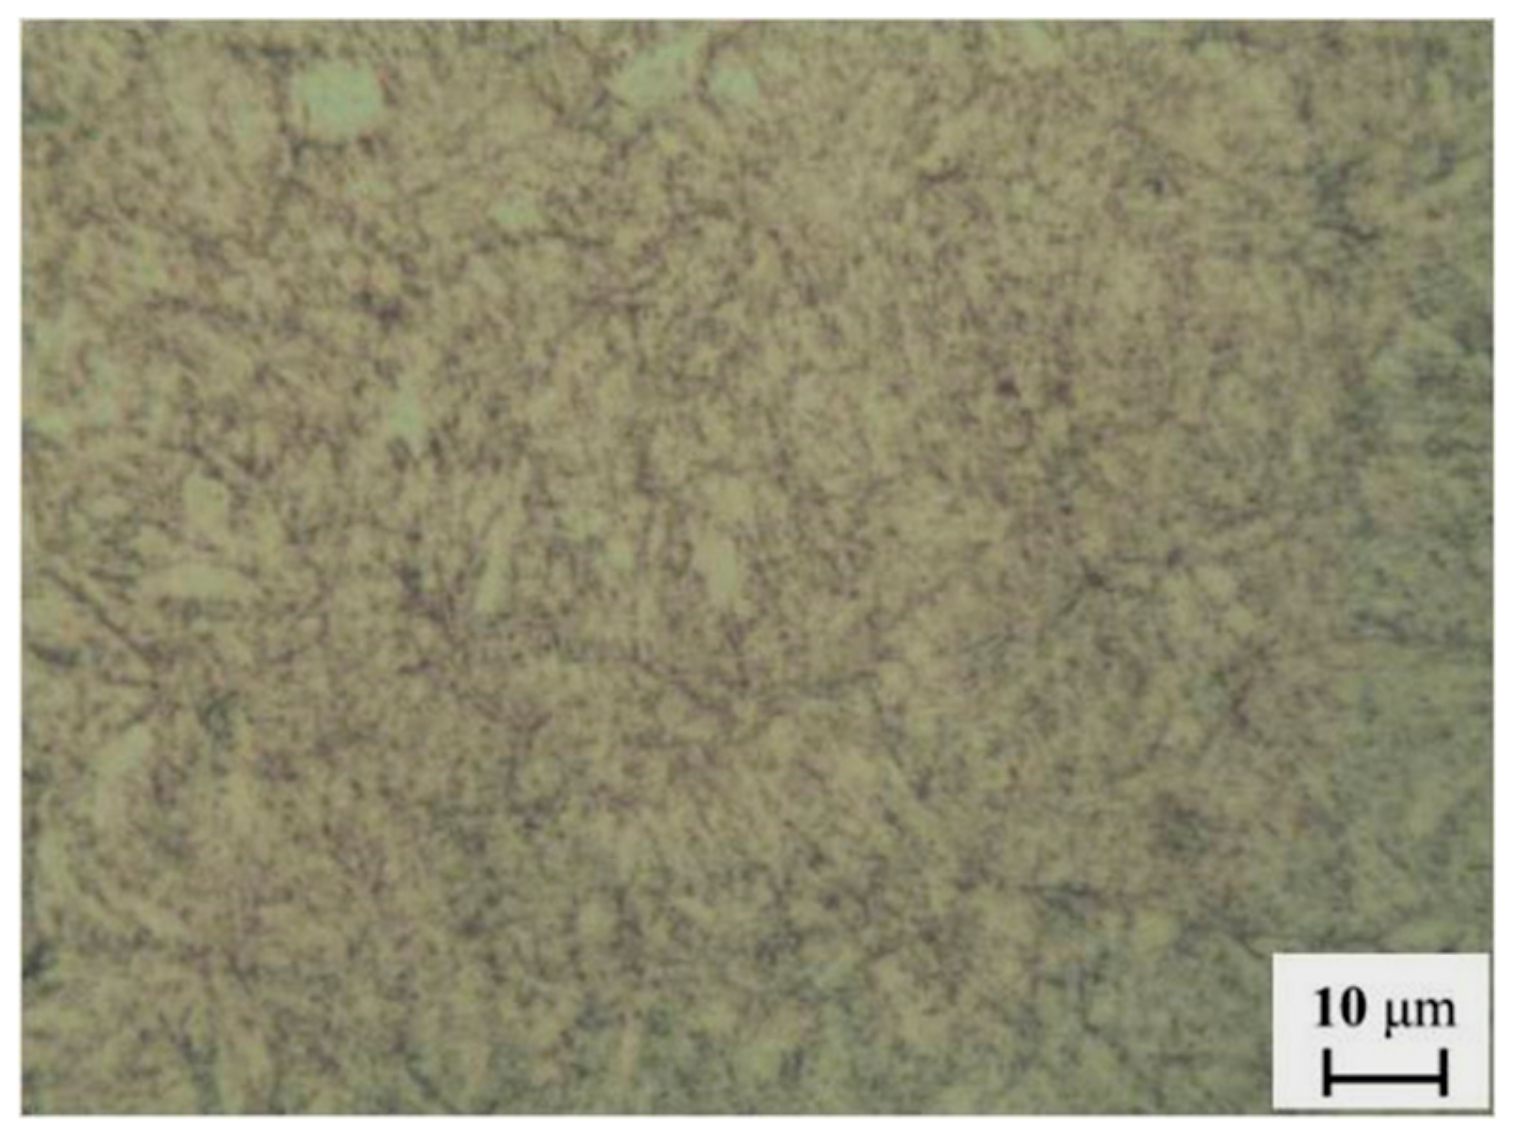
Figure 3 shows the microstructure of the specimen, which reveals acicular ferrite. Before the experiments, the working surface of the specimens was ground with silicon carbide paper to 800 grit. The specimens were cleaned with an ultrasonic cleaning device (GA008, Shenzhen Guanboshi industrial technology co. LTD, Shenzhen, China) for 20 min in acetone to remove grease, and then cleaned with alcohol and dried. They were weighed using an electronic analytical balance with an accuracy of 0.1 mg. The surfaces of the specimens, except for the working surface, were coated with 704 silicone rubber (Guangdong Hengda new material technology co. LTD, Huizhou, China), so that they would be isolated from the corrosive environment. The specimens were then fixed onto a rotating rod. Three of them are employed to study the average erosion-corrosion rate. The others were used for analyses of the structure and composition of the erosion-corrosion products. A certain amount of simulated solution was added to the HTHPE to simulate the water conditions of an oil and gas field. The component concentration of the test solution is given in
Table 1, which ignores oily compounds in water extracted from the oil and gas field. The specimens were submerged in the solution. The experiment conditions are given in
Table 2. The flow velocity given in
Table 2 means that the linear velocity of the sample rotation was used to approximate the relative velocity between the samples and the liquid.
After the erosion-corrosion experiment, the specimens were removed from the HTHPE. The specimens were washed with deionized water and analytically pure alcohol, and then dried. Macrographs of the erosion-corrosion scales and the metal substrate after removal of the erosion-corrosion scales were obtained using a digital camera. The erosion-corrosion products of three specimens were removed by chemical cleaning. The cleaning solution was made up of 500 mL deionized water, 500 mL HCl, and 3.5 g urotropine (C
6H
12N
4). The specimens were weighed after wiping; the average erosion-corrosion rate was calculated using Equation (1):
where C
R is the average erosion-corrosion rate, mm/a; m
0 is the weight of original specimen, g; m
1 is the weight of the specimen after removing the erosion-corrosion product film, g; t is the erosion-corrosion time, h; ρ is the density of the specimen, g/cm
3; and S is the erosion-corrosion surface area of specimens, cm
2.
The microstructure and elemental composition of the erosion-corrosion scales on the specimen surface under different conditions were analyzed using a SEM (ULTRA 55 SEM, Carl Zeiss AG, Jena, Germany) and EDS (INCA X-MAX 50 EDS, Oxford Instruments, Oxford, UK). The erosion-corrosion product powder was prepared by scraping the erosion-corrosion product off the surface of the specimens with a blade, and a semiquantitative analysis of the erosion-corrosion product film was carried out by XRD (D8 Advance XRD, Bruker Corporation, Karlsruhe, Germany) with the internal standard of ZnO [
15]. The mass ratio of ZnO and erosion-corrosion products was 3:7.
3. Results and Discussion
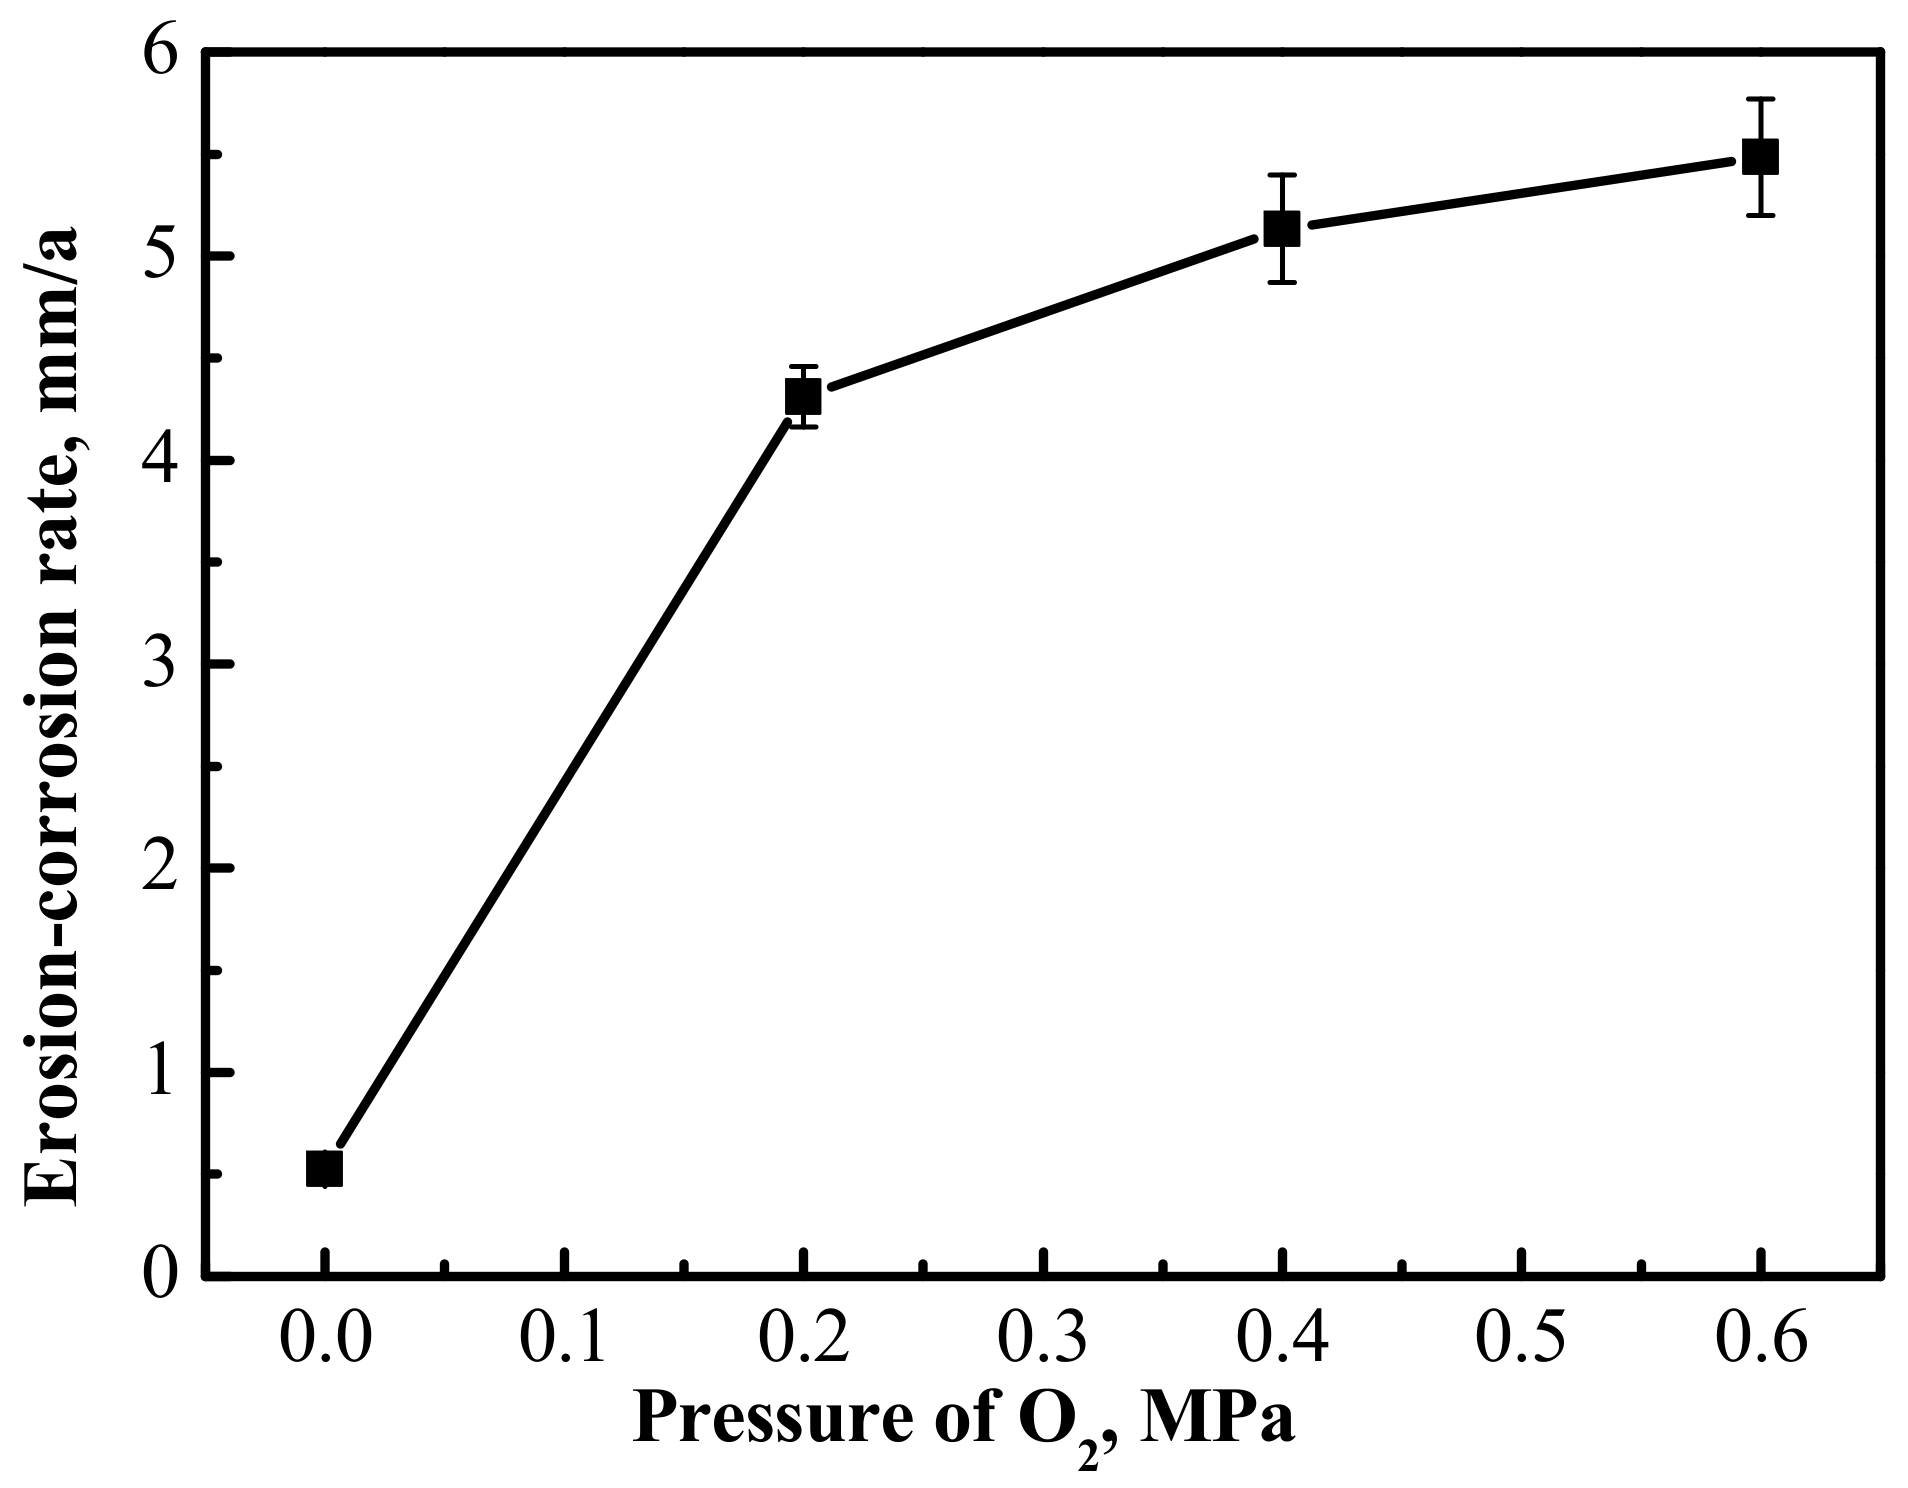
The average erosion-corrosion rate of the 3Cr steel was calculated after the erosion-corrosion experiments; the results are shown in
Figure 4. It turns out from the data in
Figure 4 that the erosion-corrosion rate increased as the O
2 partial pressure went up. There was a significant difference in the erosion-corrosion rate of 3Cr steel comparing the CO
2 and the CO
2–O
2 conditions. It was only about 0.5 mm/a in the CO
2 environment, but increased significantly when there was 0.2 MPa O
2 in the environment, reaching about 4.3 mm/a. Compared with the change from 0 MPa to 0.2 MPa in the partial pressure of O
2, the erosion-corrosion rate of 3Cr steel increased slowly when the O
2 partial pressure increased from 0.2 MPa to 0.6 MPa.
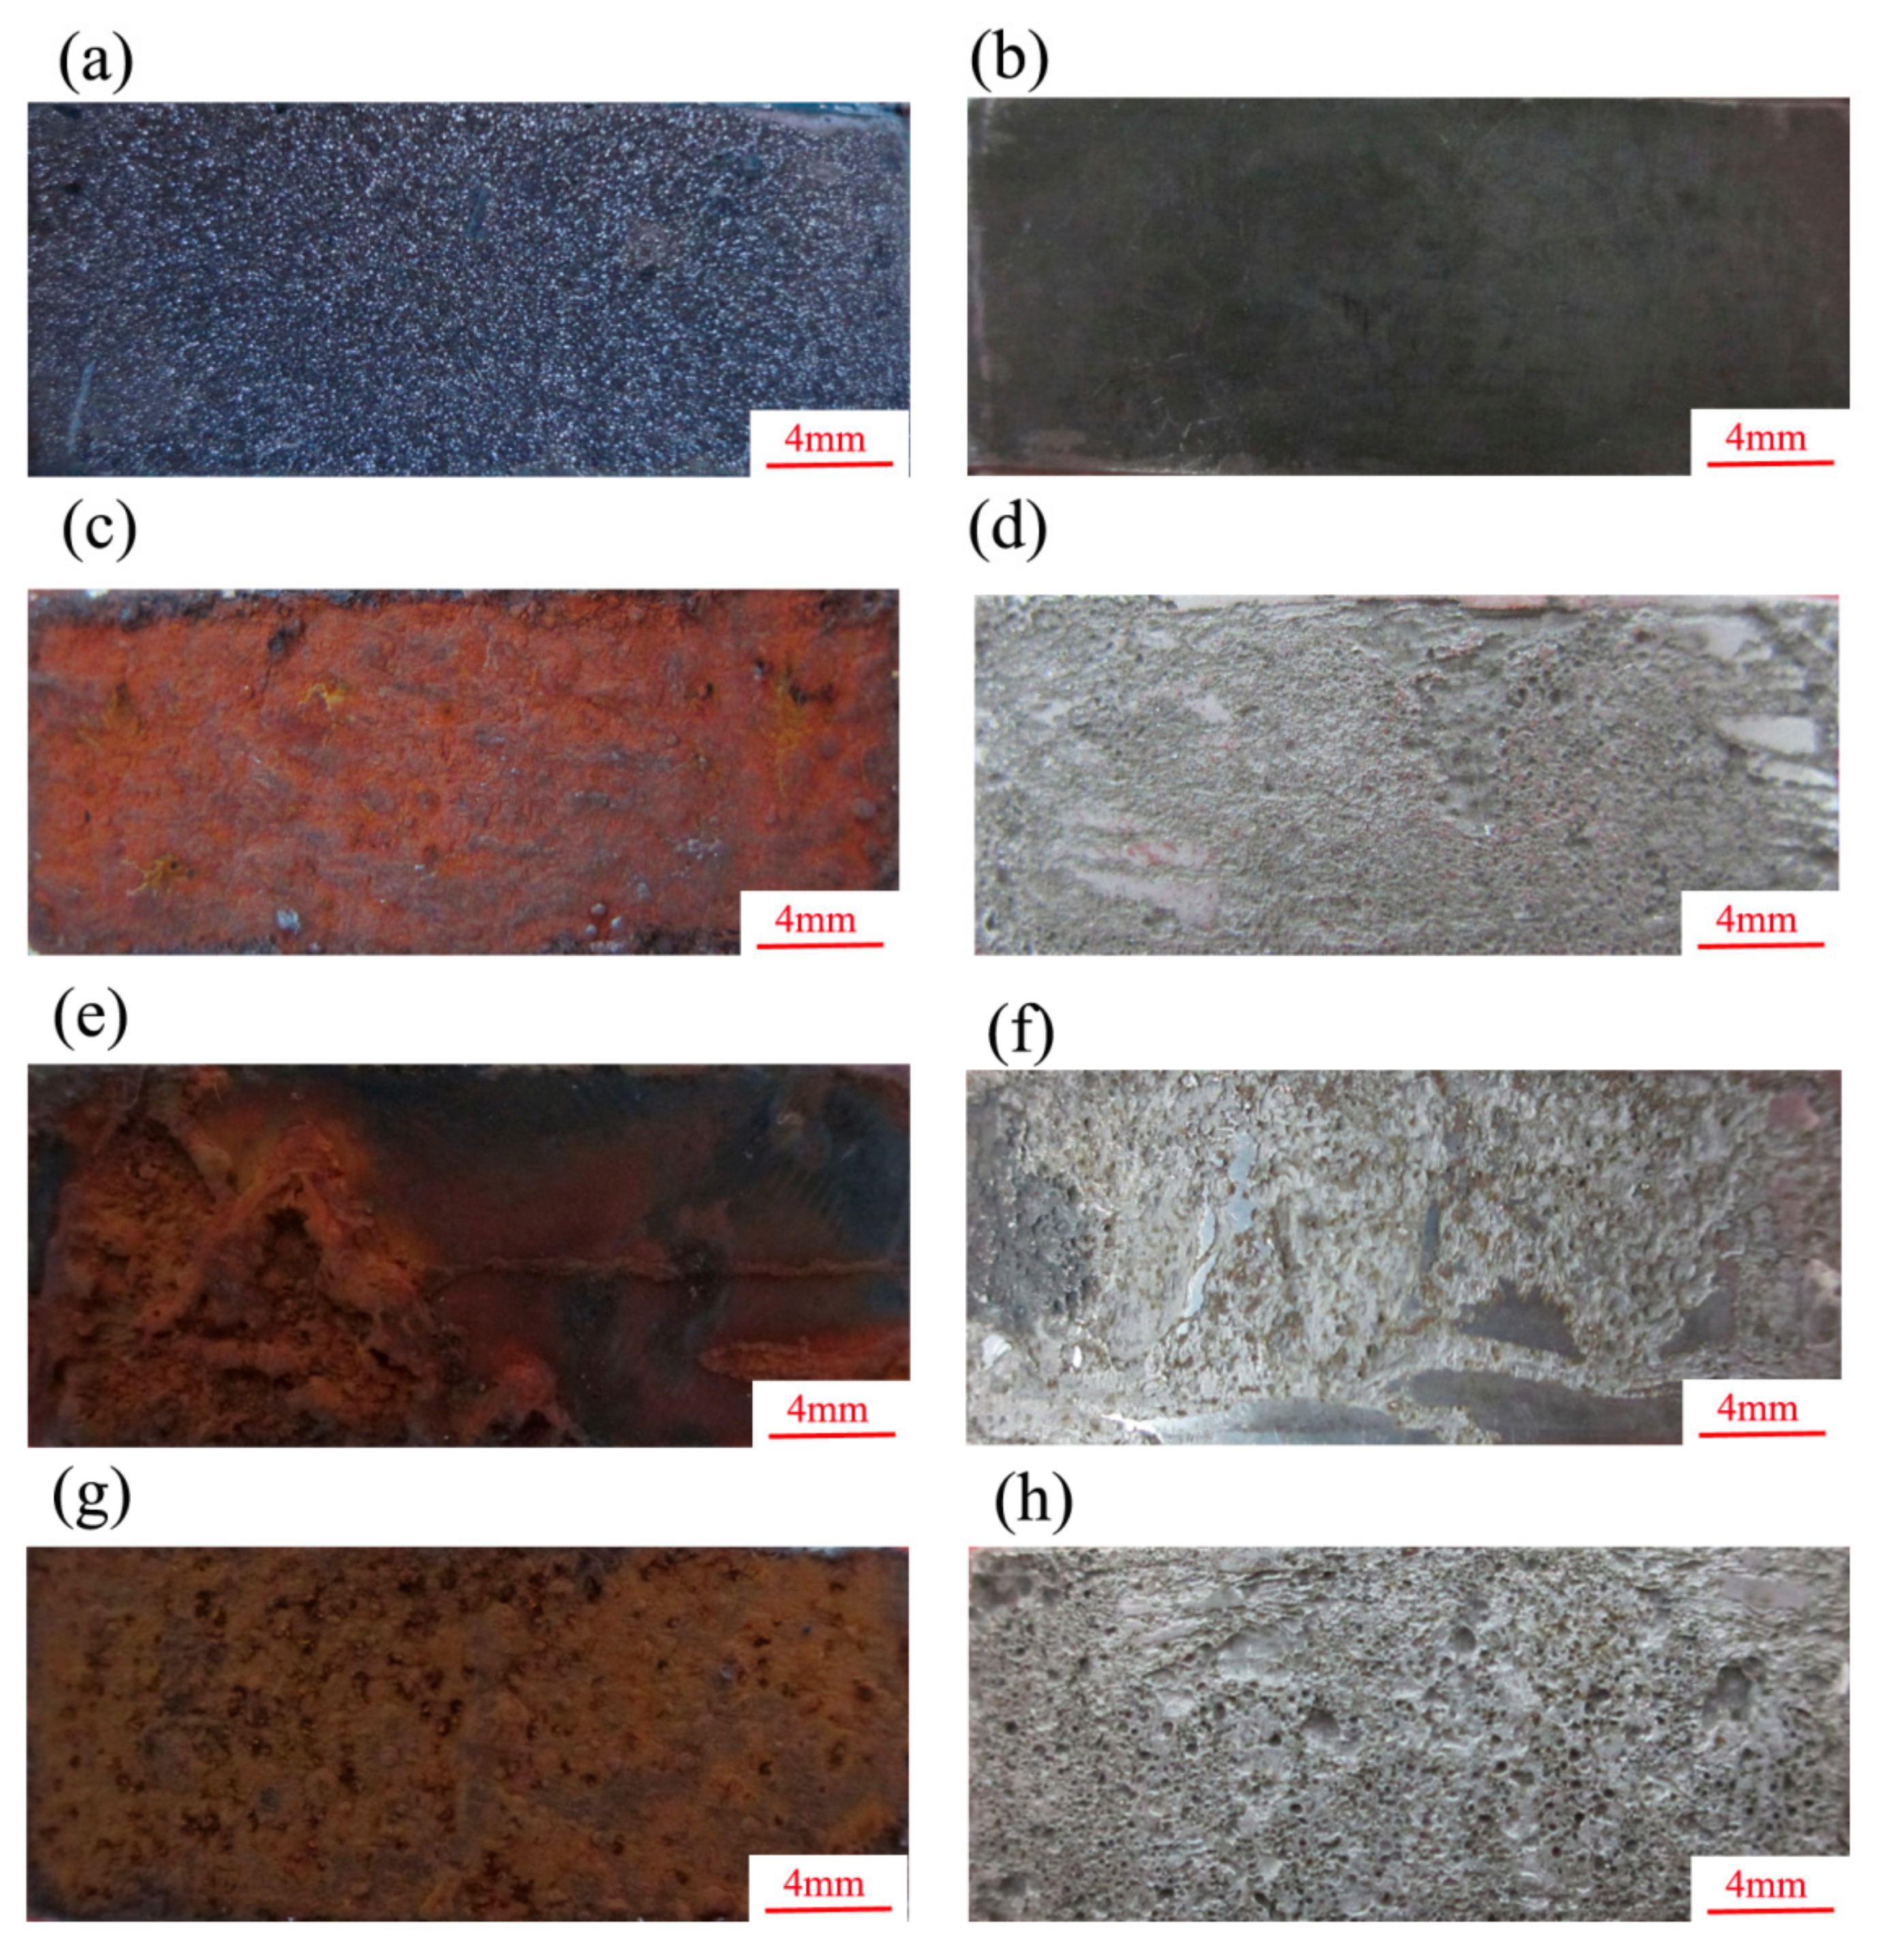
The macrostructure of the erosion-corrosion scales and the substrate after the removal of the erosion-corrosion products are presented in
Figure 5. As shown, the erosion-corrosion products were dense, and the substrate was flat and smooth under the condition of CO
2 (
Figure 5a,b). In the CO
2–O
2 environment, the erosion-corrosion product was loose and reddish-brown (
Figure 5c,e,g); the surface of the substrate after their removal was quite rough, with several pits of different sizes (
Figure 5d,f,h). A certain amount of erosion-corrosion product fell off the surface of the specimens when the pressure of O
2 was 0.6 MPa in the environment.
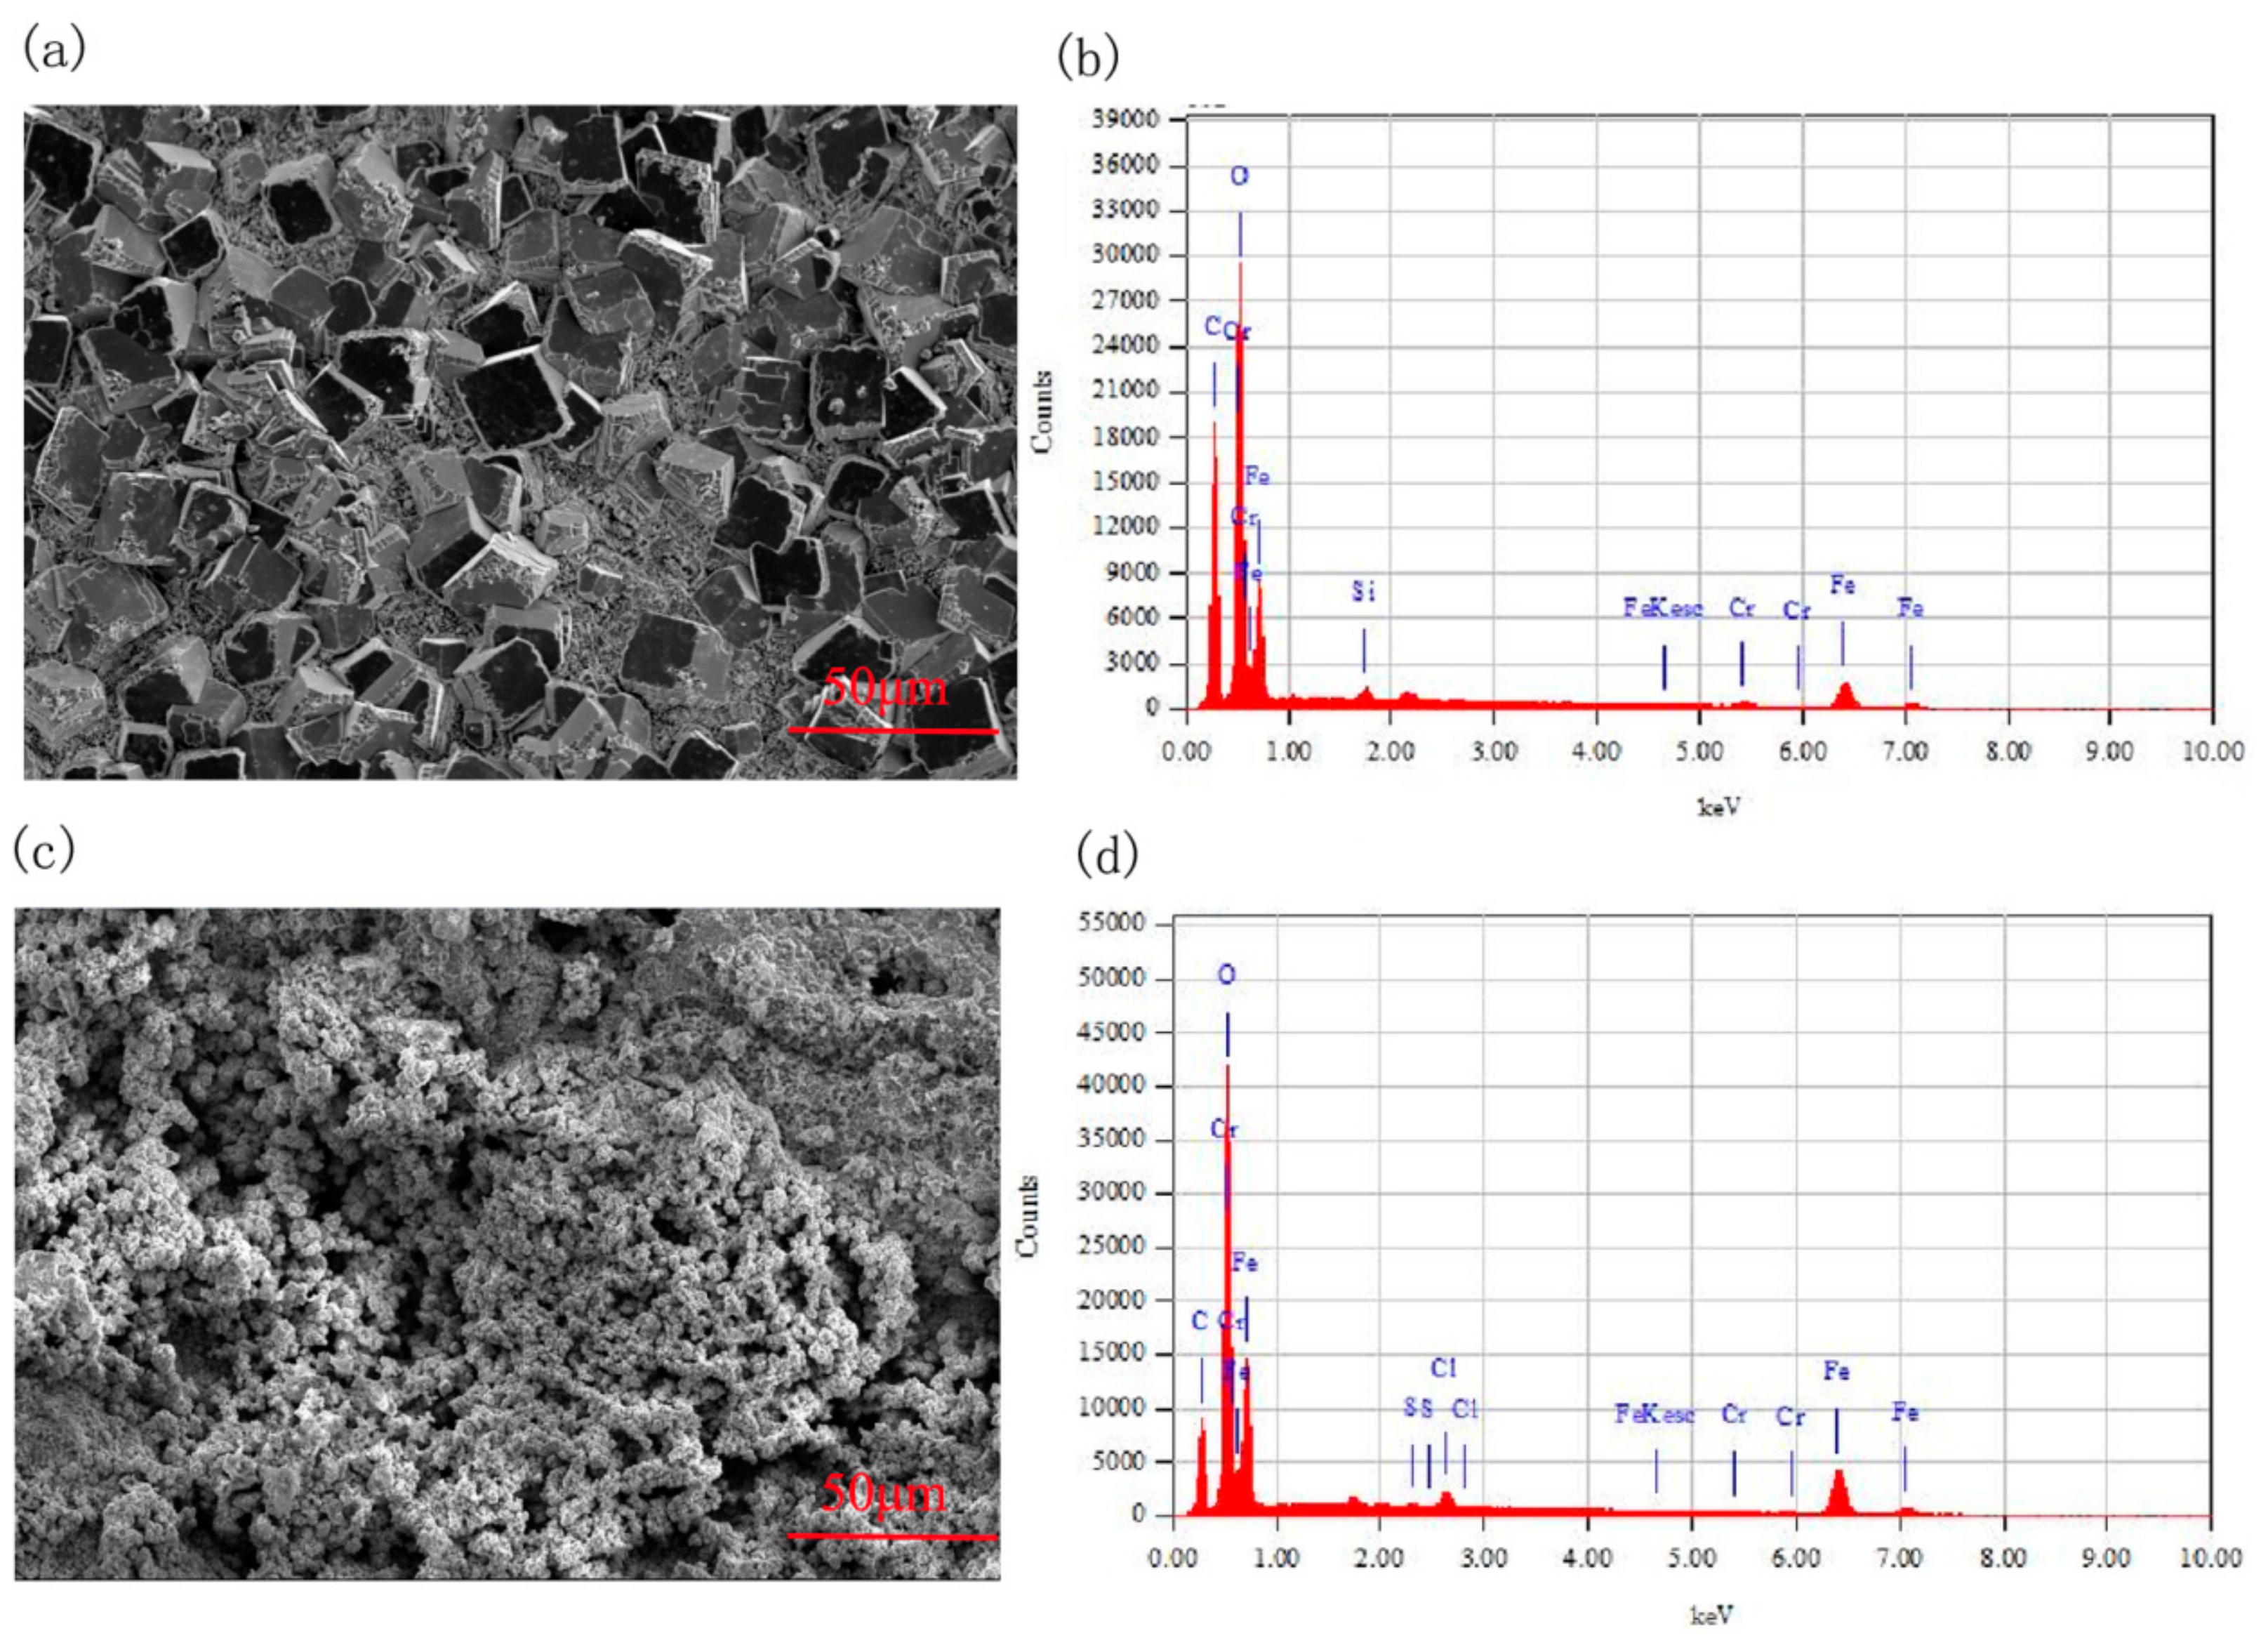
To further explore the microstructure and components of the erosion-corrosion products in CO
2 and CO
2–O
2 environments, SEM and EDS analysis were performed. The micro image and elemental composition are set out in
Figure 6 and
Table 3. From
Figure 6, we can see that grains of different sizes are stacked tightly on the sample surface in the CO
2 environment, while there are no obvious grains on the surface of the specimen; the shape of the erosion-corrosion products is irregular in the CO
2–O
2 environment. The components of the erosion-corrosion scales were mainly elemental C, O, and Fe in the CO
2 and CO
2–O
2 environments. The atomic ratio of elemental O and Fe was about 3 under the condition of CO
2, while it was about 1.7 in the CO
2–O
2 environment. The elemental Cr content in the erosion-corrosion products was obviously lower than that in the substrate of 3Cr steel under the conditions of CO
2 and CO
2–O
2.
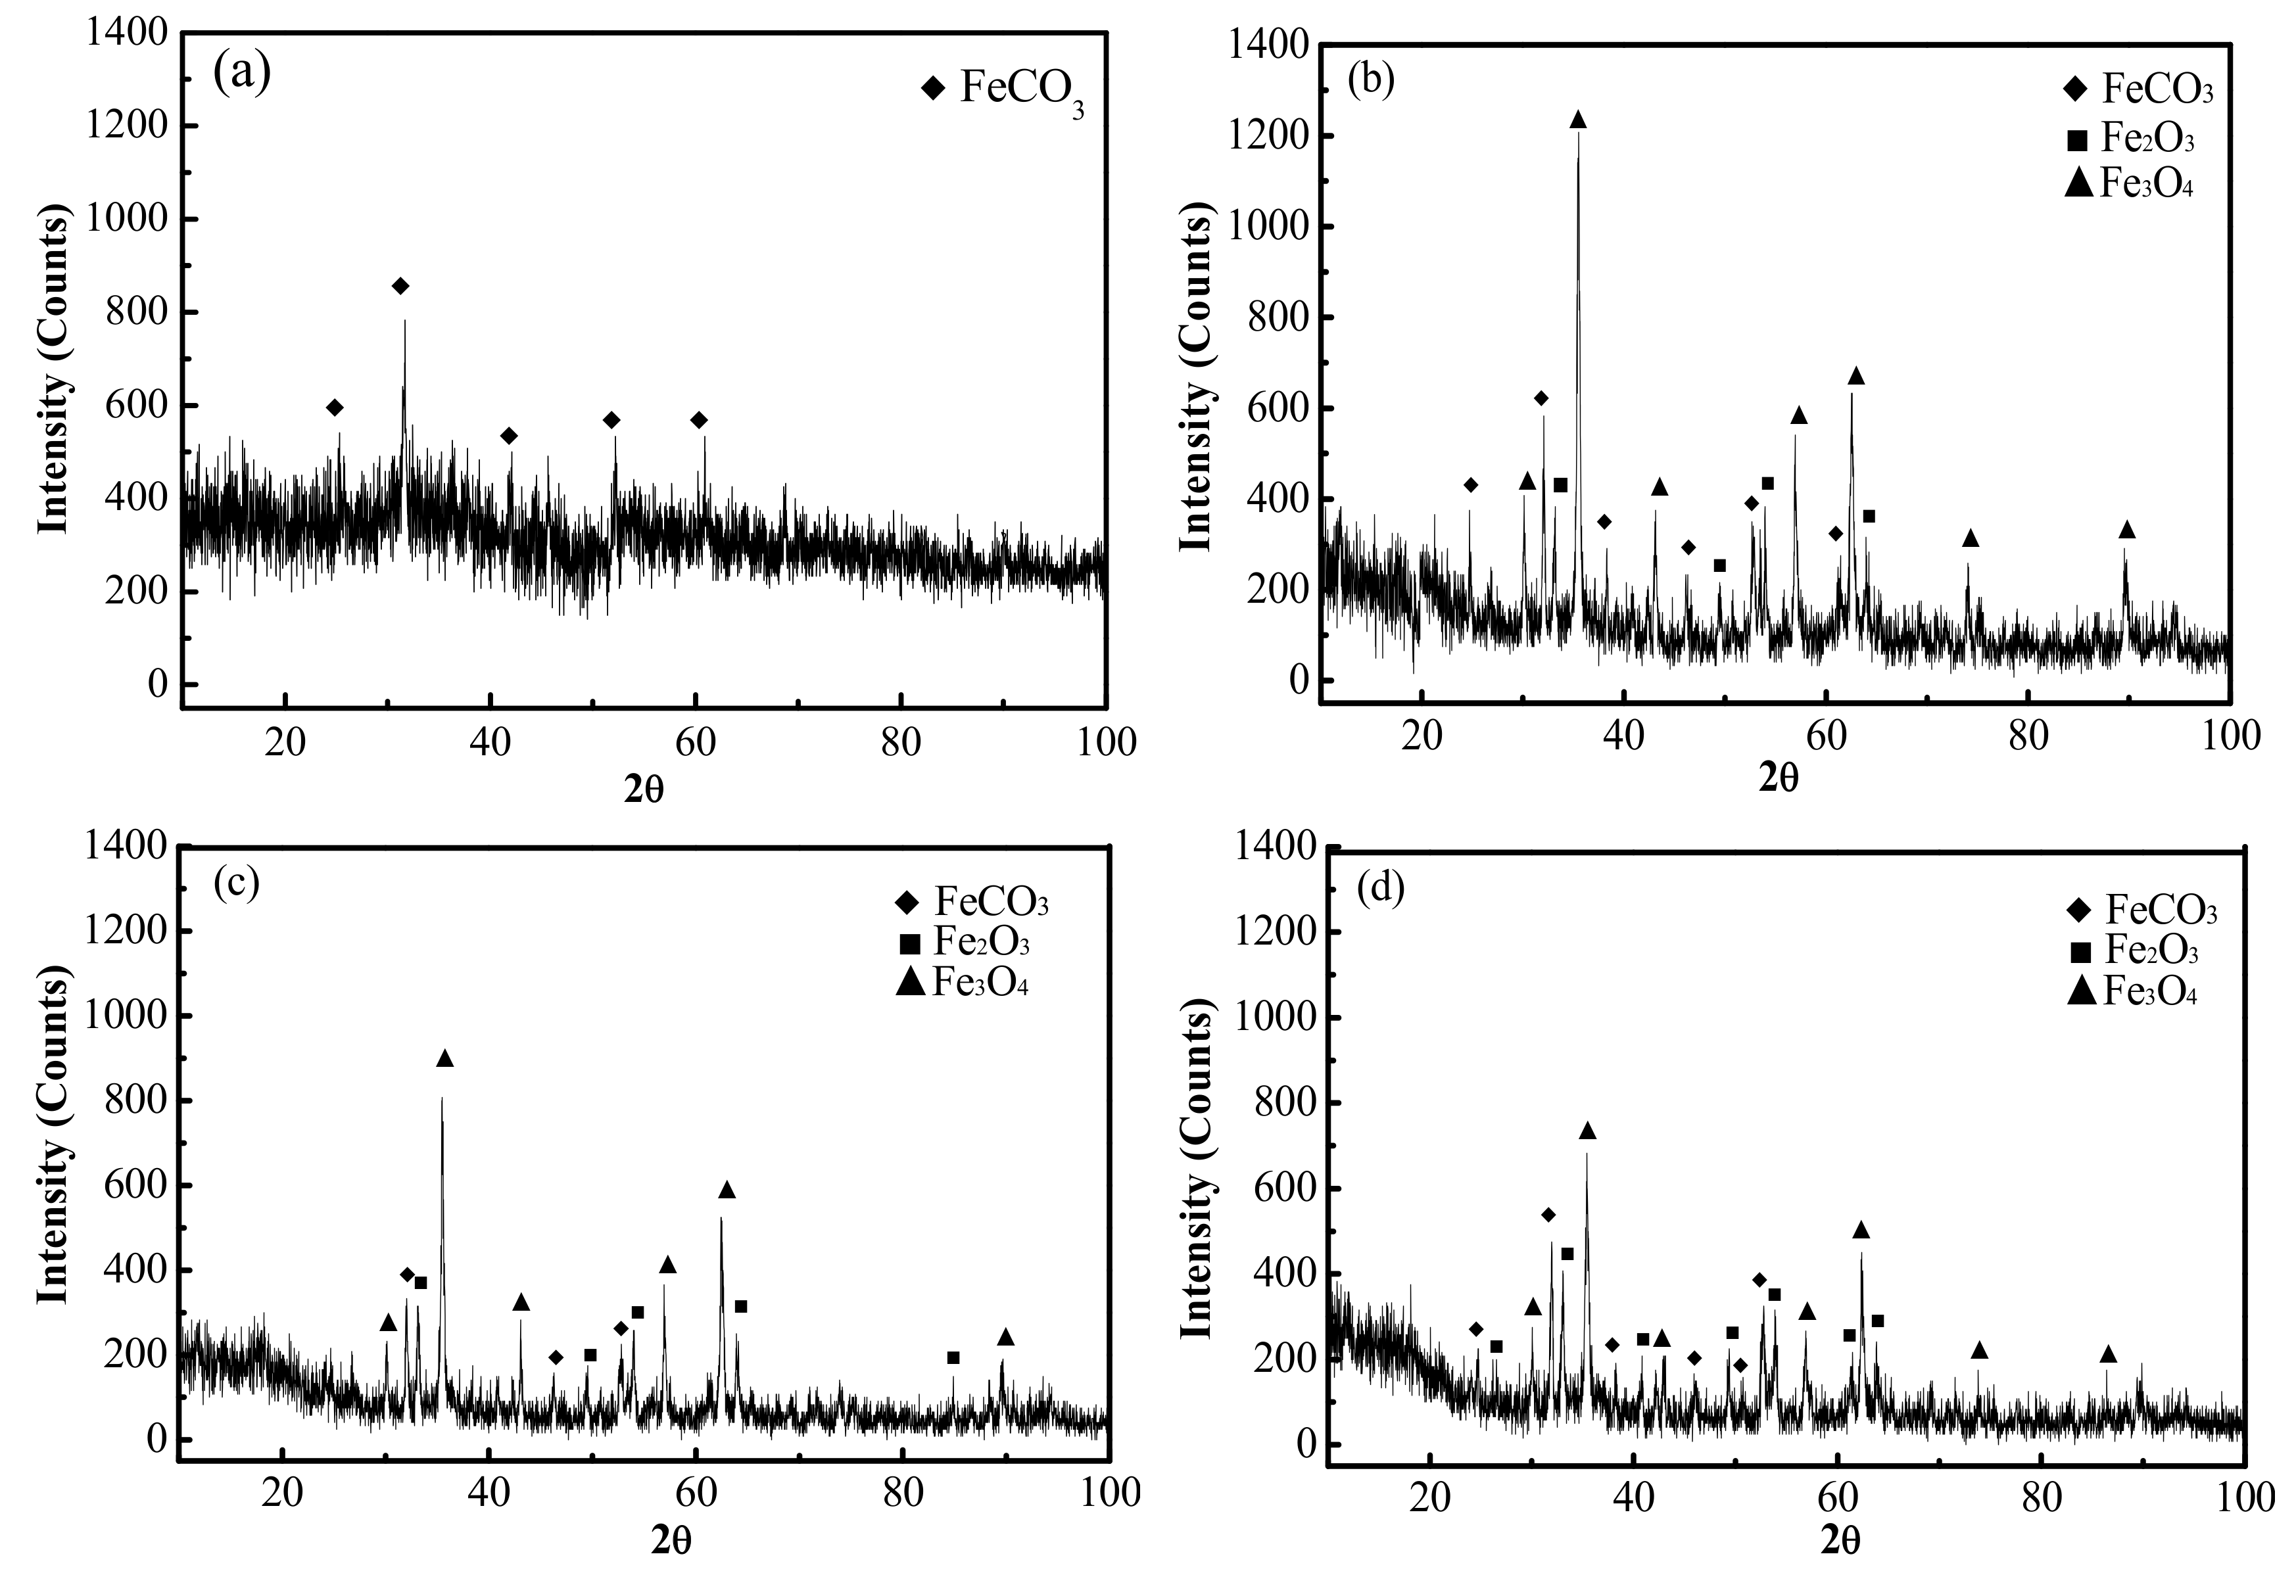
The composition of the erosion-corrosion products under different conditions was also analyzed by XRD, as set out in
Figure 7. The data obtained from
Figure 7 indicates that the erosion-corrosion scale was generally made up of FeCO
3 in the CO
2 environment, which is consistent with the atomic ratio of elemental O and Fe in
Table 3. In addition to FeCO
3, there were also Fe
2O
3 and Fe
3O
4 in the erosion-corrosion products under the condition of CO
2–O
2. There was also a certain amount of amorphous erosion-corrosion product in the CO
2 and CO
2–O
2 environments. Kermani et al. demonstrated that doping steel with Cr causes the erosion-corrosion product film to transform from a crystalline to an amorphous state, the composition of which is mainly Cr(OH)
3, Cr
2O
3 and/or some FeCO
3 [
16]. Comparing with the CO
2 environment, there were fewer amorphous erosion-corrosion products in the CO
2–O
2 environment. A semiquantitative calculation of the crystalline erosion-corrosion scales of the tested steels is presented in
Table 4. The data shows that the quantity of FeCO
3 decreases, and the amount of Fe
2O
3 and Fe
3O
4 increases when the O
2 pressure rises from 0 MPa to 0.4 MPa. However, there was some increase for the amount of FeCO
3, while the amount of Fe
2O
3 and Fe
3O
4 decreased when the O
2 pressure reached 0.6 MPa.
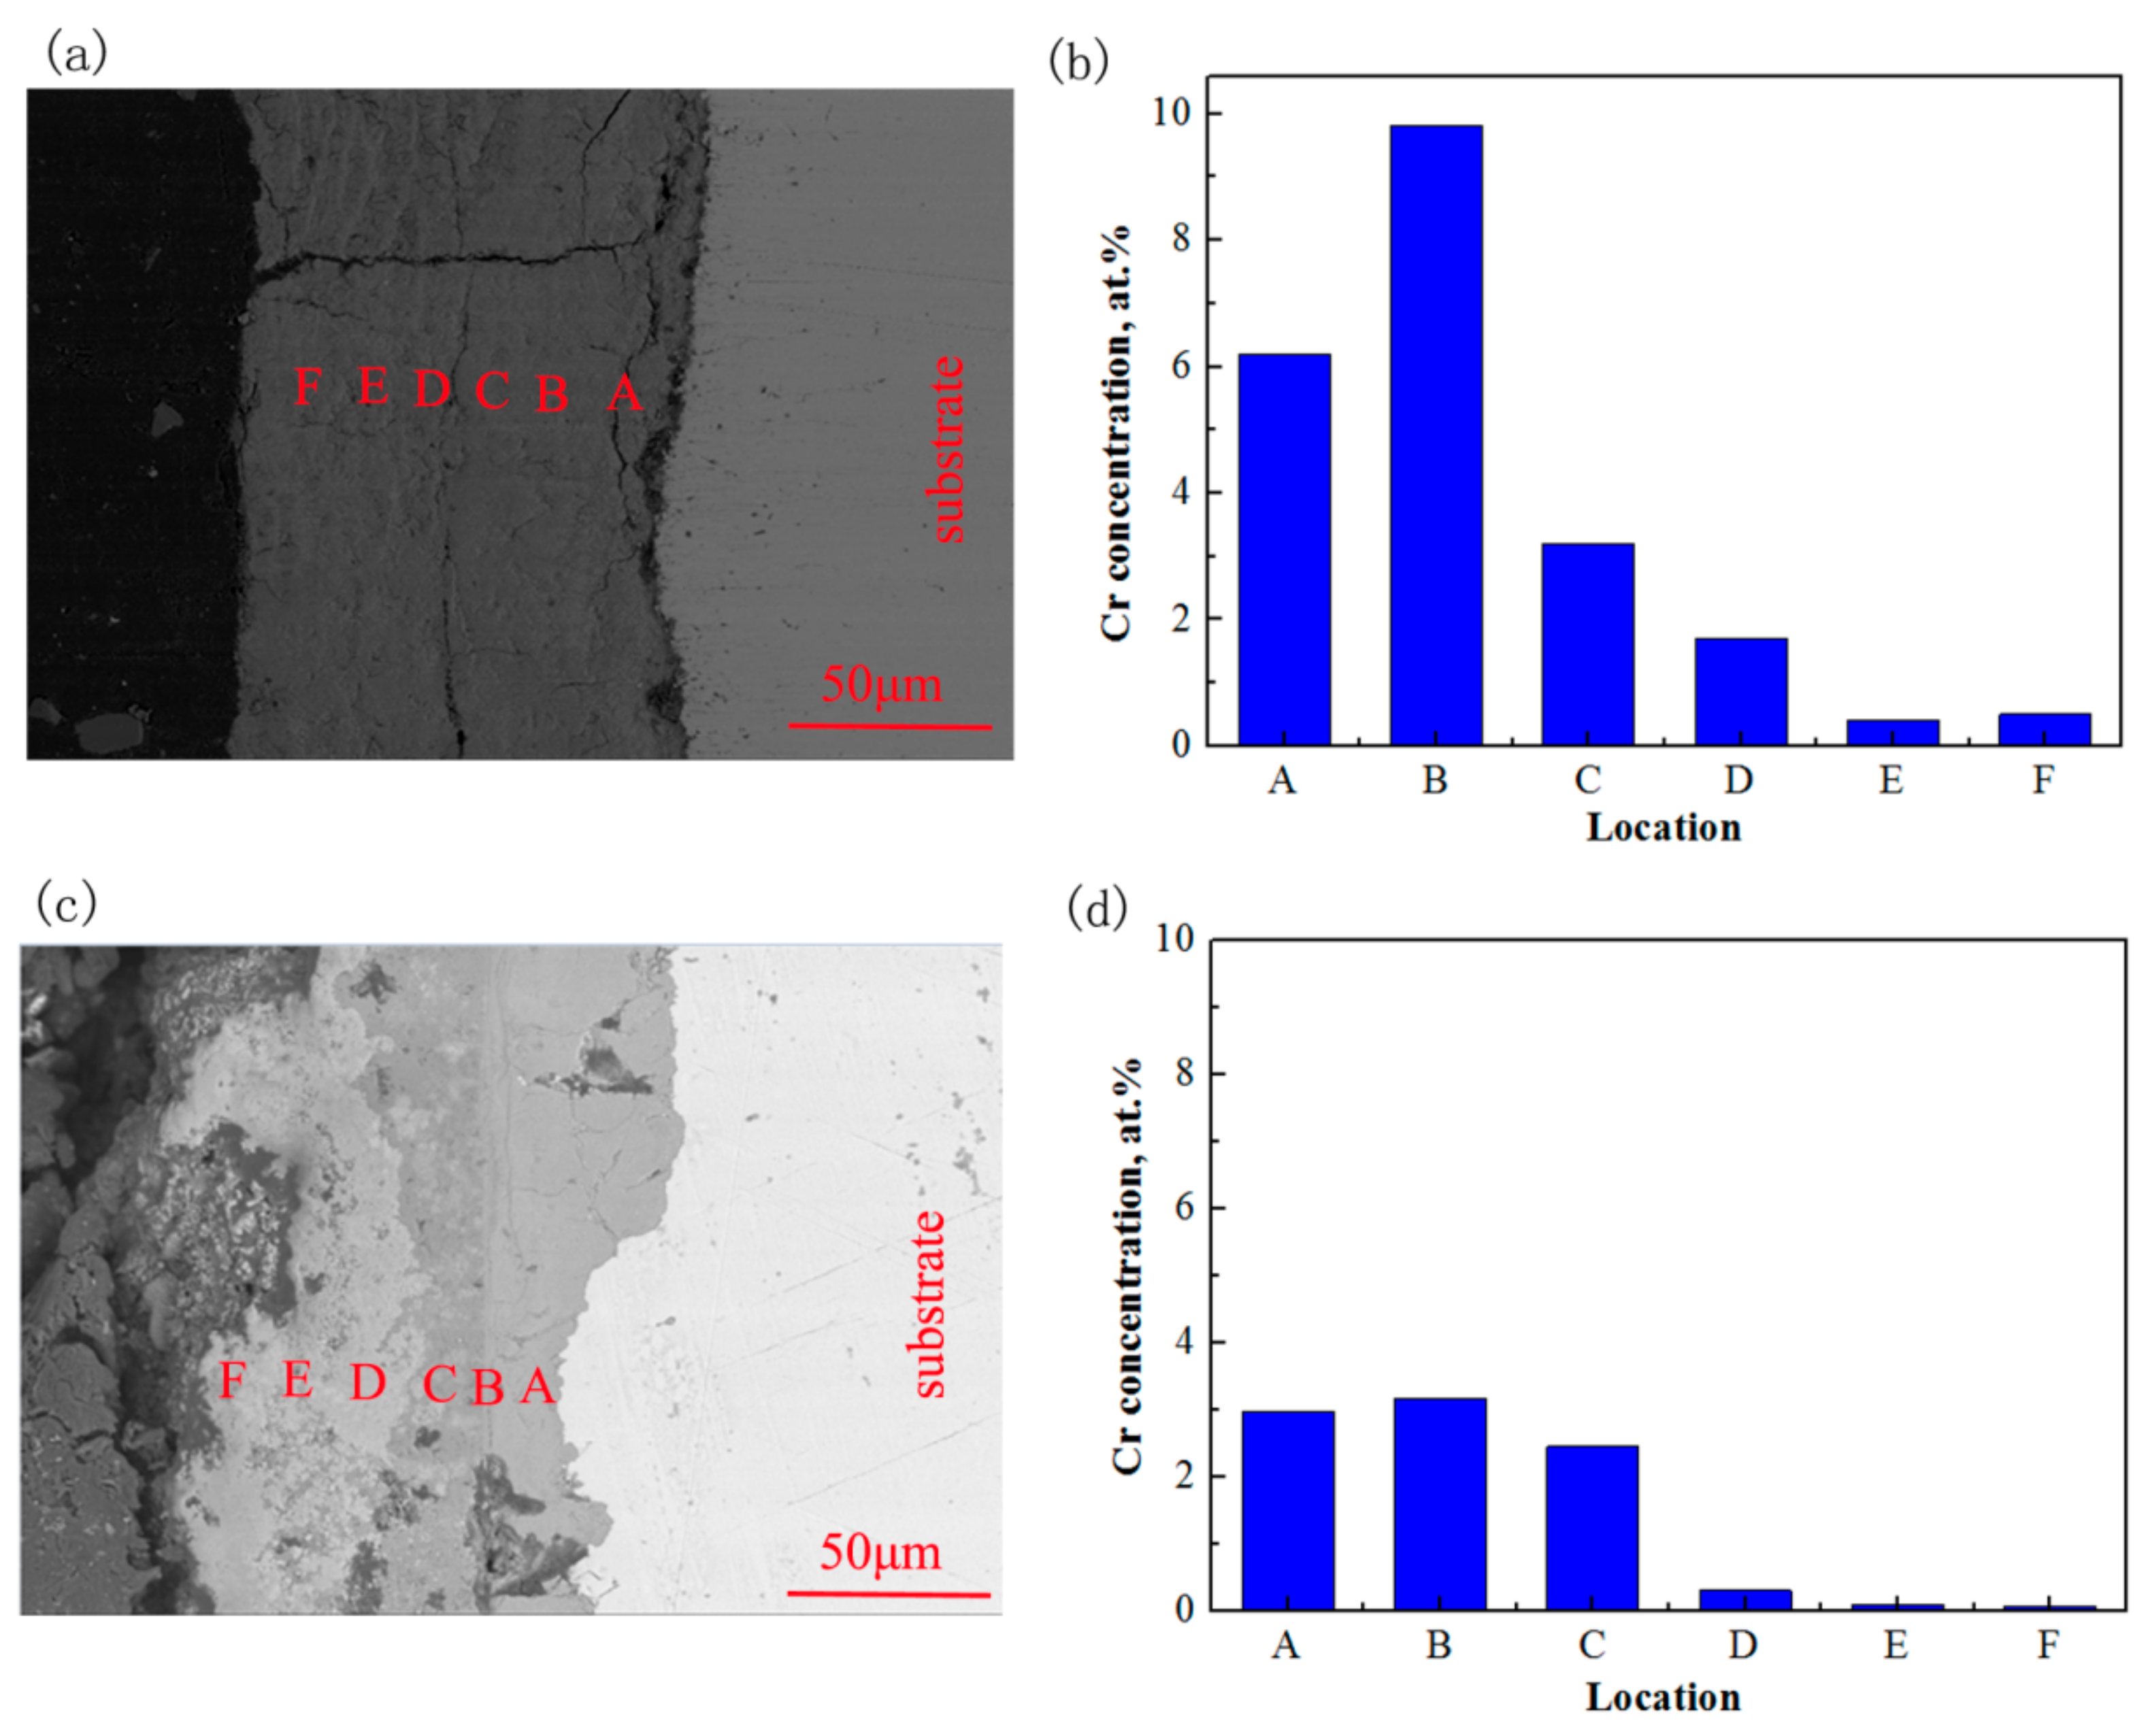
Figure 8 displays the cross-section morphologies and the concentration of Cr in the erosion-corrosion products under CO
2 and CO
2–O
2 environments. As shown in
Figure 8, the interface between the erosion-corrosion products and the substrate was flat in the CO
2 environment. The concentration of Cr increases and then decreases gradually with the erosion-corrosion product from inside to outside. Comparing with the Cr element concentration in the steel substrate, it was obviously higher in the erosion-corrosion product near the substrate. The erosion-corrosion products may be divided into two distinct layers, and the interface between erosion-corrosion products and the substrate is relatively rough in the CO
2–O
2 environment. The concentration of Cr in the inner erosion-corrosion product was similar to that of the substrate. However, there was only a small amount of Cr in the outer erosion-corrosion product under the condition of CO
2–O
2.
In the CO
2 environment, CO
2 can react with H
2O to form H
2CO
3, and some H
2CO
3 will be further dissociated to H
+, HCO
3-, and CO
32− in the solution (Equation (2)–(4)). Therefore, the solution is slightly acidic. A lot of micro-corrosion cells can be formed at the interface between the 3Cr steel and the solution. The H
+ is oxidized to hydrogen (H
2), and Fe and Cr are reduced to Fe
2+ and Cr
3+ (Equation (5)–(7)). The solution on the steel surface gradually becomes slightly alkaline as the reaction progresses. The OH
− can react with Cr
3+ to form Cr(OH)
3 near the 3Cr steel surface (Equation (9)). Because the solubility product (K
sp) of Cr(OH)
3 is quite small, i.e., 6.3 × 10
−31, some Cr(OH)
3 may further react to form Cr
2O
3, according to Equation (10). Fe
2+ can react with CO
32− to form FeCO
3 (Equation (11)), and the FeCO
3 will be deposited on the surface of metal to form an erosion-corrosion product film. However, the generation of FeCO
3 occurs later than that of Cr(OH)
3, because the K
sp of FeCO
3 (3.2 × 10
−11) is larger than that of Cr(OH)
3. That may be the reason why there is Cr enrichment in the inner erosion-corrosion scale in
Figure 8b. Cr(OH)
3 and Cr
2O
3 are amorphous, so they are not recognized by XRD in
Figure 7. The erosion-corrosion scale is dense and stable in terms of preventing the corrosive medium from reaching the surface of the substrate effectively [
17]. Therefore, the erosion-corrosion rate of 3Cr steel is quite low under the condition of CO
2 (
Figure 4).
O
2 may react with H
2O and form OH
- near the 3Cr steel surface (Equation (12)). The solution will become alkaline. Fe
2+ can be oxidized to Fe
3+ by O
2 (Equation (13)). Fe
2+ and Fe
3+ react with OH
- to form Fe(OH)
2 and Fe(OH)
3 (Equation (14), (15)). Some Fe(OH)
2 will be further oxidized to Fe(OH)
3 by O
2 (Equation (16)). Fe
2O
3 and Fe
3O
4 can be formed through Equation (17) and (18). Some FeCO
3 may be oxidized to Fe
2O
3 according to Equation (19). Cr(OH)
3, Fe
2O
3 and/or Fe
3O
4 may deposit on the surface of 3Cr steel simultaneously, which is not conducive to the formation of a dense and protective erosion-corrosion scale film. The erosion-corrosion scale will be loose and porous, so that a corrosive medium cannot be prevented from reaching the substrate of the steel under the condition of CO
2–O
2. Thus, the erosion-corrosion rate increases significantly when O
2 is present in the environment (
Figure 4). There will be more dissolved O
2 in the solution and at the interface of 3Cr steel and the solution, with the partial pressure of O
2 increasing. This is conducive to the formation of Fe
2O
3 and/or Fe
3O
4 according to Equation (12)–(19) (
Table 4), which will accelerate the erosion-corrosion of 3Cr steel. The outer erosion-corrosion product is mainly loose Fe
2O
3 and/or Fe
3O
4, which easily falls off the surface of 3Cr steel under the action of scouring. More Fe
2O
3 and/or Fe
3O
4 falls off the erosion-corrosion scales when the partial pressure of O
2 reaches 0.6 MPa, resulting in a lower quantity of Fe
2O
3 and Fe
3O
4 (
Table 4).


