Abstract
Potassium ferricyanide and potassium ferrocyanide were used to observe and monitor the pitting corrosion of 304 stainless steel (SS) at anodic polarization in situ. The results show that there are Fe3+ ions around the corrosion pit when pitting occurs on 304 SS in NaCl aqueous solution. The effect of Fe3+ surrounded pits on the pitting corrosion was also studied by testing the electrochemical behavior of 304 SS in different Fe3+/Fe2+ solutions. The presence of Fe3+ leads to the positive shift of corrosion potential and the increase of corrosion rate of 304 SS. There are two possible reasons for this phenomenon. On the one hand, Fe3+ hydrolysis results in the decrease of pH value of solution. At the same iron ion concentration, the higher the Fe3+ ion concentration, the lower the solution pH value. On the other hand, Fe3+ may reduce on the electrode surface. The decrease of solution pH and the reduction of Fe3+ resulted in the acceleration of the corrosion rate.
1. Introduction
Pitting corrosion is a common localized corrosion form of stainless steel (SS) in chloride-containing environments [1,2,3,4]. Pitting is generally focused on a small area of a metal surface and causes devices to fail by perforation or initiates stress corrosion cracks [5,6]. It is widely accepted that oxygen reduction and/or hydrogen reduction reactions occur at the cathode during the corrosion of metals [7,8,9], but for the pitting corrosion of stainless steel, the cathodic reaction becomes very complex.
It is known that some corrosion products diffuse to the outside of pits during the growth of corrosion pits [10,11]. The hydrolysis of cations changes the corrosive environment of the passive film outside the pits [12]. Fe2+ is the main corrosion product in the pitting process of 304 SS, but it is easily oxidized to Fe3+ [13,14] in electrolytes containing oxidants such as Equation (1).
Meanwhile, the use of FeCl3 solution as a corrosion medium to study the pitting corrosion behavior of SS has been widely accepted [15,16]. However, as Fe3+ reduction may occur on the cathode in FeCl3 solution, and it is unknown whether Fe3+ exists around the pit and whether Fe3+ reduction reaction will occur on the surface of SS during pitting corrosion, so it is not accurate to use FeCl3 as corrosion medium to study pitting corrosion of stainless steel.
Fe3+ cannot exist stably on the surface of electrodes because the surface potential of 304 SS electrodes in an open-circuit state is lower than that of Fe3+ reduction [9]. This raises a new problem regarding whether there are no Fe3+ ions around the corrosion pit of SS or there are Fe3+ ions, but they are reduced on the electrode surface. Oxides of Fe(III), such as α-FeOOH, γ-FeOOH and Fe3O4, are founded in the corrosion products of SS or iron [8,17,18,19], but there is no relevant report to confirm the existence of Fe3+ ions around the pits for the pitting corrosion of SS.
Researchers have found that Fe2+ and Fe3+ can be sensitively detected by potassium ferricyanide [20,21] and potassium ferrocyanide [22,23], respectively. Therefore, potassium ferricyanide and potassium ferrocyanide are used to verify the presence of Fe3+ around the pits of SS in this work. The electrochemical behavior of 304 SS in a 0.1 mol/L iron ion solution with different Fe3+/Fe2+ ratios was also studied using potentiodynamic polarization curves. Based on this, the effect of Fe3+ surrounded pits on the pitting corrosion of 304 SS was discussed.
2. Experimental
2.1. Sample Preparation
Type 304 SS, with a chemical composition (wt.%) of 0.035 C, 0.52 Si, 1.18 Mn, 0.036 P, 0.026 S, 18.21 Cr, 8.03 Ni and balanced with Fe, was used as the specimen in this work. The 304 SS was cut into 1 mm and 10 mm diameter cylinders. These samples were soldered to copper wires by tin and then embedded in epoxy resin to act as the working electrode (WE). All the samples were finished by wet-grinding with a series of emery papers from 400 to 1200 grit, cleaned with distilled water and acetone, and dried in cold air.
2.2. Chromogenic Testing
The distribution and diffusion of corrosion products during the pitting corrosion of 304 SS were observed with the experimental device shown in Figure 1. Potassium ferricyanide and potassium ferrocyanide was used to observe and to monitor the pitting corrosion of 304 stainless steel (SS) at anodic polarization in situ. A KH-7700 three-dimensional video microscope (Hirox Co., Ltd., Tokyo, Japan) lens was placed above the sample to monitor the surface morphology of sample in real-time. During the chromogenic testing, the 304 SS electrode with a diameter of 1 mm or 10 mm was potentiostatically polarized in a 3.5 wt.% NaCl and 0.05 wt.% K3[Fe(CN)6] solution or a 3.5 wt.% NaCl and 0.05 wt.% K4[Fe(CN)6]·3H2O solution, respectively. In addition, neither of the two solutions were oxygenated or deaerated. In order to obtain the growth parameters of a single pit, it was necessary to use an electrode with a 1 mm diameter (area of 7.85 × 10⁻³ cm2), whereas a 10-mm diameter electrode was used to obtain the statistical data of a large number of stable pits.
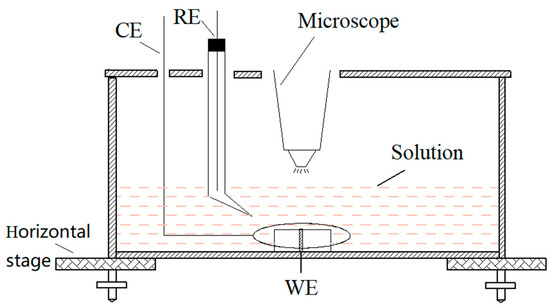
Figure 1.
The schematic of chromogenic testing device.
The chrono amperometry curve was carried out on an Autolab PGSTAT 302N electrochemical workstation (Metrohm A G, Herisau, Switzerland), a saturated calomel electrode (SCE) was used as the reference electrode (RE) and a platinum sheet around the sample was used as the counter electrode (CE), the applied potential was 0.35 V (SCE). Prior to testing, the electrodes were cathodically polarized for 20 min at –1.2 V(SCE) to remove the oxide film on the surface and were then immersed in a 3.5% NaCl solution for 3 h to reconstitute a stable passive film [24]. According to the literature [20,21,22,23], K3[Fe(CN)6] and K4[Fe(CN)6]·3H2O could react with Fe2+ and Fe3+, respectively, to generate Prussian blue and then to detect the presence of Fe2+ and Fe3+ in the solution.
2.3. Electrochemical Testing of 304 SS in Different Iron Ion Solutions
The effect of Fe3+-surrounded pits on the pitting corrosion of 304 SS was studied by testing the electrochemical behavior of 304 SS in different iron ion solutions. According to the results of chromogenic testing, iron ions outside the pits can be maintained at a concentration of 0.36 mol/L or higher during the growth of the pits. In this work, 0.1 mol/L iron ion solutions were selected as the testing solution, as shown in Table 1. as shown in Table 1. Deionized water was poured into a flask and bubbled with argon for 30 min. FeCl3·6H2O and FeCl2·4H2O were then added for the preparation of iron ion solutions with different Fe3+/Fe2+ ratios. The pH value of the solution was measured by a pH meter (METTLER TOLEDO FE20, Mettler-Toledo, Zurich, Switzerland) before testing.

Table 1.
The iron ion solution with different Fe3+/Fe2+ ratios for electrochemical testing.
Subsequently, type 304 SS samples with diameters of 10 mm were used as the working electrodes in these tests. Prior to testing, the electrodes were cathodically polarized for 20 min at −1.2 V (vs. SCE) to remove the oxide film on the surface and were then immersed in a 3.5% NaCl solution for 3 h to reconstitute a stable passive film [24,25]. Potentiodynamic polarization measurement was carried out at a potential scanning rate of 2 mV/s. In addition, all tests were repeated using three duplicate specimens to confirm reproducibility.
3. Results and Discussion
3.1. Chromogenic Testing Results
A 304 SS electrode with a diameter of 1 mm was potentiostatically polarized in a 3.5 wt.% NaCl and 0.05 wt.% K3[Fe(CN)6] solution (this solution is not oxygenated/deaerated) at 0.35 V (SCE) for 400 s. The corresponding current-time curve is shown in Figure 2(I). The corrosion current increased sharply at 344 s, which is a typical sign that pitting corrosion occurred on the sample surface [3,5,20,21]. Meanwhile, the corrosion pits and blue spots could be observed by the three-dimensional microscope. If this time was redefined as 0 s, the growth of a single pit with time is shown in Figure 2(II)a–h. It can be seen that the current value increased continuously and the size of the pit mouth and blue spot continued to expand as the polarization progressed. Fe2+ was the only substance in the solution that can make potassium ferricyanide blue, so it can be confirmed that Fe2+ was present around pitting holes of 304SS.
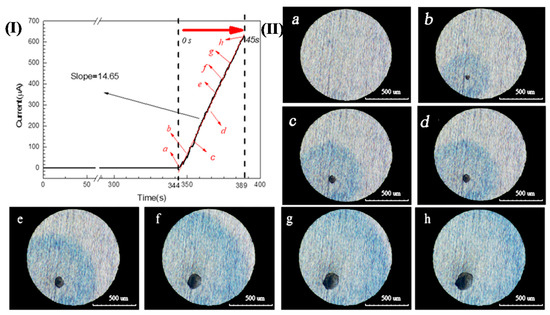
Figure 2.
(I). Chrono amperometry curve of 304 SS in a 3.5 wt.% NaCl and 0.05 wt.% K3[Fe(CN)6] solution at 0.35 V(SCE); (II). Images of the growth of a single pit over time corresponding to Figure 2(I): (a) 0 s, (b) 5 s, (c) 10 s, (d) 20s, (e) 30 s, (f) 35 s, (g) 40 s, and (h) 45 s.
In addition, the presence of Fe3+ during pitting corrosion was detected by the chromogenic reaction when 304 SS was potentiostatically polarized in a 3.5 wt.% NaCl and 0.05 wt.% K4[Fe(CN)6]·3H2O solution at 0.35 V (SCE), as shown in Figure 3(I). Figure 3(II)a–h clearly show that blue spots appeared around the corrosion pits and the size of blue spots also expanded with the growth of corrosion pits. Since the electrolyte did not contain K3[Fe(CN)6] and there were no other ions that can made K4[Fe(CN)6]·3H2O discolor, so this might be the color reaction of Fe3+ and K4[Fe(CN)6]·3H2O in the solution. This chromogenic phenomenon fully indicated that both Fe2+ and Fe3+ are present in the corrosion products around the corrosion pits of 304 SS.
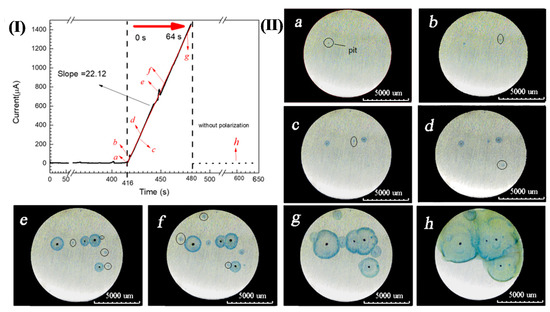
Figure 3.
(I) Chrono amperometry curve of 304 SS in a 3.5 wt.% NaCl and 0.05 wt.% K4[Fe(CN)6]·3H2O solution at 0.35 V(SCE). (II). Distribution and diffusion of pitting corrosion products over time corresponding to Figure 3(I): (a) 0 s, (b) 2 s, (c) 11 s, (d) 13 s, (e) 33 s, (f) 38 s, (g) 61 s and (h) 184 s.
The blue spot and pit diameters shown in Figure 2 are plotted in Figure 4. The average concentration of iron ions around the pit could be approximately calculated from this. According to the current-time (i-t) curve shown in Figure 2(I), the amount of charge (Q) generated by the growth of the pit could be obtained by integrating i with t. The total molar amount of iron ions (including ferric and ferrous) produced by the growth of pit could also be calculated by Faraday’s law [6], so Equations (2) and (3) are applicable:
where z is the average cation valence (2.19) [6], F is the Faraday constant (96,500 C/mol) and V is the volume of the blue spot, C is the concentration of iron ions (the elements such as Cr and Ni were ignored). If the blue spot was assumed to be hemispherical and all corrosion products diffused into the blue spot, the average concentration of iron ions in the blue spot at different times was calculated, as shown in Figure 4. At the initial stage of pit growth, the iron ion concentration in the blue spot could reach 0.36 mol/L. When the pit grew to 3 s, the average concentration of iron ions in the blue spot decreased dramatically to 0.1 mol/L, the diameter of blue spot was up to 200 μm at this time, while the diameter of the pit mouth was only 23 μm.
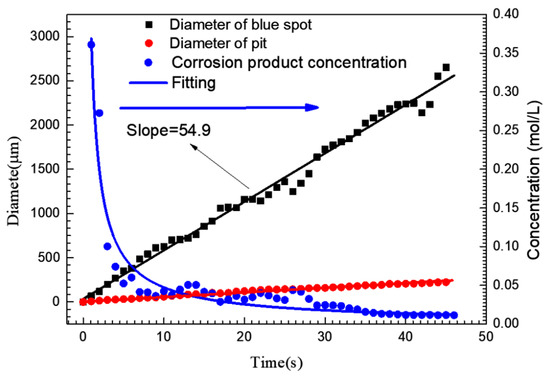
Figure 4.
Variation curve of pit mouth diameter, blue spot diameter and the average corrosion product concentration in the blue spot area corresponding to a single pit corresponding to Figure 2(I).
If the convection and electromigration in the process of corrosion product migration are ignored and only the diffusion process is considered, the iron ion concentration in the center of the blue point can be estimated roughly by Fick’s second law.
where c is the concentration of corrosion product (iron ions), x is the distance from the center point, t is the diffusion time of corrosion products, c0 is the concentration of iron ions (including ferric and ferrous) in the bulk solution and ccenter is the iron ion concentration at the center of blue spot. According to Figure 4, the diameter of the blue spot grew linearly with the polarization time. Hence, the concentration of iron ions at the blue point boundary (cb) can be expressed as:
where v is the horizontal diffusion velocity of the blue spot. The concentration of iron ions at the center of the blue point can be expressed as:
Due to c0, cb, D, and v being constants, it can be seen from Equation (5) that the iron ion concentration at the center of the blue point (ccenter) is positively correlated with the pit growth time, that is to say, for the single pit given in Figure 2, the concentration of iron ions at the orifice increases with the growth of the pit.
On the basis of the above, iron ions outside the pits can be maintained at a concentration of 0.36 mol/L or higher during the growth of the pits. In this work, 0.1 mol/L iron ion solutions were selected as the research object to discuss the effect of the transformation from Fe2+ to Fe3+ on the pitting corrosion of 304 SS by changing the Fe2+/Fe3+ ratio.
3.2. Electrochemical Testing Results of 304 SS in Different Iron Ion Solutions
Figure 5 gives the potentiodynamic polarization curves of 304 SS in a 0.1 mol/L iron ion solution (deaerated) with different concentrations of Fe3+. It is shown that there was a significant passive zone in the anode branch of the polarization curve for 304 SS in the 0.1 mol/L FeCl2 solution without Fe3+. The passivation range is between −0.3–0.3 V (SEC), but the current density fluctuated between 0.2–0.3 V (SEC), this is because the passivation film on the surface of 304 SS is unstable when the potential is between 0.2–0.3 V (SEC), and metastable pits are easy to appear on the surface. The constant initiation and repassivation of pits lead to current peaks in the anode polarization curve. However, if 30% Fe2+ (or more) in solution was replaced by Fe3+, the steel showed active dissolution behavior. Moreover, the corrosion potential of the 304 SS shifted positively and the corrosion current density increased with increasing Fe3+ content. As shown in Figure 5 and Table 2, the corrosion potential of 304 SS in the 0.1 mol/L FeCl2 solution was −0.316 V (SCE), but the value in the 0.1 mol/L FeCl3 solution was 0.123 V (SCE). The corrosion potential of 304 SS in the 0.1 mol/L FeCl3 solution is shifted positively by about 0.439 V (SCE) more than that in the 0.1 mol/L FeCl2 solution. At the same time, the corrosion current density (Jcorr) increased from 1.09 μA/cm2 to 3.42 μA/cm2.
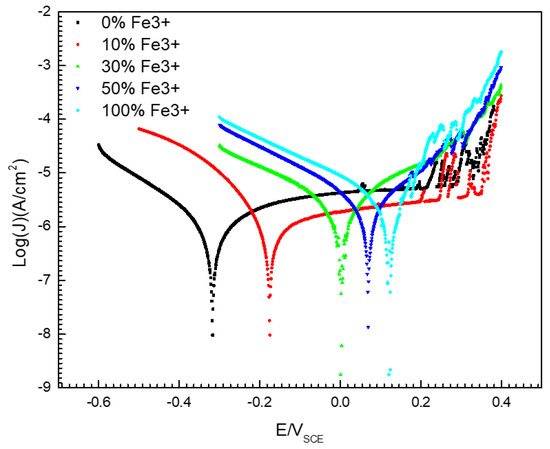
Figure 5.
Potentiodynamic polarization curves of 304 SS in 0.1 mol/L iron ion solutions (deaerated) with different proportions of Fe2+/Fe3+.
Table 2.
Fitting values for polarization curves of 304 SS in 0.1 mol/L iron ion solution with different proportion of Fe3+.
The pH value of the solution with different proportions of Fe2+/Fe3+ is shown in Figure 6. It can be seen that the pH value of the 0.1 mol/L FeCl2 solution without Fe3+ was 3.37. The pH value of the solution rapidly decreased to 2.31 when 10% Fe2+ was replaced by Fe3+ and the concentration of free hydrogen ions increased by 11.5 times. If all the Fe2+ in the solution was completely replaced by Fe3+, the pH value of the solution decreased to 1.64.
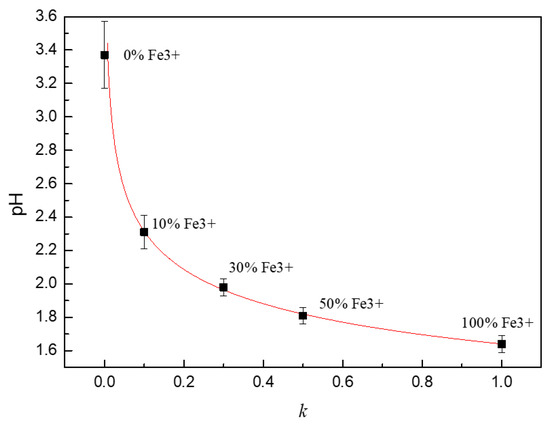
Figure 6.
The pH value of solutions with different proportions of Fe2+/Fe3+.
The pH value of solution decreased significantly with the increase of Fe3+ in the simulated solution, which is because the hydrolysis ability of Fe3+ iron is much greater than that of Fe2+ iron. The solubility product constants of Fe(OH)2 and Fe(OH)3 are quite different according to Lange’s handbook of chemistry. The solubility product constant of Fe(OH)2 is 4.87 × 10⁻¹⁷,and the solubility product constant of Fe(OH)3 is 2.79 × 10−39. Assuming that the concentration of Fe2+ around the pit is 0.1 mol/L, which can be obtained according to the definition of stable product:
Assuming that Fe2+ completely transforms Fe3+, we can get:
The calculation results shown that the hydrolysis molar quantity of Fe2+() is about 6.65 × 10⁻⁷ mol/L and the hydrolysis molar quantity of Fe3+ is about 0.0156 mol/L. The hydrolysis ability of Fe3+ is much greater than that of Fe2+.
Some research shows that the decrease of pH value will lead to the positive shift of corrosion potential and the increase of corrosion rate of 304 SS [8,26,27]. The reason is that in acidic solutions, especially when the pH is low, the hydrogen evolution reaction accounts for a large proportion in the cathode process. With the decrease of pH, the rate of hydrogen evolution increases, which consumes the electrons on the electrode surface and leads to the rise of potential. It seems reasonable to explain the experiment from this point of view, but there is an experimental phenomenon that cannot be ignored, that is, the corrosion potential is too positive of 304 SS in the solution with the presence of Fe3+.
3.3. Analysis of Thermodynamic Conditions
It is widely accepted that oxygen reduction and/or hydrogen reduction reactions occur at the cathode during the pitting corrosion of SS [7,8,9]. The equilibrium electrode potentials of the two reactions are calculated according to the Nernst equation (Equations (11)–(13)).
where Ee is the equilibrium electrode potential, Eθ is the standard electrode potential, R is the constant of molar gas, T is the thermodynamic temperature (298 K), n is the number of electrons participating in the reaction, F is the Faraday constant, aA and aB are the concentration of oxidized and reduced substances, and a and b are the stoichiometric coefficient of substances A and B, respectively. and are the equilibrium electrode potential of oxygen reduction and hydrogen reduction, respectively. According to the pH value of the solution shown in Figure 6 and Equations (12) and (13), the equilibrium electrode potential of oxygen and hydrogen reduction is shown in Table 3.
Table 3.
Equilibrium electrode potential of cathodic reduction and self-corrosion potential of 304 stainless steel in 0.1 mol/L iron ion solution with different proportion of Fe2+/Fe3+.
Figure 5 and Table 3 show the corrosion potential of 304 SS in solutions with different proportions of Fe2+/Fe3+. It is clear that the self-corrosion potential of 304 SS is more positive than the equilibrium electrode potential of hydrogen reduction in all testing solutions, which means that there is no possibility of hydrogen reduction for 304 SS in 0.1 mol/L iron ion solutions.
Hydrogen or/and oxygen reduction reactions occur during the iron or steel anodic dissolution process in the light of the different of pH values and dissolved oxygen concentrations. The pH conditions for hydrogen reduction may be different, but in any case, the thermodynamic conditions of hydrogen evolution can be reached with the decrease of pH value [8,26,27]. However, in the solution containing Fe3+, the corrosion potential of 304 SS is too positive to meet the thermodynamic conditions of the hydrogen reaction.
3.4. Cathodic Reaction
The results of the thermodynamic analysis show that no hydrogen reaction occurs for 304 SS in 0.1 mol/L iron ion solutions. The decrease in pH value is not the main reason for the positive shift of corrosion potential and the increase of corrosion rate for 304 SS in the 0.1 mol/L iron ion solution with different proportions of Fe2+/Fe3+. Considering the positive shift of the corrosion potential with the increase of Fe3+ content, we hold that the presence of Fe3+ might change the cathodic reaction of pit corrosion for SS. In the corrosive environment containing Fe3+, the reduction reaction of Fe3+ (Equation (14)) might occur on the electrode surface:
The equilibrium electrode potentials of the reduction reaction of Fe3+ () were calculated according to the Nernst equation (Equations (11) and (15)) (assuming that the concentration of Fe3+ in the 0.1 mol/L FeCl2 solution and the concentration of Fe2+ in the 0.1 mol/L FeCl3 solution is 10−6 mol/L). The calculation results are shown in Table 3.
The results show that the corrosion potential of 304 SS in the solution containing Fe3+ satisfied the thermodynamic conditions of Fe3+ reduction. It was possible for the reduction reaction of Fe3+ on the surface of 304 SS. Although the proportion of Fe3+ reduction in all cathodic reactions was unknown, the reduction of Fe3+ might be an important reason for accelerating corrosion of SS. As shown in Figure 7, obviously, of the five solutions used in this test, the self-corrosion potential of 304 SS is higher than the thermodynamic results based on the hydrogen evolution reaction and more negatively than that of the oxygen evolution reaction and Fe(III) reduction reaction. The test solution used in the experiment was subjected to argon deoxidation treatment. Therefore, it is reasonable to think that the reduction reaction of Fe3+ in the solution on the electrode surface will lead to the positive shift of self-corrosion potential and the increase of corrosion rate of SS.
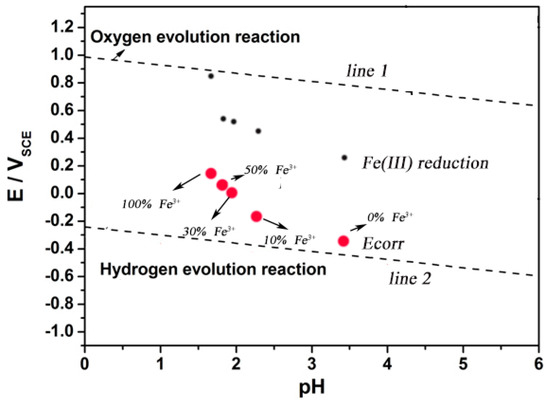
Figure 7.
An experimental E-pH diagram of 304 stainless steel at pH varying from 0 to 6.
3.5. Effect of Fe3+ Around the Pit on the Pitting Corrosion of 304 SS
When a corrosion pit appears on the surface of SS, the corrosion products migrate to the outside of the pit, as shown in Figure 2. Under the action of oxidizing substances, such as dissolved oxygen, Fe2+ in corrosion products outside the pits can be converted into Fe3+, which leads to the appearance of blue spots in the potassium ferrocyanide solution, as shown in Figure 3. This phenomenon confirms that there are Fe3+ ions around the corrosion pit, which is of great significance to understand the pitting mechanism of SS. On the one hand, the hydrolysis of Fe3+ results in the decrease of the pH of the solution around the pits. As shown in Figure 6, the pH value of the 0.1 mol/L FeCl3 solution is 1.64 and the value of the 0.1 mol/L FeCl2 solution is only 3.37. Although as for the hydrolysis of corrosion products for SS, the hydrolysis of Cr3+ and Ni2+ plays a dominant role, but the presence of Fe3+ makes the corrosive environment more acidic. As the pH of the solution decreased, the corrosion of the SS accelerated and the passive film was more vulnerable to damage [8,26,28]. On the other hand, the presence of Fe3+ might change the cathodic reaction of pit corrosion for SS. As shown in Figure 5 and Figure 7, due to the existence of Fe3+, the corrosion potential of 304 SS is shifted positively, which makes the hydrogen evolution in low pH environments become difficult. This includes the 0.1 mol/L FeCl3 solution, where the corrosion potential of 304 SS is 0.123 V (SCE), which is much higher than the thermodynamic results based on hydrogen reduction. At this time, Fe3+ reduction may be the main cathodic reaction on the surface of SS.
It has been reported that when SS pitting occurs, the anode reaction is mainly carried out in the etched hole, while the cathode reaction is mainly carried out outside the etched hole [28,29,30]. That is to say, the cathode reaction outside the hole has an important influence on the growth of the pits. Due to the existence of a diffusion barrier, the corrosion products inside the etched pit are difficult to diffuse outwards, and the oxidizing substances outside the pit are also difficult to diffuse into the pit, and there may be no Fe3+ ions in the hole. However, dissolved oxygen can migrate from the bulk solution to the sample surface without restriction, Fe2+ ions can be oxidized to Fe3+ ions outside the pit, and Figure 3 proves that there are Fe3+ ions around the corrosion pit.
In summary, the presence of Fe3+ around the pits has an important influence on the pitting corrosion behavior of SS. If there is no Fe3+ around the pits, the growth mechanism of pitting corrosion can be explained by Figure 8a. The corrosion products of SS migrate to the outside of the pits and the hydrolysis of the corrosion products around the pits results in a decrease of pH for the solution around them. At the same time, the hydrogen or oxygen reduction reaction occurs around the pits, which promotes the growth of the corrosion pit. However, in this work, the experimental results show that there are Fe3+ around the pits. If Fe3+ was derived from the oxidation of Fe2+ under the action of oxidizing substances, the growth mechanism of pitting corrosion of 304 SS could be shown in Figure 8b. Some Fe2+ ions migrating from the pits will be directly hydrolyzed around the pits while others are converted into Fe3+ by the action of the oxidizing substance. On the one hand, the pH value of solution was lower at the same concentration of iron ions due to the strong hydrolysis ability of Fe3+. On the other hand, Fe3+ can undergo the reduction reaction to consume electrons and promote pit growth.
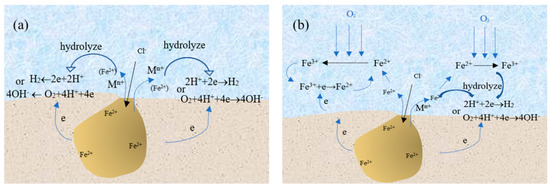
Figure 8.
Pitting corrosion model for stainless steel in the environment without (a) and with (b) transformation from Fe2+ to Fe3+.
4. Conclusions
1. Potassium ferricyanide and potassium ferrocyanide were used to observe and monitor the pitting corrosion of 304 stainless steel (SS) at anodic polarization in situ. The experiment verified the presence of Fe3+ around the pits of 304 stainless steel in 3.5% NaCl solution.
2. The Fe3+ around the pits could significantly reduce the pH value of the surrounding solution. Meanwhile, Fe3+ might be involved in the cathodic process of the corrosion for 304 SS. The reduction of Fe3+ leads to the positive shift of the corrosion potential of the material, which may lead to the difficulty of the hydrogen evolution reaction. The decrease of solution pH and the reduction of Fe3+ resulted in the rupture of passive film of 304 SS and the acceleration of the corrosion rate.
3. During the pitting process of stainless steel, especially in the metastable pitting stage, in addition to oxygen and hydrogen reduction, there is also Fe(III) reduction reaction outside the pits. Considering the pathway of Fe(III) production, we made bold assumptions: Fe2+ generated by metal dissolution forms Fe3+ under the action of dissolved oxygen, and then be reduced to Fe2+ on the electrode surface. In this process, dissolved oxygen does not directly participate in the cathode reaction, but indirectly participates in the cathode reaction by oxidizing Fe2+ to Fe3+. If this hypothesis is confirmed, it will have a significant impact on the study of the pitting corrosion mechanism.
Author Contributions
Conceptualization, H.Z., N.D. and S.W.; Data curation, H.Z. and W.Z.; Investigation, H.Z. and W.Z.; Writing—original draft, H.Z. and W.Z.; Writing—review & editing, N.D., Q.Z. and S.W. All authors have read and agreed to the published version of the manuscript.
Funding
This research was funded by the National Natural Science Foundation of China, grant number 51561024.
Conflicts of Interest
The authors declare no conflict of interest.
References
- Burstein, G.T.; Liu, C.; Souto, R.M.; Vines, S.P. Origins of pitting corrosion. Corros. Eng. Sci. Technol. 2004, 39, 25–30. [Google Scholar] [CrossRef]
- Burstein, G.T.; Liu, C. Nucleation of corrosion pits in Ringer’s solution containing bovine serum. Corros. Sci. 2007, 49, 4296–4306. [Google Scholar] [CrossRef]
- Tian, W.M.; Du, N.; Li, S.M.; Chen, S.B.; Wu, Q.Y. Metastable pitting corrosion of 304 stainless steel in 3.5% NaCl solution. Corros. Sci. 2014, 85, 372–379. [Google Scholar] [CrossRef]
- Talebian, M.; Raeissi, K.; Atapour, M.; Fernández-Pérez, B.M.; Betancor-Abreu, A.; Llorente, I.; Fajardo, S.; Salarvand, Z.; Meghdadi, S.; Amirnasr, M.; et al. Pitting corrosion inhibition of 304 stainless steel in NaCl solution by three newly synthesized carboxylic Schiff bases. Corros. Sci. 2019, 160, 108130. [Google Scholar] [CrossRef]
- Burstein, G.T.; Pistorius, P.C.; Mattin, S.P. The nucleation and growth of corrosion pits on stainless steel. Corros. Sci. 1993, 35, 57–62. [Google Scholar] [CrossRef]
- Pistorius, P.C.; Burstein, G.T. Metastable pitting corrosion of stainless steel and the transition to stability. Philos. Trans. R. Soc. A 1992, 341, 531–559. [Google Scholar]
- Wu, K.; Byeon, J.W. Morphological estimation of pitting corrosion on vertically positioned 304 stainless steel using acoustic-emission duration parameter. Corros. Sci. 2019, 148, 331–337. [Google Scholar] [CrossRef]
- Hu, Y.B.; Dong, C.F.; Sun, M.; Xiao, K.; Zhong, P.; Li, X.G. Effects of solution pH and Cl− on electrochemical behaviour of an Aermet100 ultra–high strength steel in acidic environments. Corros. Sci. 2011, 53, 4159–4165. [Google Scholar] [CrossRef]
- Stratmann, M.; Müller, J. The mechanism of the oxygen reduction on rust-covered metal substrates. Corros. Sci. 1994, 36, 327–359. [Google Scholar] [CrossRef]
- Tian, W.M.; Ai, Y.J.; Li, S.M.; Du, N.; Ye, C. Pitting Kinetics of 304 Stainless Steel Using ESPI Detection Technique. Acta Metall. Sin. 2015, 28, 430–437. [Google Scholar] [CrossRef]
- Wang, M.F.; Li, X.G.; Du, N.; Huang, Y.Z.; Korsunsky, A. Direct evidence of initial pitting corrosion. Electrochem. Commun. 2008, 10, 1000–1004. [Google Scholar] [CrossRef]
- Liu, X.J.; Spikes, H.; Wong, J.S.S. In situ pH responsive fluorescent probing of localized iron corrosion. Corros. Sci. 2014, 87, 118–126. [Google Scholar] [CrossRef]
- Wranglen, G. Pitting and sulphide inclusions in steel. Corros. Sci. 1974, 14, 331–349. [Google Scholar] [CrossRef]
- Luong, B.T.; Nishikata, A.; Tsuru, T. Scanning electrochemical microscope study on pitting corrosion of iron. Electrochemistry 2003, 71, 555–557. [Google Scholar] [CrossRef]
- Nazarnezhad-Bajestani, M.; Neshati, J.; Siadati, M.H. Determination of SS321 pitting stage in FeCl3 solution based on electrochemical noise measurement data using artificial neural network. J. Electroanal. Chem. 2019, 845, 31–38. [Google Scholar] [CrossRef]
- Orlikowski, J.; Jazdzewska, A.; Mazur, R.; Darowicki, K. Determination of pitting corrosion stage of stainless steel by galvanodynamic impedance spectroscopy. Electrochim. Acta 2017, 253, 403–412. [Google Scholar] [CrossRef]
- Sarin, P.; Snoeyink, V.L.; Lytle, D.A.; Kriven, W.M. Iron Corrosion Scales: Model for Scale Growth, Iron Release, and Colored Water Formation. J. Environ. Eng. 2004, 130, 364–373. [Google Scholar] [CrossRef]
- Gui, Y.; Zheng, Z.J.; Gao, Y. The bi-layer structure and the higher compactness of a passive film on nanocrystalline 304 stainless steel. Thin Solid Films 2016, 599, 64–71. [Google Scholar] [CrossRef]
- Yao, J.; Macdonald, D.D.; Dong, C. Passive film on 2205 duplex stainless steel studied by photo-electrochemistry and ARXPS methods. Corros. Sci. 2019, 146, 221–232. [Google Scholar] [CrossRef]
- Dong, C.; Zhang, Y.; Guo, L.; Li, Q. Spectrophotometric determination of methimazole in pharmaceutical, serum and urine samples by reaction with potassium ferricyanide-Fe(III). J. Anal. Chem. 2010, 65, 707–712. [Google Scholar] [CrossRef]
- Guo, L.; Zhang, Y.; Li, Q. Spectrophotometric determination of perphenazine with the detection system of potassium ferricyanide-Fe(III) in pharmaceutical and serum samples. Spectrochim. Acta Part A 2009, 74, 307–311. [Google Scholar] [CrossRef] [PubMed]
- Ritter, S.K. Prussian Blue Still a Hot Topic. Chem. Eng. News 2005, 83, 32–35. [Google Scholar] [CrossRef]
- Iwatsuki, H.; Meguro, R.; Asano, Y.; Shoumura, K. Changes in non-heme iron histochemistry in the ischemic brains of cats and Mongolian gerbils. Int. Congr. Ser. 2003, 1251, 87–94. [Google Scholar] [CrossRef]
- Tian, W.M.; Li, S.M.; Du, N.; Chen, S.B.; Wu, Q.Y. Effects of applied potential on stable pitting of 304 stainless steel. Corros. Sci. 2015, 93, 242–255. [Google Scholar] [CrossRef]
- Cui, Z.; Chen, S.; Dou, Y.; Han, S.; Wang, L.; Man, C.; Wang, X.; Chen, S.; Cheng, Y.F.; Li, X. Passivation behavior and surface chemistry of 2507 super duplex stainless steel in artificial seawater: Influence of dissolved oxygen and pH. Corros. Sci. 2019, 150, 218–234. [Google Scholar] [CrossRef]
- Dastgerdi, A.A.; Brenna, A.; Ormellese, M.; Pedeferri, M.; Bolzoni, F. Experimental design to study the influence of temperature, pH, and chloride concentration on the pitting and crevice corrosion of UNS S30403 stainless steel. Corros. Sci. 2019, 159, 108160. [Google Scholar] [CrossRef]
- Fattah-alhosseini, A.; Vafaeian, S. Effect of solution pH on the electrochemical behaviour of AISI 304 austenitic and AISI 430 ferritic stainless steels in concentrated acidic media. Egypt. J. Pet. 2015, 24, 333–341. [Google Scholar] [CrossRef]
- Shojaei, E.; Mirjalili, M.; Moayed, M.H. The influence of the crevice induced IR drop on polarization measurement of localized corrosion behavior of 316L stainless steel. Corros. Sci. 2019, 156, 96–105. [Google Scholar] [CrossRef]
- Oldfield, J.W.; Sutton, W.H. Crevice Corrosion of Stainless Steels: I. A Mathematical Model. Br. Corros. J. 1978, 13, 13–22. [Google Scholar] [CrossRef]
- Zhang, P.Q.; Wu, J.X.; Zhang, W.Q.; Lu, X.Y.; Wang, K. A pitting mechanism for passive 304 stainless steel in sulphuric acid media containing chloride ions. Corros. Sci. 1993, 34, 1343–1354. [Google Scholar] [CrossRef]


© 2020 by the authors. Licensee MDPI, Basel, Switzerland. This article is an open access article distributed under the terms and conditions of the Creative Commons Attribution (CC BY) license (http://creativecommons.org/licenses/by/4.0/).