1. Introduction—State of the Art
Magnesium alloys are the lightest metals used for construction purposes. Due to their low specific weight and high strength, their range of industrial applications is constantly increasing. The favorable properties also include recyclability, damping capacity, and good casting properties [
1,
2]. These qualities are particularly desirable in aerospace and automotive industries, which are constantly striving for ever lighter structures. Magnesium alloys, which belong to the group of light metals, are therefore suitable for whenever weight reduction is crucial. The increasing share of this group of materials in various industries increases the need for continuous development and improvement of machining processes. The requirements for manufactured elements are constantly increasing, so it is reasonable to strive to improve the quality of manufactured elements [
3,
4,
5].
The roughness of the surface is the most commonly employed indicator of surface quality. However, to date, the scientific investigations have limited the evaluation of the post-machining condition of the surface to the analysis of its 2D surface roughness parameters. In addition, of the roughness parameters the most widely considered are Ra (an arithmetic mean profile deviation) and Rz (a cusp height of the profile). For accuracy, a wider range of 2D surface and 3D area roughness parameters should be included in the description. In machine construction, surfaces are expected to perform predictably, i.e., to exhibit a certain set of features or utilitarian properties (fatigue strength, tribological, or adhesive properties). Their prediction is important in the context of sliding friction phenomena, and thus of abrasive wear. Currently, the geometrical state of the surface is regarded as equally important as the dimensional and shape accuracy. However, due to certain problems with providing a clear definition of the relationships between the technological and utilitarian qualities of surfaces, it is difficult to directly infer on the operational and functional properties of surfaces from the 2D surface and 3D area roughness parameters of machined surfaces [
6].
The benefits of machining with PCD-tipped tools have been confirmed, e.g., by Kuczmaszewski et al. [
7]. In the study, three types of tools were used on AZ31 and AZ91HP magnesium alloy substrates: a TiAlN-coated carbide milling cutter, a PCD-tipped milling cutter, and a Kordell milling cutter. It was found that the surface roughness parameters did not show a marked drop after machining at increased cutting speeds (at v
c = 400–1200 m/min) and the best performing tool was the PCD-tipped tool–Ra = 0.2–0.4 μm and Rz = 1.5–2.8 μm; subsequently, for the Kordell carbide tool the values were Ra = 1.2–2.8 μm and Rz = 6.0–12.0 μm, and for the TiAlN-coated tool–Ra = 3.0–5.4 μm and Rz = 12.0–26.0 μm. Similarly, when the feed per tooth was adjusted (f
z = 0.05–0.30 mm/tooth), the lowest roughness, Ra = 0.2–0.5 μm and Rz = 1.5–3.0 μm, was observed in the case of the PCD tool, next the Kordell tool, Ra = 0.5–3.6 μm and Rz = 2.0–17.0 μm, and the TiAlN-coated cutter: Ra = 1.0–7.6 μm and Rz = 5.0–36.0 μm.
Guo and Salahshoor [
8,
9] analyzed the machinability of Mg-Ca biodegradable magnesium alloys during dry milling with a PCD-tipped face milling head carried out in the v
c range up to 2800 m/min. By modifying the cutting speed, the best surface roughness (Ra) obtained amounted to approximately 0.4 μm. A similar relationship was observed in the case of the depth of cut (a
p) adjustment. However, it was the feed per tooth that was shown to most affect the surface quality: the Ra parameter changed from 0.2 μm at feed f
z = 0.05 mm/tooth to 0.78 μm at feed f
z = 0.4 mm/tooth. For comparison, when applying finish burnishing at F = 400–800 N, the value of Ra was in the region of 0.6 μm.
Analogous relationships were discovered by Desai et al., who described the machining of the Mg-Ca1.0 alloy with a multi-edge milling cutter with the diamond-like carbon coating (DLC) [
10]. The roughness of the surface was assessed with the Ra parameter, which was shown to decrease to the range of 0.079–0.159 μm, depending on the specific cutting data: the cutting speed range v
c = 300–600 m/min, the feed per tooth f
z = 0.0125–0.125 mm/tooth and the axial depth of cut a
p = 0.05–0.50 mm. The surface roughness was observed to decline at higher cutting speeds and increase at higher feeds; nevertheless, the average roughness remained very low.
Biodegradable Mg alloys have also been subjected to testing by Qiao et al. [
11]. The MgCa0.8 alloy surfaces were machined with a milling cutter head with uncoated carbide inserts. The machining process was carried out as milling and inverse milling with variable parameters: the cutting speed v
c = 500–950 m/min, the feed per tooth f
z = 0.05–0.29 mm/tooth, the axial depth of cut a
p = 3–7.5 mm and the radial depth of cut a
e = 6–15 mm. Irrespective of the change in the cutting data, lower values of the roughness parameter Ra, 0.089–0.781 μm, were obtained in inverse milling, otherwise the Ra was in the range 0.93–1.395 μm. The change in the feed per tooth was the factor displaying the most significant impact on the surface finish.
Studies have shown that tool coating should also be considered in the selection of the best machining conditions. This factor was assessed by Muralidharan et al. [
12], who attempted to determine the effect of tool coating (carbide tools without coating, with TiN and TiAlN coatings were investigated) on the surface roughness of the Mg-SiC/B
4C composite material. In the tested cutting conditions, the cutting speed range v
c = 18–30 m/min and the feed rate v
f = 1200–2000 mm/min, the lowest roughness was obtained when cutting with the TiN tool: Ra = 0.36–0.53 μm. In addition, the increased wear of all tested tools was strongly correlated with the increase in the operational parameters.
In a different study [
13], the TiAlN-coated carbide milling cutter was selected to execute the machining of the AZ91D alloy, whose surface was subsequently assessed using the 2D surface and 3D area roughness parameters. The experimental machining involved the change in the cutting parameters in the following ranges: the cutting speed v
c = 400–1200 m/min, the feed per tooth f
z = 0.05–0.30 mm/tooth, and the axial depth of cut a
p = 0.5–6.0 mm. Considering the tested parameters, it was shown that the feed per tooth has the highest impact on the quality of surface finish, whereas the increase in the cutting speed did not significantly affect the 2D parameters, but it had a more visible effect on the 3D area roughness parameters, whose values decreased. The implications emerging from the study suggest that, given the negligible negative effect of the axial depth of cut, machining efficiency may be improved without compromising the quality of the surface finish.
The condition of the surface following milling was also described in the work by Sivam et al. [
14]. The study focused specifically on the effects of variable cutting speed, feed per tooth, axial depth of cut, and cutting diameter on the state of the ZE41 alloy surface machined with a multi-edge milling cutter with carbide inserts. The results from the measurements demonstrated that the factors that had the greatest effect on the Ra parameter (1.44–4.11 μm) were the feed per tooth f
z = 0.6125–0.645 mm/tooth and the cutting speed v
c = 420–720 m/min. Furthermore, the roughness of the component’s surface was shown to increase at higher f
z and v
c. On the other hand, an improvement in the surface quality was observed when machining at the smallest axial depth of cut a
p = 1.5 mm and the smallest-diameter tool (Ø20 mm).
Another significant study [
15] examined the surface roughness changes in a range of machining parameters: the cutting speed v
c = 94–378 m/min, the feed per tooth f
z = 0.005–0.08 mm/tooth, and the axial depth of cut a
p = 0.5–1.5 mm. Throughout the tested cutting speed values, the Ra parameter of the AZ61 magnesium alloy machined with the milling cutter with carbide inserts was in the range of 0.115–0.403 µm. Low roughness was maintained regardless of the change in the depth of cut and the feed per tooth. The results from the tests indicate that high surface quality is attainable at high efficiency of milling.
The behavior of the AZ61 alloy surface machined with a multi-edge cutter with carbide inserts was also investigated by Chirita et al. [
16]. In addition to the operational parameters of milling, the study included two more variables: the feed direction and the cooling method. It was shown that the greatest influence on the surface roughness has the feed per tooth, which was modified in the range of f
z = 0.08–0.30 mm/tooth, and the direction of feed. The observed effect of changes in the cutting speed, in the range of v
c = 500–1000 m/min, and the axial depth of cut, a
p = 0.4–1.6 mm, were shown to only slightly affect the surface roughness of the workpiece. In addition, lower values of the parameter Sa = 0.142–0.795 μm were obtained for the direct feed than for the reverse feed—Sa = 0.205–0.686 μm. Finally, in comparison with dry milling, the application of MQL (minimum quantity lubrication) cooling limited the scatter of results.
The optimal combination of dry milling parameters during the machining of AM60 Mg alloy using a TiN-coated carbide tool was sought by Sathyamoorthy et al. [
17]. The set of modified parameters included the cutting speed v
c = 30–60 m/min, the feed per tooth f
z = 0.025–0.05 mm/tooth and the cutting depth, a
p = 0.5–1.5 mm. The tests showed that the condition of the surface deteriorated when the feed per tooth and the depth of cut were increased. That negative effect was offset by increasing the cutting speed: machining at the top rotational speed, feed per revolution f
n = 0.1 mm/r and the cutting depth a
p = 1 mm, led to obtaining the smallest roughness Ra, of approximately 0.3 µm.
Another Mg alloy, AZ91D, was put to HSM (high speed machining) tests by Ruslan et al. [
18]. The face milling cutter, was engaged at a small feed per tooth, 0.03–0.09 mm/tooth; and the axial depth of cut 0.2–0.3 mm, produced a surface characterized by an exceptionally low roughness—Ra = 0.061–0.133 μm. The most advantageous surface finish was obtained at the lowest cutting speed, 900 m/min. As a result, it was confirmed that by providing the high-quality surface finish, milling at high speeds eliminates the need for additional finishing operations, such as grinding or polishing.
The condition of the machined surface can also be affected by the tool rake angle, as shown by Gziut et al. [
19]. Two carbide end mills of a different cutting-edge geometry (γ = 5° and γ = 30°) were used for AZ91HP magnesium alloy milling. The technological parameters that changed during the tests were the cutting speed v
c = 400–1200 m/min, the feed per tooth f
z = 0.05–0.30 mm/tooth and the axial depth of cut a
p = 0.5–3 mm. The 2D roughness parameters, measured on the end face and the lateral face of the samples, showed that a better surface quality was obtained using the tool with a lower tool rake angle (γ = 5°). Additionally, an increase in the cutting speed v
c resulted in the decrease in the values of the measured parameters, while an increase in the feed per tooth f
z caused their increase. A change in the axial depth of cut a
p did not have a significant effect on the surface roughness parameters.
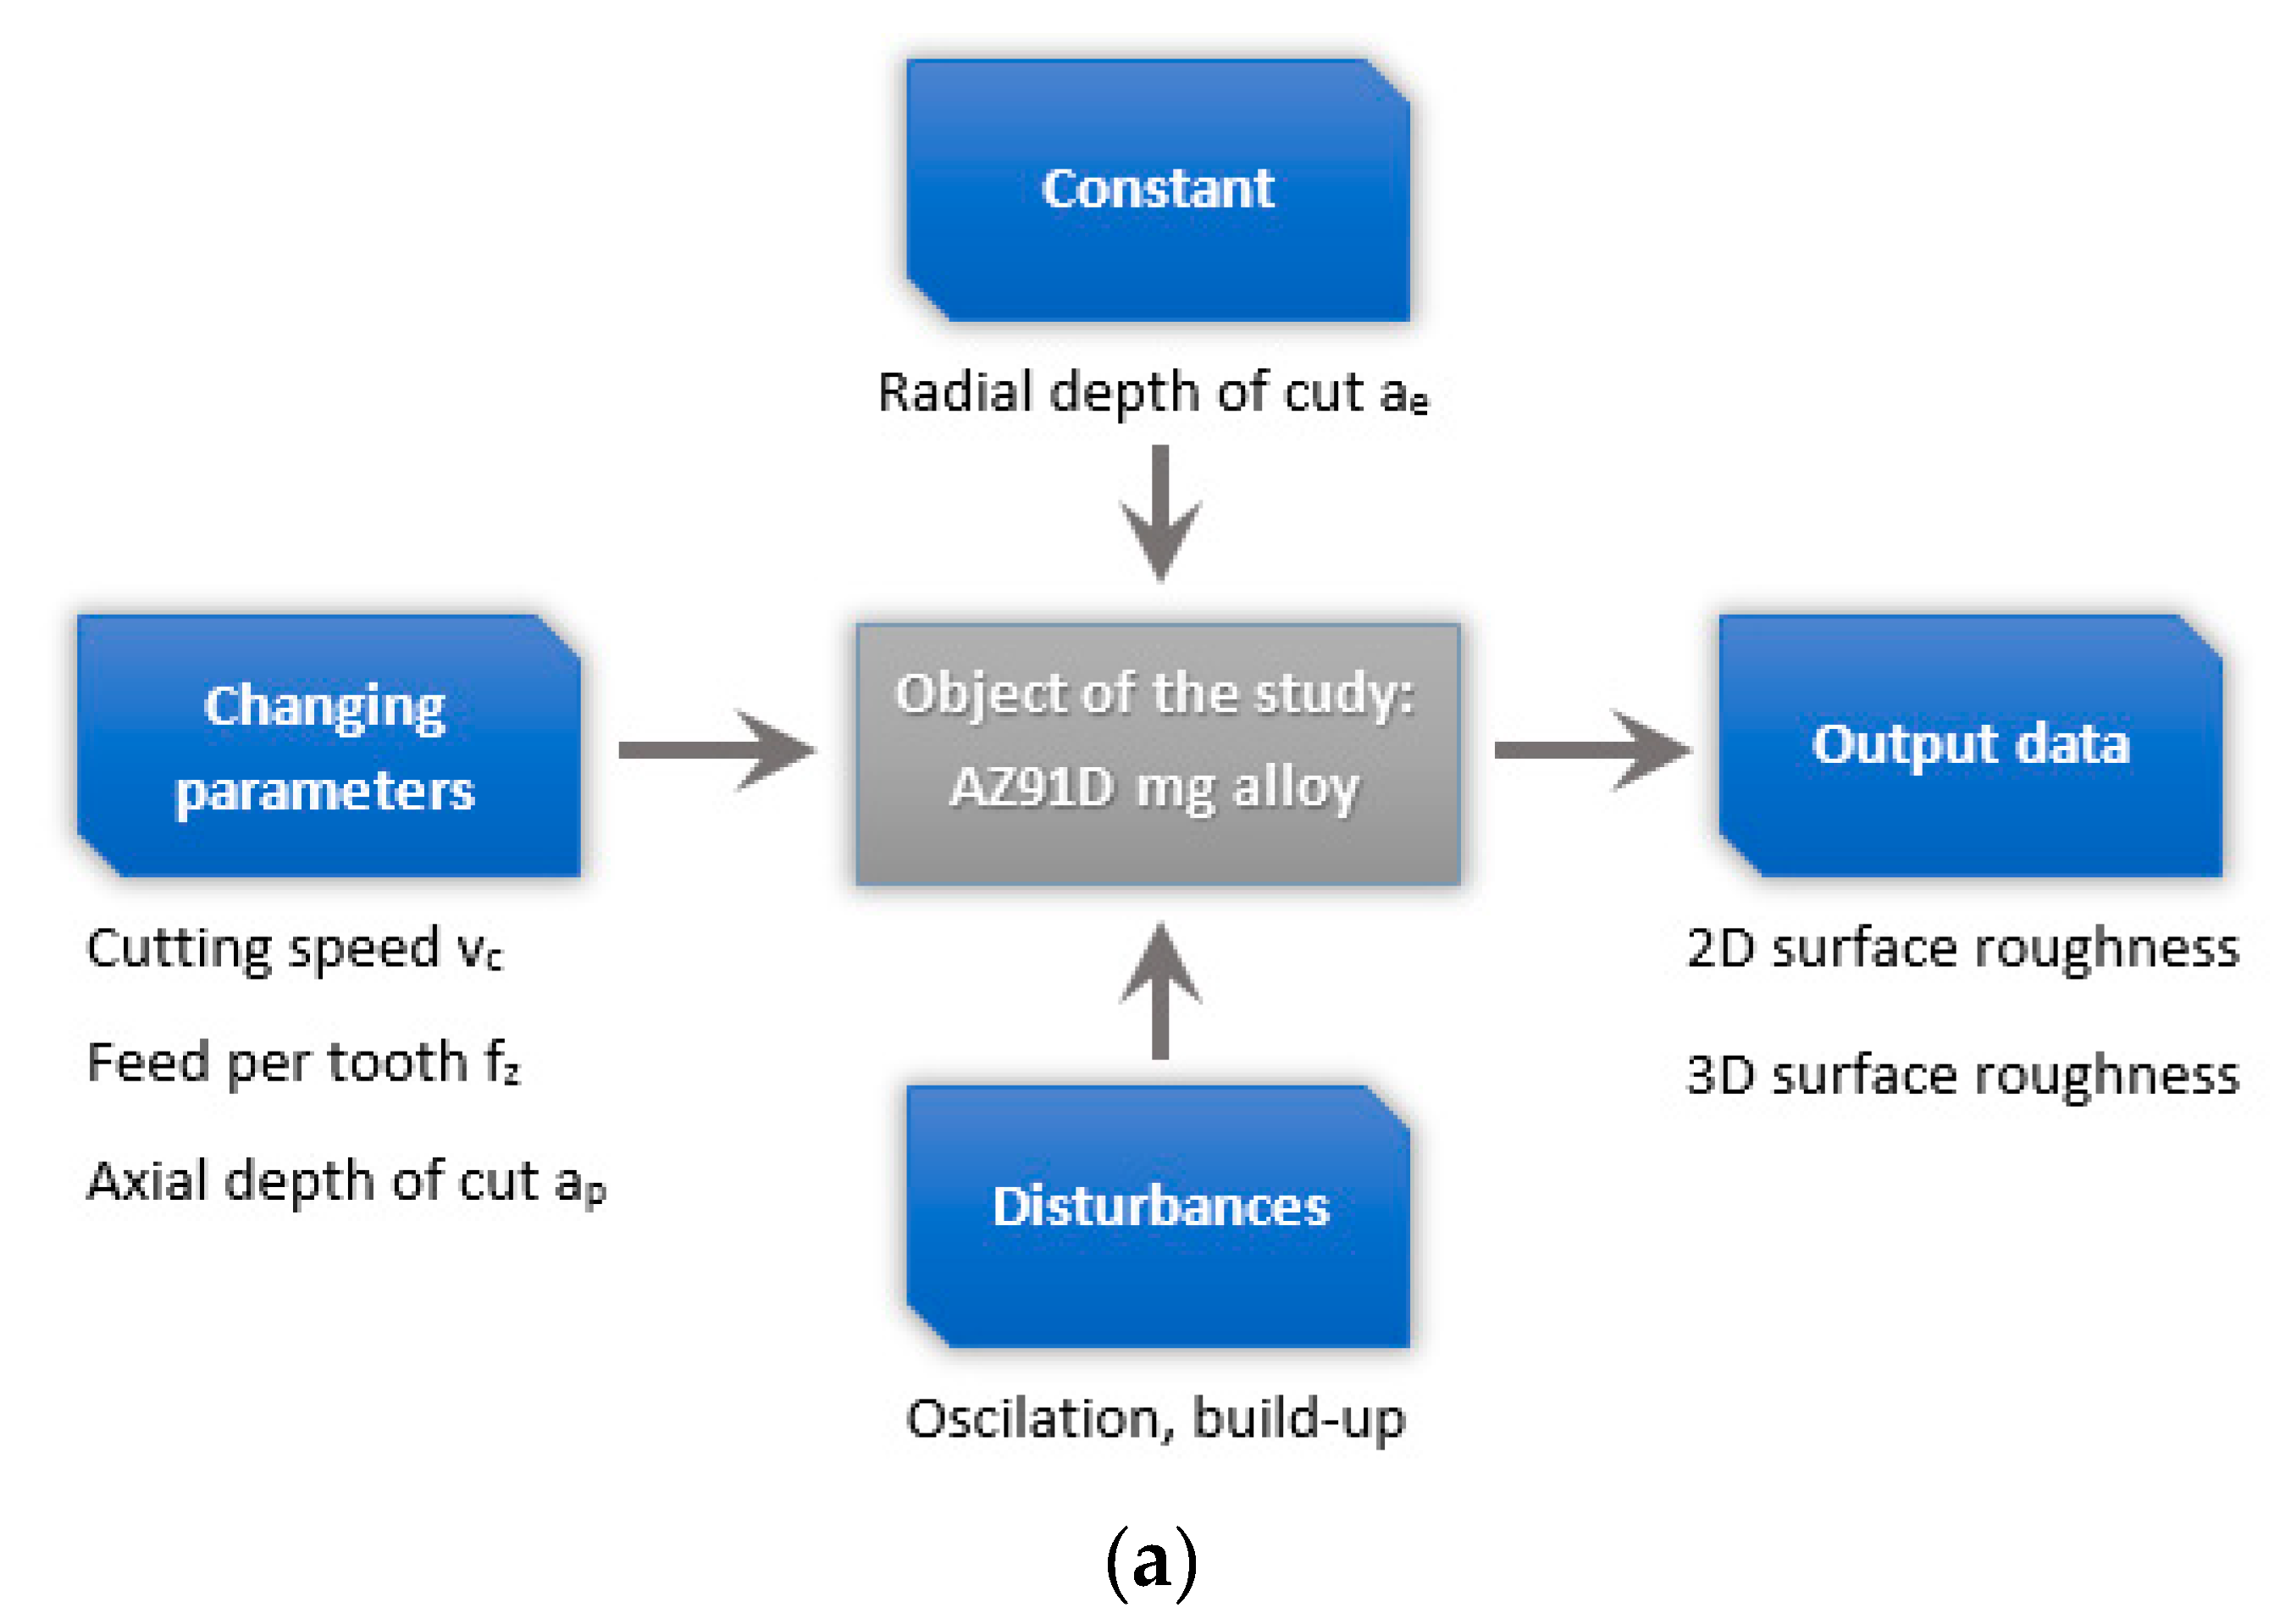
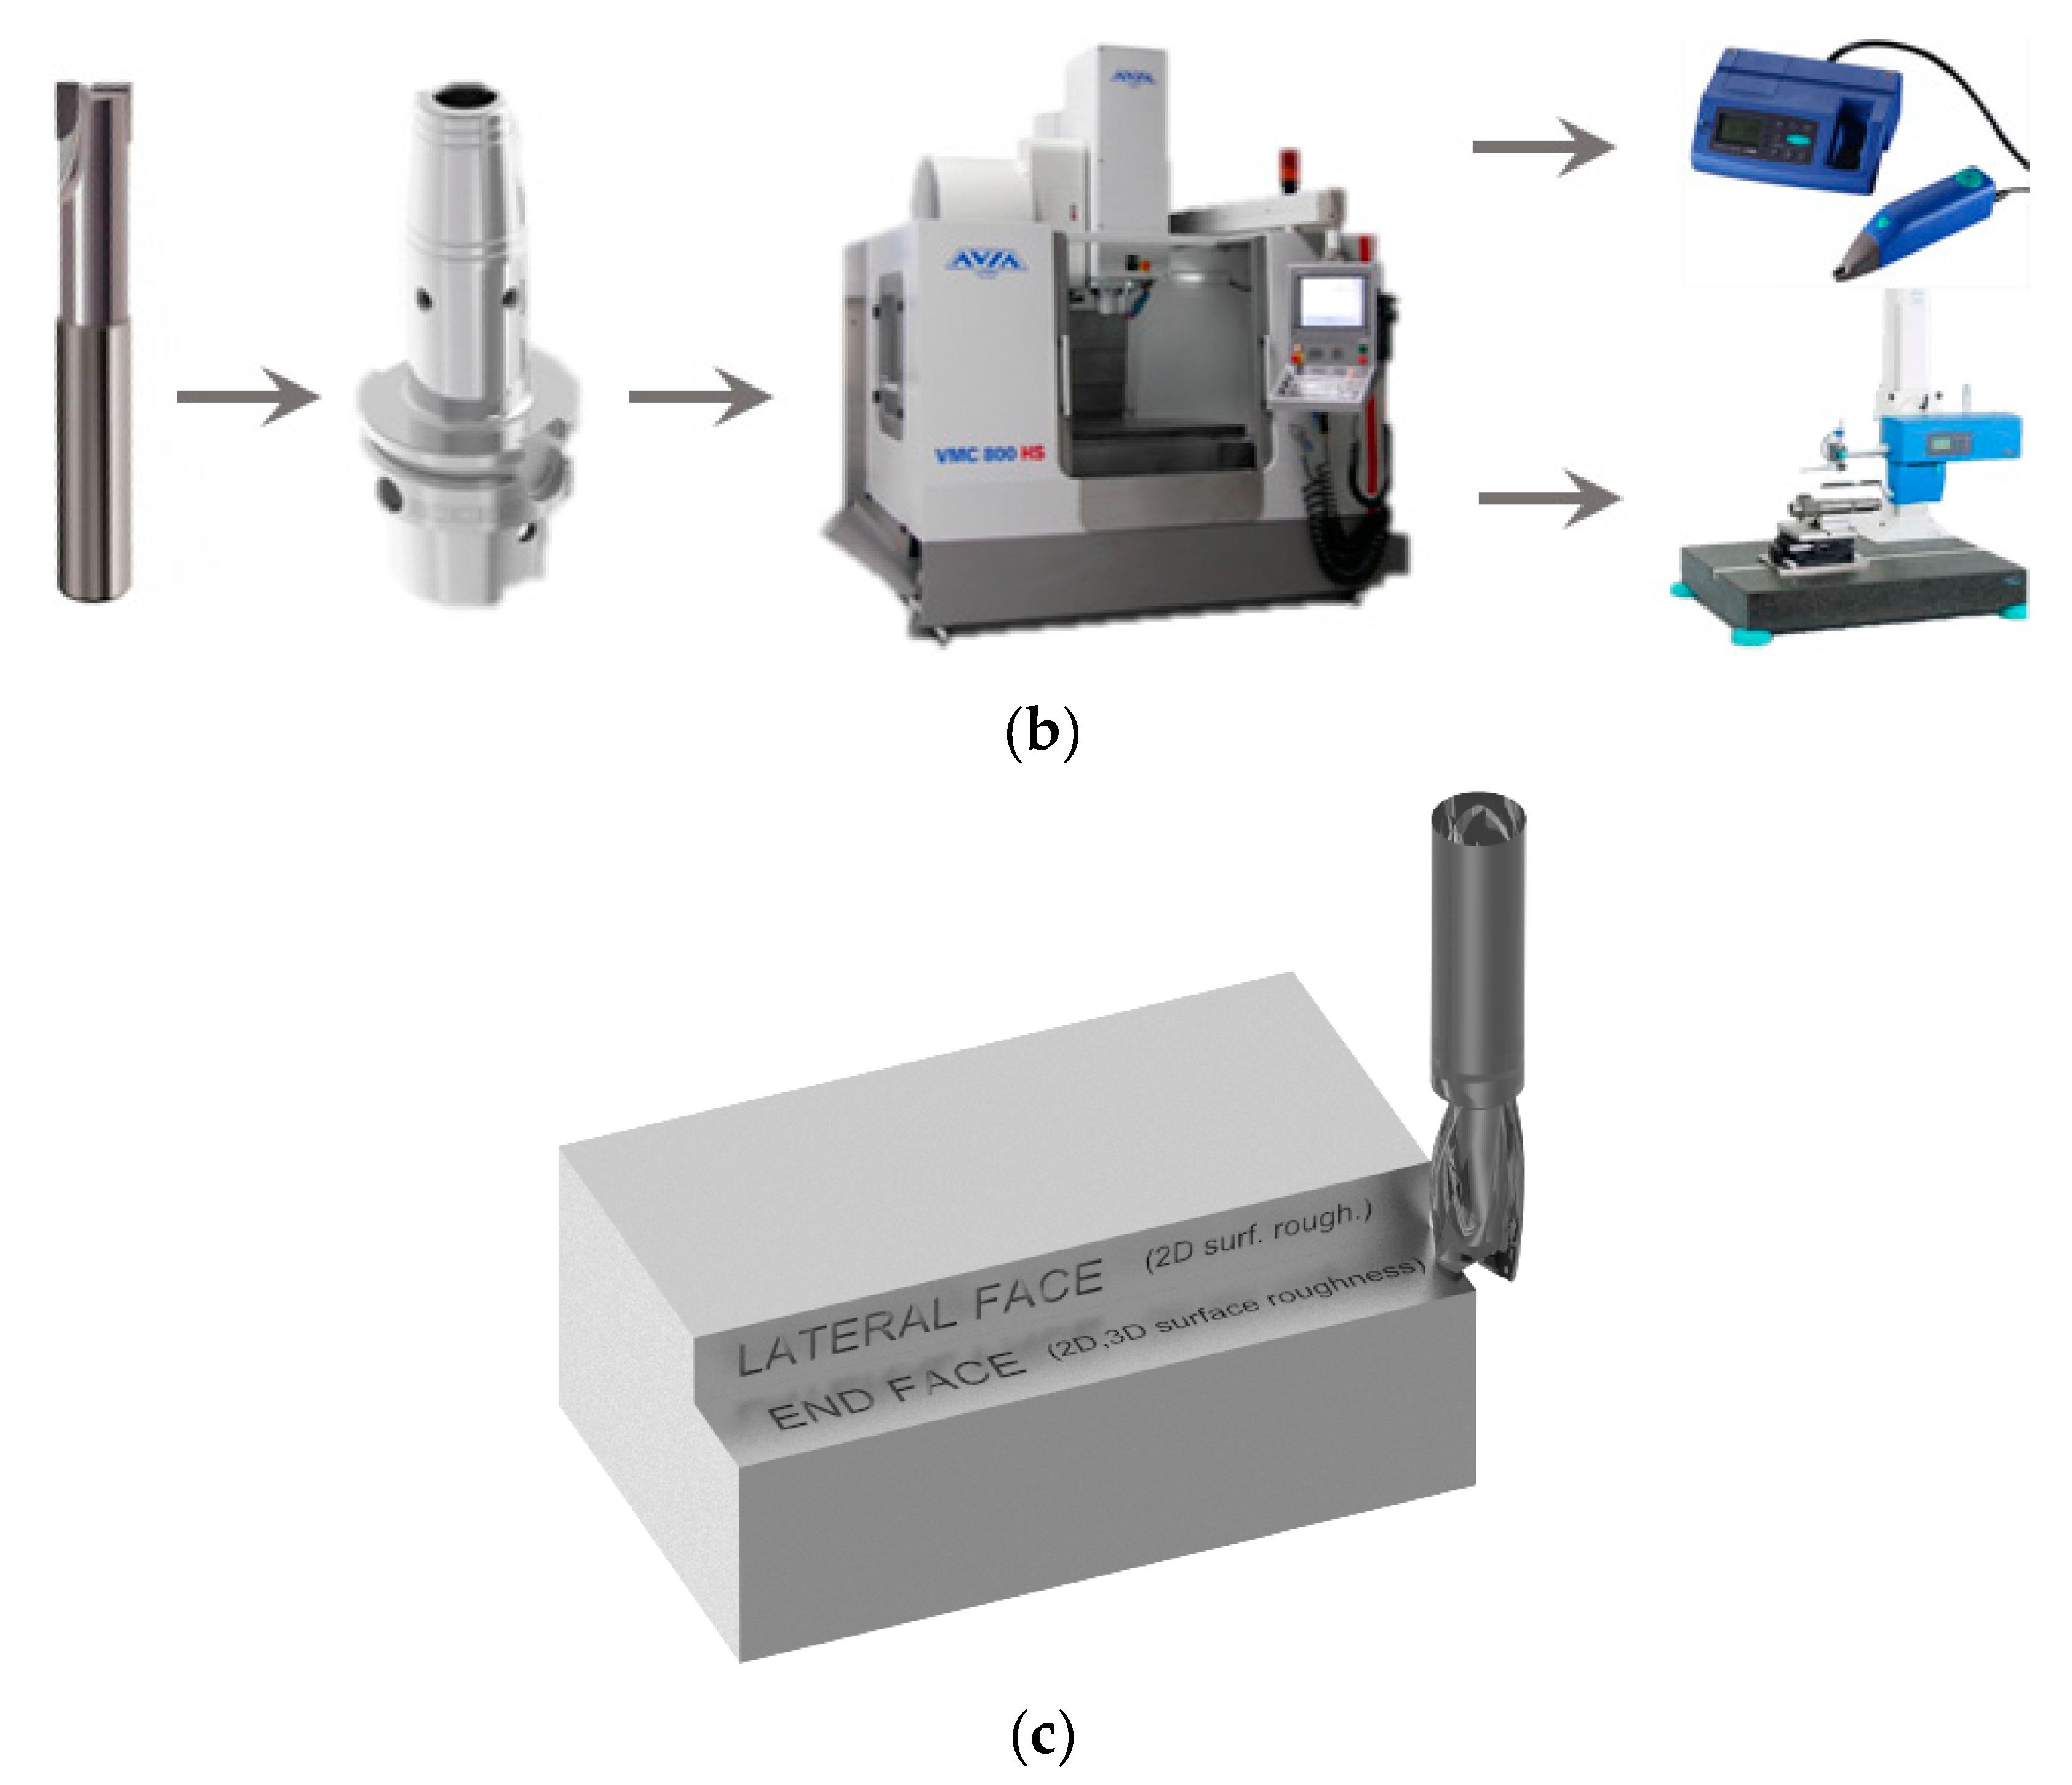
Previous studies have shown the importance of extending the scope of roughness parameters as, in aggregate, they provide a more profound insight into the state and utilitarian features of surfaces, such as their fatigue strength properties. Therefore, this work investigated the 2D roughness parameters (Ra, Rv, Rp, Rt, Rku, Rsk, RSm) and the 3D area roughness parameters (Sa, Sv, Sp, St, Sku, Ssk) to describe the effects of dry milling on the end face and the lateral face of AZ91D magnesium alloys. In addition, the Abbott–Firestone curves of the substrates were determined. The effects of vc, fz, and ap on selected surface geometry indicators was derived from the experimental and statistical tests. In the future, the method employed in this study could lay the foundation for a decision-making system for a potential application in industry. The novelty of this study consists in that the roughness parameters detailed here will allow the engineers and technologists to infer on the utilitarian and strength features of a surface under consideration. In addition, magnesium alloys are highly innovative materials used by cutting-edge industries, such the aerospace construction.
3. Results and Discussion
3.1. Surface Roughness 2D
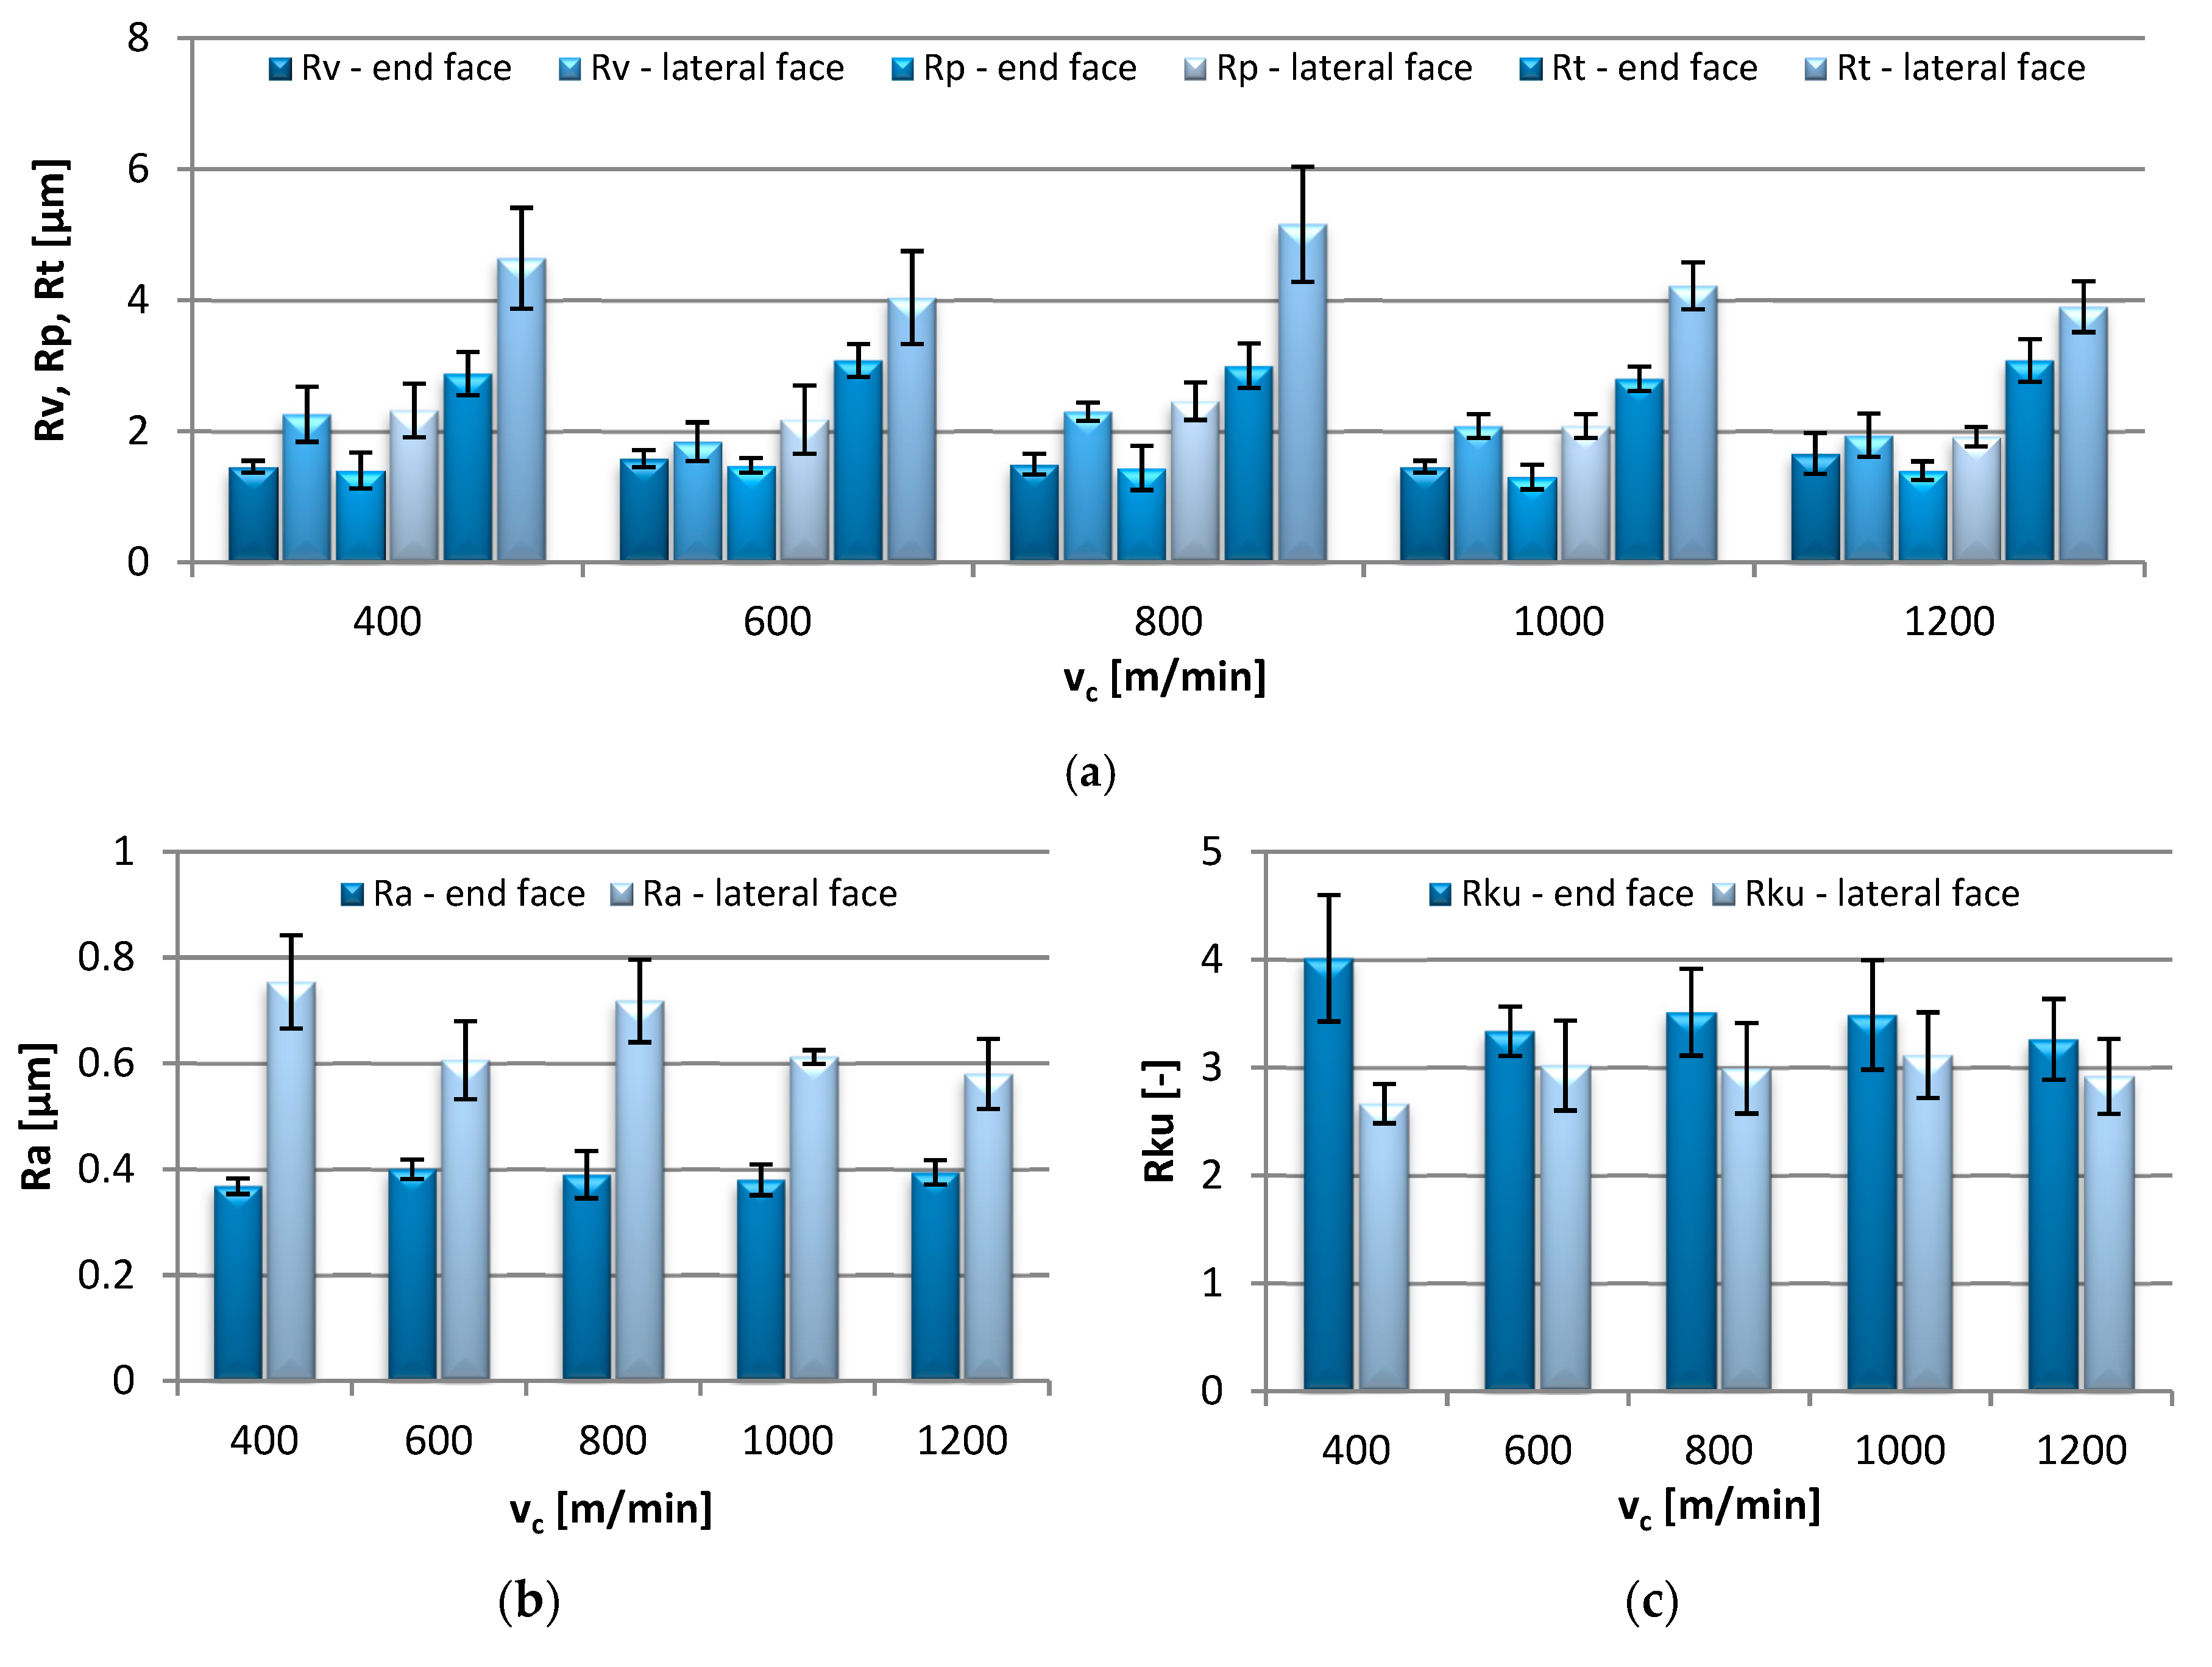
Figure 2 contains bar graphs presenting the influence of the cutting speed change, v
c = 400–1200 m/min, on the values of the end-face and lateral-face 2D roughness parameters.
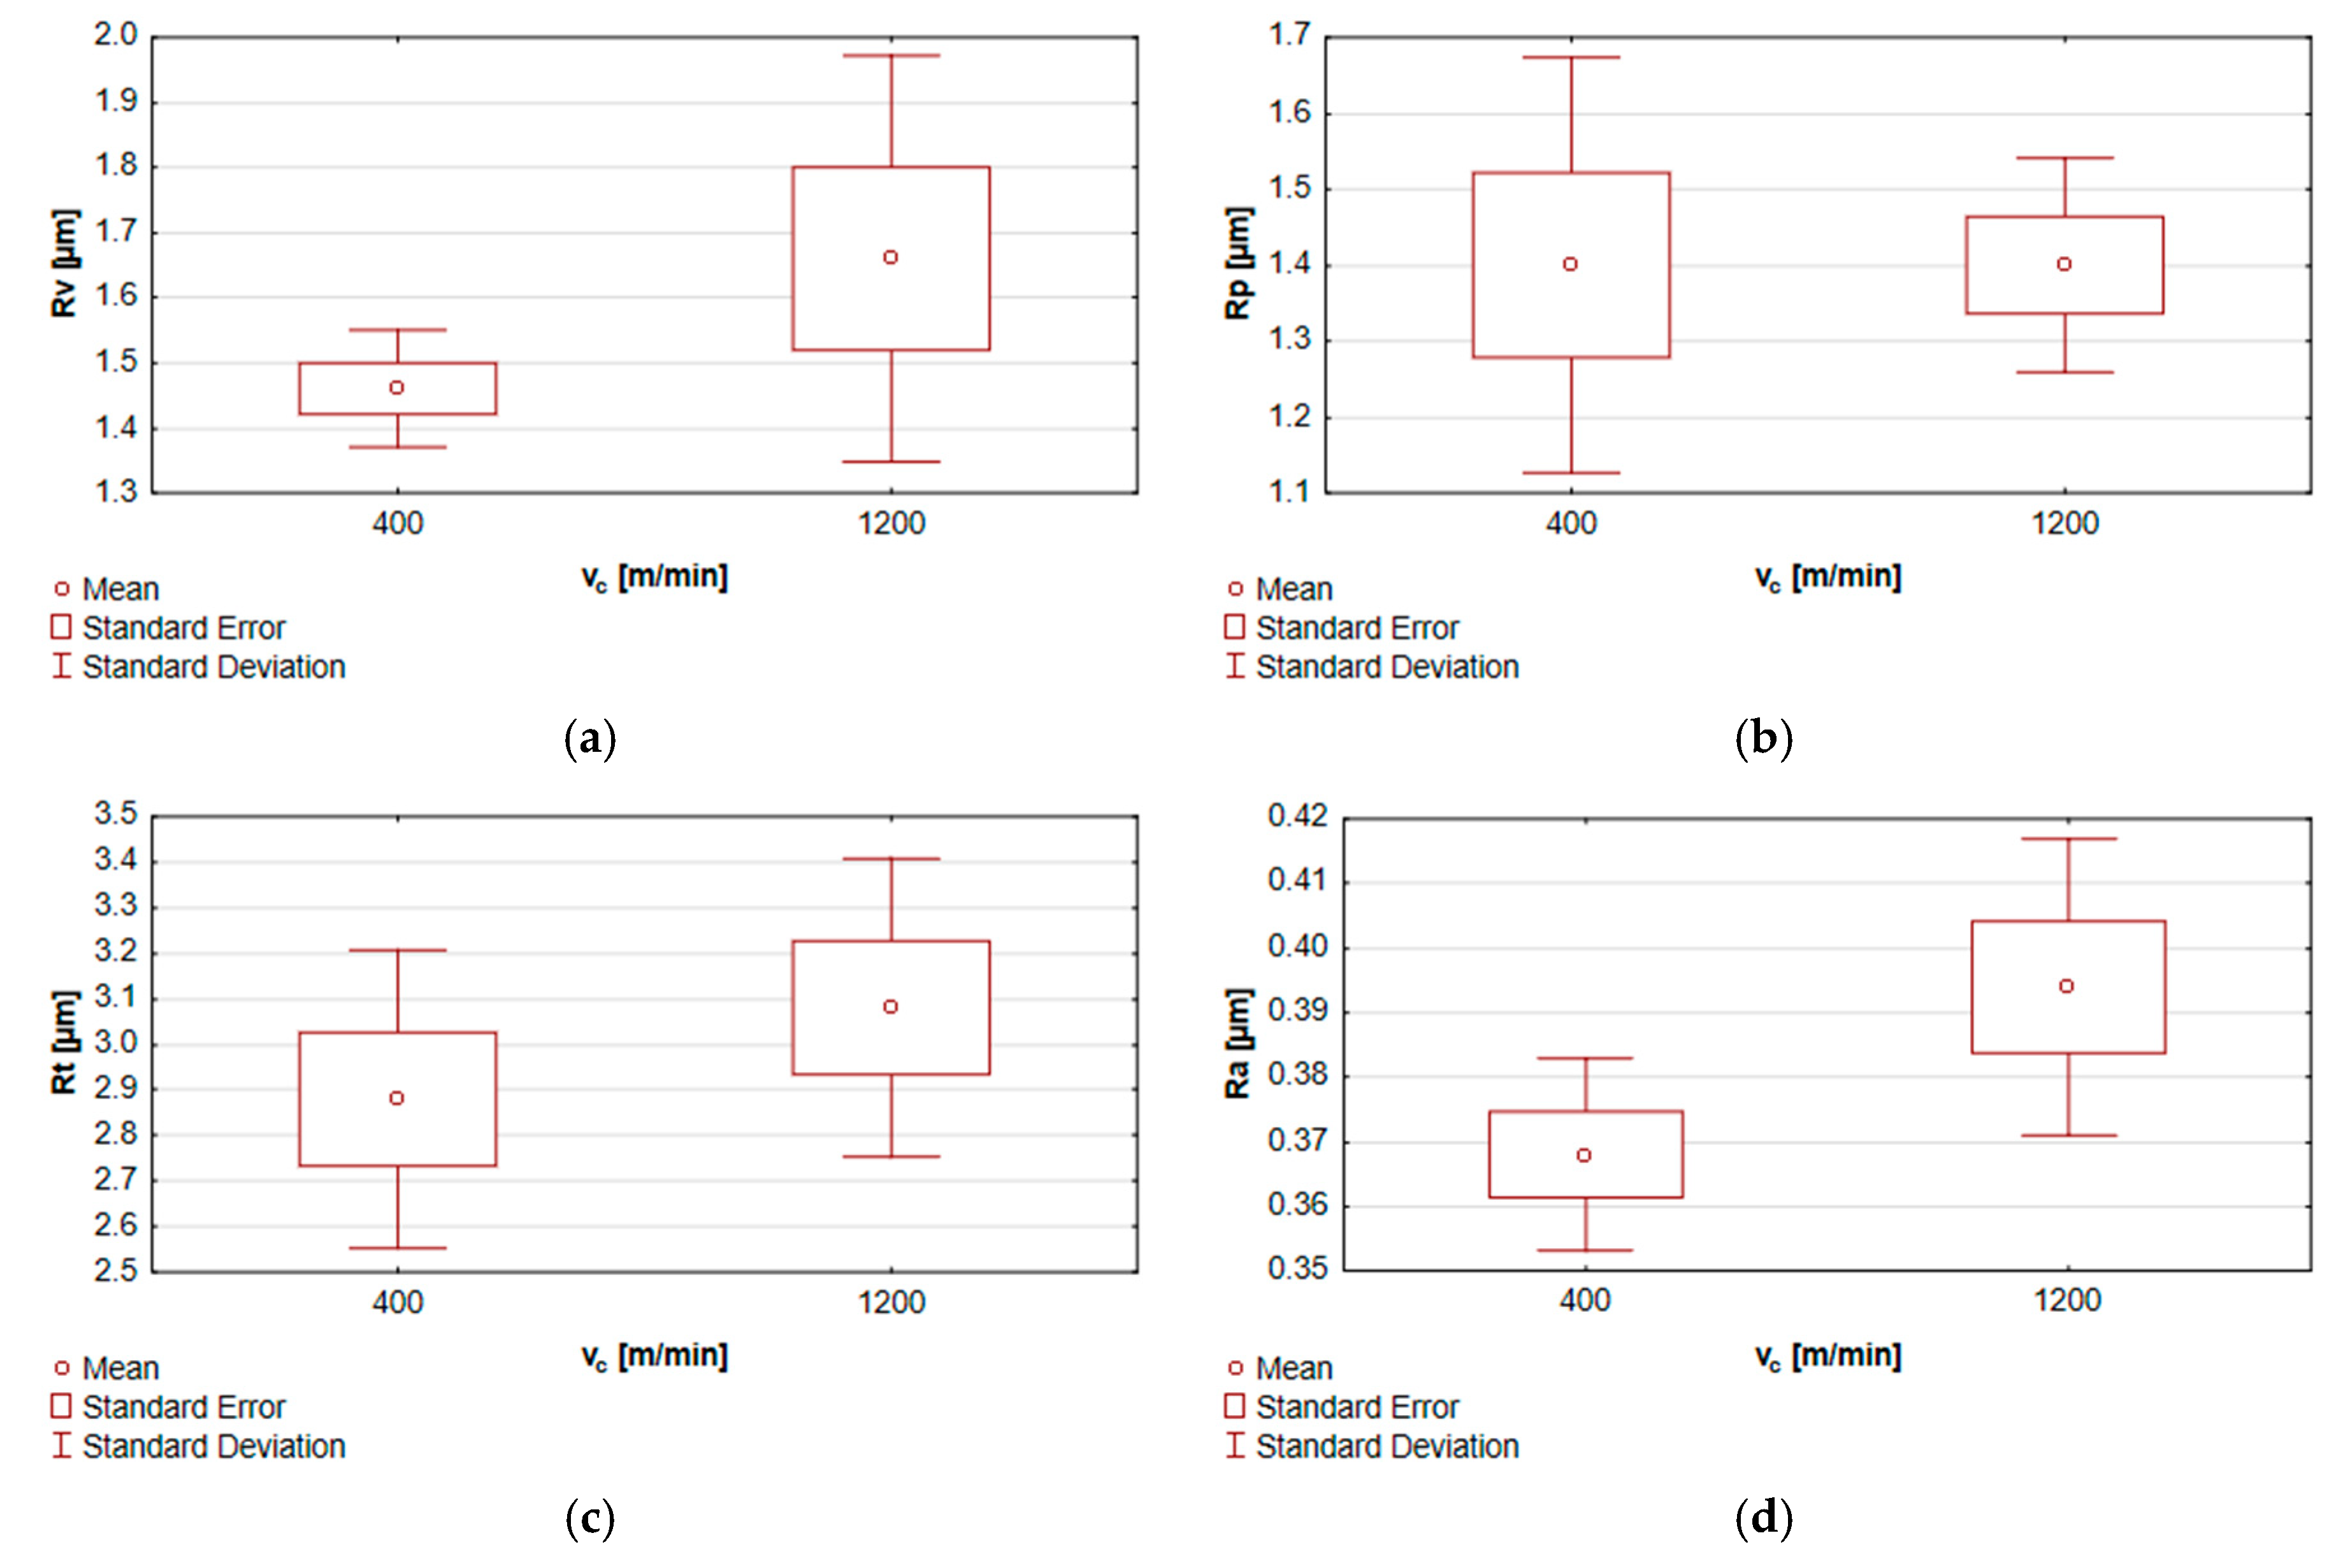
The values of Rv and Rp were comparable and ranged from 1.30–1.66 µm on the end face and 1.84–2.46 µm on the lateral face of the workpiece. Similarly, regarding the Rt parameter, lower values, ranging from 2.80 to 3.08 µm, were also recorded on the end-face surfaces, while on the lateral face, its value ranged from 3.90 to 5.16 µm. The Ra parameter did not exceed 0.40 µm on the end face, similarly as in the study by Kuczmaszewski et al. [
7] where the average Ra was reported in the close range (0.3–0.4 µm), while on the lateral surface, its values were significantly higher, varying from 0.58 to 0.75 µm. The results also confirm other previous findings [
8,
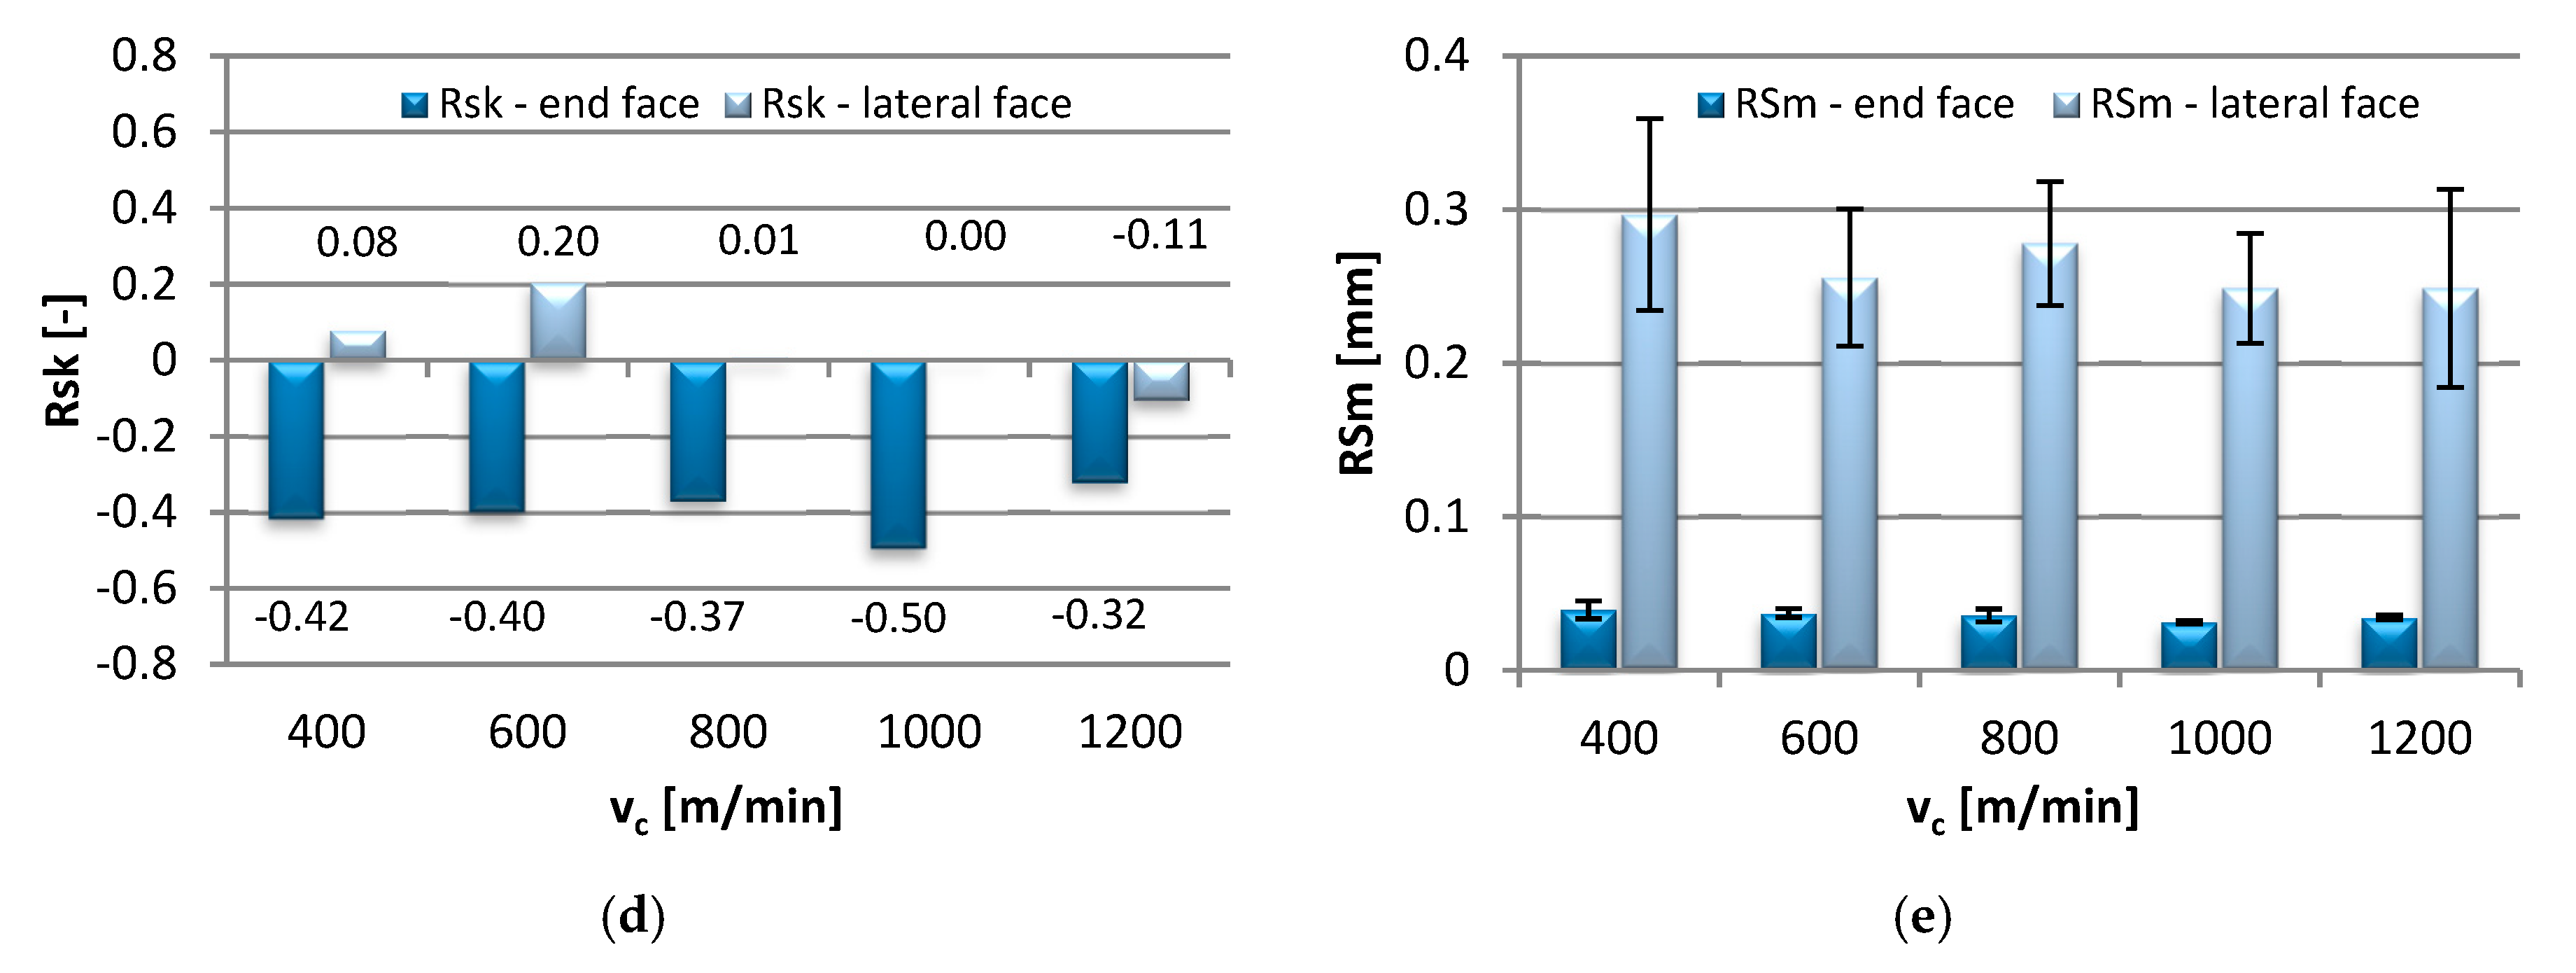
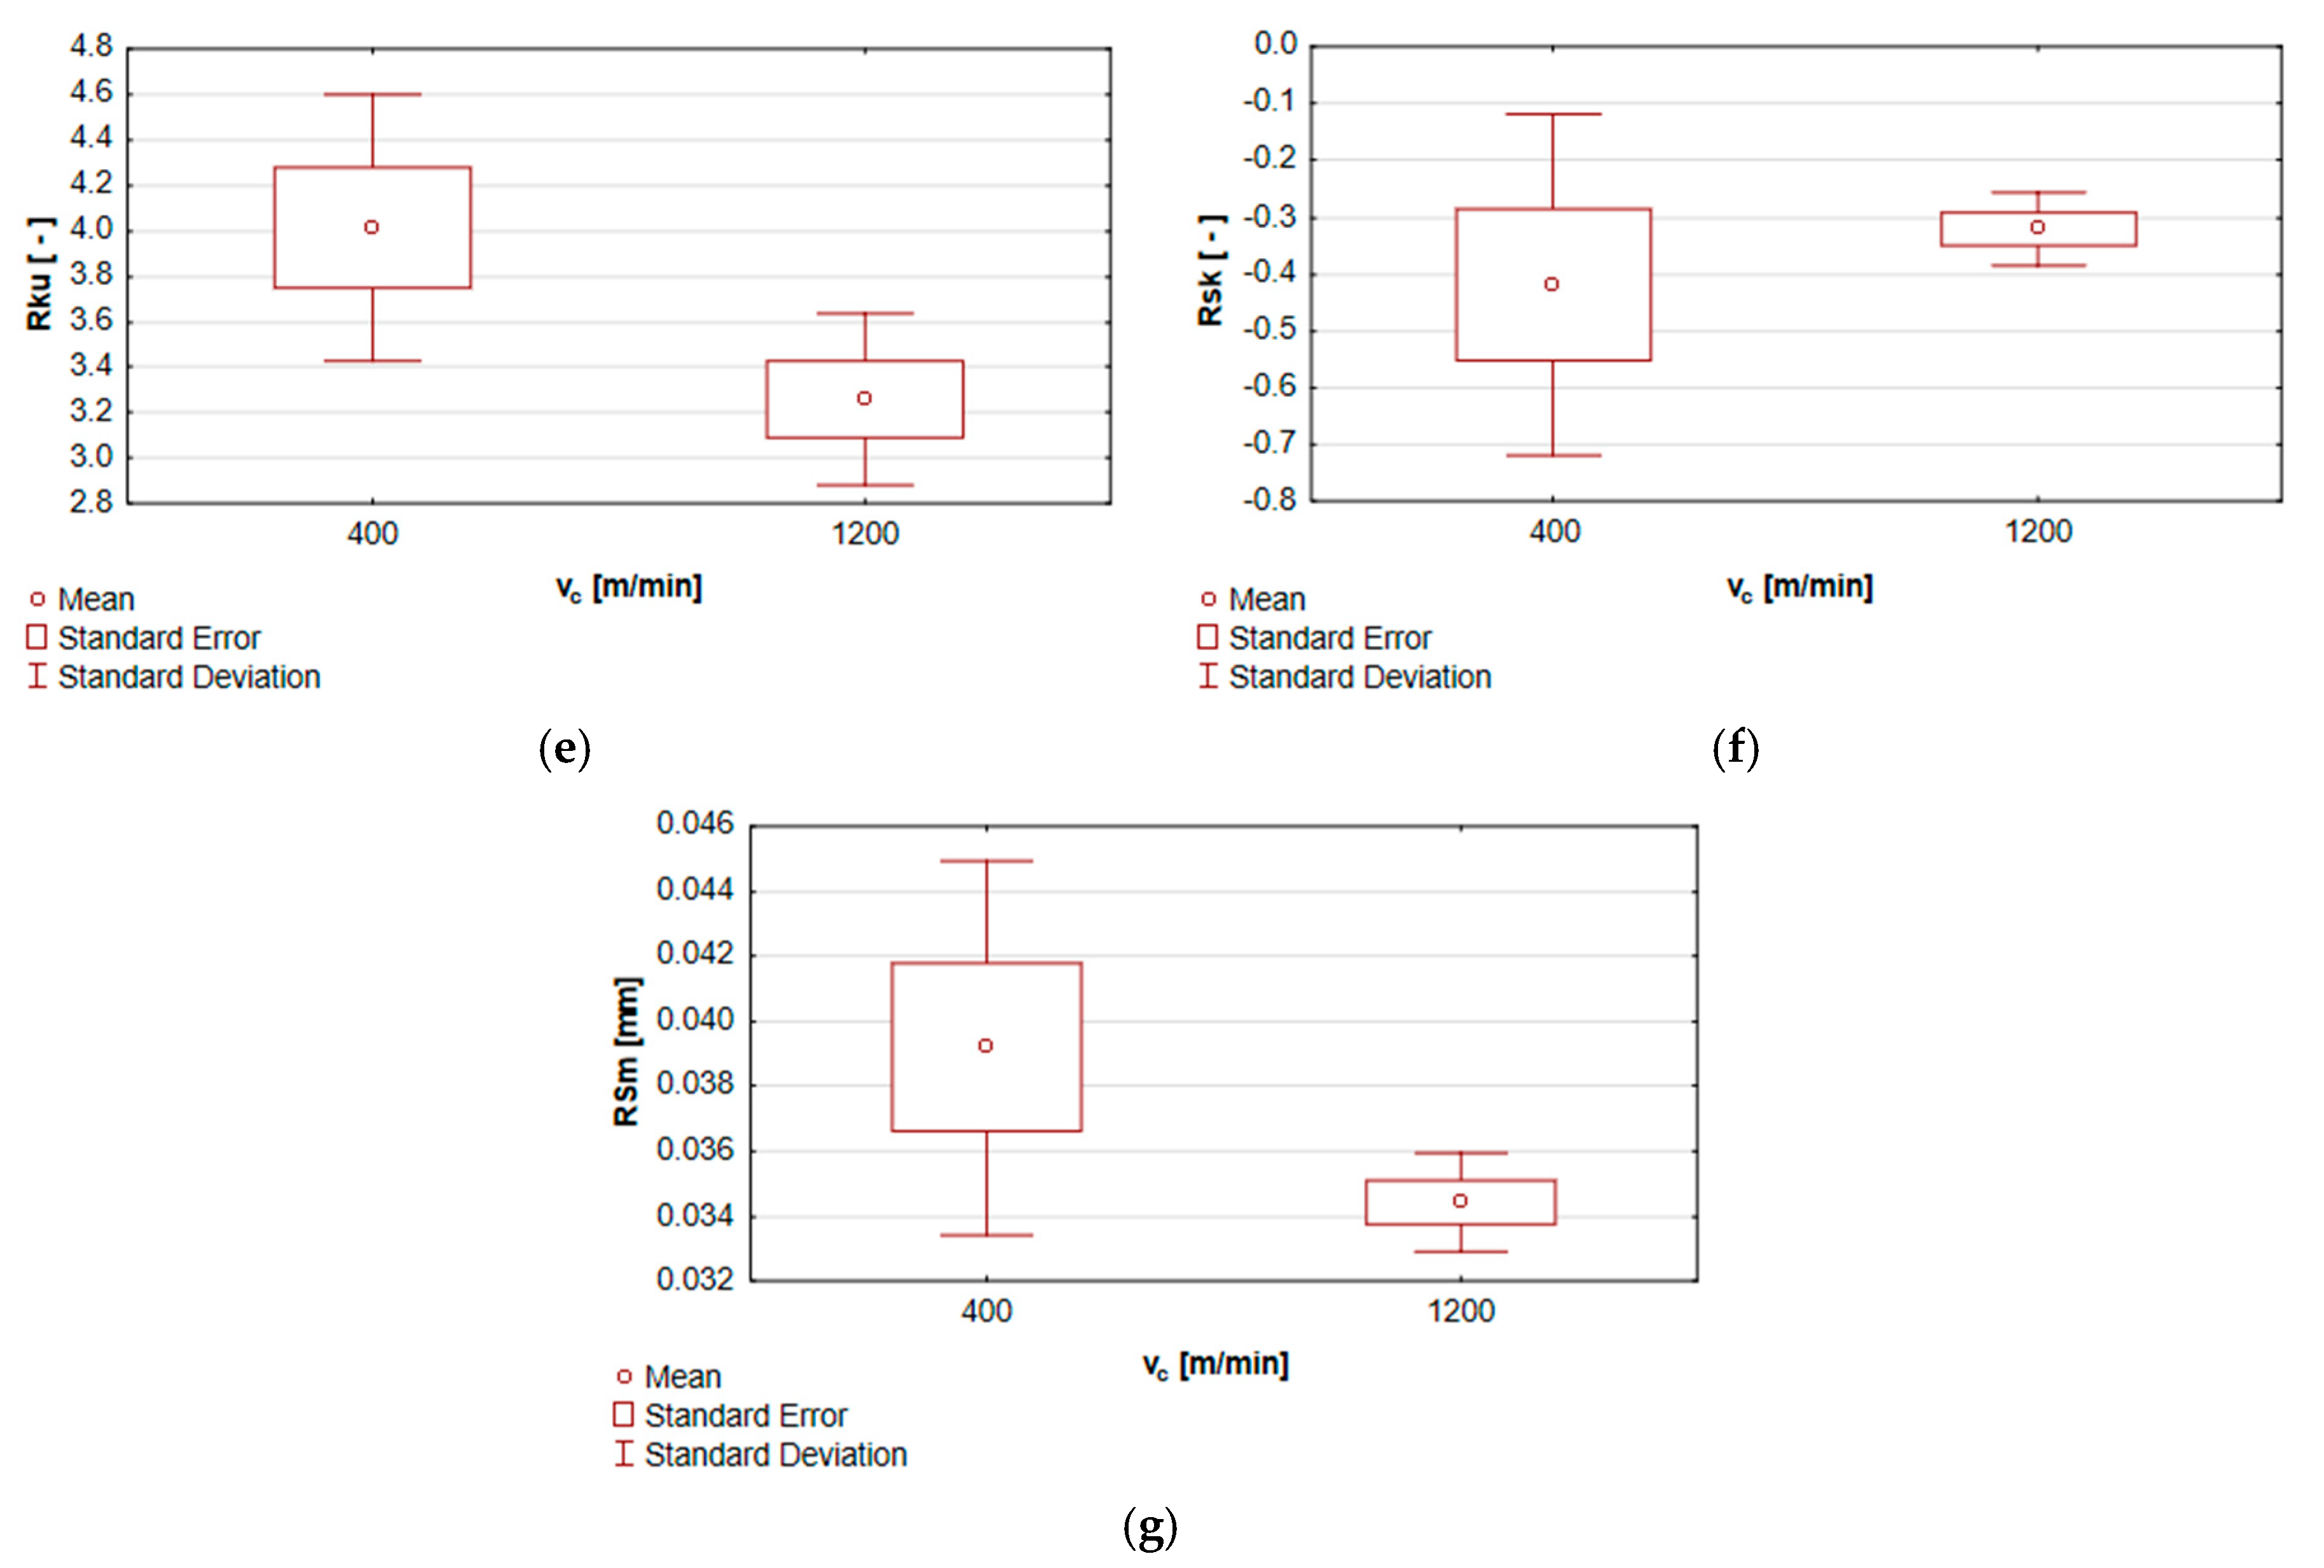
9], where the most beneficial Ra was near 0.4 μm and was obtained by modifying the cutting speed. Among the surface roughness parameters, only the end-face Rku was higher in comparison with the value on the lateral face of the specimens. Kurtosis values greater than 3, as here, designate a surface with sharp peaks and valleys, which in the case of mating surfaces contributes to reducing the friction coefficient; on the lateral face, the peaks had normal distribution (values close to 3). The negative values of the end-face Rsk are indicative of flat-topped distribution, while the values close to zero on the lateral face indicate a symmetrical distribution of peaks. For clarity, the numerical values of the Rsk parameter are presented in the graph. The RSm values on the end face were in the range of 0.031–0.039 mm, and were several times lower than those recorded on the lateral face of the specimens, 0.249–0.297 mm. The change in the cutting speed was not found to significantly impact any of the 2D parameters.
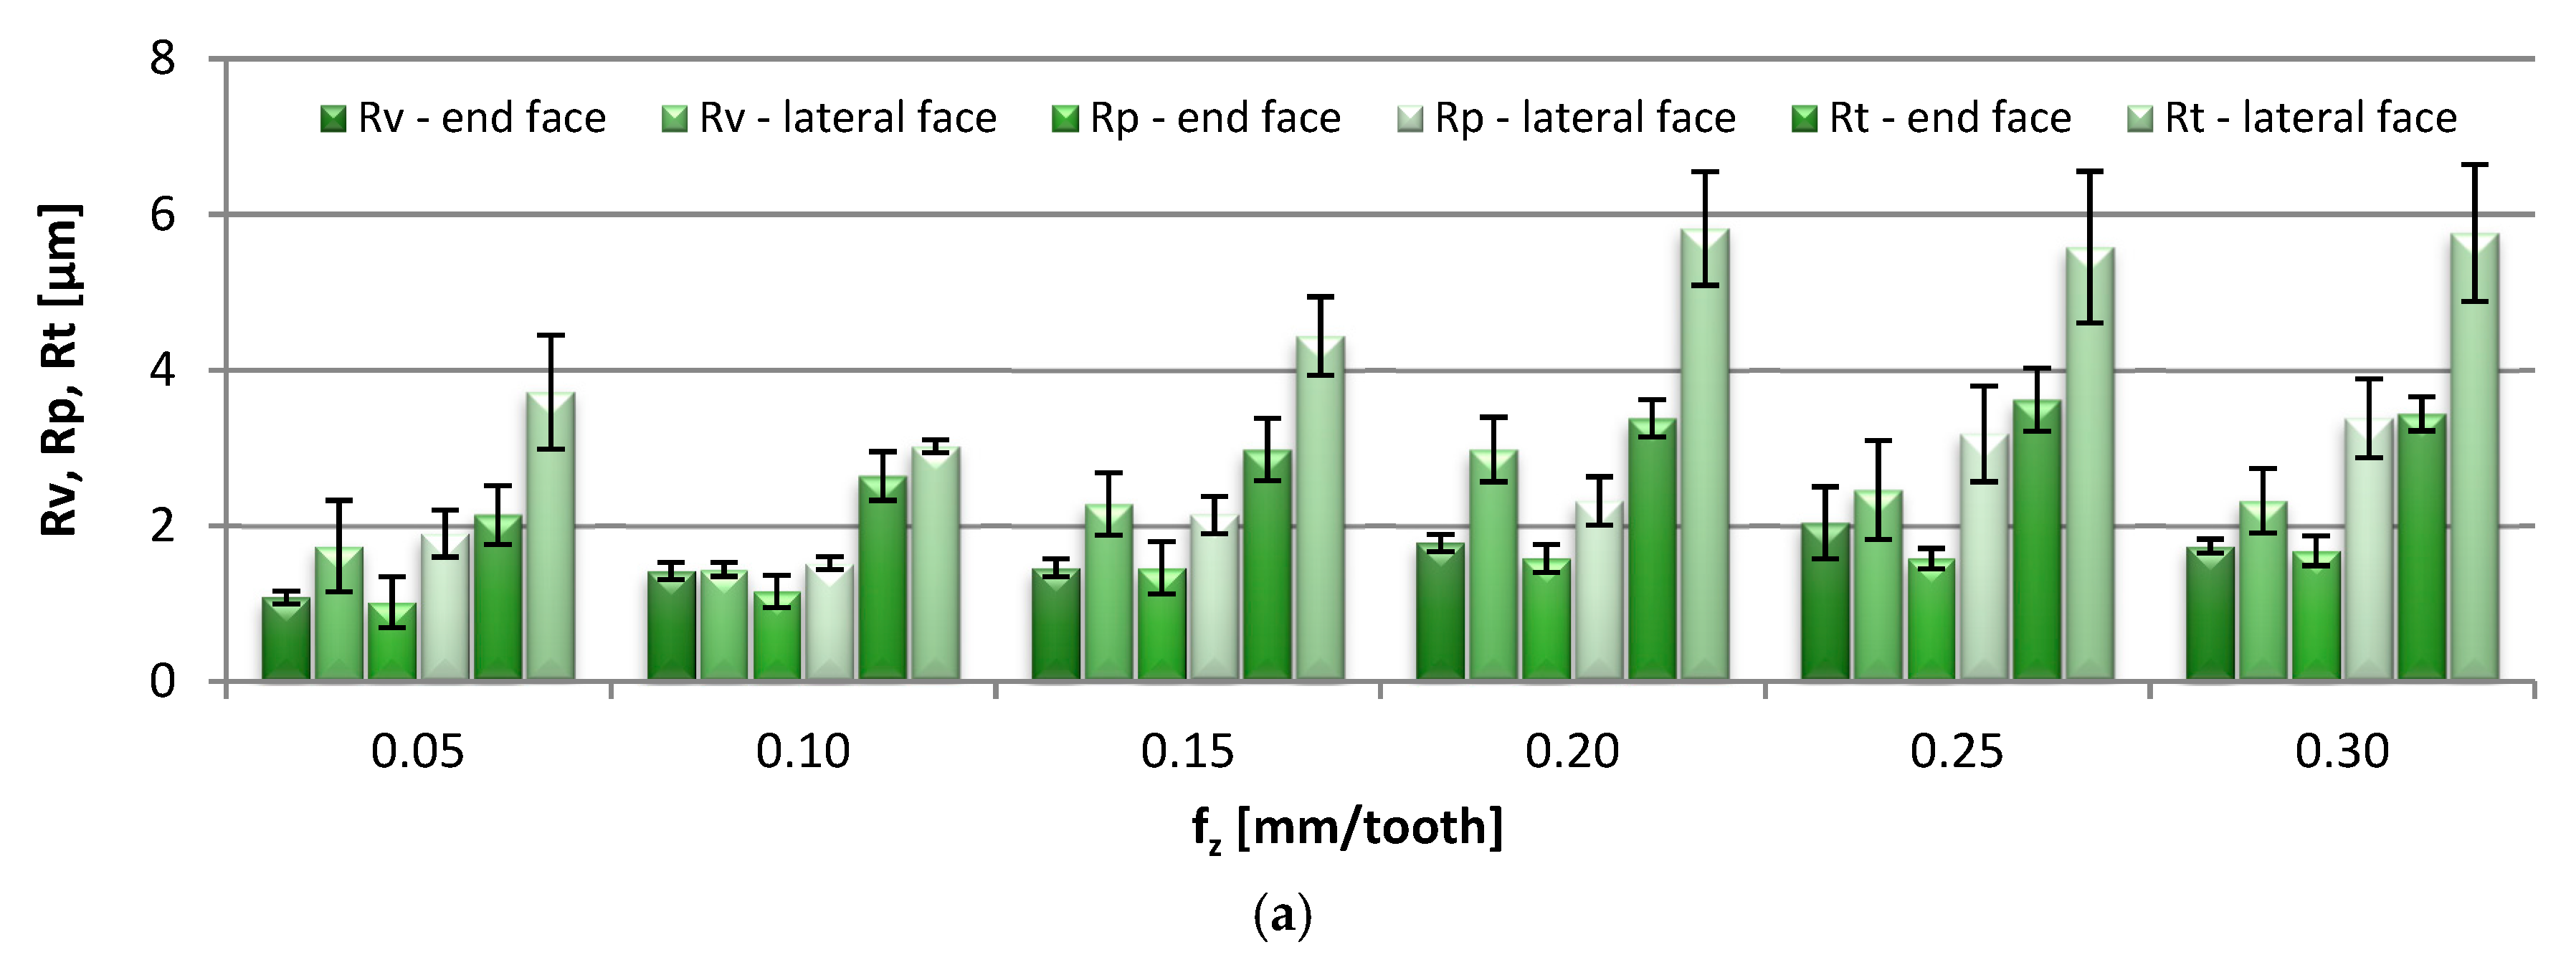
The bar charts in
Figure 3 represent the effects that the feed per tooth adjustment, f
z = 0.05–0.30 mm/tooth, had on the end-face and the lateral-face 2D surface roughness parameters.
Comparable values of Rv and Rp were obtained on the end face of the specimens, amounting to 1.02–2.04 µm. The lateral-face parameters were notably higher, in the range of 1.44–3.38 µm. Although at higher feed per tooth rates both parameters tended to increase, it was Rv that showed a stronger response to such adjustments. A similar effect was observed in the case of the Rt parameter, which raised to 2.14–3.62 µm on the end face, and 3.02–5.82 µm on the lateral face of the specimens. Similarly, an increase in the feed per tooth triggered an increase in the Ra parameter, which on the end face amounted to 0.28–0.0.47 µm (whereas in a former study [
7] the parameters were 0.2–0.5 µm) and on the lateral face to 0.44–0.95 µm. Similar Ra results were also reported in analogous studies [
8,
9], where the Ra in the range of 0.2 µm to approximately 0.75 µm was produced by cutting with a feed per revolution of 0.05–0.4 mm/rev. The end-face Rku parameter was reported to exceed the value of 3 in the entire range of tested feeds, which is characteristic of surfaces with sharp peaks and valleys; the kurtosis values on the lateral face oscillated in the region of 3, thus indicating the normal peak distribution. The Rsk parameter on the end face was negative in the tested range of feed per tooth changes, which is indicative of a flat-topped distribution of the profile heights, while the lateral-face Rsk was variable, fluctuating between negative and positive. For easier interpretation, the numerical values of the Rsk are included in the graph. In the case of the RSm parameter, on the end face it ranged from 0.035 to 0.047 mm, which was a several-fold lower value compared with the measurement results on the lateral face of the specimens: 0.249–0.429 mm.
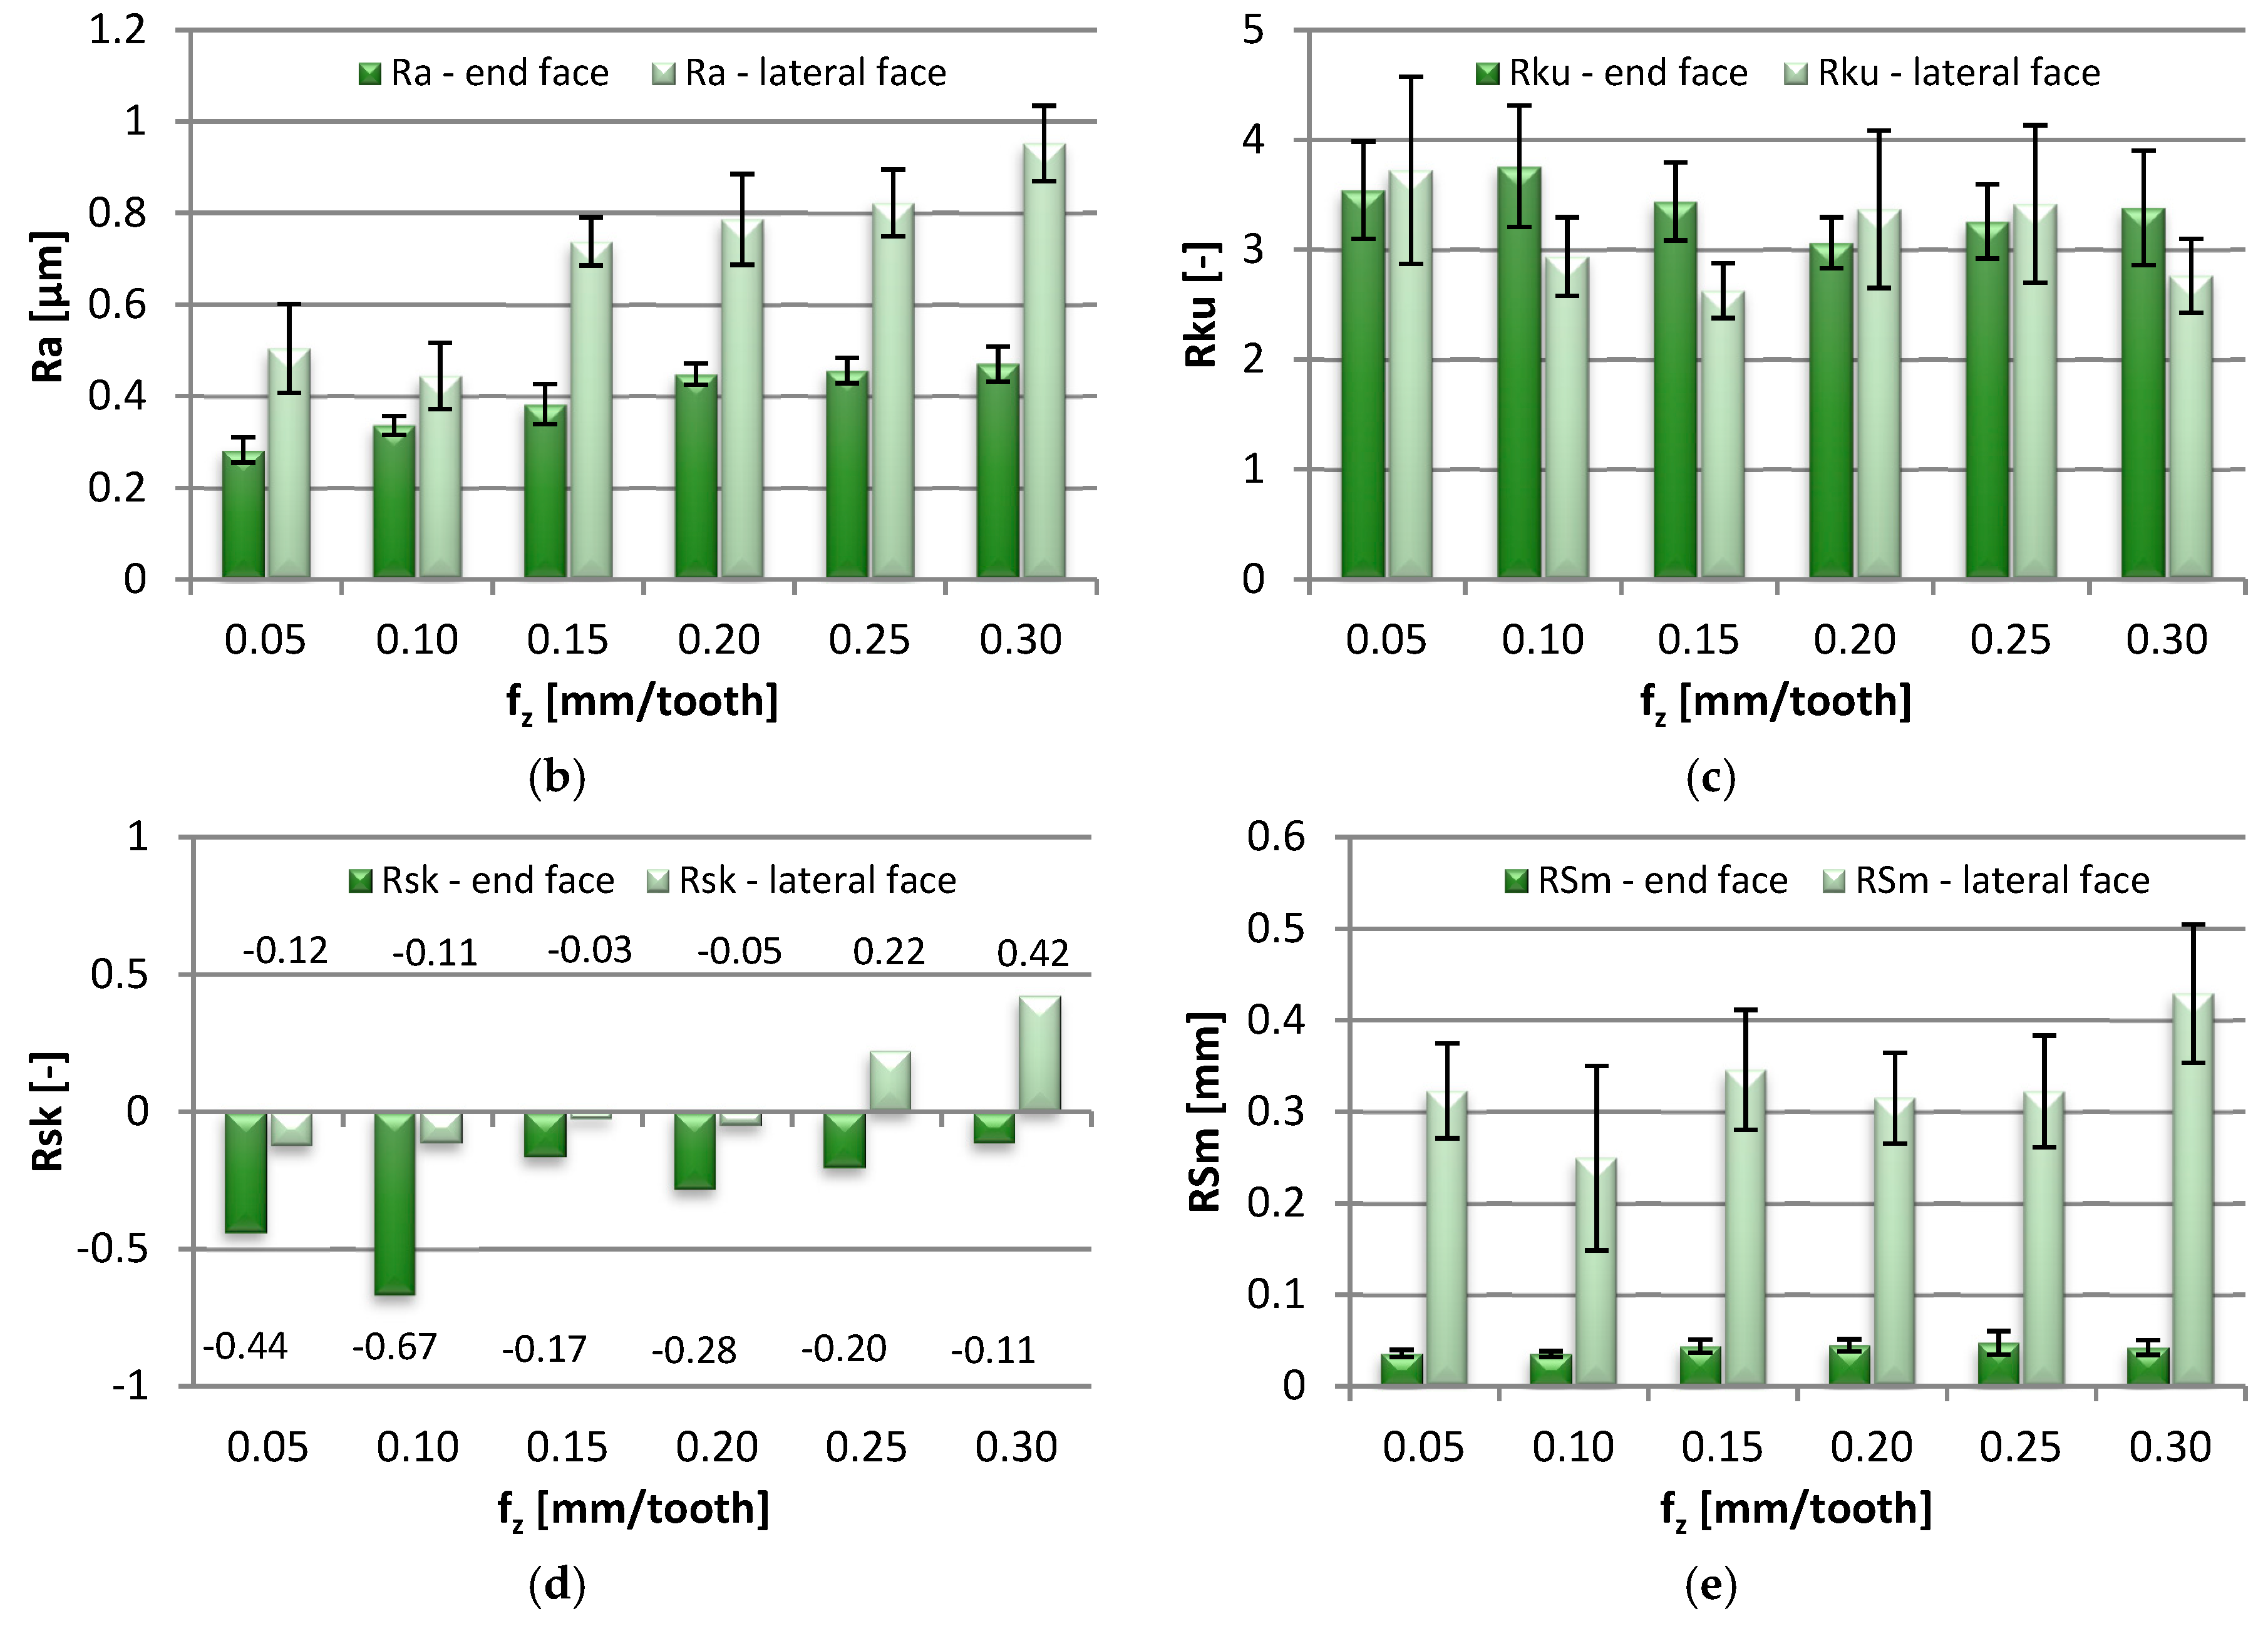
The impact of the axial depth of cut changes, in the range of a
p = 0.5–6 mm, on the 2D roughness parameters of the specimens is shown in the bar graphs in
Figure 4.
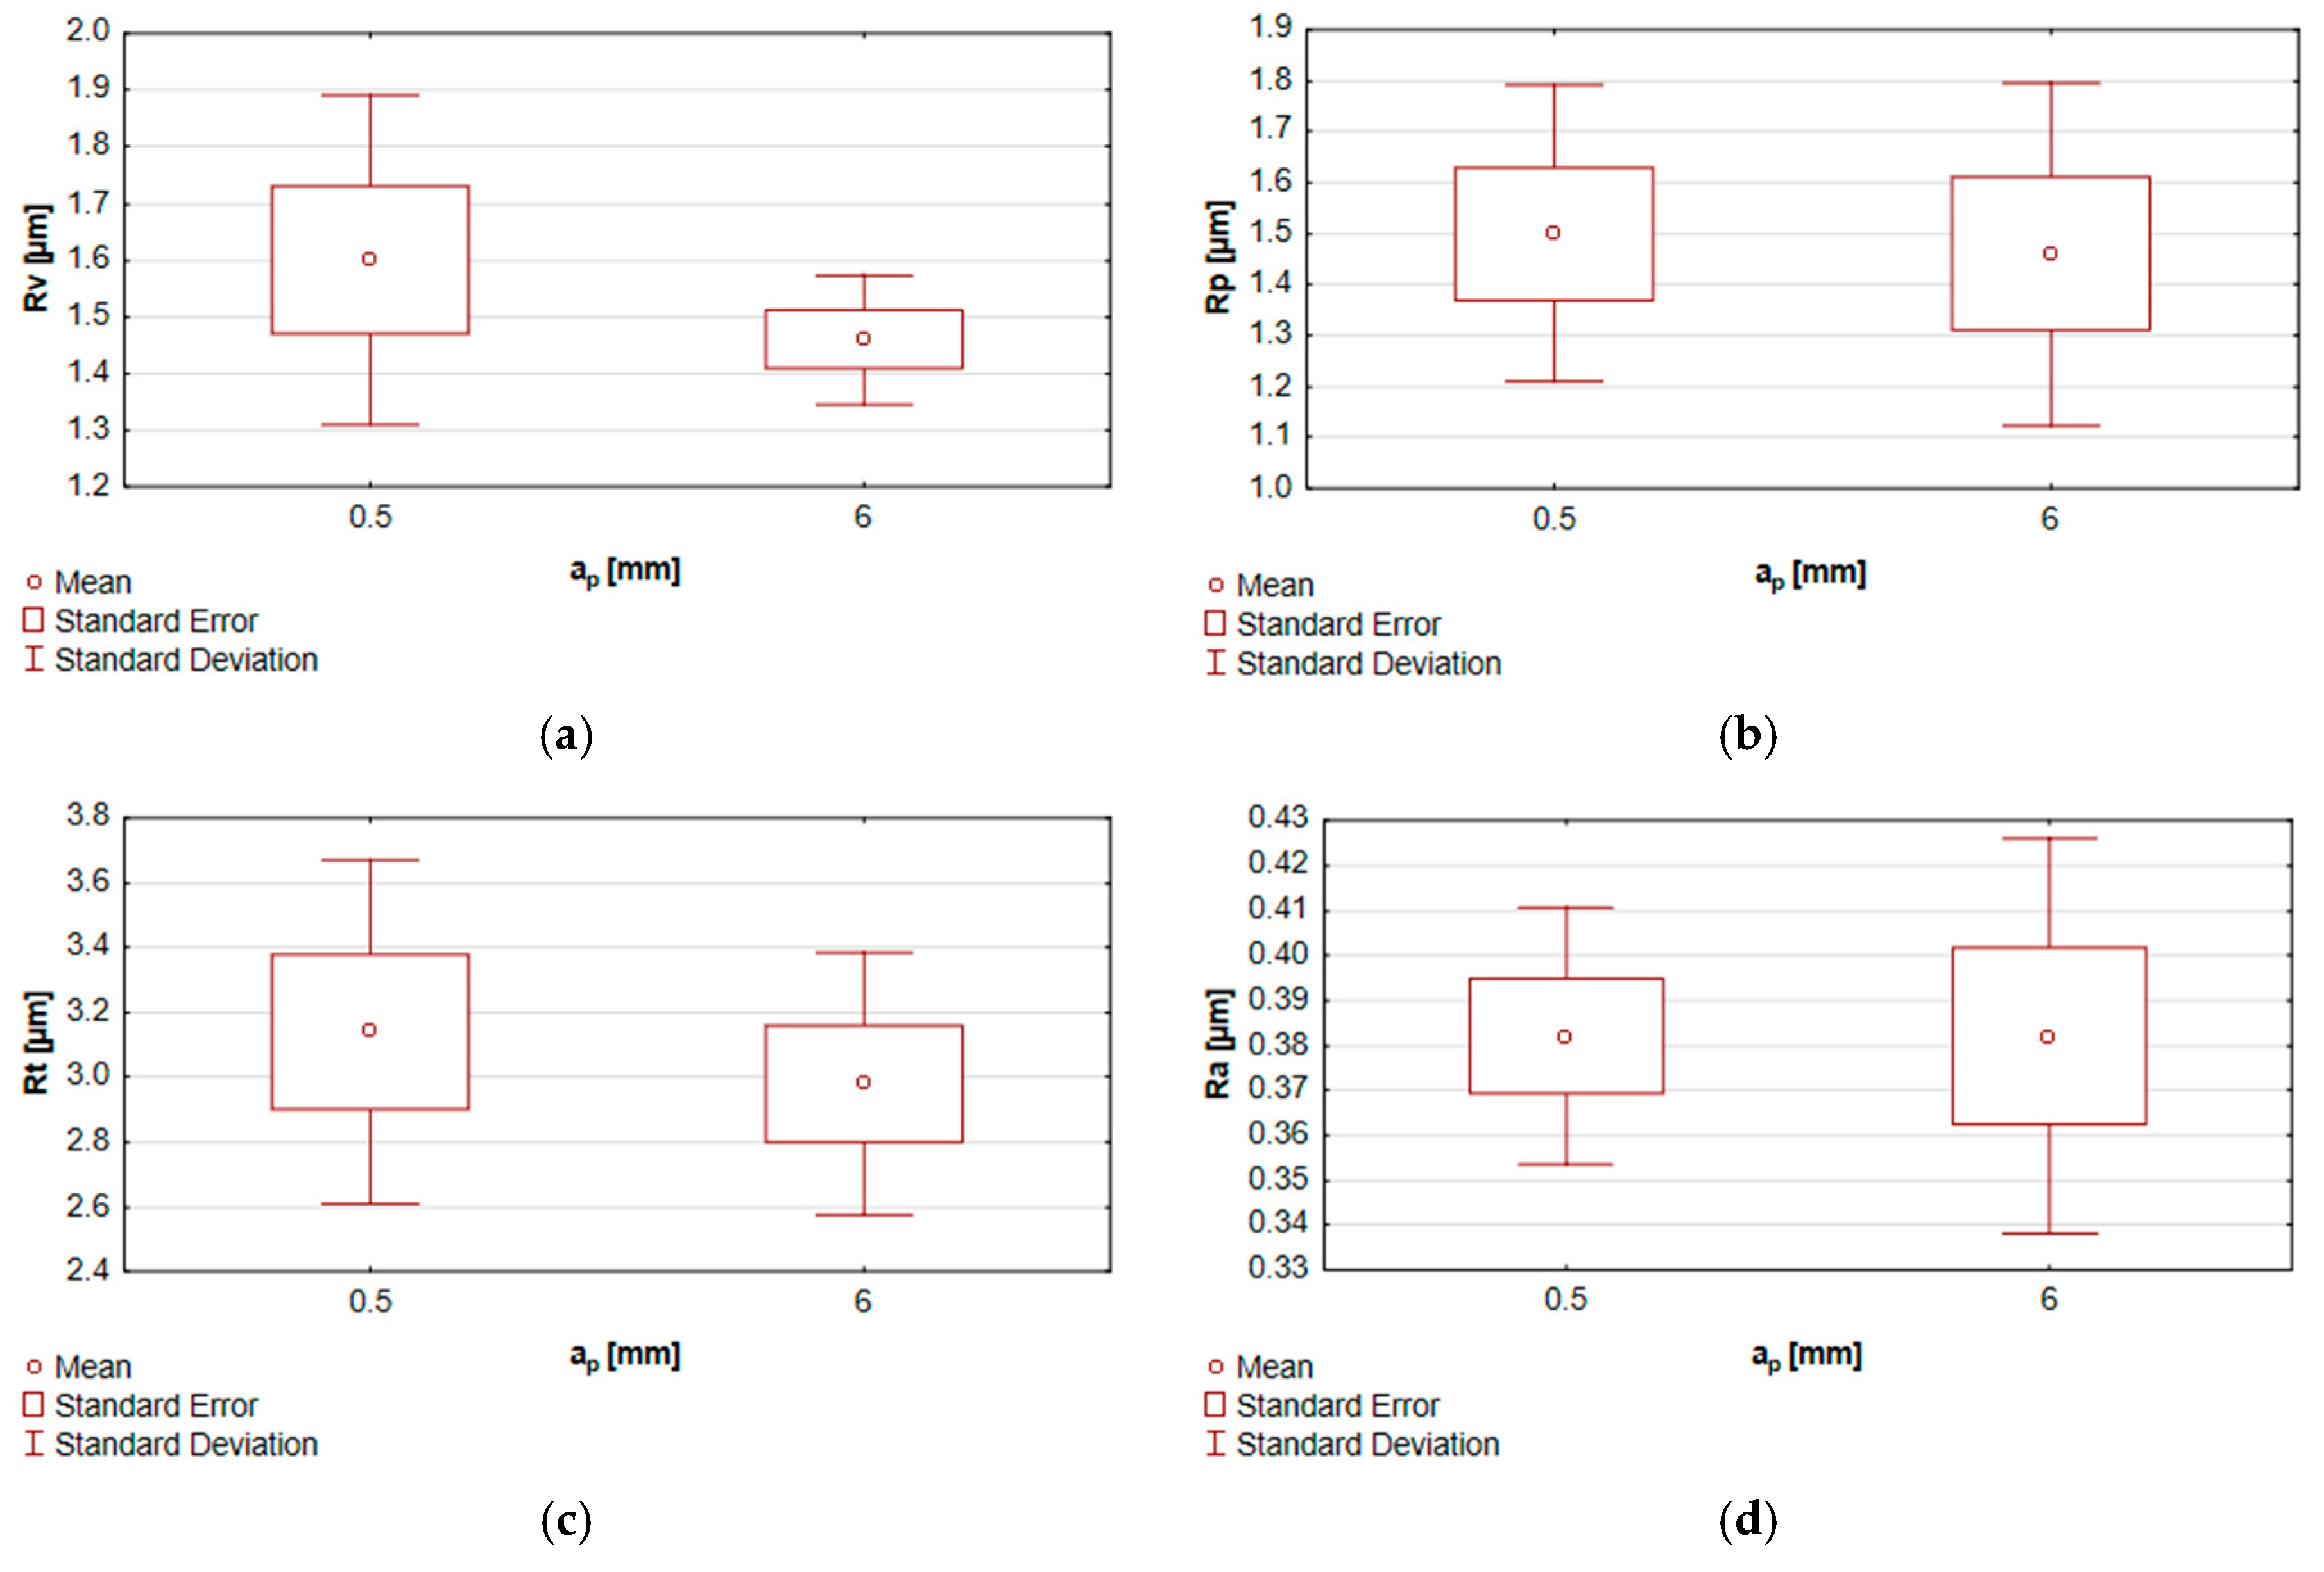
The values of Rv and Rp amounted to 1.42–1.60 µm, which was constant throughout the range of a
p applied during milling. A similar consistency of results was observed in the case of the Rt parameter, 2.86–3.14 µm. Similarly, a negligible effect of the rising axial depth of cut on the Ra parameter was observed. The parameter readings were repeatedly constant at 0.37–0.38 µm, which confirms previous findings [
8,
9]—for a
p = 0.1–0.5 mm the average Ra was near 0.4 µm. Regardless of the modification of the axial depth of cut during machining, the workpiece surface on the end face was characterized by sharp peaks and valleys, which emerges from Rku > 3. The Rsk > 0 was observed in the entire range of a
p, indicating that the surface heights were evenly distributed. The RSm parameter was in the range of 0.034–0.044 mm, and did not show a dramatic change in response to the increase in the axial depth of cut. None of the 2D surface roughness parameters was strongly affected by the change in the axial depth of cut during milling.
3.2. Surface Roughness 3D
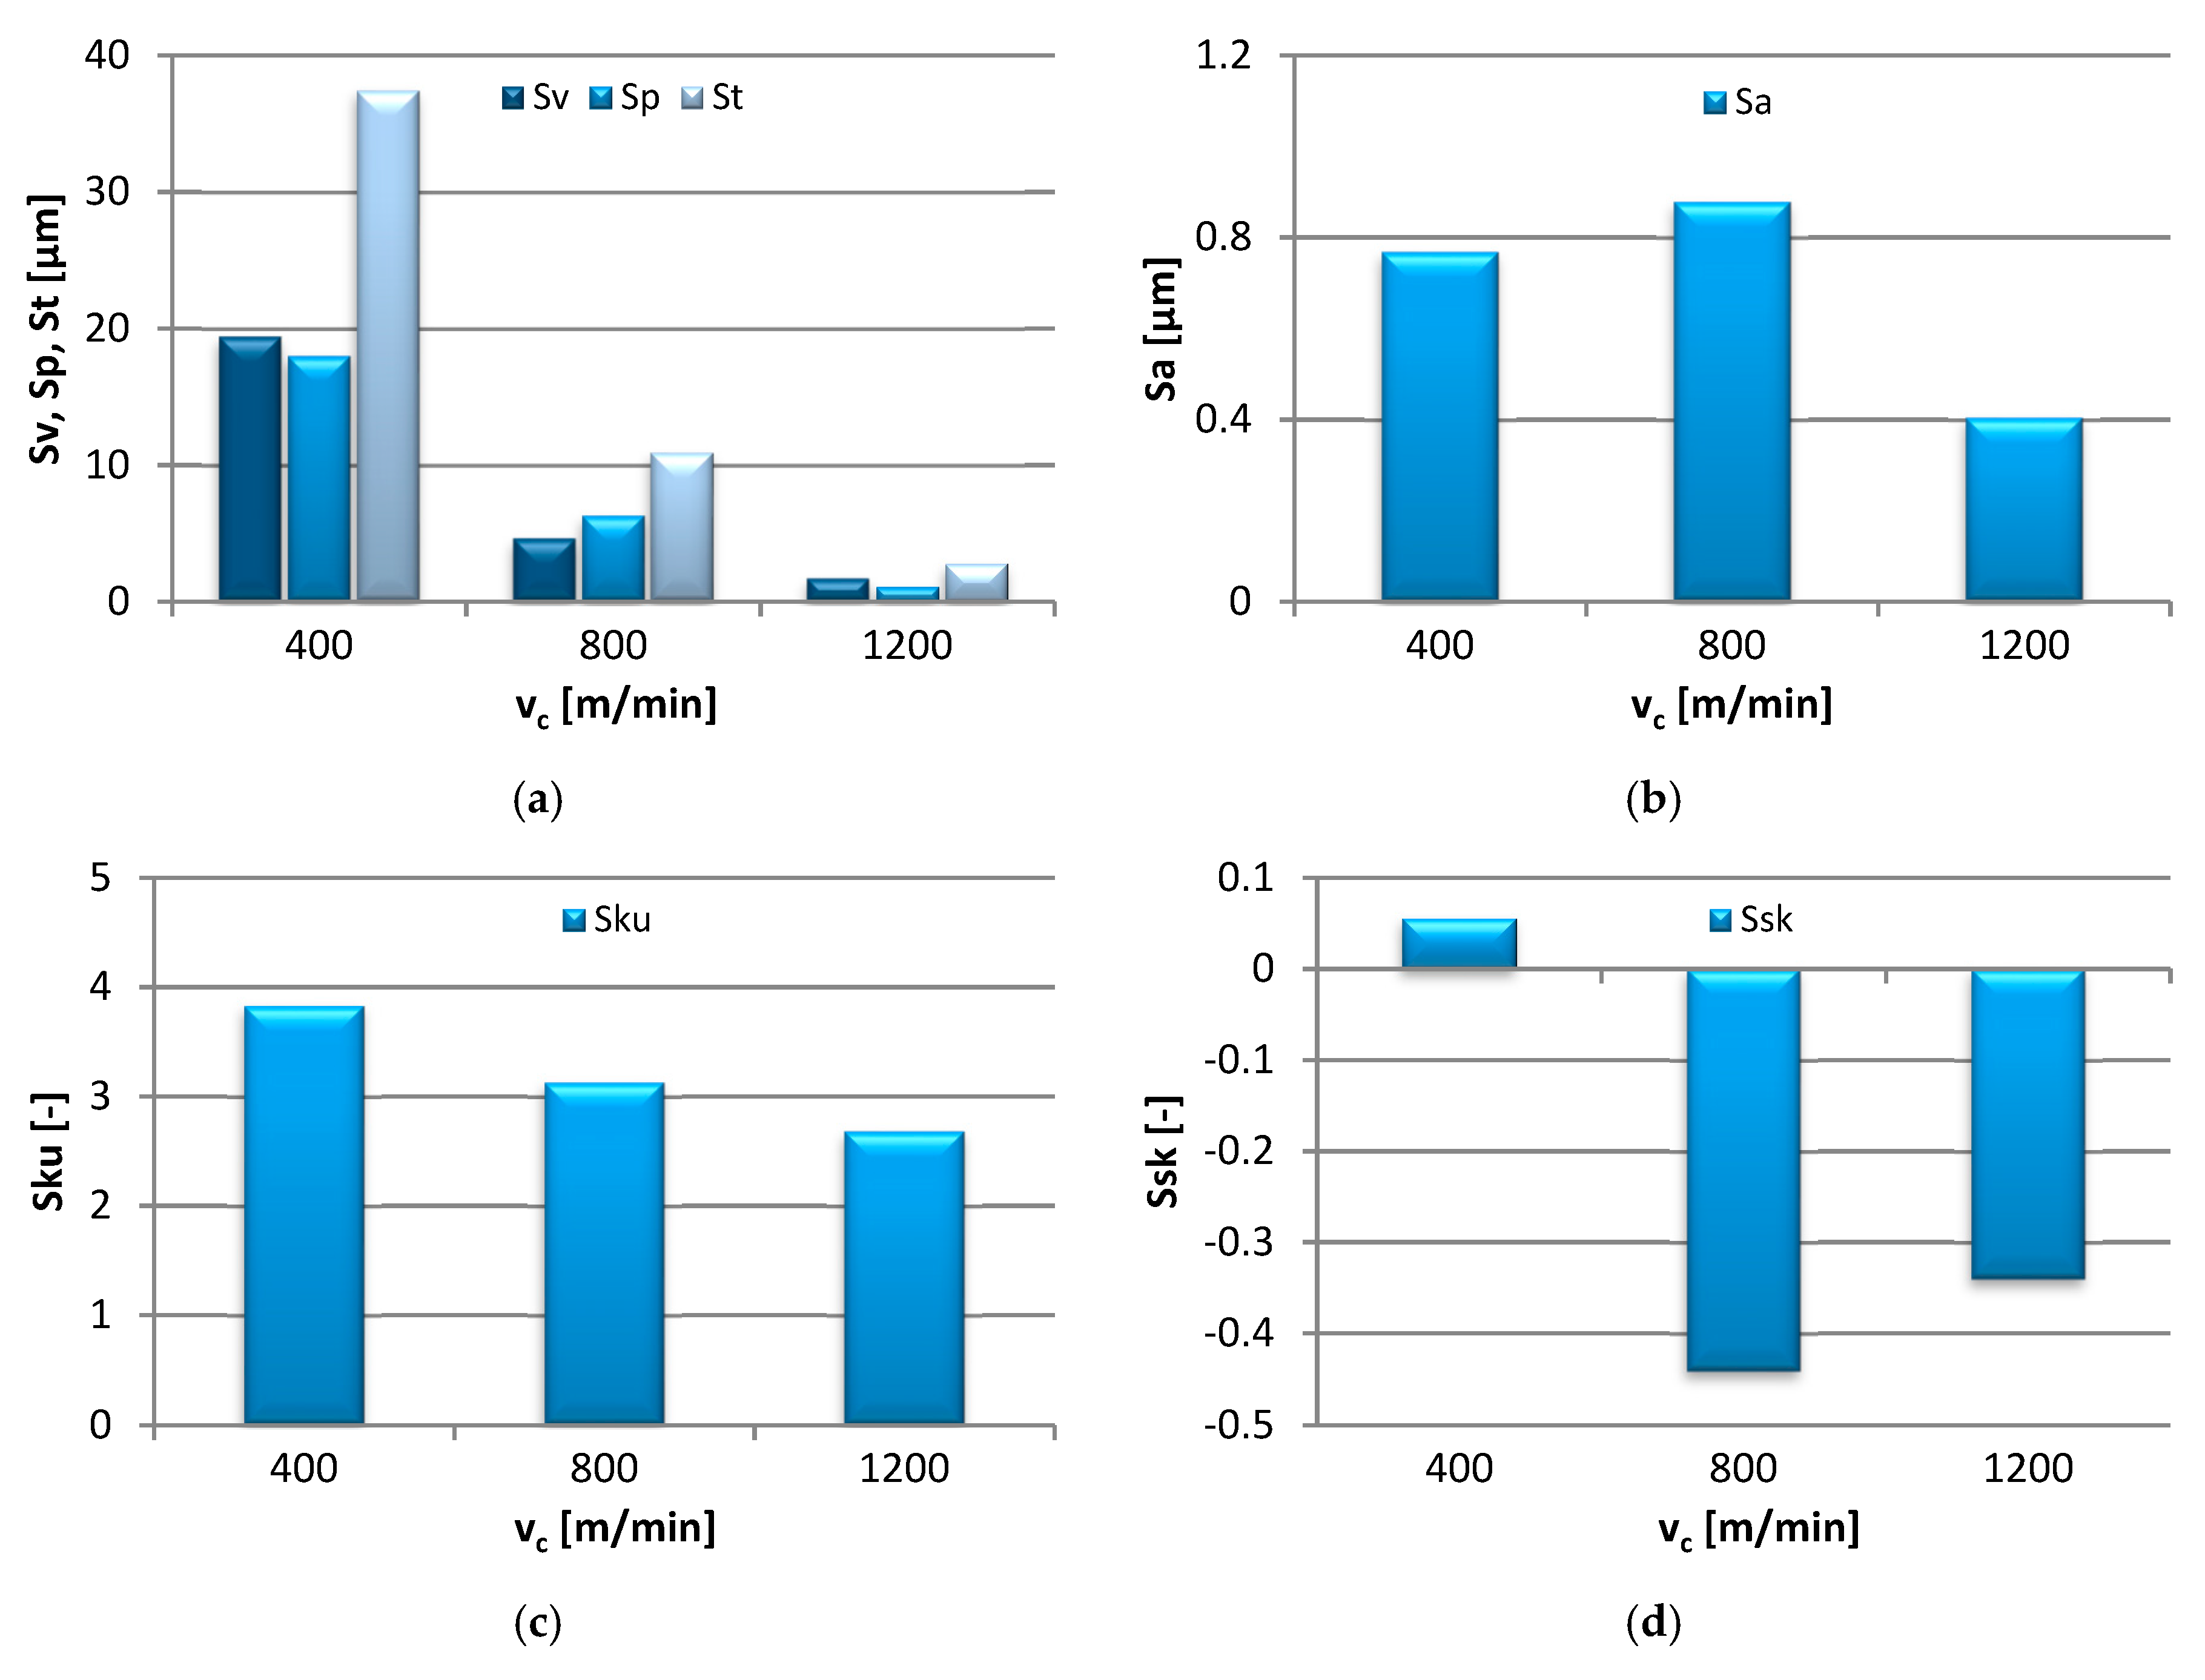
The effects of the cutting speed adjustment in the range of v
c = 400–1200 m/min on the 3D area roughness parameters measured on the end face of the specimen are shown in
Figure 5.
The values of Sv, Sp, and St showed a gradual decrease with the elevating cutting speed, i.e., from 19.40 µm to 1.69 µm, from 18.00 µm to 1.10 µm, and from 37.40 µm to 2.79 µm respectively. Following a slight increase at the medium cutting speed, vc = 800 m/min, the Sa eventually dropped from the initial 0.77 µm to 0.40 µm. A similar effect was observed in the Sku, which decreased from 3.83 to 2.68, thus indicating that initially sharp, the peaks and valleys became more rounded as the cutting speed progressed. With the increasing cutting speed, the value of Ssk dropped below 0, denoting flat surfaces with scattered peaks.
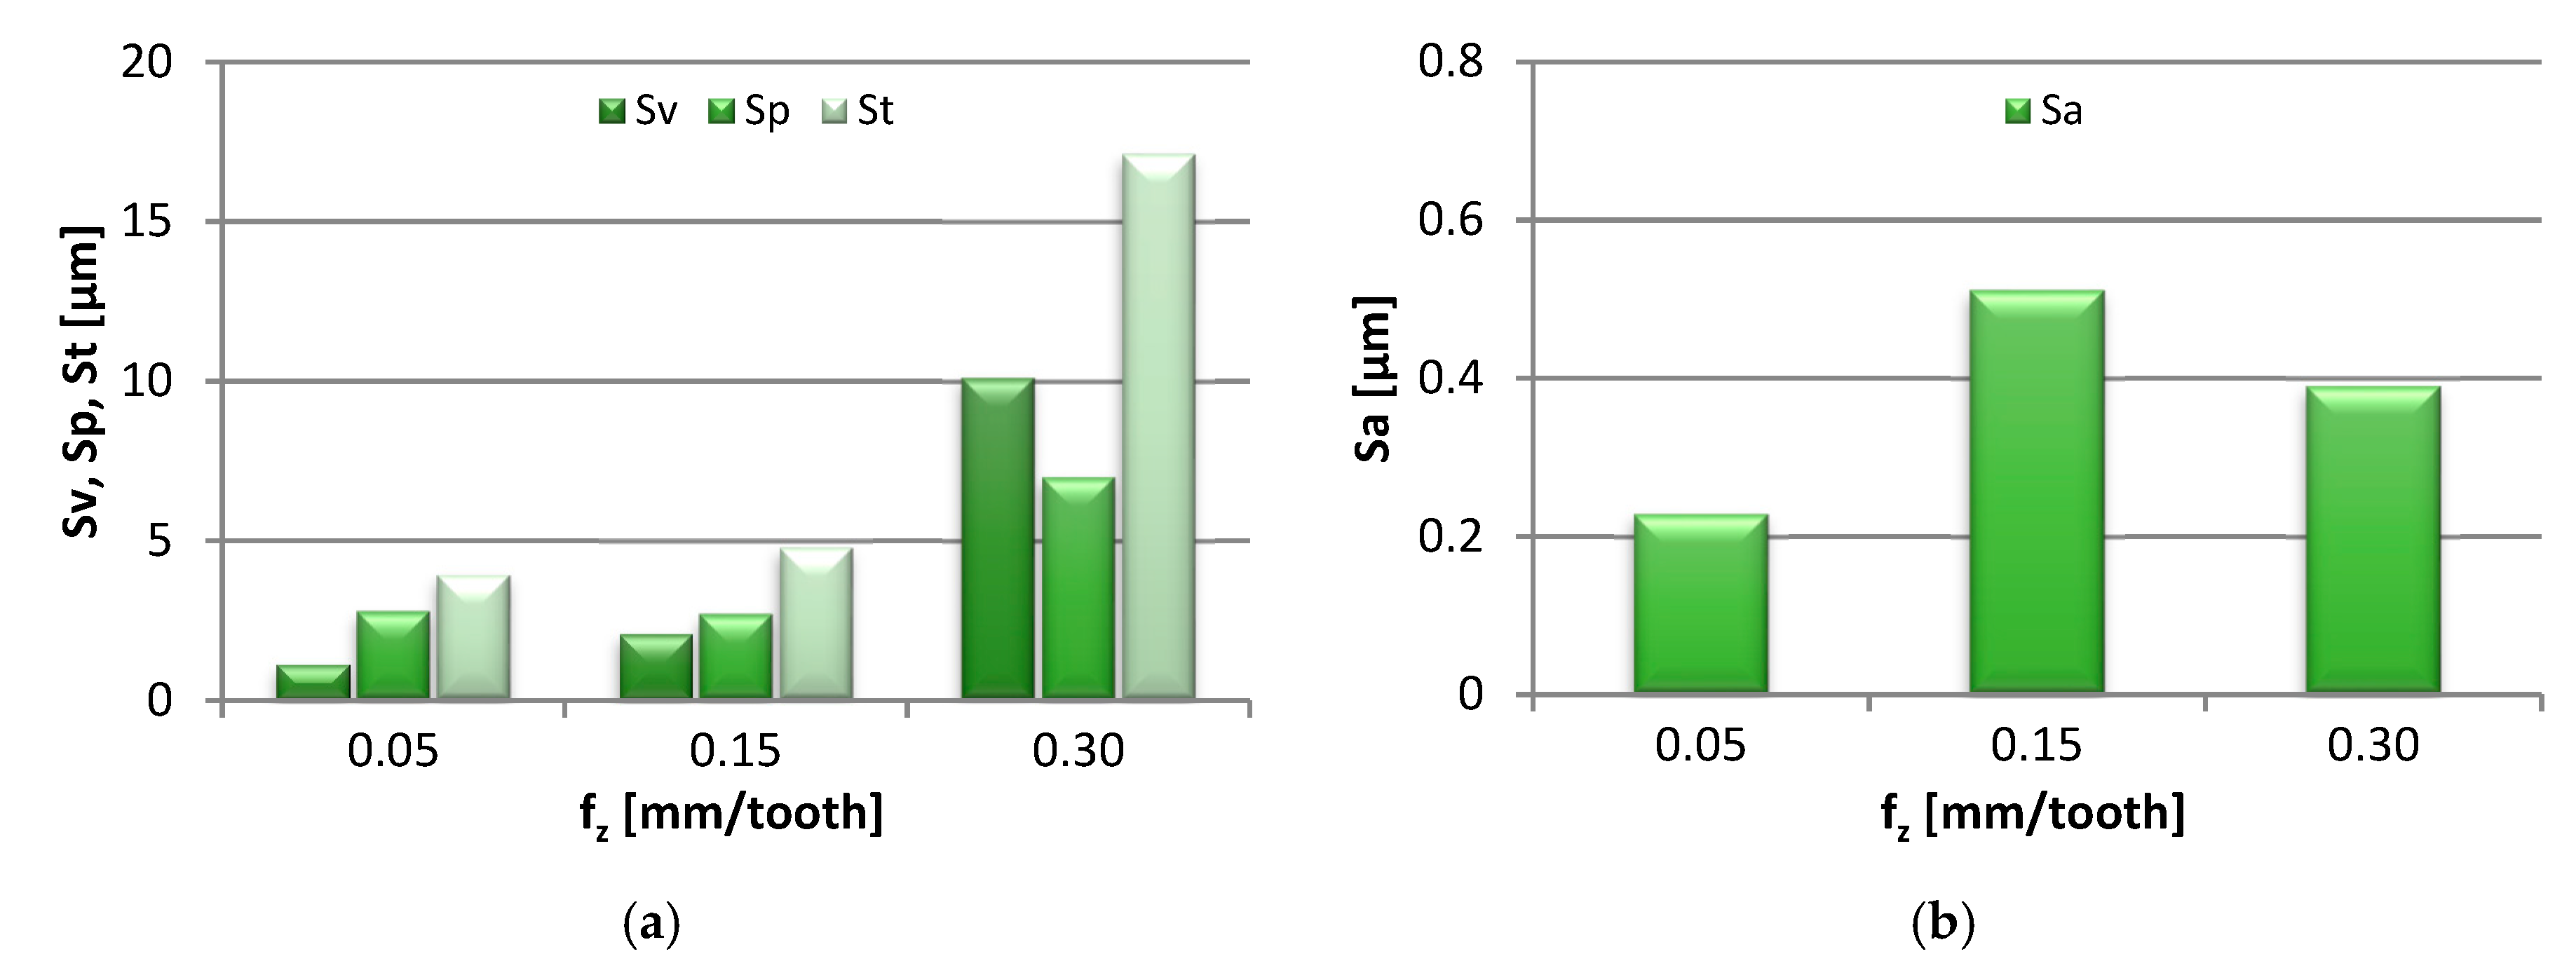
Figure 6 presents the effect of increasing the feed per tooth, from 0.05 to 0.30 mm/tooth, on the end-face 3D area roughness parameters of the specimens. The results are shown as bar graphs.
Sv and St were shown to increase gradually, respectively from 1.13 to 10.10 µm and from 3.92 to 17.10 µm. The values of Sp were eventually observed to increase from 2.70 to 6.99 µm, after a slight drop in value at fz = 0.15 mm/tooth. As a result of the change in the feed per tooth, they initially increased from 0.23 to 0.51 µm, and dropped at the highest fz setting. Regarding the Sku parameter, its value showed a linear decrease from 4.19 to 2.09, indicating that the surface heights became progressively rounded with the rising fz. In turn, the Ssk parameter was found to assume negative values, which is explained by the change from a flat-topped to a more symmetrical height distribution.
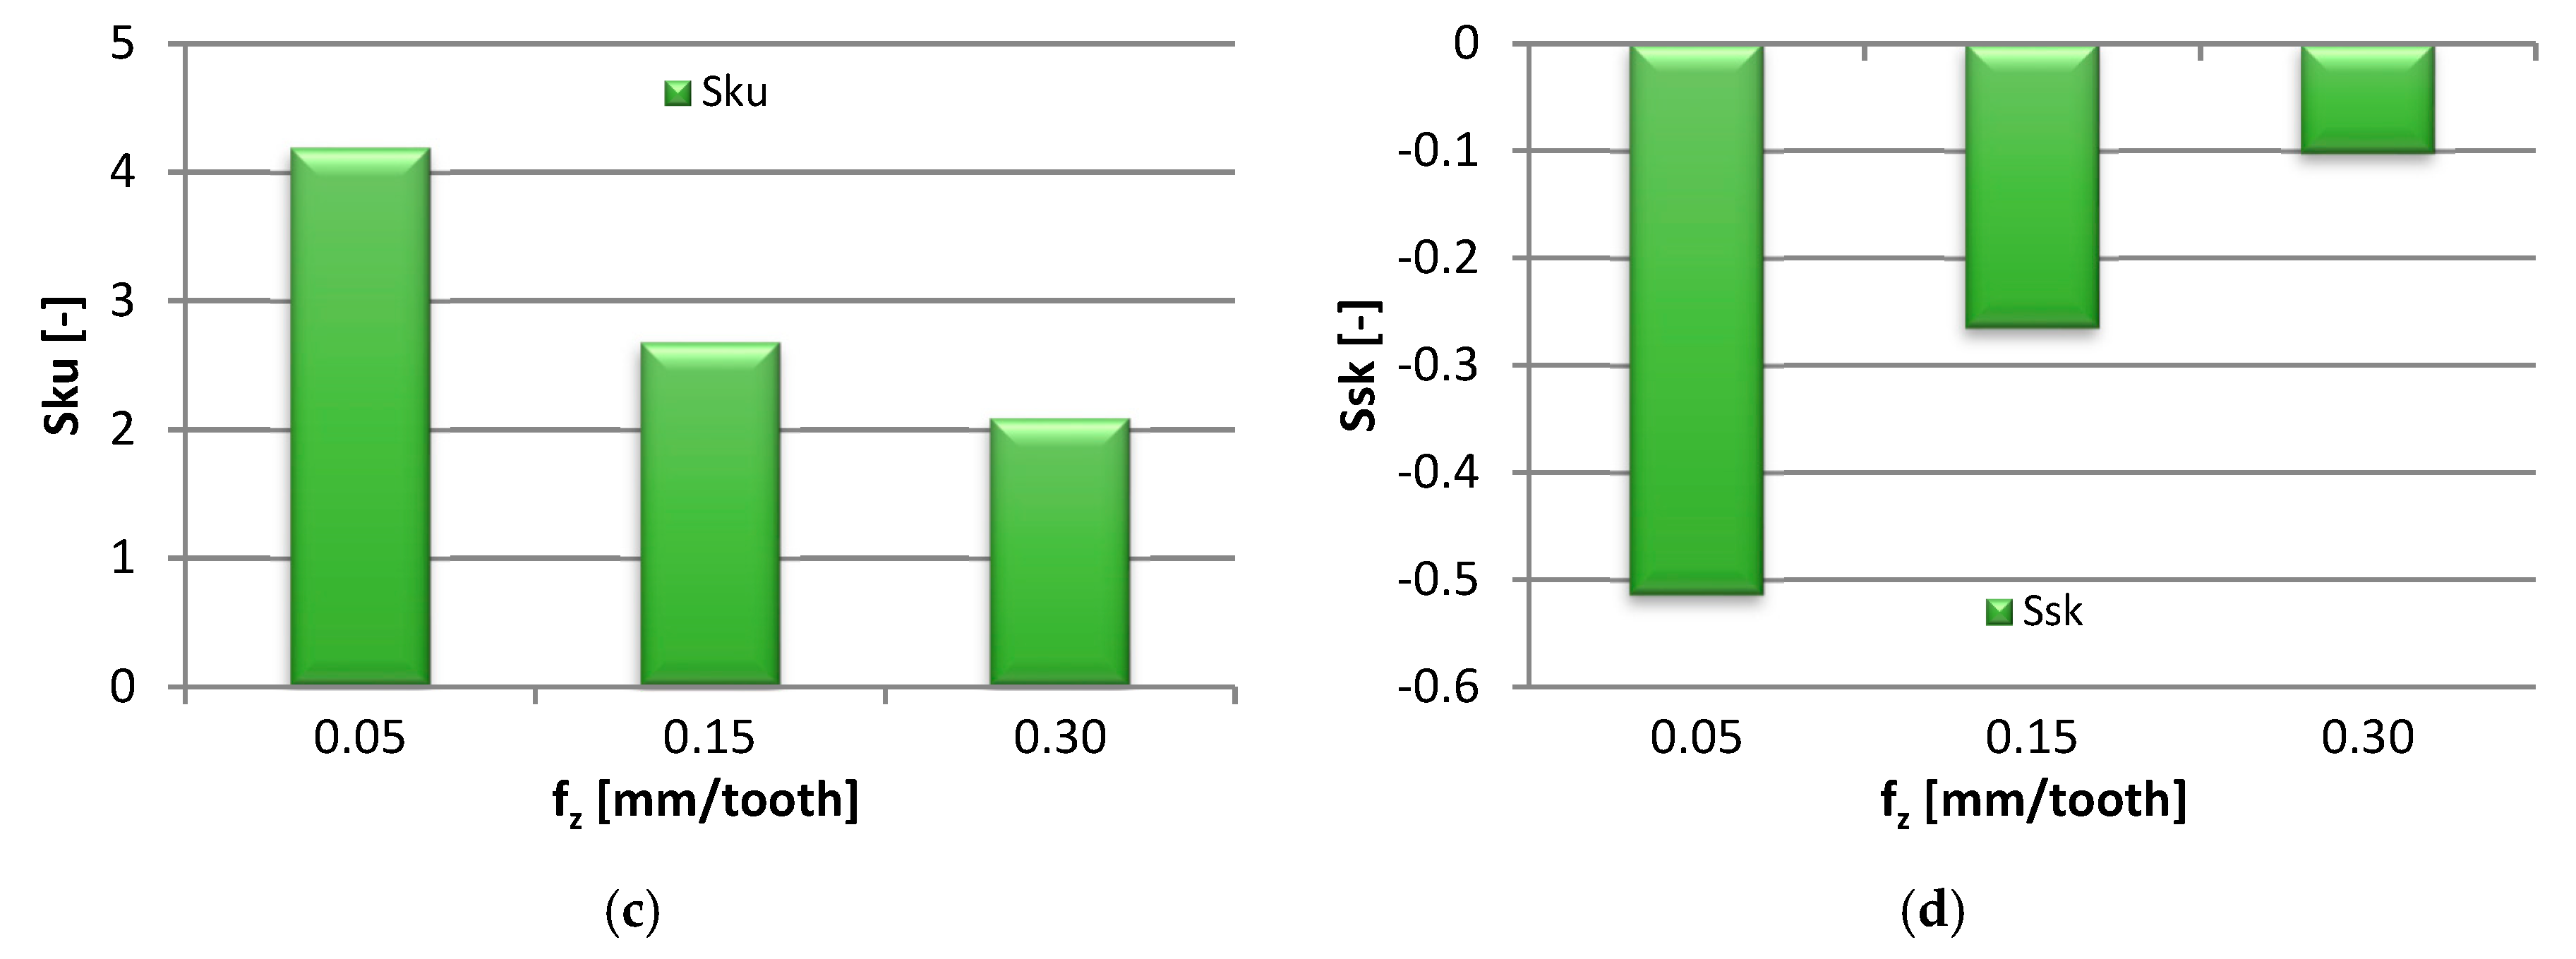
The bar charts in
Figure 7 represent the effect that the modification in the axial depth of cut (a
p = 0.5–6 mm) had on the end-face 3D area roughness characteristics of the specimen surface.
As shown above, the Sv, Sp, and St all responded positively to the increase in ap to 3.0 mm and decreased with the further increase in the cutting depth. The change in Sv was in the range 2.08–4.44 µm, Sp—1.66–2.87 µm, and St—4.78–7.31 µm. With progressing ap, Sa was reported to increase linearly from 0.32 to 0.51 µm. The kurtosis parameter, Sku, gradually decreased from 4.08 to 2.68, i.e. the changes in the machining parameters resulted in the rounding of the sharp surface peaks. A decrease in the value of Ssk below 0, increasing slightly at higher ap, indicated that the surface acquired the flat-topped distribution of heights.
Table 2 contains surface topography maps of the end face of the specimen and Abbott–Firestone curves determined during milling at extreme cutting speeds, v
c = 400 m/min and v
c = 1200 m/min.
From the data presented in
Table 2, it can be seen that with the progressing cutting speed, the number of heights increased while the peaks became rounded, which can be inferred from the drop in kurtosis below 3. This observation is further confirmed by the shape of the Abbot–Firestone curve, which shifted from the s-shaped degressive to degressive-progressive, and thus could be indicative of the improvement in the wear resistance of the surface. The increase in the v
c parameter of milling was, furthermore, found to increase the valley depth, which is typical of flat-topped surfaces, when the skewness is negative.
The end-face surface topography maps and the Abbott-Firestone curves in
Table 3 show the condition of the surface following milling with the lowest and the highest feed per tooth settings, f
z = 0.05 mm/tooth and f
z = 0.30 mm/tooth.
With the progressing feed per tooth, the sharp peaks become increasingly rounded, as the kurtosis is reduced below 3. In addition, the initially flat-topped distribution became more symmetrical. Irrespective of the change in the feed per tooth, the Abbott–Firestone curve remained degressive–progressive.
Presented in
Table 4 are the surface topography maps and the bearing area curves corresponding to the milling with the lowest (a
p = 0.5 mm) and the highest axial depth of cut (a
p = 6 mm).
As a result of the increase in ap, the sharp height peaks became rounded, as confirmed by the kurtosis value lower than 3. As the skewness values approached 0, the height distribution changed from the flat topped to a more symmetrical one. The Abbott–Firestone curve levelled off slightly, however, it retained a degressive–progressive shape.
3.3. Statistical Analysis
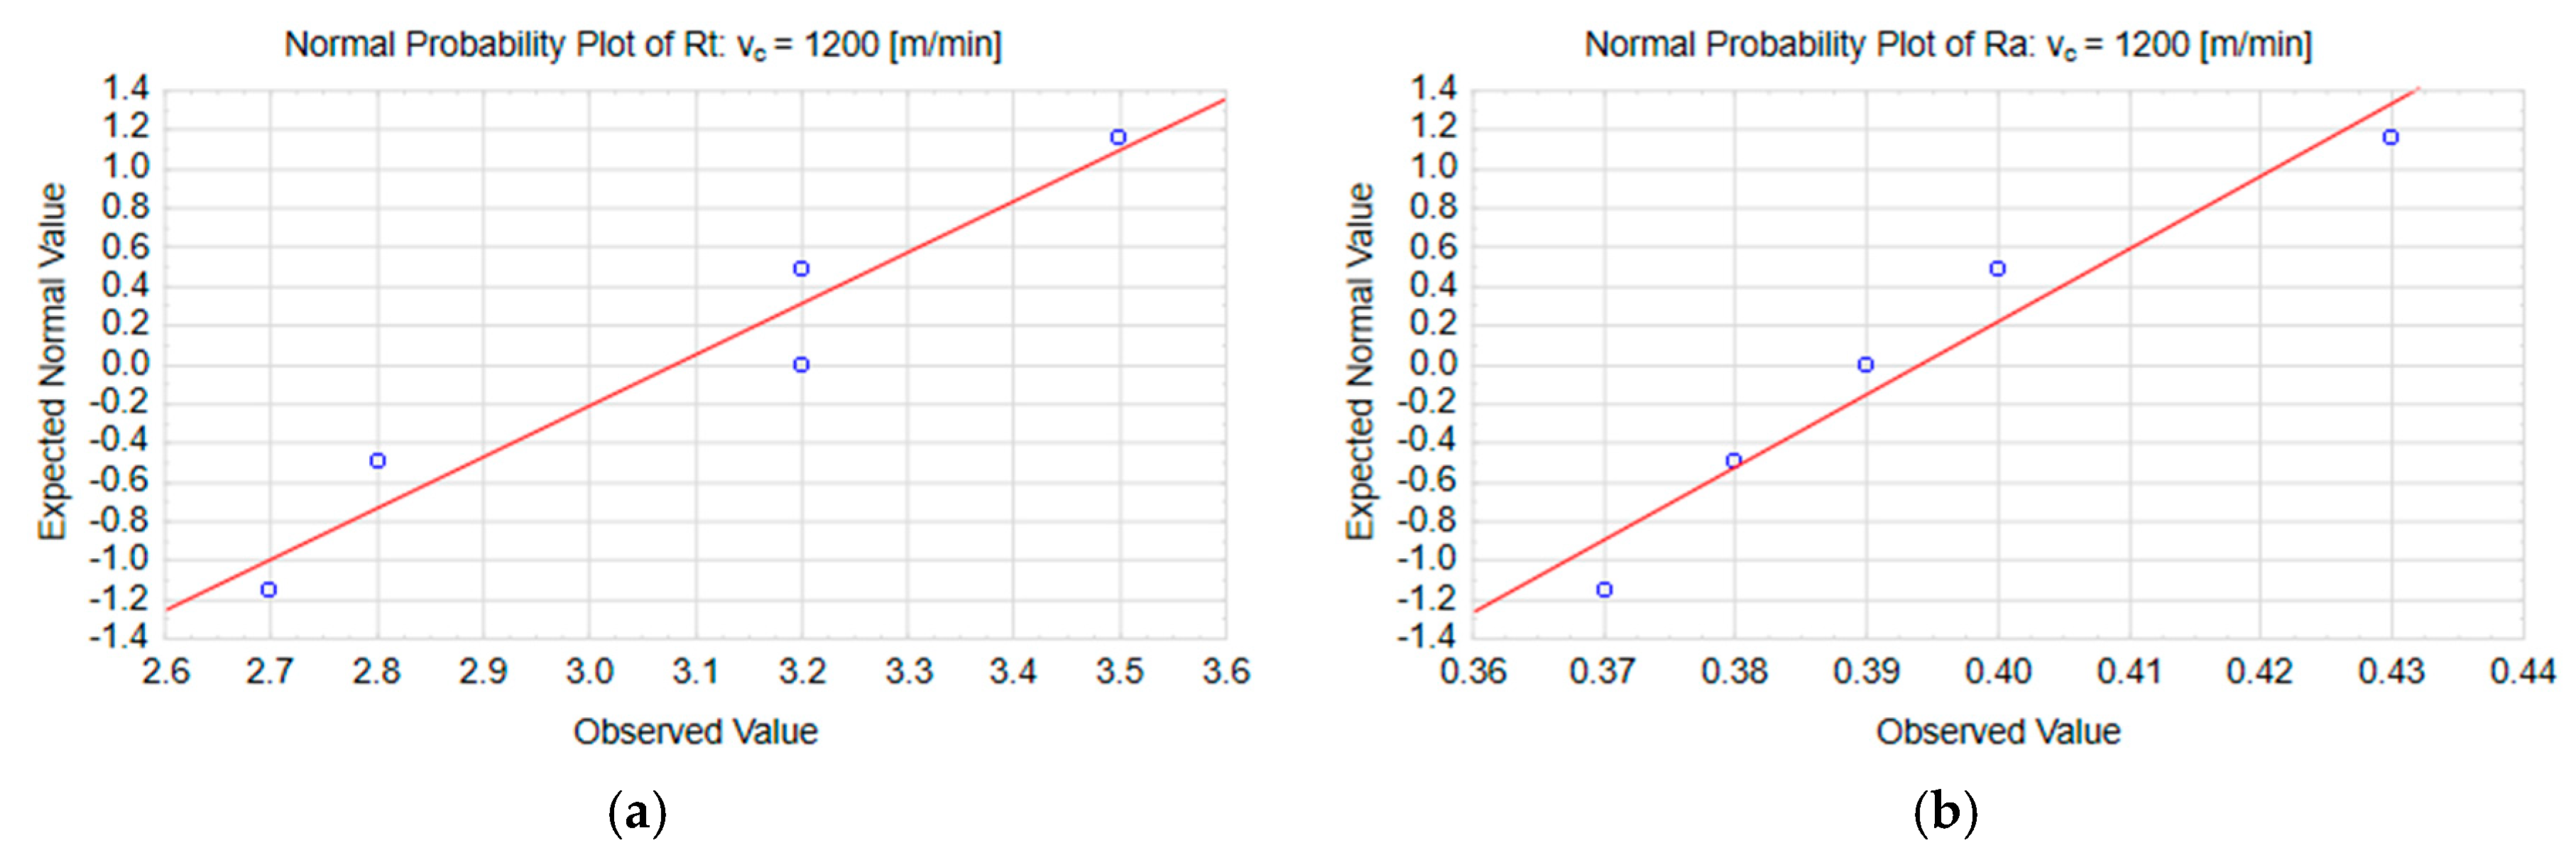
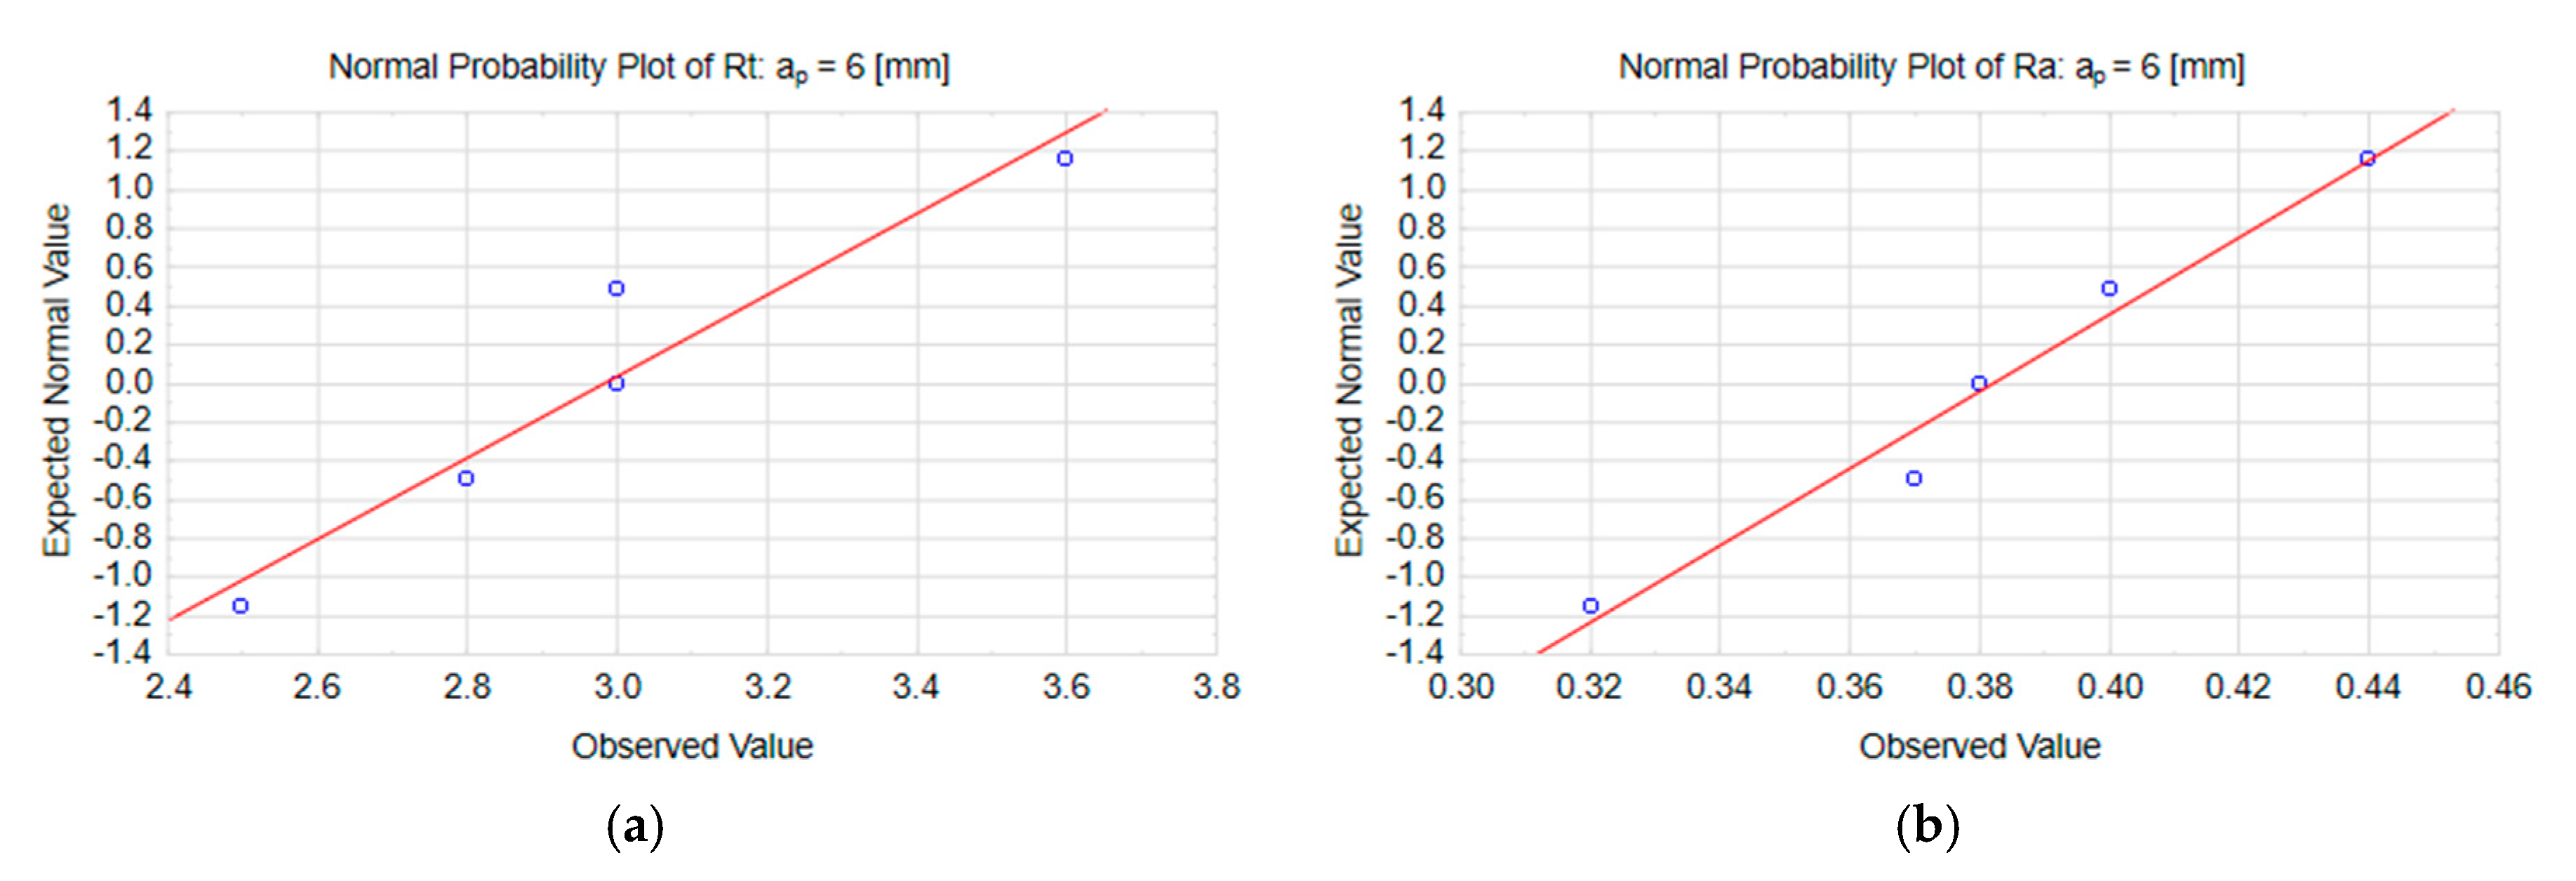
The normal probability plots in
Figure 8 show a typical distribution of Rt and Ra on the end face of the workpiece surface machined with the highest cutting speed, v
c = 1200 m/min.
The results from the Shapiro–Wilk test of normality are shown in
Table 5. The test concerned the distribution of the end-face 2D surface roughness parameters of the specimens subjected to milling at the variable cutting speed v
c. The reported results were shown to have normal distribution in all considered cases.
Table 6 presents the results from the statistical analysis of the end-face 2D surface roughness parameters of the specimens subjected to milling with the variable cutting speed v
c. The lowest (v
c = 400 m/min) and the highest speeds (v
c = 1200 m/min) were considered.
From the analysis, it can be seen that the equality of variances hypothesis was confirmed in all parameters except for Rsk and RSm. The hypothesis assuming the equality of means at α = 0.05 was confirmed with no exceptions.
Figure 9 contains the box and whisker graphs accounting for the results from the tests of equality of means describing the end-face 2D surface roughness parameters of the specimens subjected to milling with varying cutting speeds.
Figure 10 shows the normal probability plots for the results of Rt and Ra measurements carried out on the end face of the specimens following milling with the maximal axial depth of cut a
p = 6 mm.
The results from the Shapiro–Wilk test of normality are shown in
Table 7. The tests concerned the values of the end-face 2D surface roughness parameters of the workpiece following milling with the variable axial depth of cut a
p. In all tested variants, the results had normal distribution.
The results from the statistical analysis of the end-face 2D surface roughness parameters of the specimens machined with various axial depths of cut a
p are given in
Table 8; the lowest (a
p = 0.5 mm) and the highest (a
p = 6 mm) axial depths of cut are compared.
Statistical analysis confirmed the equality of variance hypothesis for all the parameters except for Rv. The equality of means hypothesis at α = 0.05 was confirmed with no exceptions.
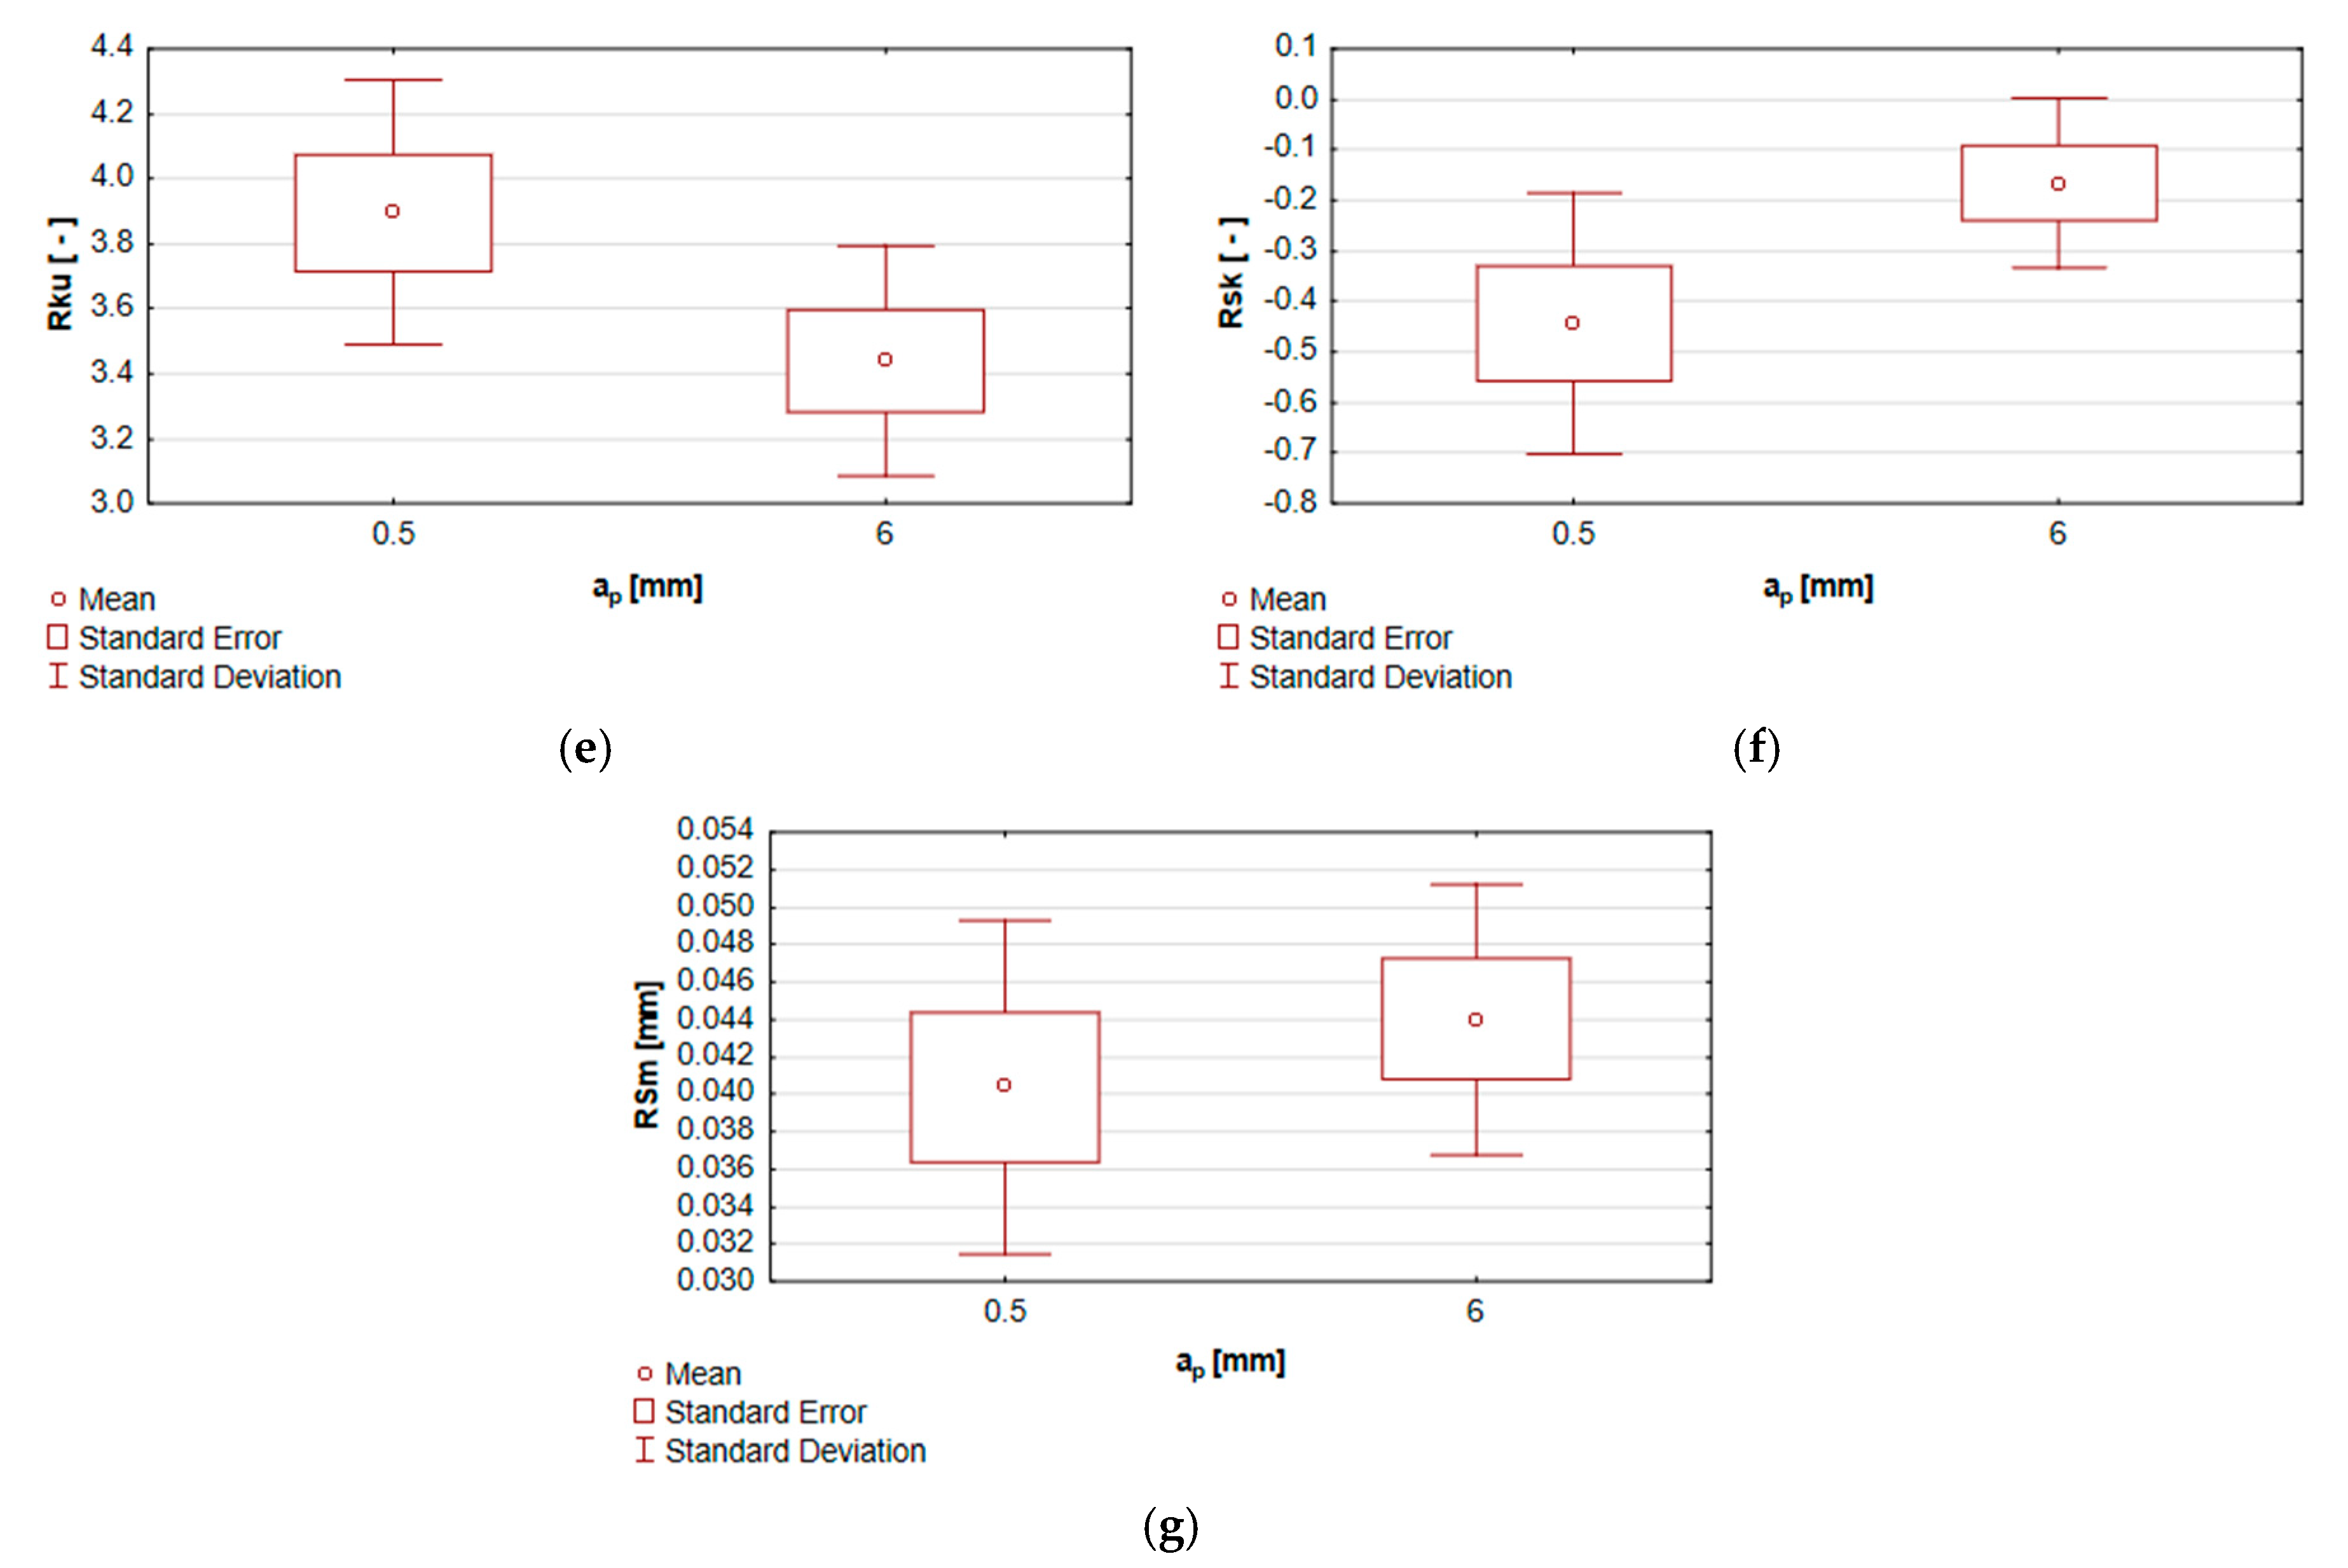
The results from the tests of equality of means describing the end-face 2D surface roughness of specimens subjected to milling with the variable axial depth of cut a
p are presented in
Figure 11, in the form of the box and whisker graphs.
The analyzed data clearly indicate that the changes in the cutting speed vc and the axial depth of cut ap have had no statistically significant impact on the condition of the workpiece surface, expressed by the end-face 2D roughness parameters.


