Crystallographic Evaluation of Susceptibility to Intergranular Corrosion in Austenitic Stainless Steel with Various Degrees of Sensitization


Abstract
:1. Introduction
2. Experimental
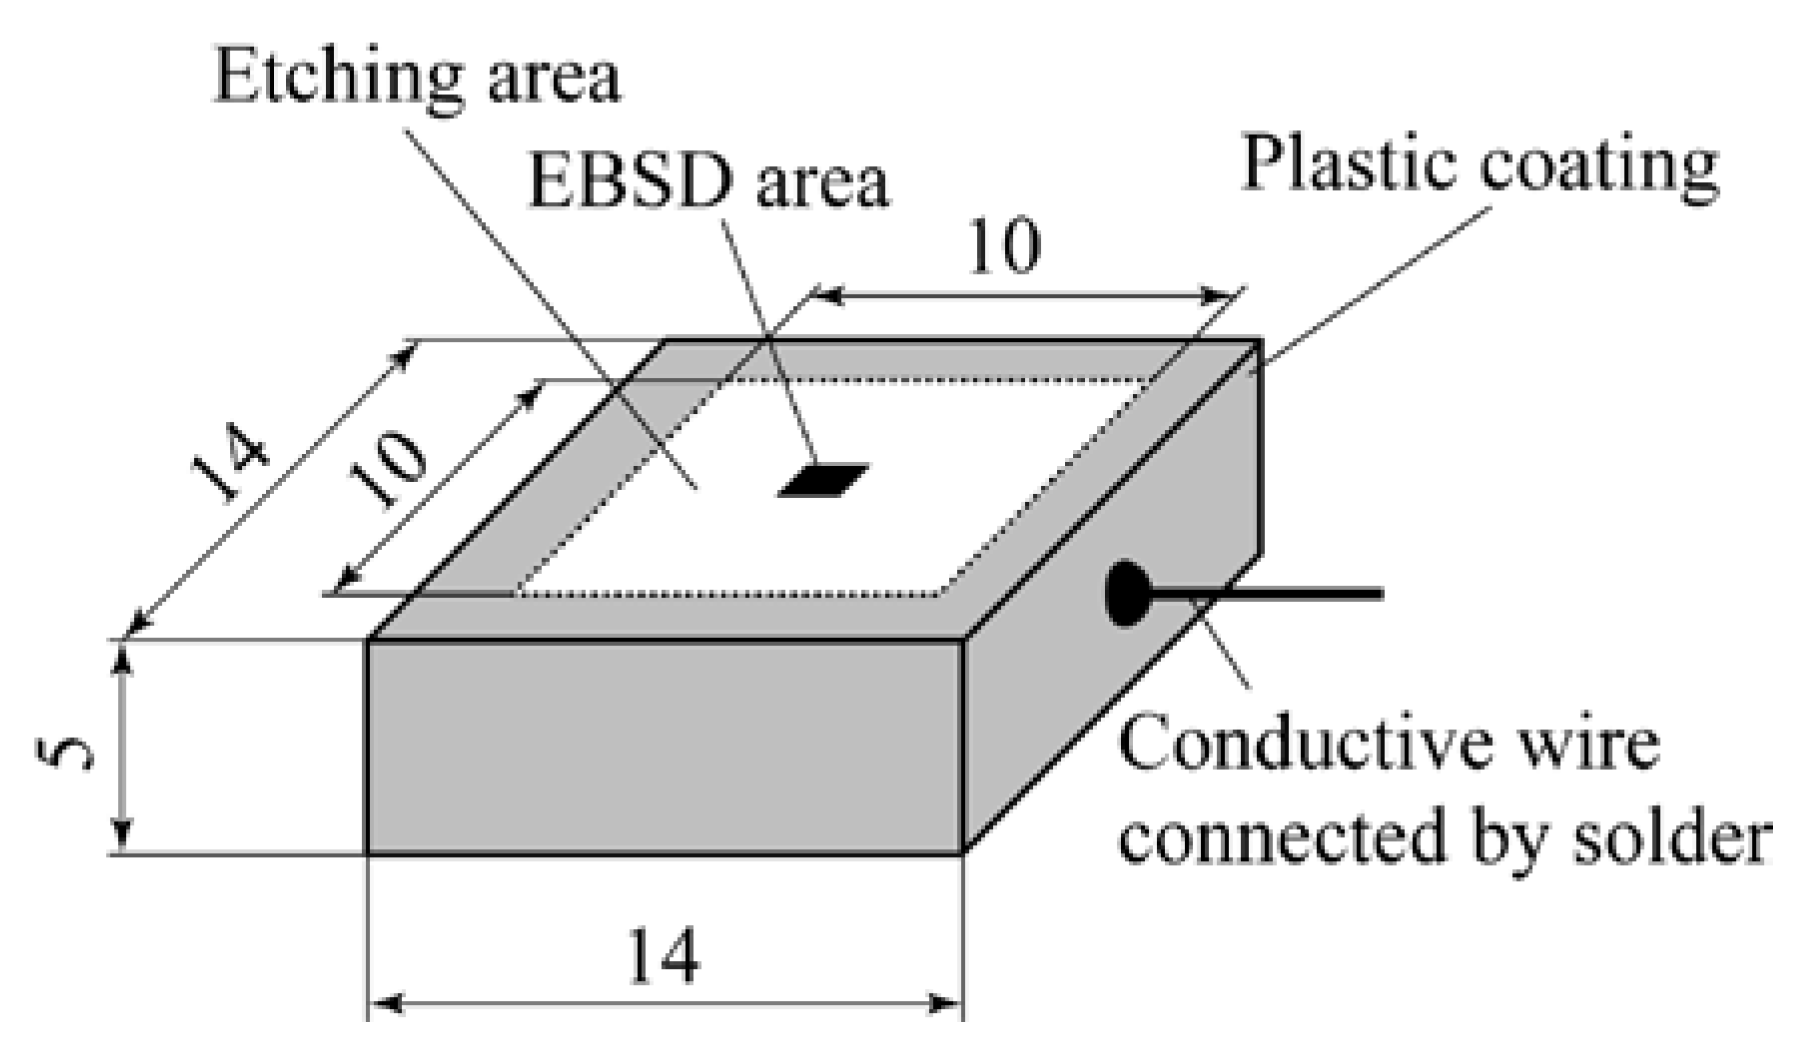
2.1. Material
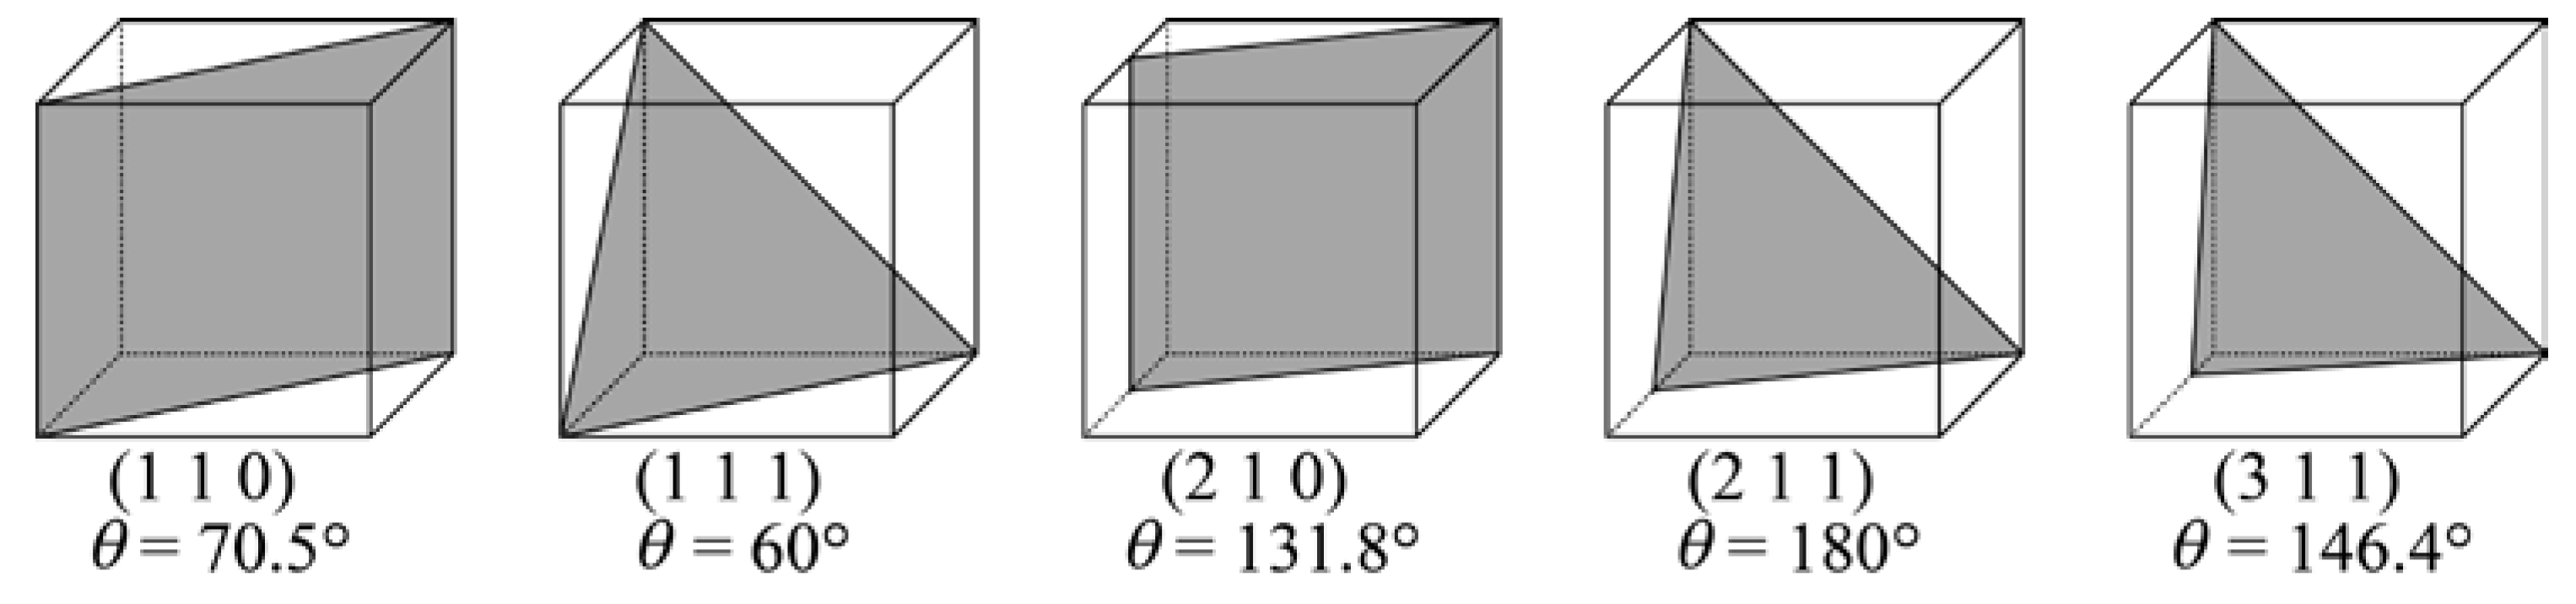
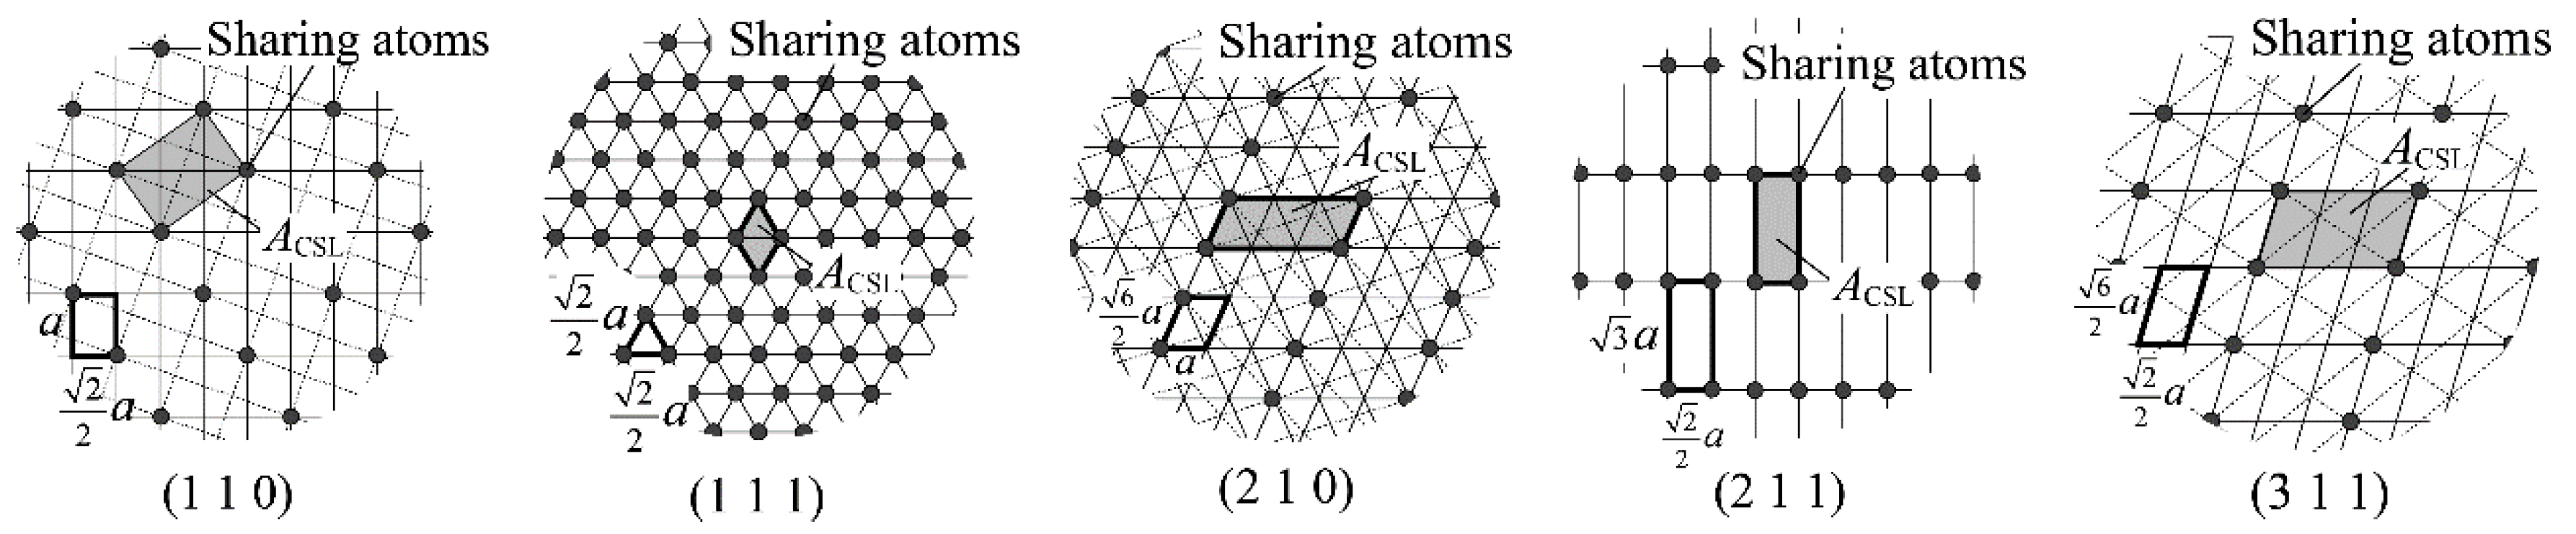
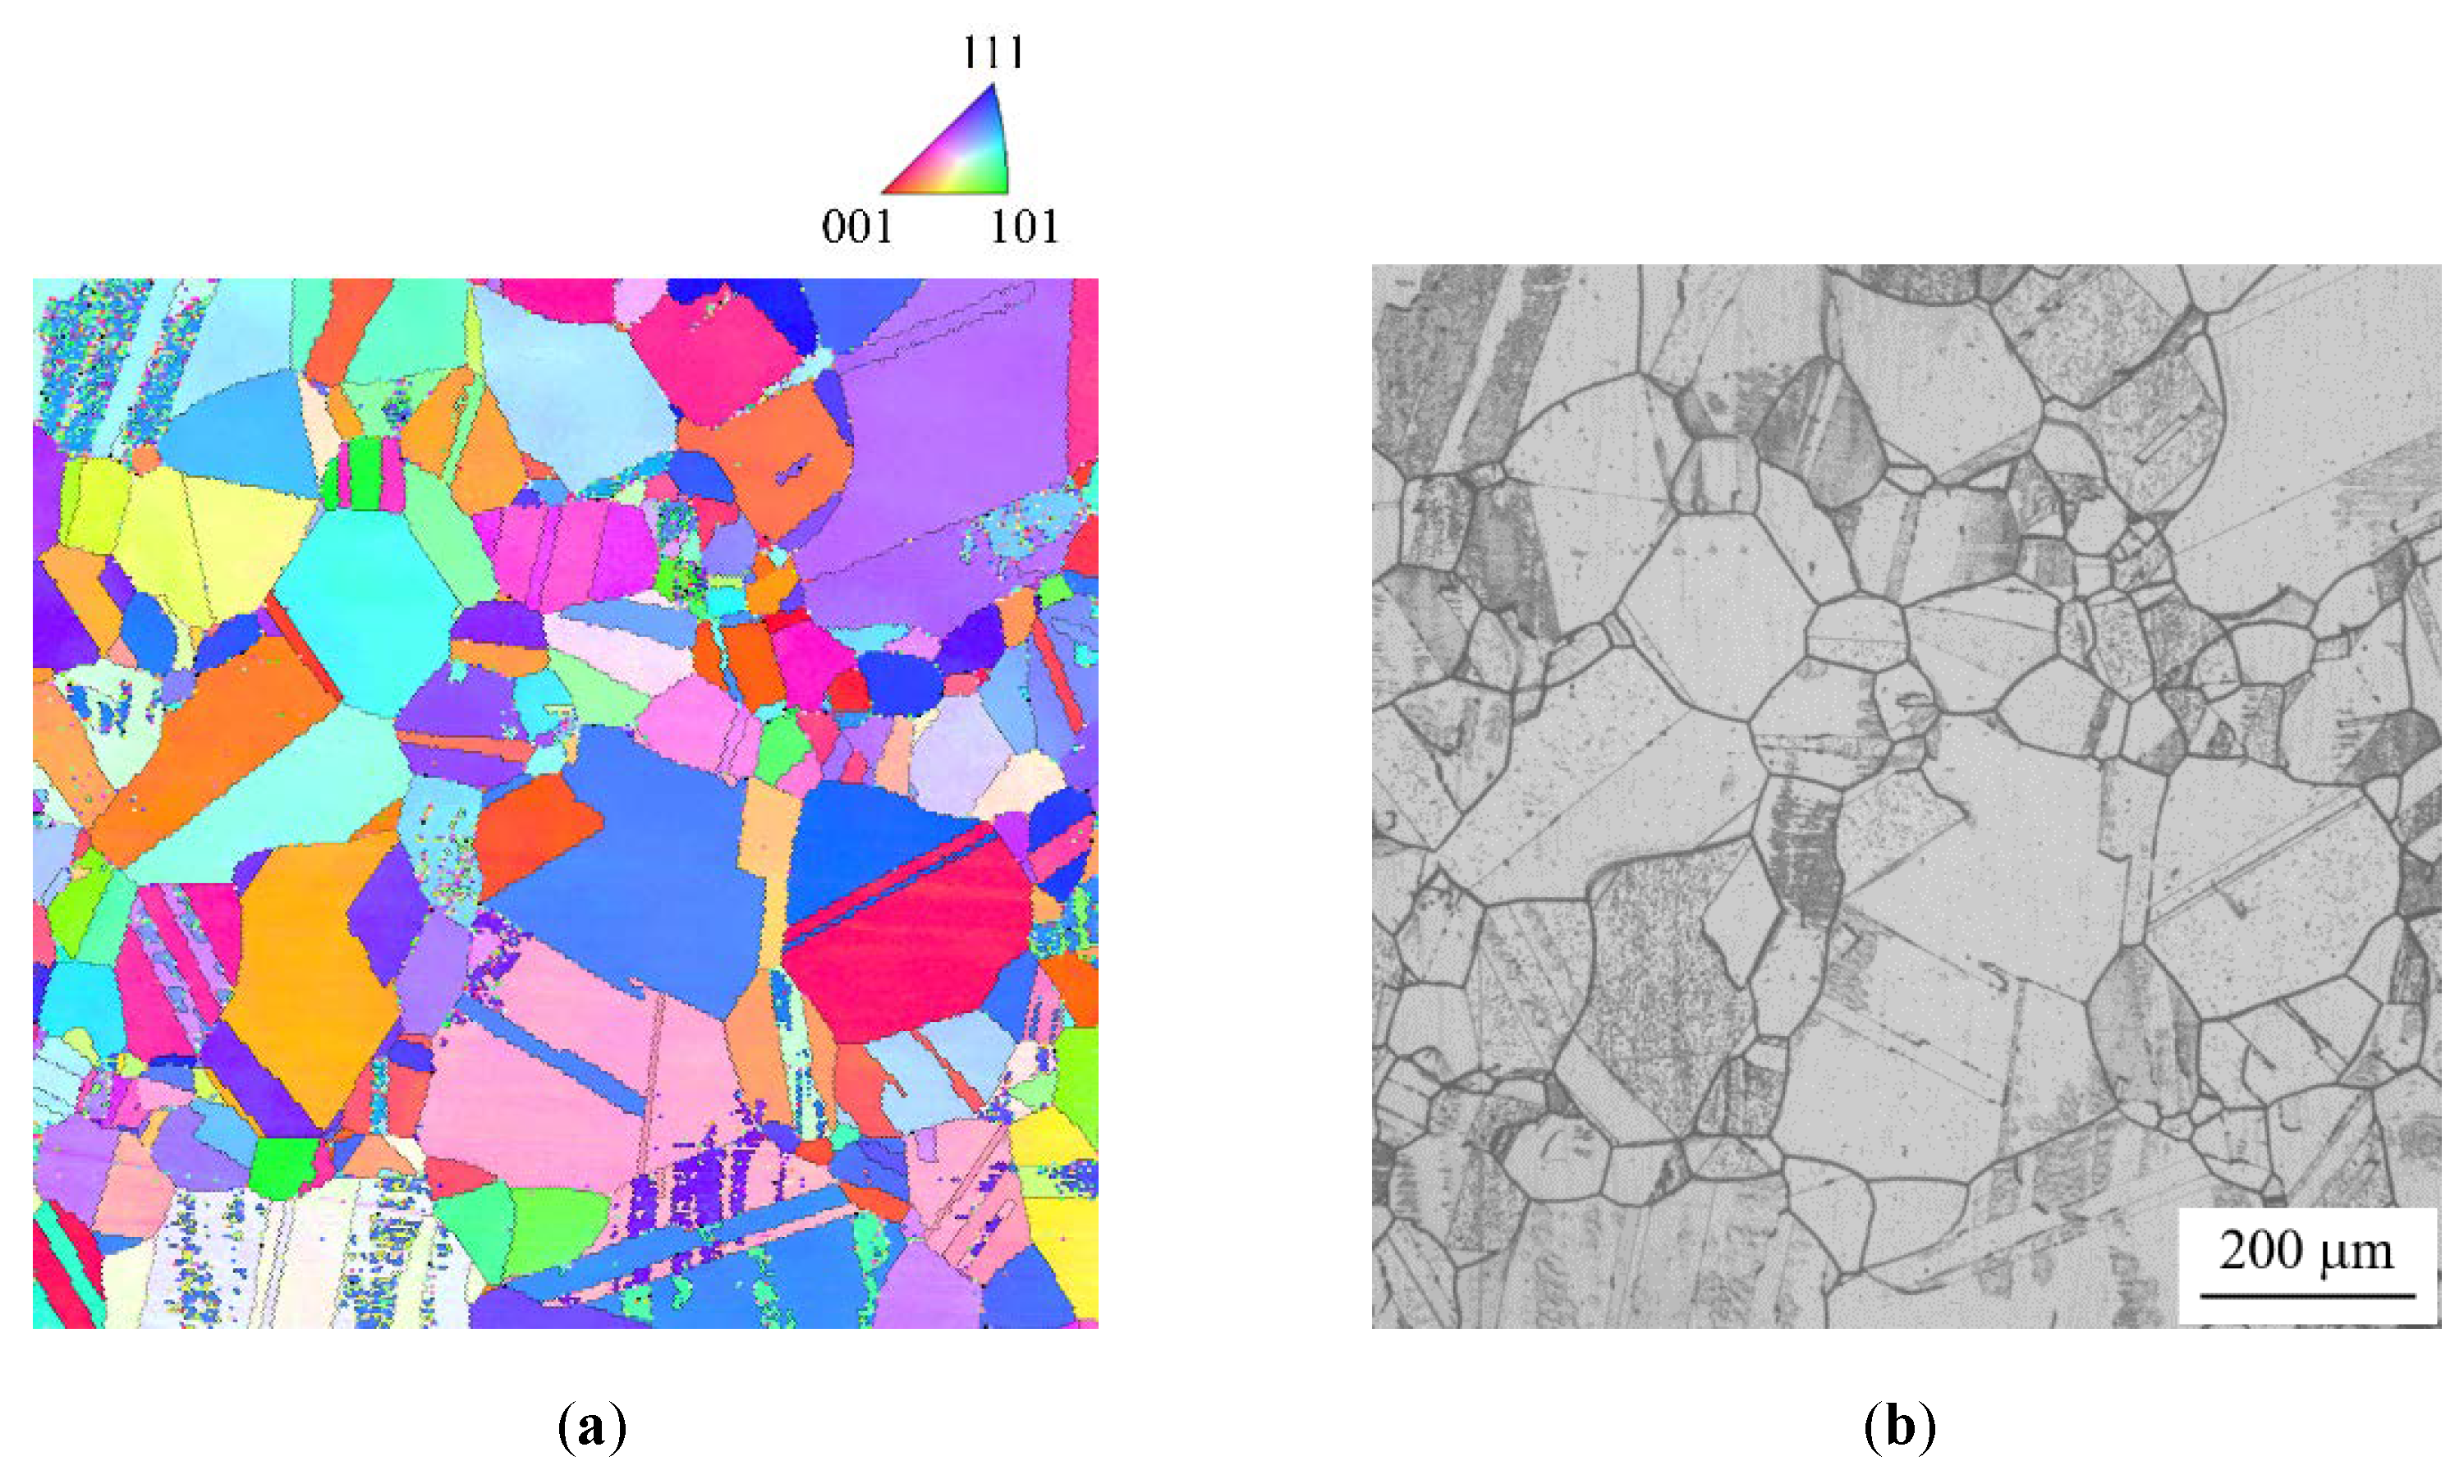
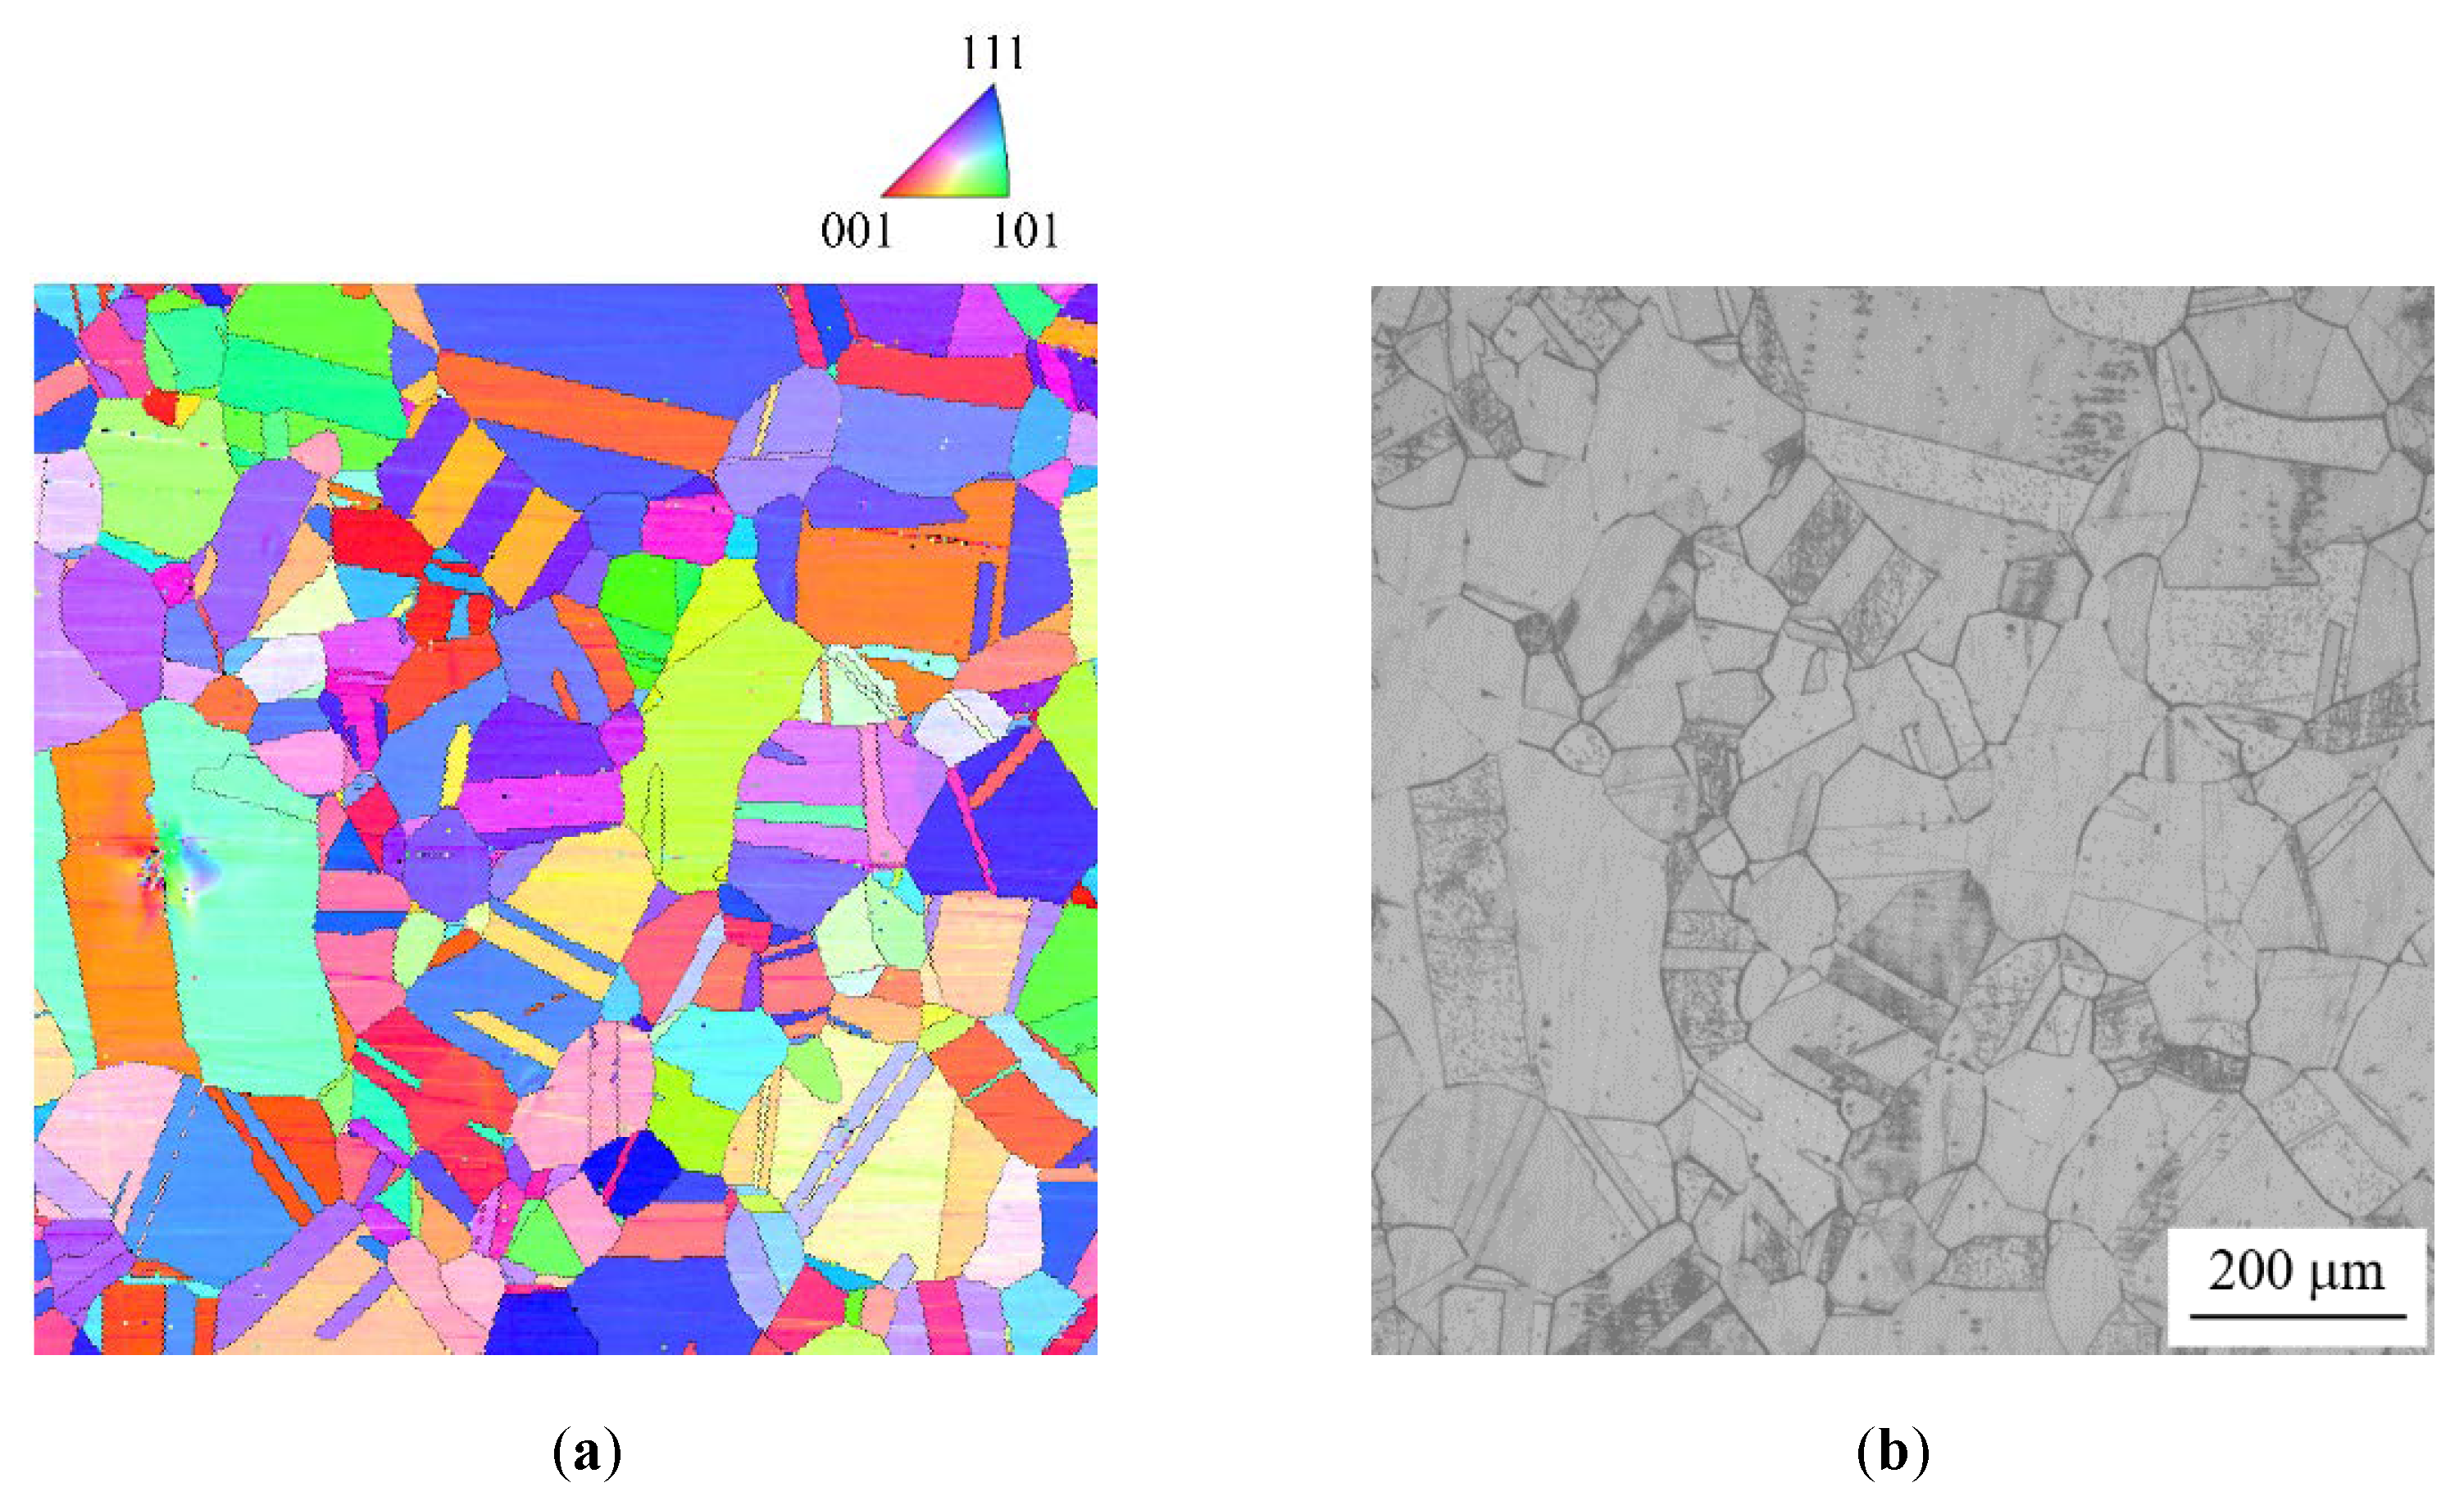
2.2. Crystallography
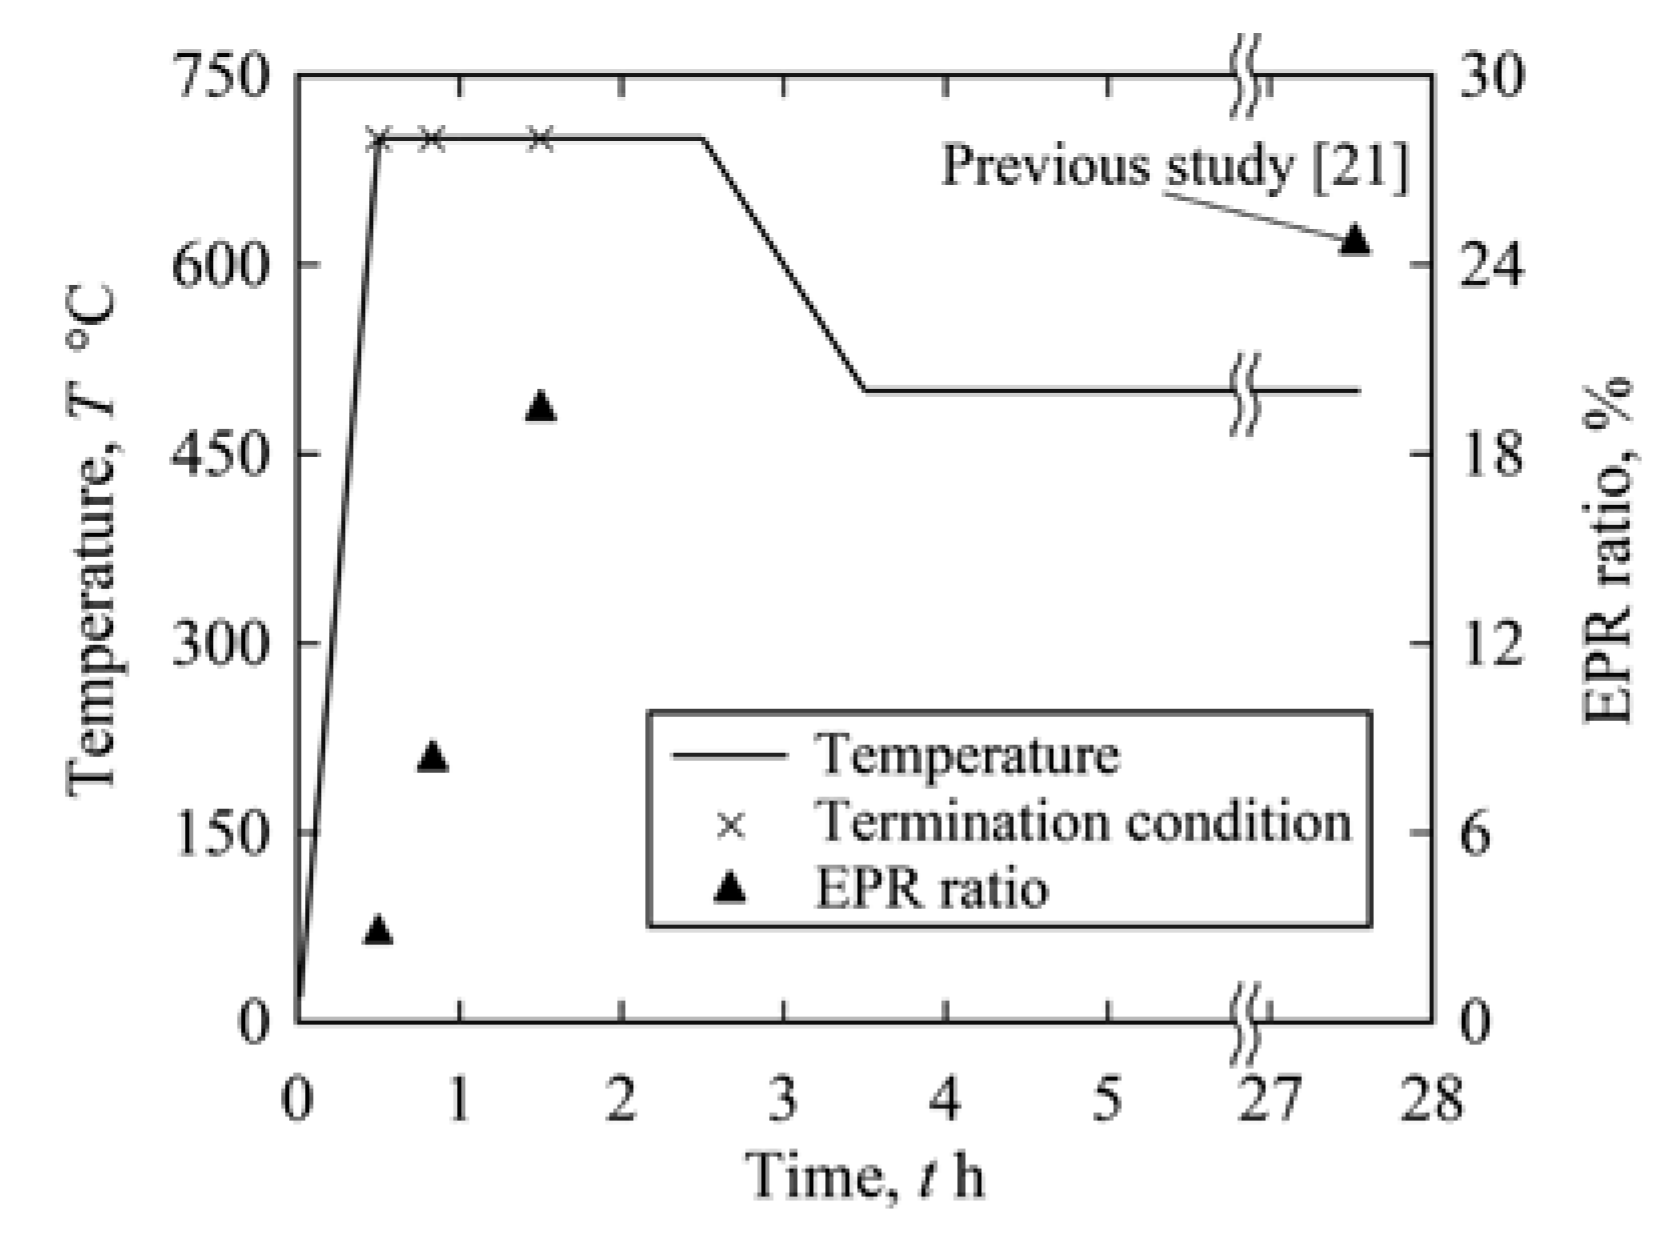
2.3. Electrochemical Method for Intergranular IGC Testing
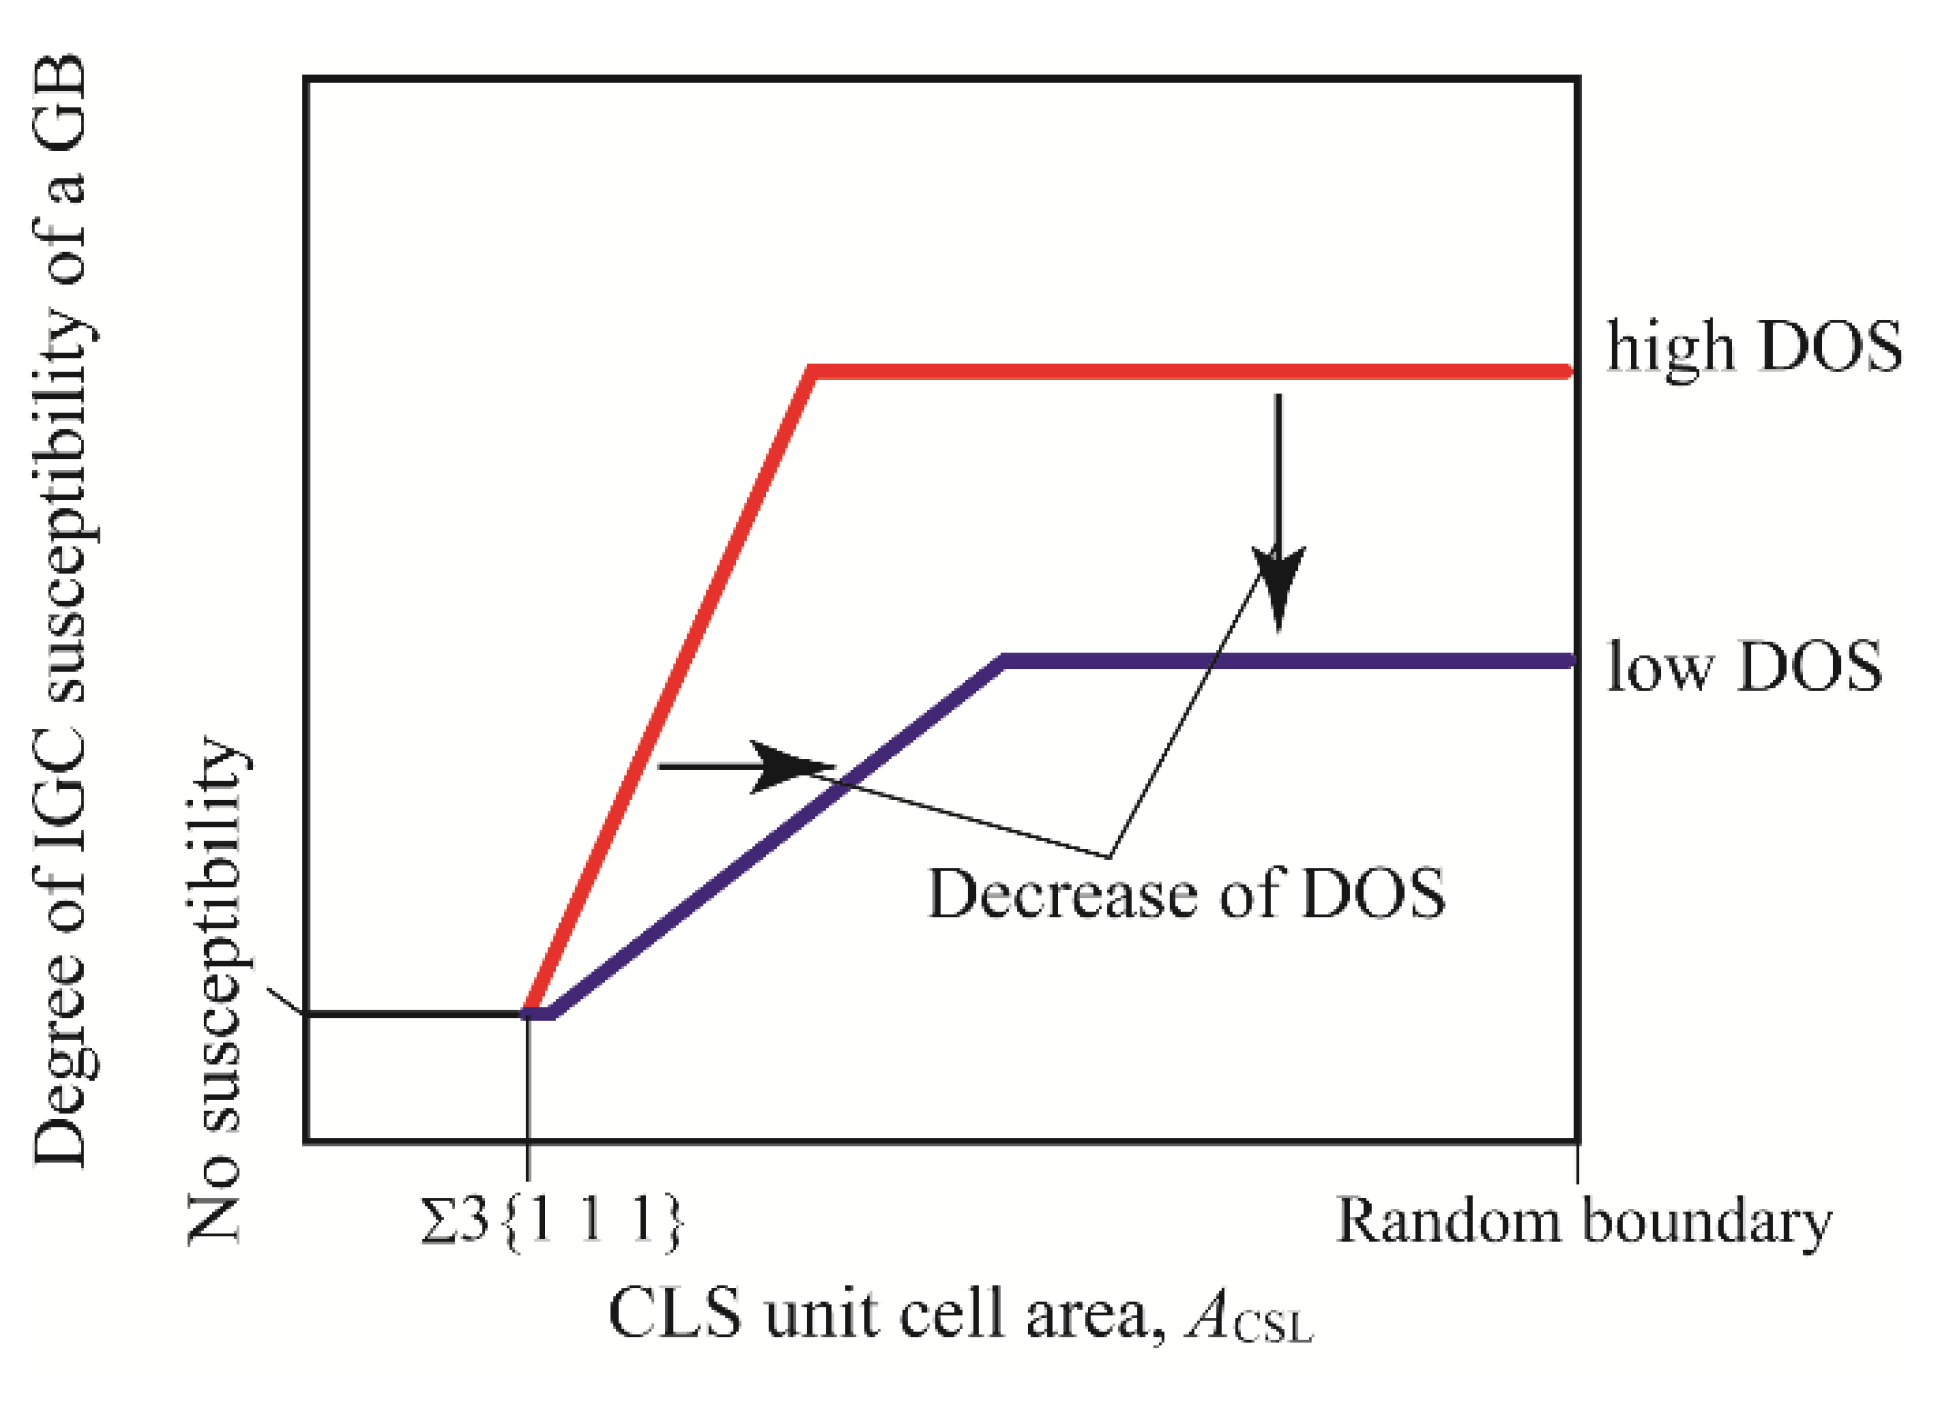
3. Results and Discussion
3.1. IGC Behavior
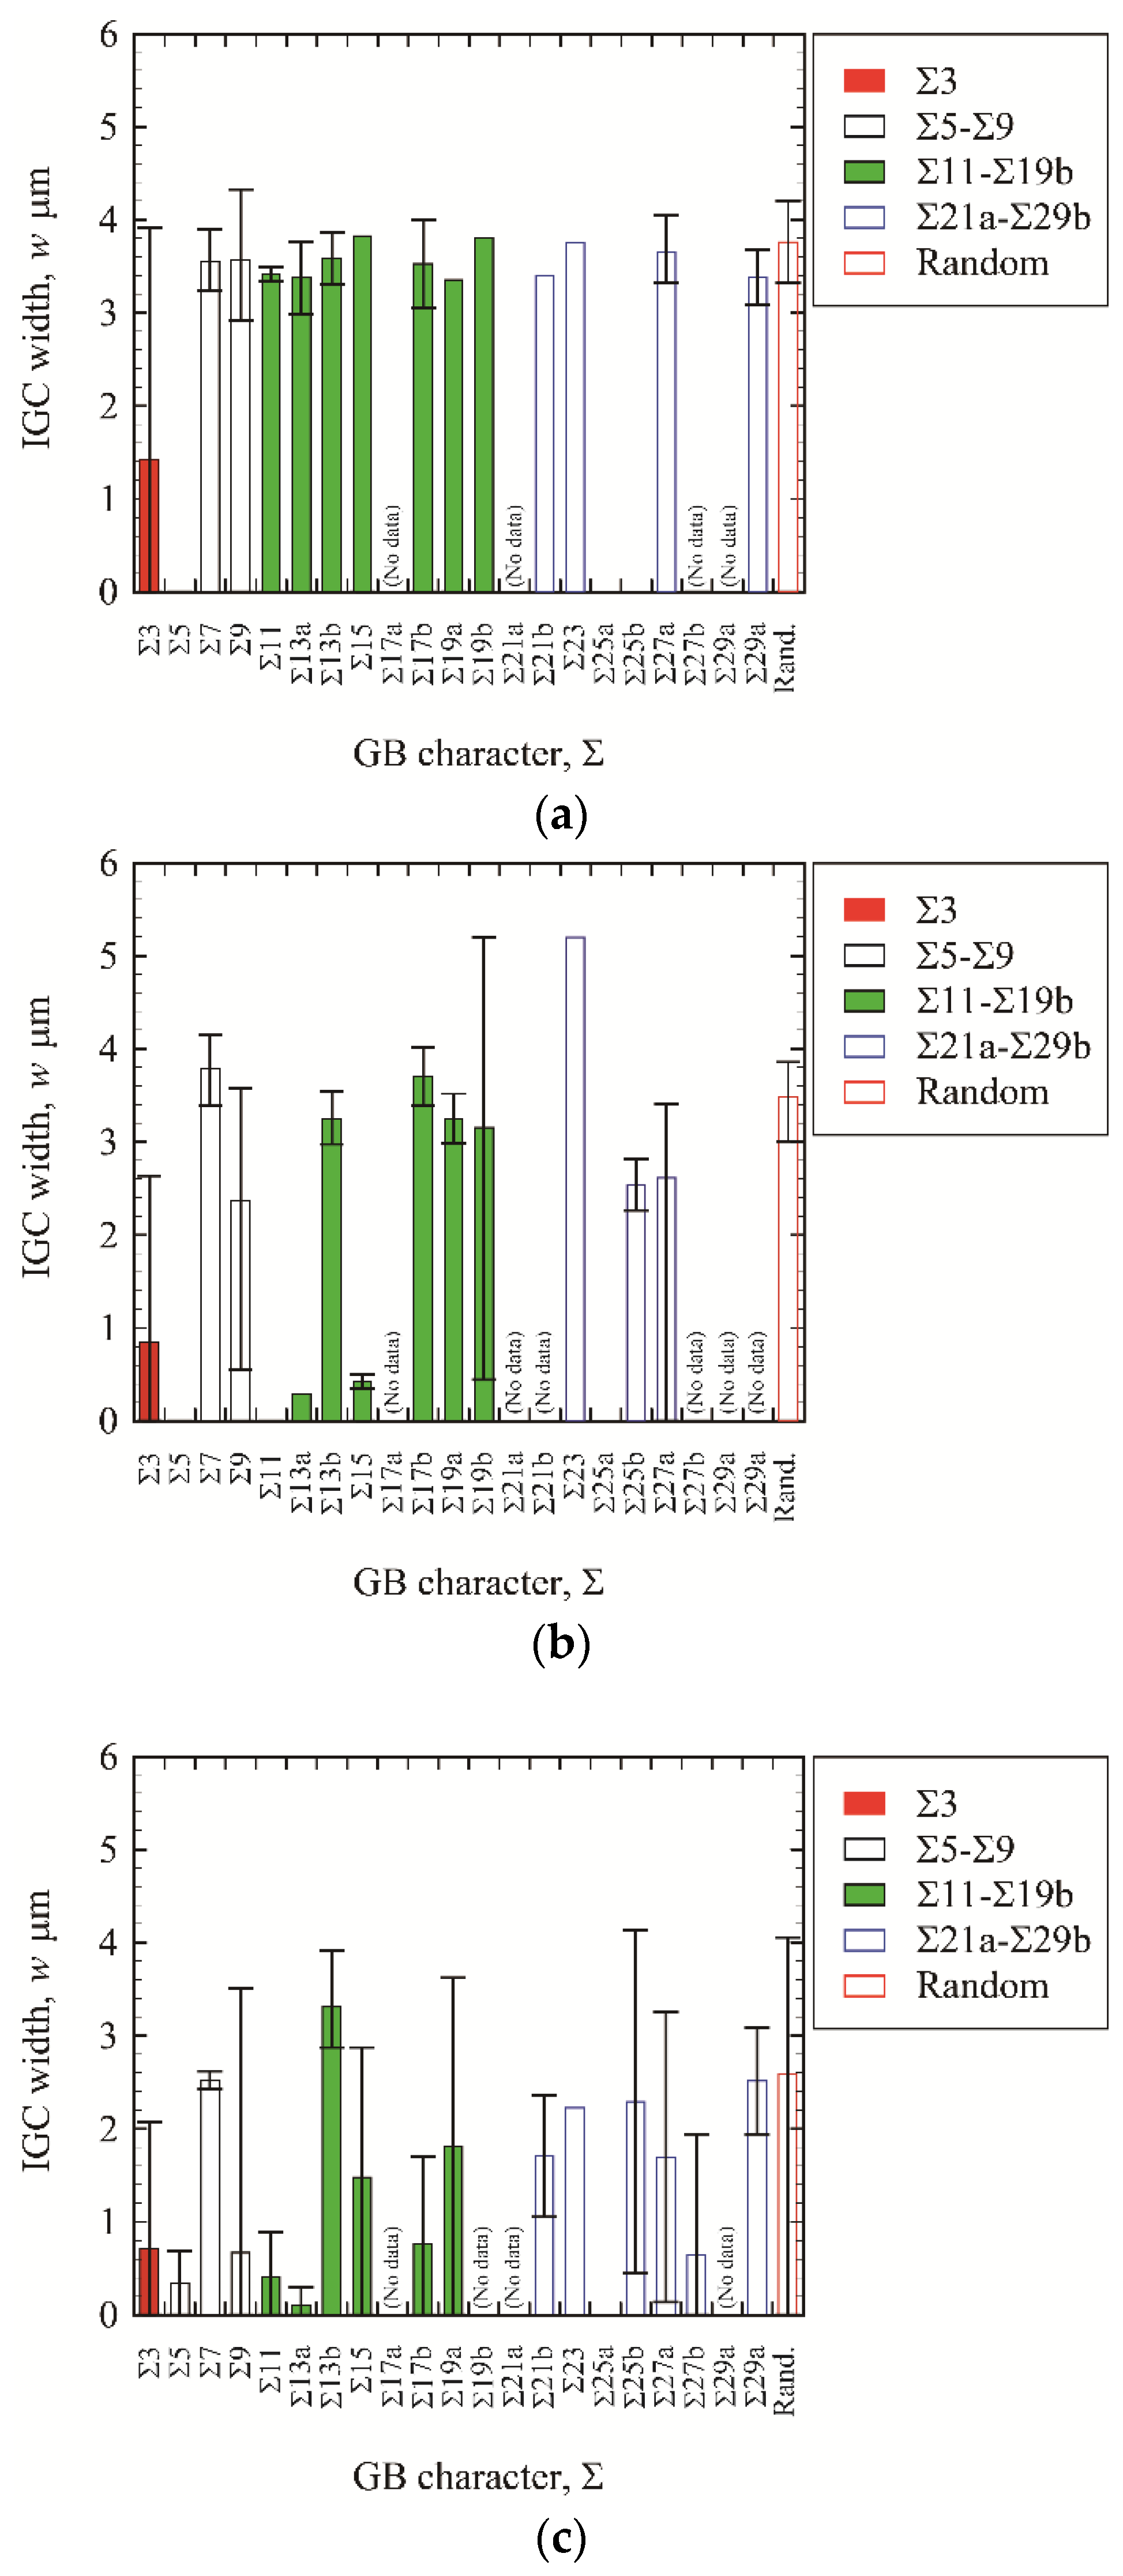
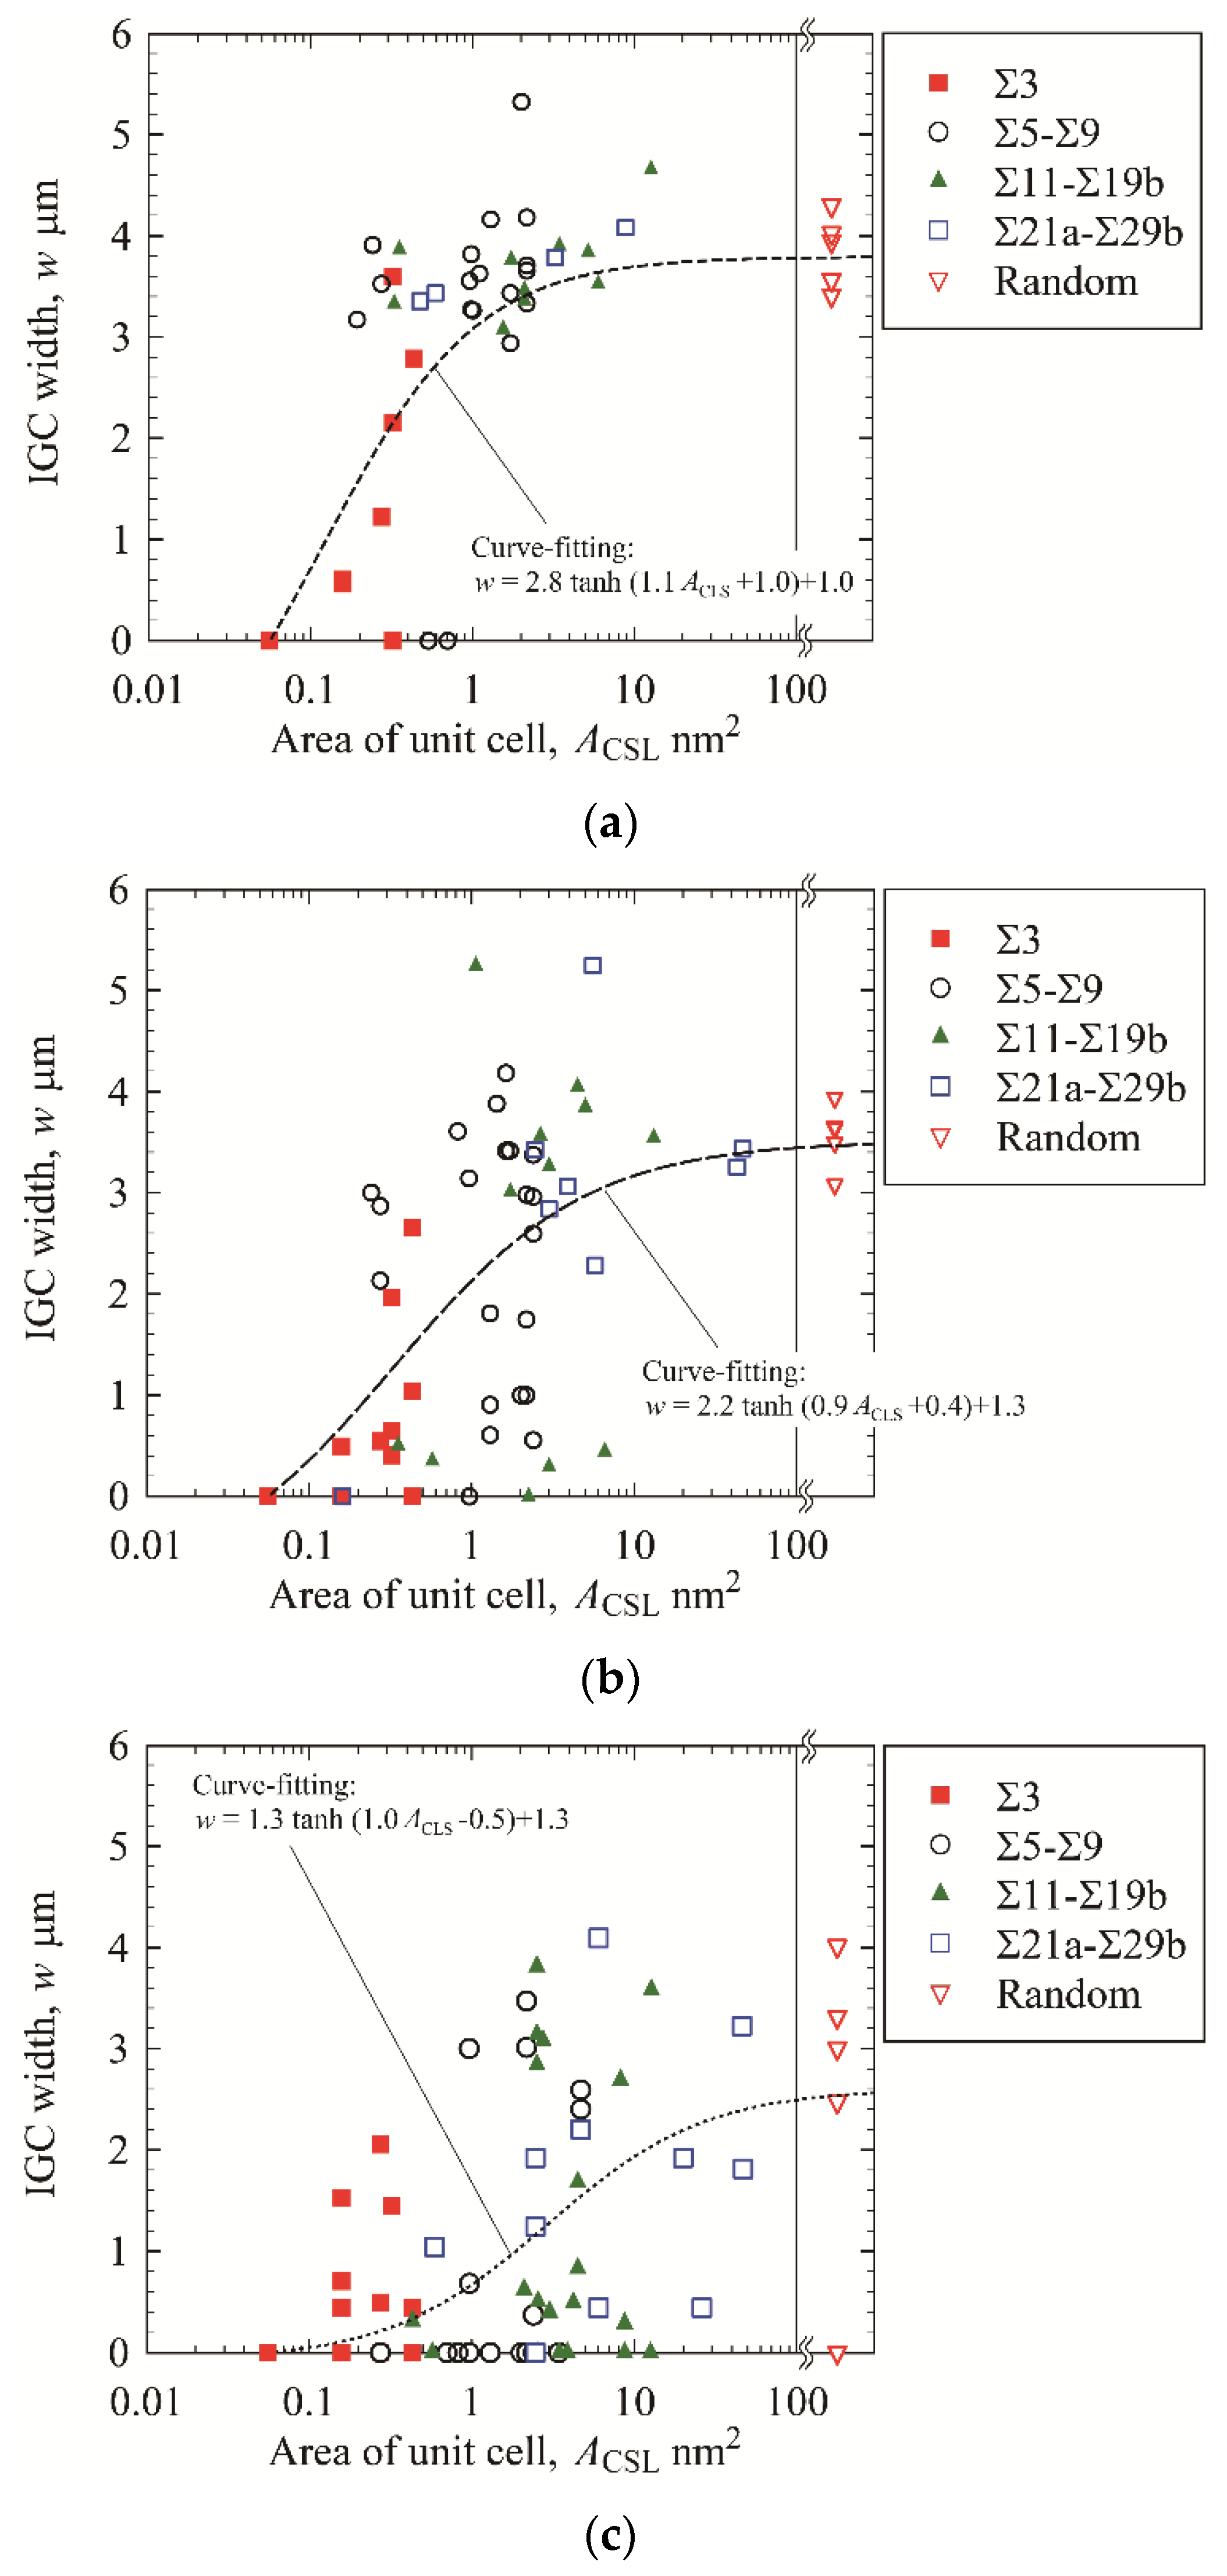
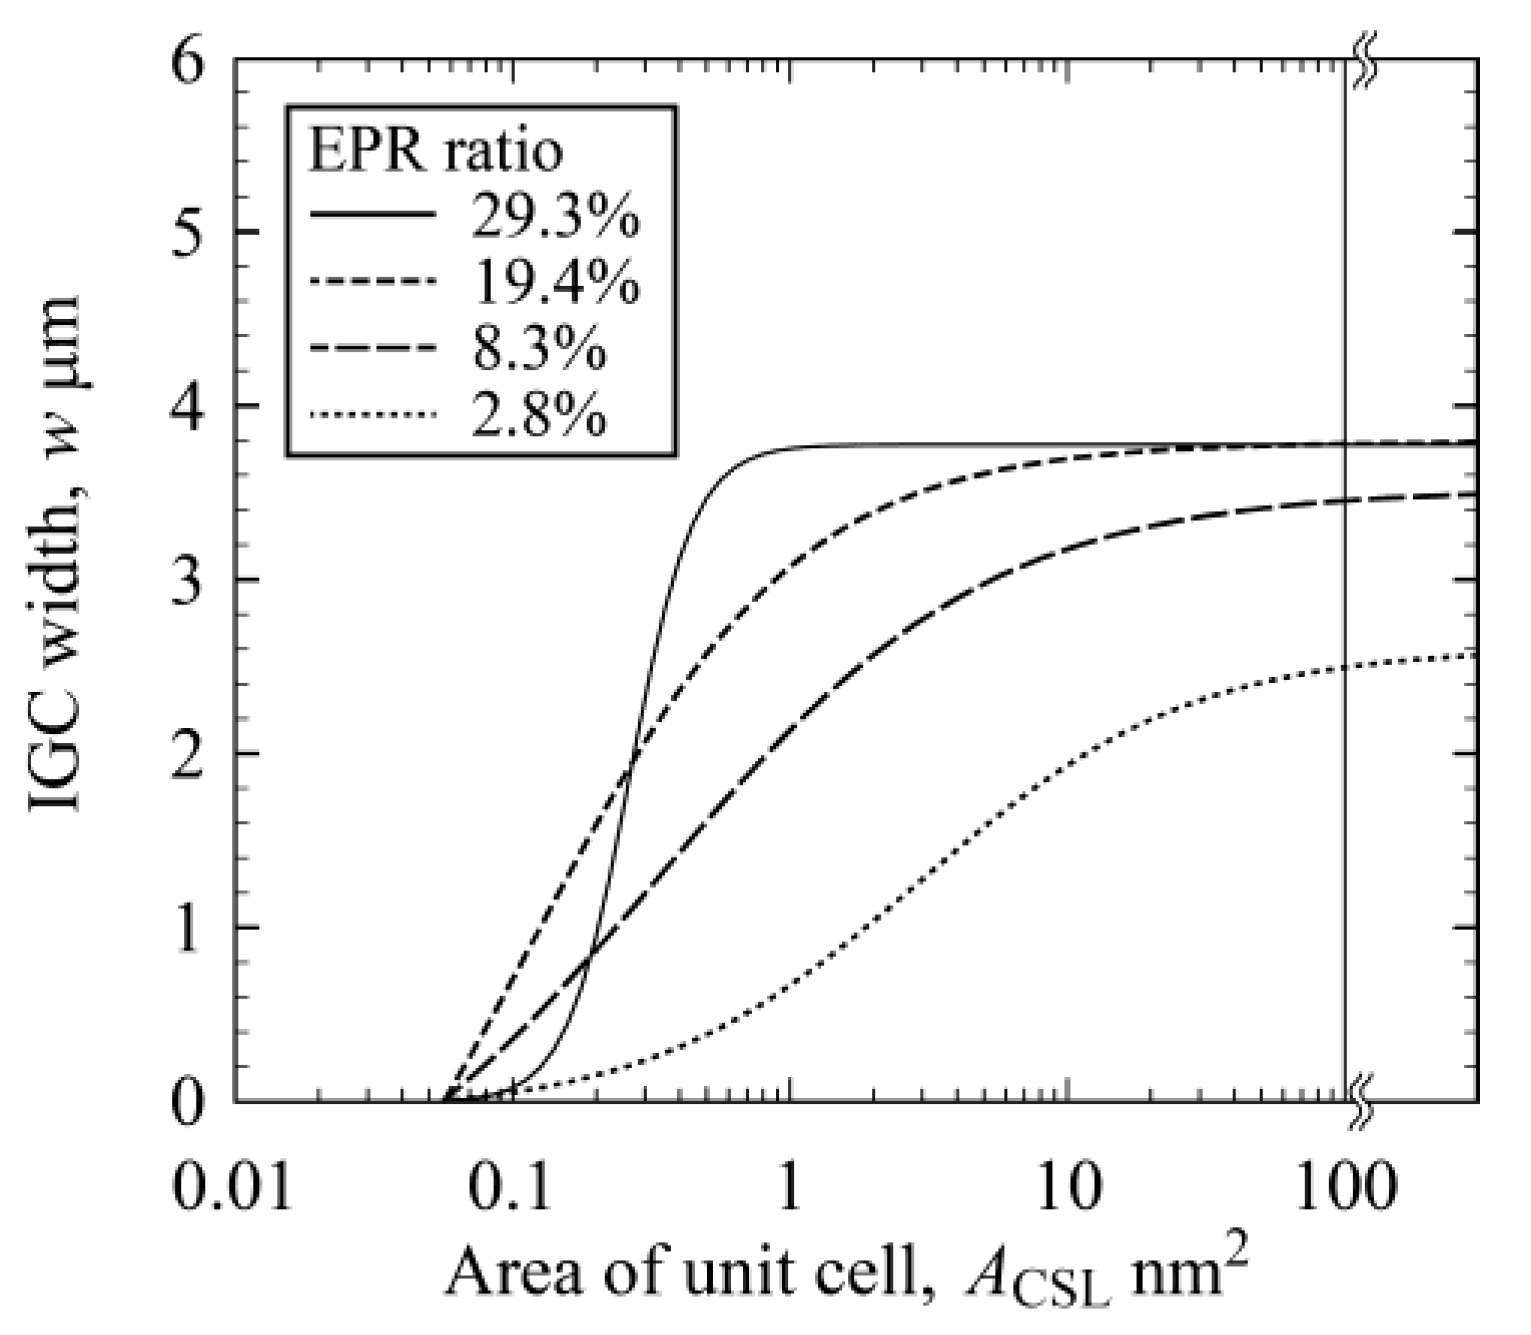
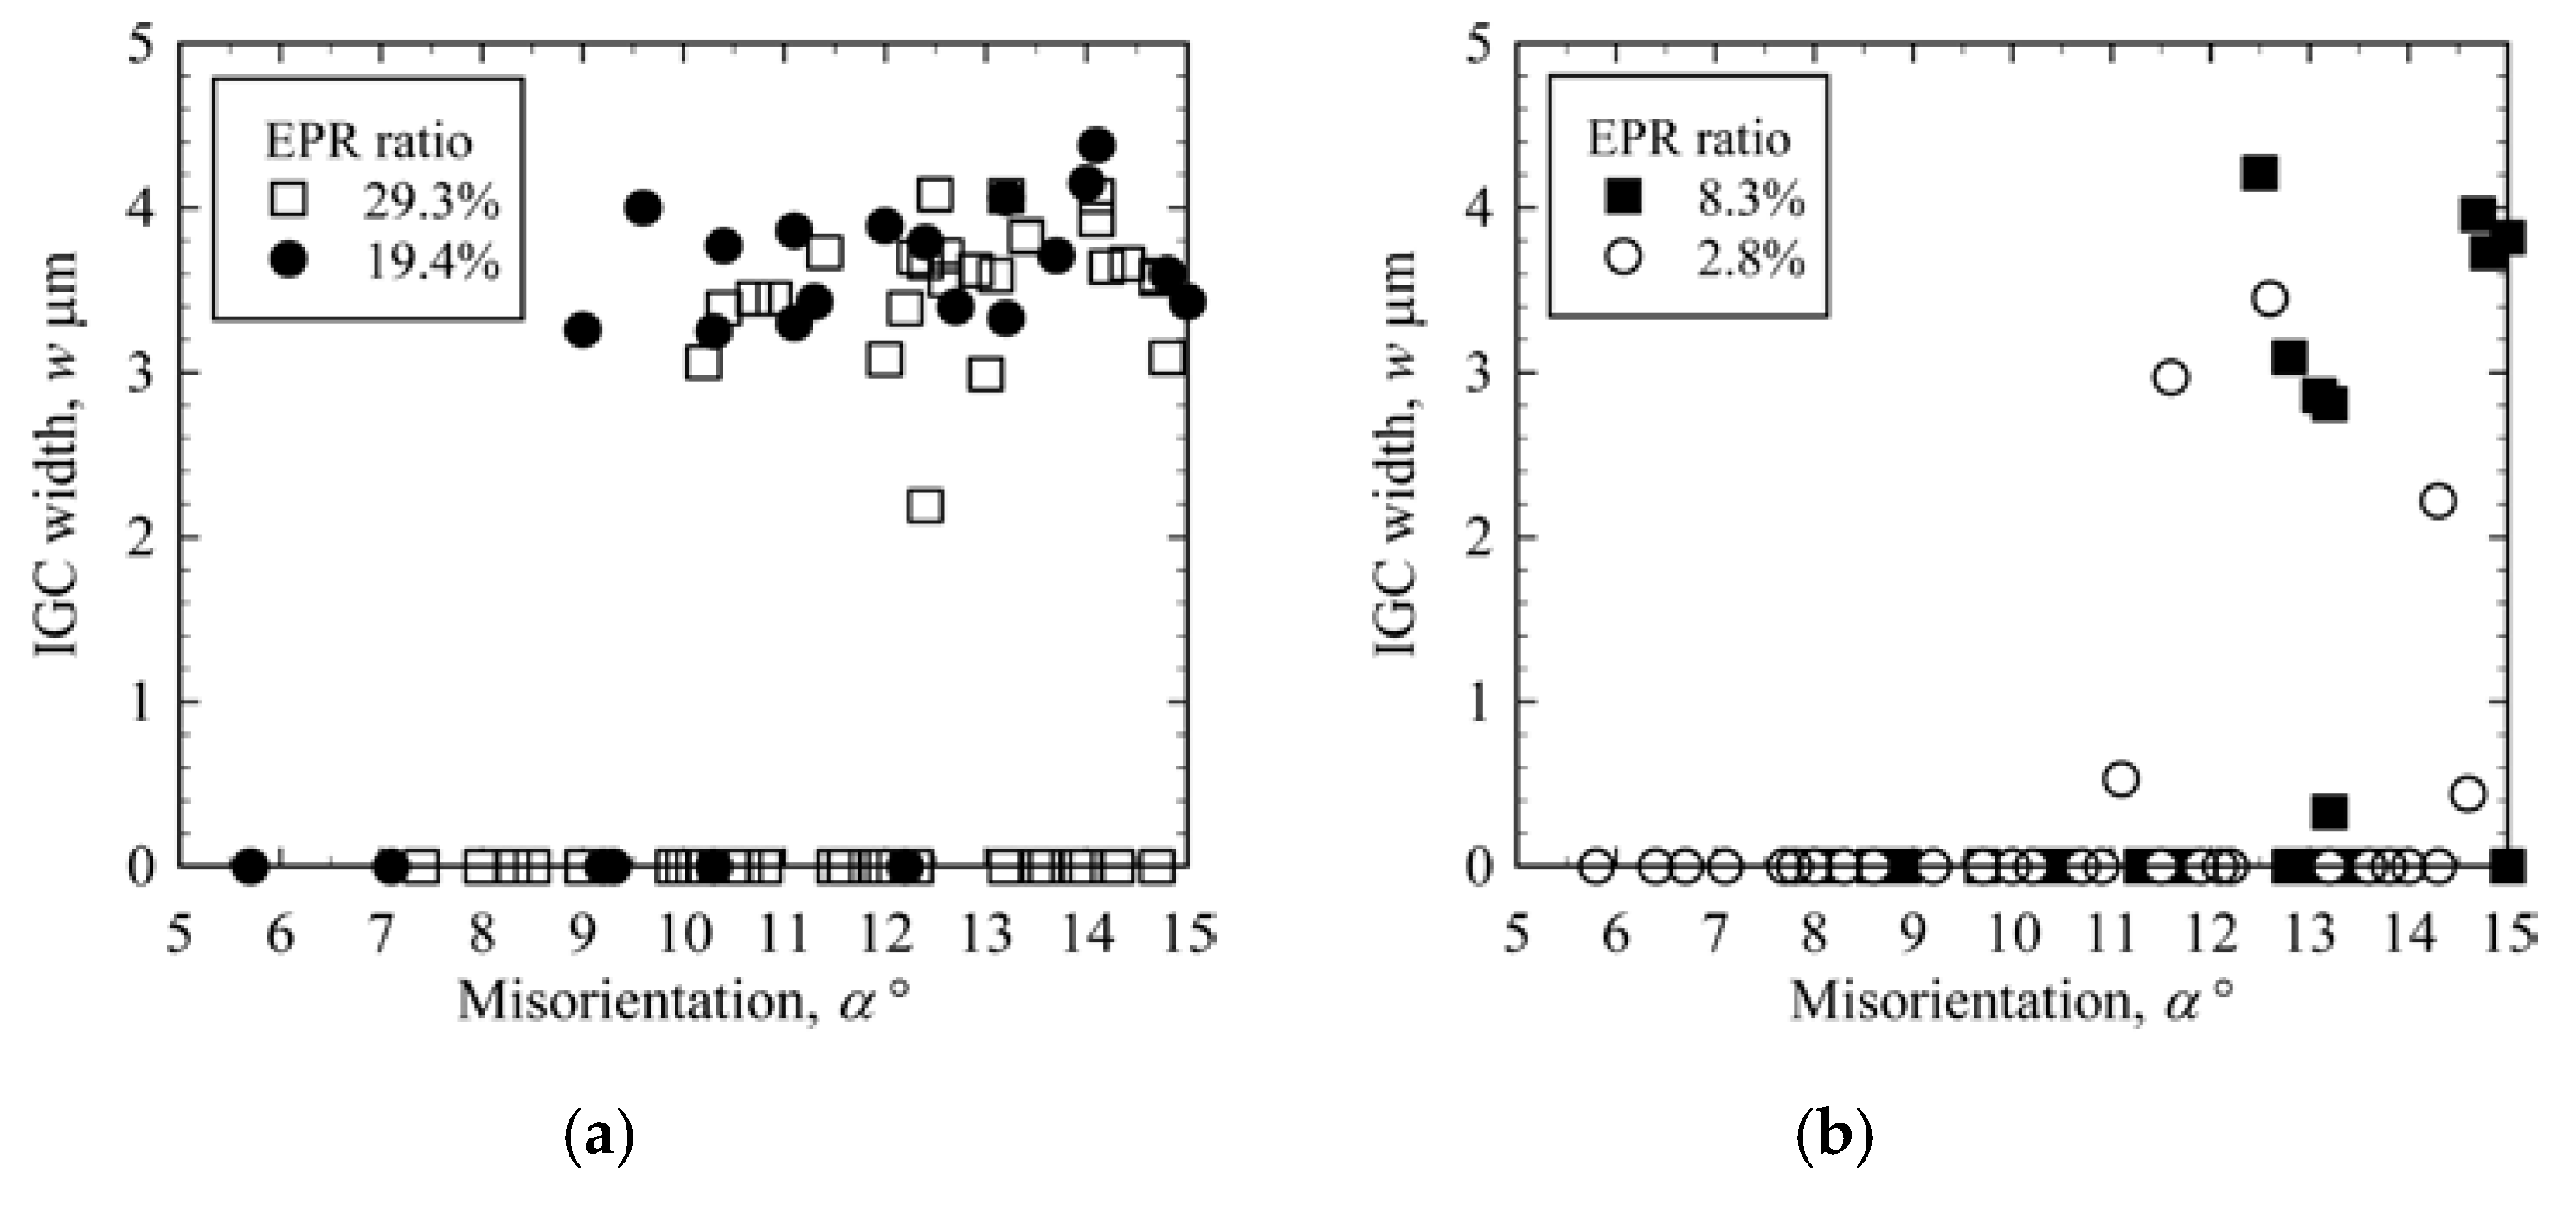
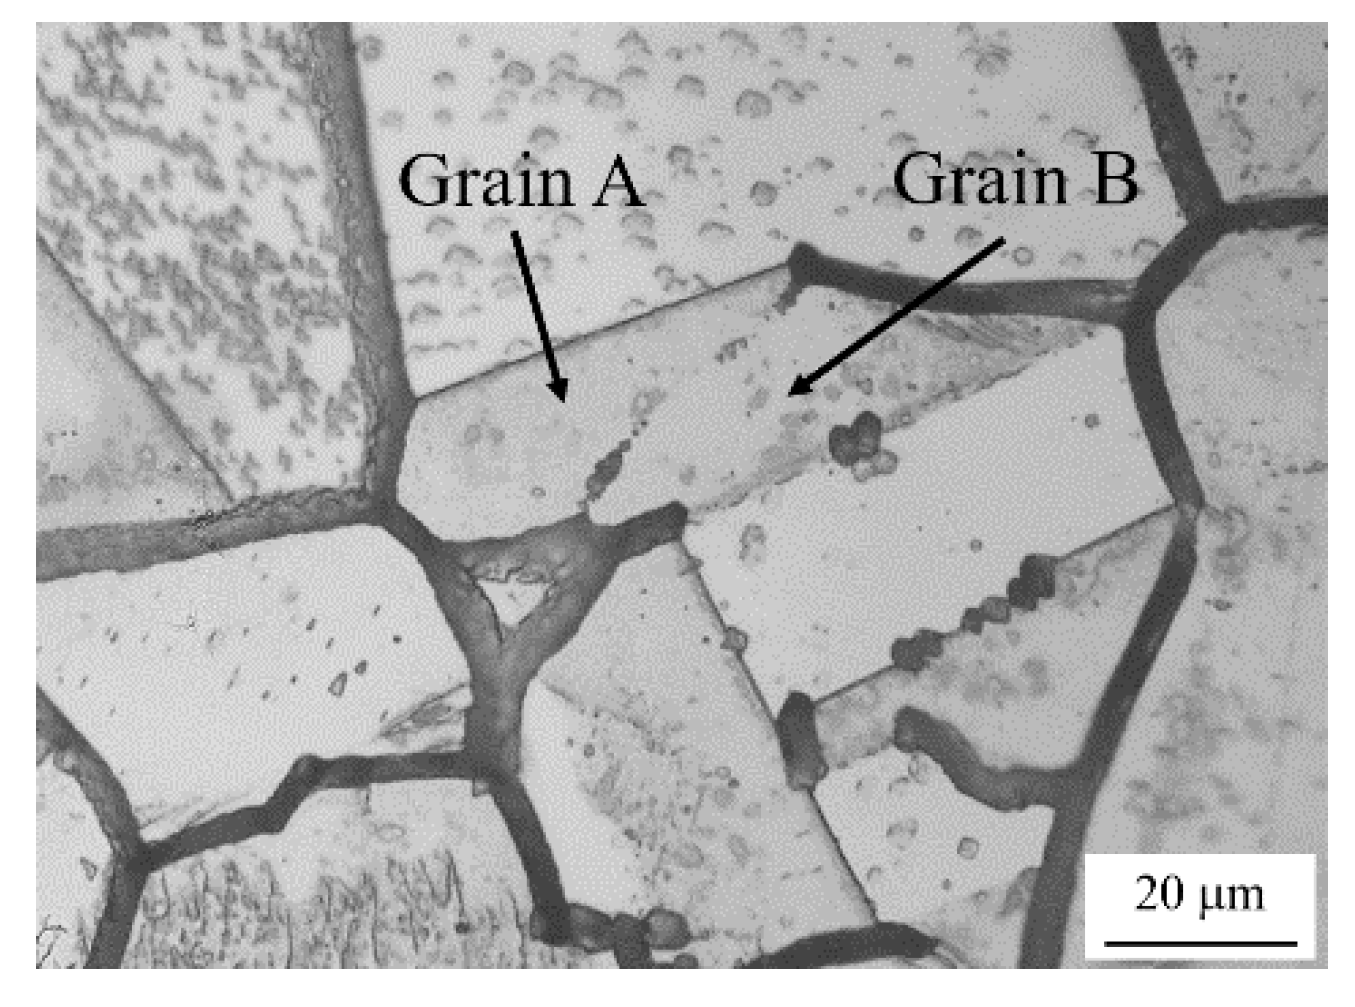
3.2. IGC at Low-Angle GBs
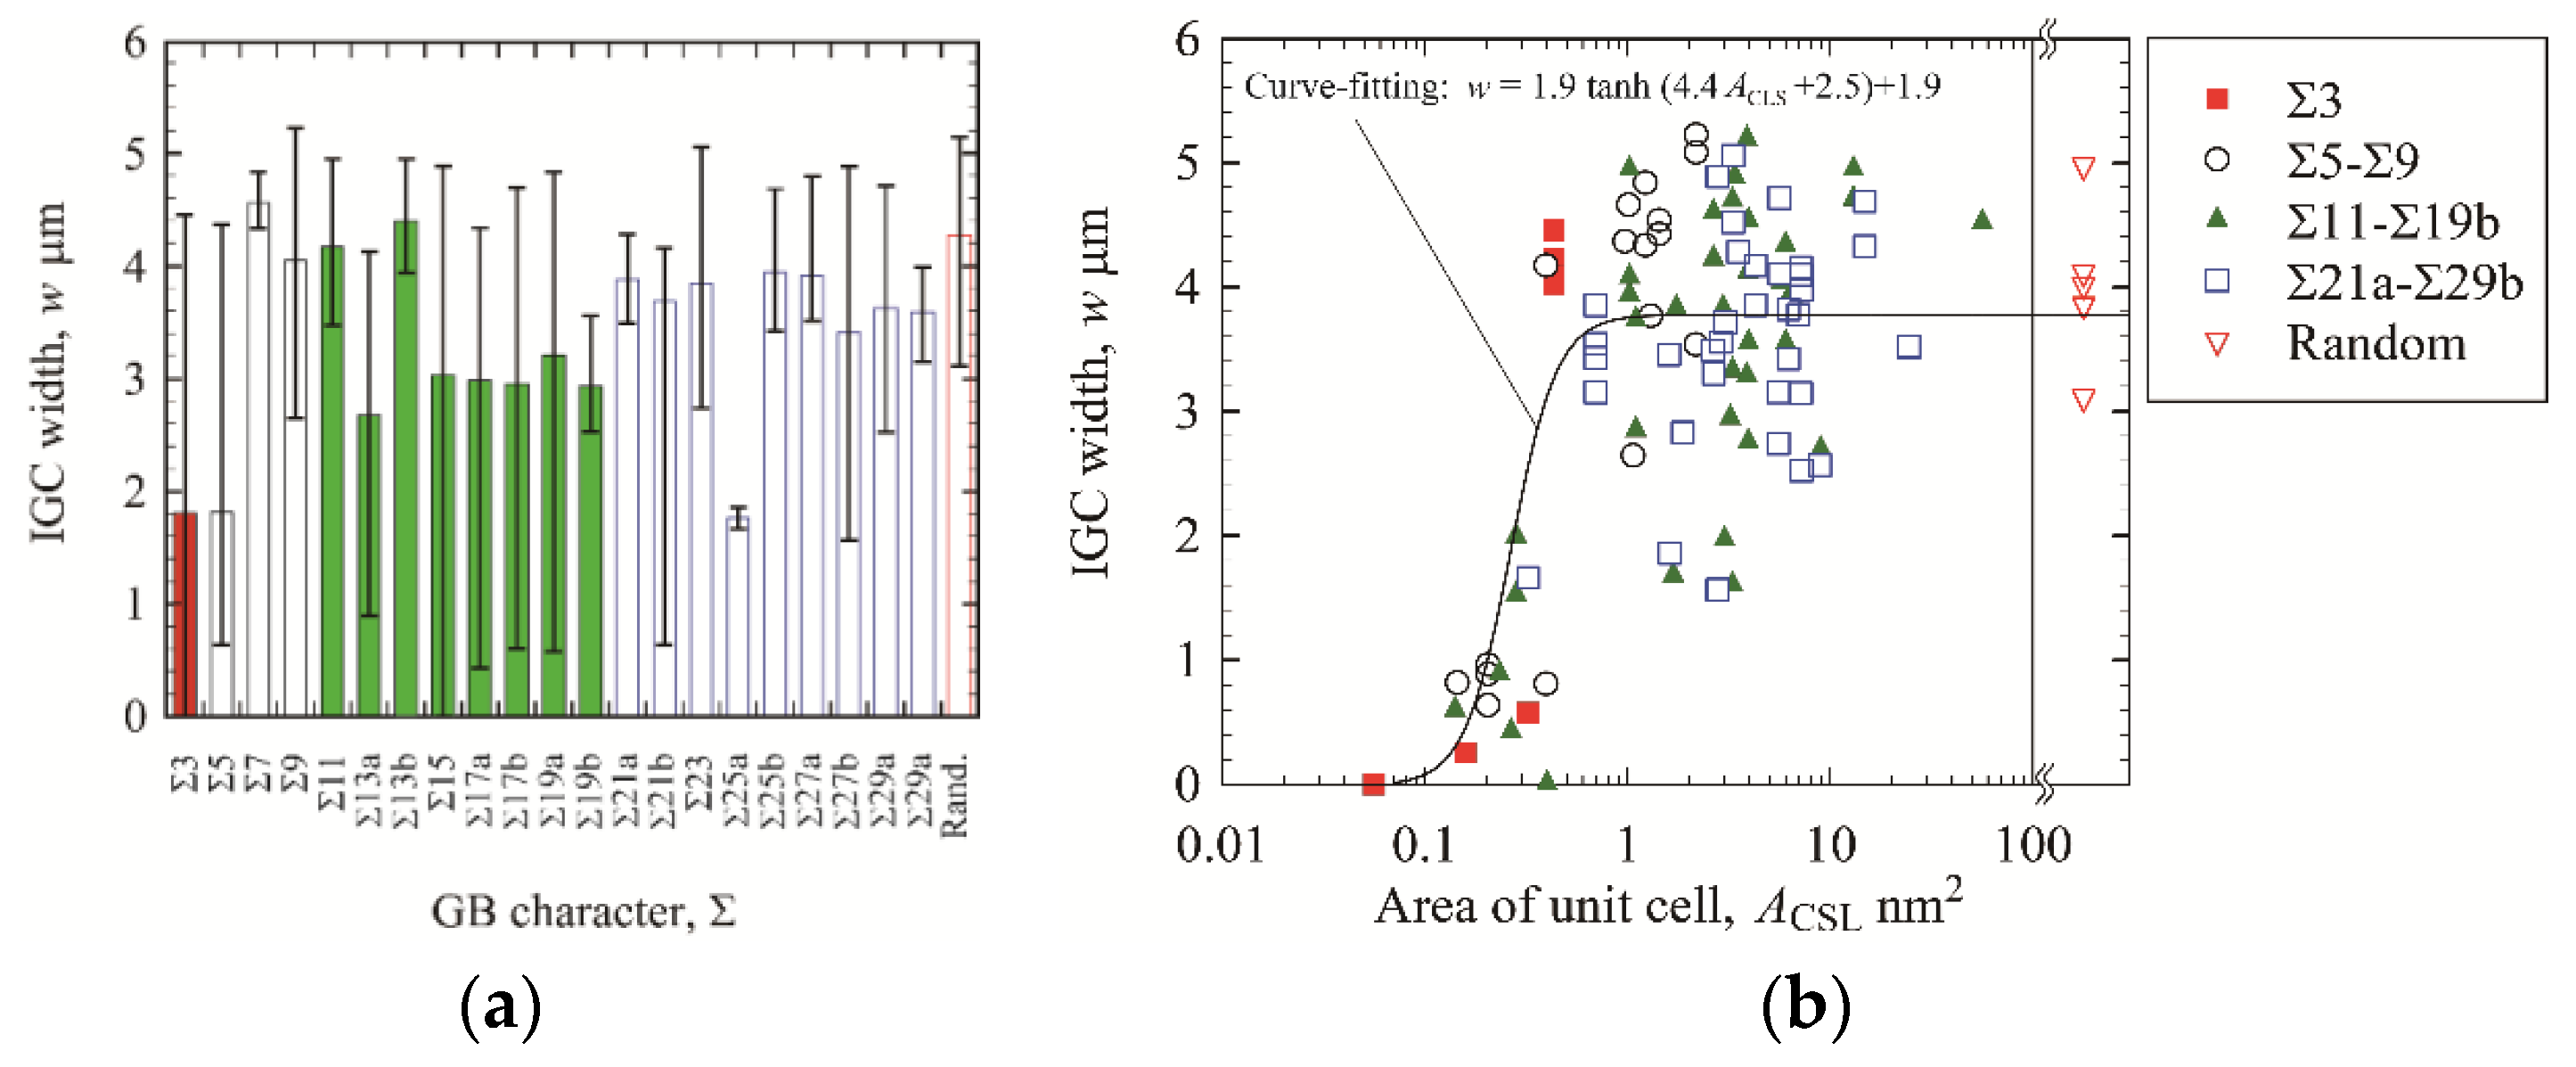
3.3. IGC at High-Angle GBs
4. Conclusions
Author Contributions
Funding
Conflicts of Interest
References
- Gaudett, M.A.; Scully, J.R. Distributions of Cr Depletion Levels in Sensitized AISI 304 Stainless Steel and Its Implications Concerning Intergranular Corrosion Phenomena. J. Electrochem. Soc. 1993, 140, 3425. [Google Scholar] [CrossRef]
- Xin, J.; Song, Y.; Fang, C.; Wei, J.; Huang, C.; Wang, S. Evaluation of inter-granular corrosion susceptibility in 316LN austenitic stainless steel weldments. Fusion Eng. Des. 2018, 133, 70–76. [Google Scholar] [CrossRef]
- Aquino, J.M.; Della Rovere, C.; Kuri, S. Intergranular corrosion susceptibility in supermartensitic stainless steel weldments. Corros. Sci. 2009, 51, 2316–2323. [Google Scholar] [CrossRef]
- Iacoviello, F.; Di Cocco, V.; D’Agostino, L. Analysis of the intergranular corrosion susceptibility in stainless steel by means of potentiostatic reactivation tests. Procedia Struct. Integr. 2017, 3, 269–275. [Google Scholar] [CrossRef]
- Morshed-Behbahani, K.; Najafisayar, P.; Pakshir, M.; Shahsavari, M. An electrochemical study on the effect of stabilization and sensitization heat treatments on the intergranular corrosion behaviour of AISI 321H austenitic stainless steel. Corros. Sci. 2018, 138, 28–41. [Google Scholar] [CrossRef]
- Suresh, G.; Parida, P.K.; Bandi, S.; Ningshen, S. Effect of carbon content on the low temperature sensitization of 304L SS and its corrosion resistance in simulated ground water. Mater. Chem. Phys. 2019, 226, 184–194. [Google Scholar] [CrossRef]
- Romero, R.J.; Murr, L.E. Fundamental and comparative studies of M23C6 carbide growth associated with twin boundaries and grain boundaries in 304 stainless steel. Microstruct. Sci. 1995, 22, 367–380. [Google Scholar]
- Trillo, E.A.; Murr, L.E. A TEM investigation of M23C6 carbide precipitation behaviour on varying grain boundary misorientations in 304 stainless steels. J. Mater. Sci. 1998, 33, 1263–1271. [Google Scholar] [CrossRef]
- Trillo, E.; Murr, L. Effects of carbon content, deformation, and interfacial energetics on carbide precipitation and corrosion sensitization in 304 stainless steel. Acta Mater. 1998, 47, 235–245. [Google Scholar] [CrossRef]
- Almanza, E.; Murr, L. A comparison of sensitization kinetics in 304 and 316 stainless steels. J. Mater. Sci. 2000, 35, 3181–3188. [Google Scholar] [CrossRef]
- Ramírez, L.; Almanza, E.; Murr, L. Effect of uniaxial deformation to 50% on the sensitization process in 316 stainless steel. Mater. Charact. 2004, 53, 79–82. [Google Scholar] [CrossRef]
- Alvarez, C.J.; Almanza, E.; Murr, L.E. Evaluation of the sensitization process in 304 stainless steel strained 50% by cold-rolling. J. Mater. Sci. 2005, 40, 2965–2969. [Google Scholar] [CrossRef]
- Liu, L.; Mitamura, T.; Terasawa, M.; Takatani, Y.; Fukumoto, S.; Tsubakino, H. AFM Observations of Intergranular Corrosion of 304 Stainless Steels. J. Soc. Mater. Sci. Jpn. 2000, 49, 222–226. [Google Scholar] [CrossRef] [Green Version]
- Bruemmer, S.M.; Chariot, L.A.; Arey, B.W. Sensitization Development in Austenitic Stainless Steel: Correlation between STEM-EDS and EPR Measurements. Corrosion 1988, 44, 328–333. [Google Scholar] [CrossRef]
- Bi, H.Y.; Kokawa, H.; Wang, Z.J.; Shimada, M.; Sato, Y.S. Suppression of chromium depletion by grain boundary structural change during twin-induced grain boundary engineering of 304 stainless steel. Scr. Mater. 2003, 49, 219–223. [Google Scholar]
- Shvindlerman, L.; Straumal, B. Regions of existence of special and non-special grain boundaries. Acta Met. 1985, 33, 1735–1749. [Google Scholar] [CrossRef]
- Srinivasan, N.; Kain, V.; Birbilis, N.; Krishna, K.M.; Shekhawat, S.; Samajdar, I. Near boundary gradient zone and sensitization control in austenitic stainless steel. Corros. Sci. 2015, 100, 544–555. [Google Scholar] [CrossRef]
- Qi, J.; Huang, B.; Wang, Z.; Ding, H.; Xi, J.; Fu, W. Dependence of corrosion resistance on grain boundary characteristics in a high nitrogen CrMn austenitic stainless steel. J. Mater. Sci. Technol. 2017, 33, 1621–1628. [Google Scholar] [CrossRef]
- An, D.; Griffiths, T.; Konijnenberg, P.; Mandal, S.; Wang, Z.; Zaefferer, S. Correlating the five parameter grain boundary character distribution and the intergranular corrosion behaviour of a stainless steel using 3D orientation microscopy based on mechanical polishing serial sectioning. Acta Mater. 2018, 156, 297–309. [Google Scholar] [CrossRef]
- Haruna, T.; Shimizu, T.; Kamaya, M. Correlation between Grain Boundary Character and Susceptibility of Sensitization for SUS304 Stainless Steel Foil with Course-Grained Structure. J. Jpn. Inst. Met. 2012, 76, 314–320. [Google Scholar] [CrossRef] [Green Version]
- Fujii, T.; Tohgo, K.; Mori, Y.; Shimamura, Y. Crystallography of intergranular corrosion in sensitized austenitic stainless steel. Mater. Charact. 2018, 144, 219–226. [Google Scholar] [CrossRef]
- Fujii, T.; Tohgo, K.; Ishizuka, N.; Shimamura, Y.; Takanashi, M.; Itabashi, Y.; Nakayama, G.; Sakakibara, Y.; Hirano, T. Fracture Mechanics Study on Stress Corrosion Cracking Behavior under Corrosive Environment. J. Solid Mech. Mater. Eng. 2013, 7, 341–356. [Google Scholar] [CrossRef]
- Fujii, T.; Tohgo, K.; Kenmochi, A.; Shimamura, Y. Experimental and numerical investigation of stress corrosion cracking of sensitized type 304 stainless steel under high-temperature and high-purity water. Corros. Sci. 2015, 97, 139–149. [Google Scholar] [CrossRef]
- Fujii, T.; Tohgo, K.; Kawamori, M.; Shimamura, Y. Characterization of stress corrosion crack growth in austenitic stainless steel under variable loading in low- and high-scale yielding conditions. Eng. Fract. Mech. 2019, 205, 94–107. [Google Scholar] [CrossRef]
- Fujii, T.; Tohgo, K.; Mori, Y.; Miura, Y.; Shimamura, Y. Crystallographic and mechanical investigation of intergranular stress corrosion crack initiation in austenitic stainless steel. Mater. Sci. Eng. A 2019, 751, 160–170. [Google Scholar] [CrossRef]
- Fujii, T.; Yamakawa, R.; Tohgo, K.; Shimamura, Y. Strain-based approach to investigate intergranular stress corrosion crack initiation on a smooth surface of austenitic stainless steel. Mater. Sci. Eng. A 2019, 756, 518–527. [Google Scholar] [CrossRef]
- Brandon, D. The structure of high-angle grain boundaries. Acta Met. 1966, 14, 1479–1484. [Google Scholar] [CrossRef]
- JCPDS International Centre for Diffraction Data, # 33-0397, Powder Diffraction File, Sets 33-34, Inorganic Volume. 1989, 142. Available online: http://www.icdd.com/pdj/ (accessed on 30 January 2020).
- Read, W.T.; Shockley, W. Dislocation Models of Crystal Grain Boundaries. Phys. Rev. 1950, 78, 275–289. [Google Scholar] [CrossRef]
- Tschopp, M.A.; Coleman, S.P.; McDowell, D.L. Symmetric and asymmetric tilt grain boundary structure and energy in Cu and Al (and transferability to other fcc metals). Integrating Mater. Manuf. Innov. 2015, 4, 176–189. [Google Scholar] [CrossRef] [Green Version]
- Parvathavarthini, N.; Mulki, S.; Dayal, R.; Samajdar, I.; Mani, K.; Raj, B. Sensitization control in AISI 316L(N) austenitic stainless steel: Defining the role of the nature of grain boundary. Corros. Sci. 2009, 51, 2144–2150. [Google Scholar] [CrossRef]
- Olmsted, D.L.; Foiles, S.M.; Holm, E.A. Survey of computed grain boundary properties in face-centered cubic metals: I. Grain boundary energy. Acta Mater. 2009, 57, 3694–3703. [Google Scholar] [CrossRef]
- Rohrer, G.S. Grain boundary energy anisotropy: A review. J. Mater. Sci. 2011, 46, 5881–5895. [Google Scholar] [CrossRef] [Green Version]
- Han, J.; Vitek, V.; Srolovitz, D.J. Grain-boundary metastability and its statistical properties. Acta Mater. 2016, 104, 259–273. [Google Scholar] [CrossRef]
- Inman, M.C.; Tipler, H.R. Interfacial energy and composition in metals and alloys. Met. Rev. 1963, 8, 105–166. [Google Scholar] [CrossRef]
- Gjostein, N.; Rhines, F. Absolute interfacial energies of [001] tilt and twist grain boundaries in copper. Acta Met. 1959, 7, 319–330. [Google Scholar] [CrossRef]


| C | Si | Mn | P | S | Ni | Cr | Fe |
|---|---|---|---|---|---|---|---|
| 0.06 | 0.47 | 0.87 | 0.03 | 0.003 | 8.05 | 18.16 | Bal. |
| Grid Shape | Hexagonal |
|---|---|
| Measurement interval (m) | 3.5 |
| Grain tolerance angle (°) | 5 |
| Minimum grain size (pixel) | 2 |
| Clean up | Grain dilation, single iteration |
© 2020 by the authors. Licensee MDPI, Basel, Switzerland. This article is an open access article distributed under the terms and conditions of the Creative Commons Attribution (CC BY) license (http://creativecommons.org/licenses/by/4.0/).
Share and Cite
Fujii, T.; Furumoto, T.; Tohgo, K.; Shimamura, Y. Crystallographic Evaluation of Susceptibility to Intergranular Corrosion in Austenitic Stainless Steel with Various Degrees of Sensitization. Materials 2020, 13, 613. https://doi.org/10.3390/ma13030613
Fujii T, Furumoto T, Tohgo K, Shimamura Y. Crystallographic Evaluation of Susceptibility to Intergranular Corrosion in Austenitic Stainless Steel with Various Degrees of Sensitization. Materials. 2020; 13(3):613. https://doi.org/10.3390/ma13030613
Chicago/Turabian StyleFujii, Tomoyuki, Takaya Furumoto, Keiichiro Tohgo, and Yoshinobu Shimamura. 2020. "Crystallographic Evaluation of Susceptibility to Intergranular Corrosion in Austenitic Stainless Steel with Various Degrees of Sensitization" Materials 13, no. 3: 613. https://doi.org/10.3390/ma13030613
APA StyleFujii, T., Furumoto, T., Tohgo, K., & Shimamura, Y. (2020). Crystallographic Evaluation of Susceptibility to Intergranular Corrosion in Austenitic Stainless Steel with Various Degrees of Sensitization. Materials, 13(3), 613. https://doi.org/10.3390/ma13030613