Abstract
The chloride diffusivity of concrete is an important parameter for assessing the long-term durability of coastal concrete structures. The purpose of this paper is to present a three-dimensional random walk algorithm (RWA) for estimating the chloride diffusivity of concrete. By analyzing the size distribution of aggregates, the equivalent interfacial transition zone (ITZ) thickness is derived in an analytical manner. Each aggregate is combined with the surrounding ITZ to construct an equivalent aggregate model (EAM) and the chloride diffusivity is formulated. It is found that the equivalent ITZ thickness decreases with the increase of practical ITZ thickness and aggregate volume fraction. The aggregate gradation influences the equivalent ITZ thickness to a certain extent. The relative chloride diffusivity of the equivalent aggregate is almost directly and inversely proportional to the equivalent ITZ thickness and the aggregate radius, respectively. The numerical results show that, when the EAM is adopted, the computational time is greatly reduced. With the EAM, concrete can be modeled as a two-phase material and the chloride diffusivity is estimated by applying the RWA. It is shown that, with the increase of mean square displacement and number of Brownian particles, the average chloride diffusivity of concrete approaches a stable value. Finally, through comparison with experimental data, the validation of the RWA is preliminarily verified.
1. Introduction
Reinforced concrete structures built in a chloride-laden environment often suffer from corrosion of reinforcement caused by penetration of chloride ions [1,2]. Many such engineering cases have been reported throughout the world [3,4,5]. Since the long-term performance of concrete infrastructure is greatly dependent on the diffusion rate of chloride ions in concrete, the chloride diffusivity plays a key part in designing and assessing coastal concrete structures [6,7].
In the past twenty years, a considerable number of experimental studies and theoretical analyses have been performed with a particular focus on the transport properties of concrete and on the key influential factors. By taking the water/cement ratio and the sand content as the primary control variables, three types of mortars were examined by a diffusion test and a migration test [6]. The test results showed that addition of sand into cement paste modifies the microstructure and chloride diffusivity of mortar. The tortuosity caused by sand particles exerts a more significant effect on the diffusion of chloride ions in mortar than the interfacial transition zone (ITZ). Using an accelerated method, Yang and Su quantified the effects of dilution, tortuosity, and ITZ on the chloride diffusivity of concrete based on the Bruggeman theory [8]. Caré [9] adopted a non-steady-state diffusion test to further analyze the relative importance between two competing factors: ITZ and tortuosity. In the theoretical aspect, a Padé approximation was proposed to estimate the chloride diffusivity of mortar [10]. An analytical solution was also presented for the chloride diffusivity of concrete with low aggregate volume fractions [11]. Caré and Herve proposed a composite sphere model for the chloride diffusivity of mortar [12]. The effects of various factors on the chloride diffusivity of concrete were comprehensively evaluated by a transfer matrix method with an inhomogeneous ITZ model [13]. It was also shown that aggregate shape influences the chloride diffusivity of concrete to a certain extent [14]. Besides a few analytical methods [15,16], the unit cell model is widely used, in which the volume ratios among various phase constituents are identical. In practical concrete, however, the ITZ thickness seems to be the same no matter how large the aggregate is [17]. As a consequence, a larger aggregate is of a smaller ITZ volume ratio in a unit cell. Thus, the prediction accuracy of the idealized unit cell with constant volume ratios will be affected to a certain extent. Although numerical methods can avoid this defect by simulating the heterogeneous structure of concrete, it is very time-consuming [18,19]. Therefore, it is still essential to develop a numerical method, with which the chloride diffusivity of concrete can be evaluated more reasonably.
This paper is aimed at developing a three-dimensional random walk algorithm (RWA) for estimating the chloride diffusivity of concrete. In the RWA, an equivalent aggregate model (EAM) is constructed to reduce the computational cost. Finally, the computational accuracy of the RWA is assessed through comparison with experimental results.
2. Simulation of Concrete Mesostructure
In what follows, only the steady-state diffusion of chloride ions in saturated concrete is considered. It is appreciated that transport of chloride ions in the pore solution is affected, to a certain extent, by the interactions among ions and the electrical double layer [20,21,22,23]. In view of the complexity of the two effects, they are neglected as a first step. To perform the random walk simulation, the concrete mesostructure needs to be reproduced as realistically as possible. For this purpose, a cubic element with a side length of a is selected. Aggregates are modeled as spherical and distributed at random within the element [24]. If the aggregate is divided into N grades [Rj, Rj+1] (j = 1, 2, …, N) and the volume percentage passing the sieve with radius Rj is Pv,j, the approximate probability density function pv(R) with respect to the volume of aggregates is given by
where H(x) is the Heaviside step function and defined as
The corresponding cumulative distribution function Pv(R) is given by
where Rk ≤ R ≤ Rk+1 and k = 1, 2, …, N. The number of aggregates per unit volume of aggregate can be formulated as
By substituting Equation (1) into Equation (4), one has
It is easily shown that the probability density function pn(R) with respect to the number of aggregates is given by
It follows from Equations (1) and (6) that
The corresponding cumulative distribution function Pn(R) is given by
where Rk ≤ R ≤ Rk+1 and k = 1, 2, …, N.
Knowing Pn(R) and the aggregate volume fraction fa, the aggregates to be distributed within the cubic element can be generated [24]. These aggregates are placed into the element from largest to smallest and no overlap is permitted between them. During the placement process, periodic boundary conditions are imposed to eliminate artificial wall effects. Finally, the reconstruction of concrete mesostructure is completed once each aggregate is surrounded with an ITZ of thickness h.
3. Equivalent Aggregate Model and ITZ Thickness
It has been shown that there are two opposite effects on the diffusion of chloride ions in concrete. The dilution and tortuosity induced by aggregates decelerate the movement of chloride ions. On the other hand, the ITZ has a larger water/cement ratio (w/c) and higher porosity compared with the bulk cement paste. Furthermore, for a sufficiently high aggregate volume fraction, the ITZ percolates throughout the concrete specimen [25]. Thus, the ITZ and percolation effects accelerate the movement of chloride ions. Since the ITZ reduces the water/cement ratios of neighboring zones and the effect is internally balanced, its net effect on the movement of chloride ions is actually small [13]. To reduce the computational cost [26], an EAM is constructed as follows.
Since the microstructure of ITZ is different from that of bulk cement paste, it is more reasonable to model the ITZ as a distinct phase. Compared with the aggregate size, the ITZ thickness is usually much smaller [27]. As a result, when a Brownian particle walks near an ITZ, it will spend a great deal of time to walk even a short distance [18]. Therefore, the random walk simulation cannot efficiently be performed on the mesostructure of concrete.
To overcome this difficulty, an EAM is constructed by combining each aggregate with the surrounding ITZ, as shown in Figure 1. In practical concrete, when the surface-to-surface distance between two aggregates is smaller than twice ITZ thickness, their ITZ layers will overlap each other. As a result, the ITZ thickness heq in the EAM is smaller than the practical thickness h. To determine the equivalent ITZ thickness, the kth moment of area <Rk> of pn(x) about the origin is defined as [28]
Figure 1.
(a) Three-phase concrete; (b) equivalent aggregate; and (c) two-phase concrete.
It is evident that <R>, 4π <R2>, and 4π <R3>/3 represent the average radius, surface area, and volume of spherical aggregates, respectively. By substituting Equation (7) into Equation (9), one has
An algorithm was presented for evaluating the ITZ volume fraction fi based on the statistical geometry of composites [11,29]. According to this algorithm, fi is given by
where the coefficients t1, t2, and t3 are expressed in terms of fa and <Rk> as [29]
with w being 0, 2, or 3. It was found that the effect of w on the computational accuracy is negligibly small but best results will be achieved for [11]. Thus, w is set to be zero in this paper. Since the ITZ volume fraction in the EAM should be equal to that in practical concrete, the equivalent ITZ thickness heq satisfies the following equation
By substituting Equation (9) into Equation (13), one has
Solving Equation (14) for heq, one has
where p and q are equal to
It will be seen below that heq is closely related to the ITZ volume fraction in each equivalent aggregate and therefore the chloride diffusivity of concrete. It is interesting to investigate the effects of fa, h, and aggregate gradation on heq, as seen from Equations (11), (15), and (16). To evaluate these influential factors in a quantitative manner, the Fuller gradation is first adopted with sizes from 0.15 to 16 mm. Thus, heq/h is plotted against fa in Figure 2 [24,30], which demonstrates that, for a small value of fa, heq/h approaches unit and therefore ITZs seldom overlap. As fa increases, more and more ITZs overlap and heq/h decreases. For a given fa, heq/h decreases with the increase of h. This is due to the fact that a larger h results in more overlaps of ITZs. For a given fa at 0.6, 0.7, and 0.8, heq/h at h = 0.05 mm is smaller than that at h = 0.01 mm by 5.76%, 10.1%, and 20.1%, respectively.
Figure 2.
Effect of interfacial transition zone (ITZ) thickness on heq/h.
Second, the effect of aggregate gradation on heq/h is analyzed. For this purpose, two typical gradations, Fuller and equal volume fraction (EVF) [24,30], are considered and h = 0.03 mm. Thus, heq/h is plotted against fa in Figure 3, indicating that, for a given fa at 0.6, 0.7, and 0.8, heq/h for concrete with the EVF gradation is smaller than that with the Fuller one by 5.29%, 9.82%, and 20.1%, respectively. This attributes the fact that more small aggregates in the EVF gradation result in more overlaps of ITZs.
Figure 3.
Effect of aggregate gradation on heq/h.
4. Chloride Diffusivity of Concrete
Duan et al. [31] proposed a completely explicit formula for the conductivity tensor of multi-phase media with various inclusions. From the formula, the chloride diffusivity of the equivalent aggregate shown in Figure 1 is given by
where Da and Di are the chloride diffusivities of aggregate and ITZ, respectively, and the aggregate volume Va and the ITZ volume Vi are equal to
The chloride diffusivity of bulk cement paste is denoted by Dbcp. Since Da is much smaller than Di and Dbcp, Da is set to be zero. Thus, Equation (17) becomes
By substituting Equations (18a) and (18b) into Equation (19), one has
It is seen from Equation (20) that, besides heq, Dea/Di is also dependent on the aggregate size. If R1 and RN+1 are set to be 0.075 and 8 mm, respectively, Dea/Di is plotted against R in Figure 4, indicating that, since heq is much smaller than R, Dea/Di is almost directly and inversely proportional to heq and R, respectively, as also seen from Equation (20).
Figure 4.
Relationship between Dea/Di and R for different values of heq.
With the EAM, concrete can be regarded as equivalent aggregates dispersed in a cement paste matrix. In this way, the RWA can directly be applied to the two-phase concrete [18,19].
In the beginning, a Brownian particle is randomly placed at a point, called the origin o, in concrete, as shown in Figure 5. Then, it walks step by step until hitting the spherical surface Γ of radius R0, i.e., the mean square displacement, centered at o for the first time. During the whole walk process, two cases should be considered separately. When the Brownian particle arrives at a point whose distance from any interfaces is larger than the prescribed value (=0.001 mm in this paper), a maximum sphere centered at the Brownian particle tangent to the interface is created. A random point is selected on the surface. If the spherical radius is ri and the chloride diffusivity of the phase included in the sphere is D(i), the mean time t(ri) for the Brownian particle to jump to the random point is [18]
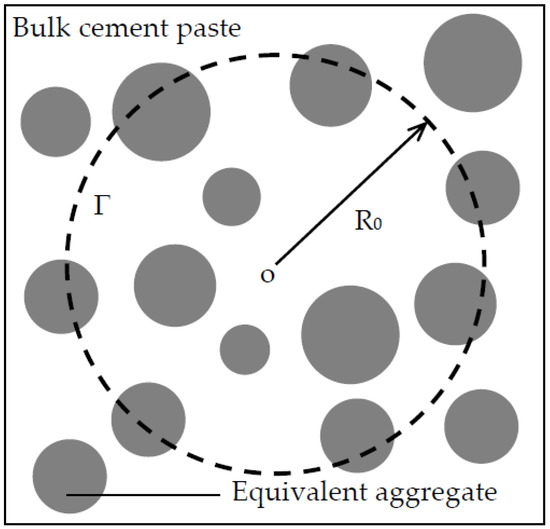
Figure 5.
Two-phase concrete composed of bulk cement paste and equivalent aggregates.
It should be pointed out that Einstein and Smoluchowski derived an equation for Brownian movement in one dimension only under the assumption of Maxwell-Boltzmann distribution [32]. Later, the equation was extended to three dimensions. The theory of Brownian motion is usually developed for a system with no real boundaries. When the Einstein–Smoluchowski equation is directly applied to the diffusion of chloride ions in cementitious materials, the Brownian particle is restricted to three orthogonal directions [33]. When the Brownian particle encounters an impermeable solid phase, it is not permitted to step into the solid phase but the time spent is still counted for such an attempt [33]. There are two disadvantages of applying the Einstein–Smoluchowski equation to cementitious materials. First, this RWA simulates the detailed zigzag walk of the Brownian particle with small finite steps and is at least an order of magnitude slower than the Torquato and Kim one [34]. Second, when the Brownian particle comes near an interface between two permeable phases, it is difficult to compute the mean time and probability for it to cross the interface. To overcome these difficulties, Torquato and Kim [18] derived Equation (21) using the first passage time probability distribution. Based on Equation (21), the Brownian particle can walk directly to a random point on the surface of the maximum sphere, as stated above. Thus, there is no need to simulate the detailed zigzag walk of the Brownian particle with finite step sizes. Furthermore, when the Brownian particle is near an interface, they also formulated the mean time and probability for it to walk through the interface, as stated below.
When the Brownian particle arrived at a point x whose distance from an interface is smaller the prescribed value, the mean time can be evaluated as follows. If the projection of x on to the interface is denoted by x0, a sphere of radius rj is then created centered at x0, as shown in Figure 6. The interface divides the sphere into two domains Ω(1) and Ω(2) with volumes V(1) and V(2) and chloride diffusivities D(1) and D(2) and the surface into two parts Γ(1) and Γ(2) with surface areas A(1) and A(2), respectively. The probabilities p1 and p2 for the Brownian particle to reach the surfaces Γ(1) and Γ(2) are equal to [18]
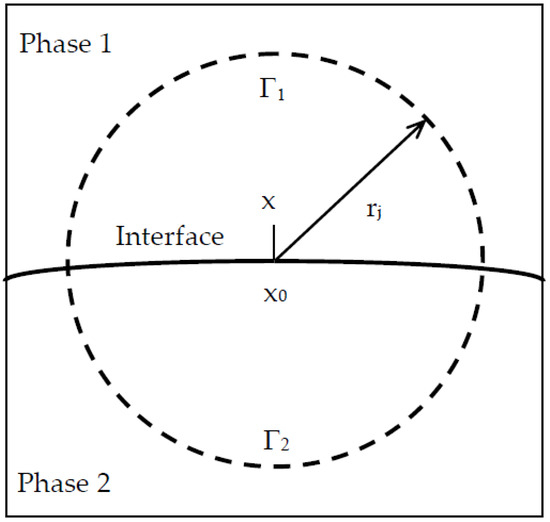
Figure 6.
Brownian particle located near interface between phases 1 and 2.
The mean time t(rj) for the Brownian to jump to a random point on the spherical surface is formulated as
It follows from Equations (21) and (23) that the mean time t(R0) is obtained as
On the other hand, when concrete is homogenized, it becomes a uniform medium of chloride diffusivity Dcon, as shown in Figure 7. Thus, for a sphere of radius R0, the mean time t(R0) for the Brownian particle to walk from the spherical center to a random point on the spherical surface is obtained as [18]
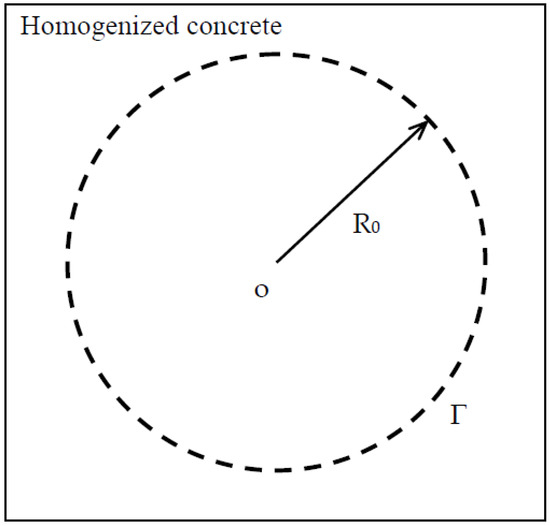
Figure 7.
Homogenized concrete of chloride diffusivity Dcon.
From Equations (24) and (25), one can obtain Dcon as
Based on the developed algorithm, a computer program is written with FORTRAN language for reconstructing the mesostructure of concrete and for implementing the random walk of Brownian particles.
During the whole random walk process, the Brownian particle possibly walks outside the cubic element. In such a situation, periodic boundary conditions are imposed. When it walks across the face BCC1B1 shown in Figure 8a, the edge BC shown in Figure 8b, or the vertex C shown in Figure 8c, the line segment yz, which extends beyond the element boundaries, will be reflected into the element on the opposite face ADD1A1, the edge A1D1, or the vertex A1, respectively, i.e., the line segment y1z1. When it walks across the other faces, edges, or vertexes, the procedure can be performed in a similar manner. To demonstrate the detailed walk process of a Brownian particle, a two-dimensional simulation square with a side of 60 mm is considered. The aggregate content is 0.5, h = 0.03 mm, and the Fuller gradation is adopted with sizes from 0.3 to 9.5 mm. The random walk paths are illustrated in Figure 9. Figure 9 shows that the Brownian particle first wanders in the lower left domain and then shifts to the upper left domain by crossing the bottom edge. After that, it explores the central domain for a while and finally comes near the upper right vertex.
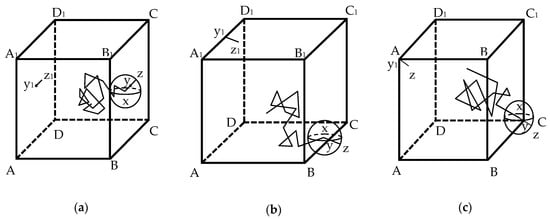
Figure 8.
Brownian particle located close to (a) face; (b) edge; and (c) vertex.
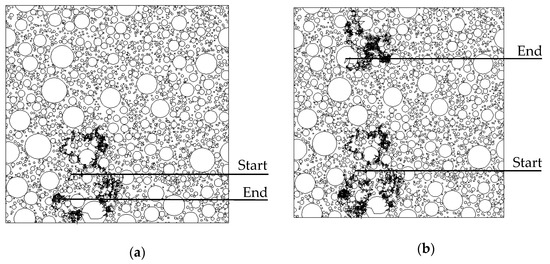
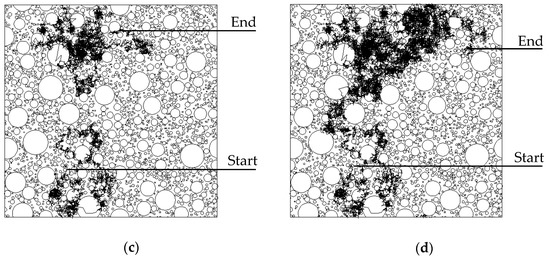
Figure 9.
Random walk paths for (a) R0 = 20 mm; (b) R0 = 30 mm; (c) R0 = 40 mm; and (d) R0 = 60 mm.
Before applying the RWA to concrete, a reasonable value of R0 needs to be known. Although a larger R0 results in a more accurate Dcon, a higher computational cost is required. In addition, the finite element size also leads to a slight fluctuation of Dcon for different initial locations of the Brownian particle. The two shortcomings could be overcome by applying the ergodic hypothesis [35], i.e., Dcon is taken as the average value over the random walks of M Brownian particles. For this purpose, a cubic element with a side of 20 mm is selected. The Fuller gradation is adopted with sizes from 0.3 to 9.5 mm, fa is 0.1, 0.3, 0.5, and 0.7, and Di/Dbcp = 5. Thus, Di/Dbcp is plotted against R0 in Figure 10, which indicates that Di/Dbcp first decreases gradually with the increase of R0 and then keeps unchanged when R0 exceeds 20 mm. By taking R0 as 40 mm, Di/Dbcp is plotted against M in Figure 11, which indicates that Di/Dbcp fluctuates slightly for a smaller value of M. When M exceeds 250, Di/Dbcp keeps unchanged. The results are similar for other fa, Di/Dbcp, and aggregate gradations. As a conservative estimate, R0 = 40 mm and M = 450 are adopted in this paper.
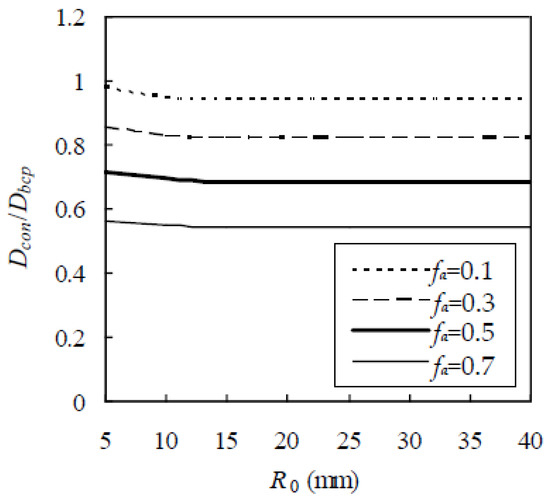
Figure 10.
Effect of R0 on chloride diffusivity of concrete.
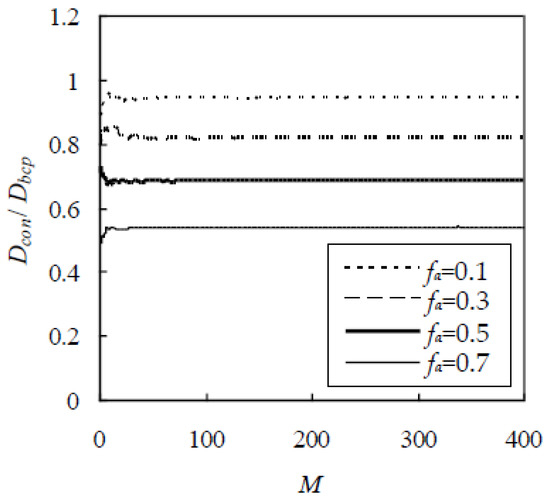
Figure 11.
Effect of M on chloride diffusivity of concrete.
As stated in the previous section, the EAM is constructed in this paper to reduce computational cost. To show the validity of the EAM, a computer simulation is performed on a cubic element with a side length of 20 mm on a Thermaltake workstation. In the simulation, the Fuller gradation is adopted with sizes from 0.3 to 9.5 mm, fa varies from 0.1 to 0.6, and Di/Dbcp is taken as 5, 10, and 15. The estimated Di/Dbcp is plotted in Figure 12, indicating that Di/Dbcp with EAM is very close to that without EAM. For a given value of Di/Dbcp at 5, 10, and 15, the average relative error between them is 0.858%, 1.88%, and 2.56%, respectively. However, the computational time is greatly reduced. For example, when the EAM is adopted, the computational time for concrete with fa = 0.5 decreases by 72.6%. Therefore, the EAM gives similar results but at significantly reduced computational cost.
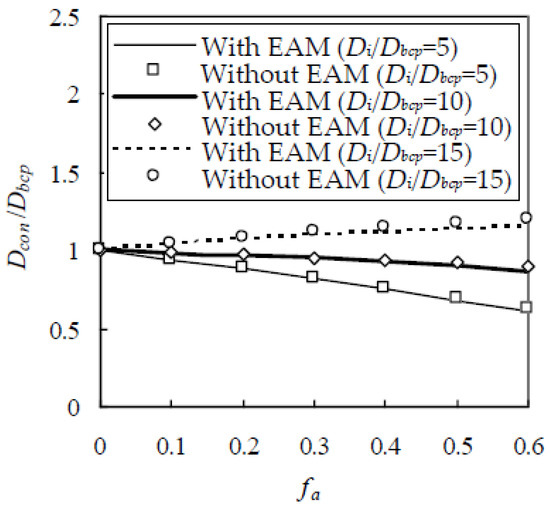
Figure 12.
Comparison of estimated chloride diffusivity of concrete with and without equivalent aggregate model (EAM).
5. Experimental Verification
To verify the validity of the developed RWA, a chloride diffusion test was performed. In the test, specimens with a w/c of 0.6 were cast with ordinary Portland cement. The Fuller gradation was adopted with sizes from 0.3 to 9.5 mm and fa was 0.0, 0.15, 0.35, 0.55, and 0.75. After 24 h of casting, these specimens were demolded and cured in water at 21 °C for 28 days. The electrical conductivity method was adopted to measure Dcon [36]. The test device is schematically shown in Figure 13.
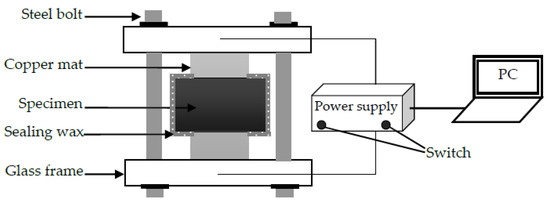
Figure 13.
Schematic of test device.
Since h was not measured, it has to be estimated. It was confirmed that, for normal-strength concrete, h is in the range between 0.01 to 0.05 mm [27]. Thus, h is set to be 0.03 mm, i.e., the average between 0.01 and 0.05 mm. In this test, Dbcp (i.e., for concrete with zero aggregate volume fraction) was measured as 15.4 × 10⁻¹² m2/s. At present, it is very tough to directly determine Di in the laboratory, and therefore this paper resorts to experimental calibration. In this test, Dcon at fa = 0.75 was measured as 5.38 × 10⁻¹² m2/s. Thus, Di is obtained, by the inverse method, as 62.5 × 10⁻¹² m2/s. With these parameters known, the random walk is performed to estimate Dcon, as shown in Figure 14, which shows a good agreement between the RWA and the measured Dcon. The relative error between them is 4.99%, 0.70%, and 3.25% for fa = 0.15, 0.35, and 0.55, respectively.
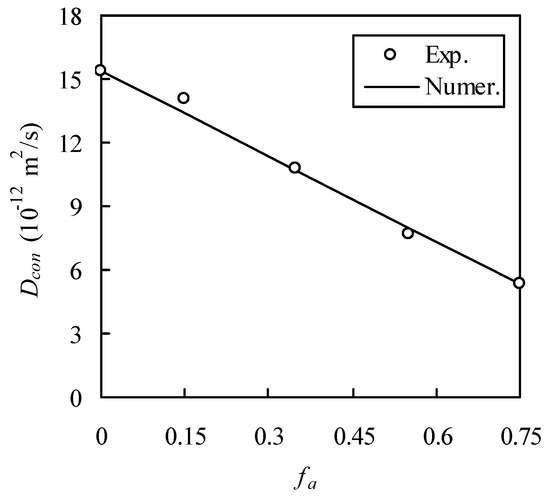
Figure 14.
Comparison of numerical method with self-conducted experimental results.
To further verify the RWA, the experimental data of Zheng and Zhou [37] are chosen. In their experiment, the cement type, aggregate gradation, accelerated method, and curing conditions are the same as those in the last experiment. But w/c was 0.5 and fa was 0.0, 0.3, 0.4, 0.5, 0.6, and 0.7. The experimentally measured Dcon was shown in Figure 15. Likewise, h = 0.03 mm. In the test, Dcon was measured as 8.21 × 10⁻¹² m2/s and 4.29 × 10⁻¹² m2/s for fa = 0.0 and 0.7, respectively. The former is Dbcp, i.e., Dbcp = 8.21 × 10⁻¹² m2/s and the latter is adopted to calibrate Di, which is obtained as 51.6 × 10⁻¹² m2/s. Thus, Dcon is computed by the RWA, as shown in Figure 15, indicating that the RWA agrees well with the experimental results. When fa = 0.3, 0.4, 0.5, and 0.6, the relative error is 5.94%, 4.26%, 0.36%, and 4.08%, respectively.
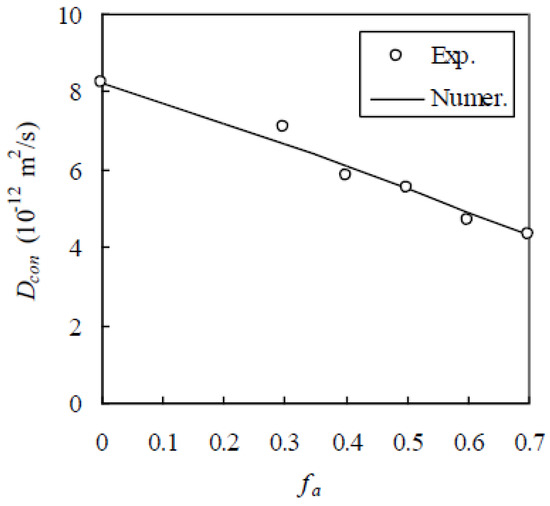
Figure 15.
Comparison of numerical method with experimental results of Zheng and Zhou [37].
Further, the experimental data of Yang and Su [8] are considered. In this experiment, mortar specimens with water/cement ratio 0.4 were cast with ASTM Type I Portland cement and fa was 0.0, 0.1, 0.2, 0.3, and 0.4. The aggregate volume percentage Pv,j passing the sieve with radius Rj at 0.075, 0.15, 0.30, 0.59, 1.18, 2.375, and 4.75 mm is 2.83%, 11.4%, 40.3%, 68.1%, 91.6%, 99.7%, and 100%, respectively. After 24 h of casting, the mortar specimens were demolded and cured in water at 23 °C for 12 months. A migration method was used to determine Dcon. As in the above two verification examples, h = 0.03 mm, Dbcp was measured as 2.03 × 10⁻¹² m2/s, and Di was calibrated as 10.2 × 10⁻¹² m2/s from the value of Dcon measured at fa = 0.4. Thus, a comparison between the RWA and the experimental results is made as shown in Figure 16, which shows a good agreement between them. When fa = 0.1, 0.2, and 0.3, the relative error between them is 1.53%, 0.520%, and 1.90%, respectively. Therefore, the validation of the RWA is preliminarily verified.
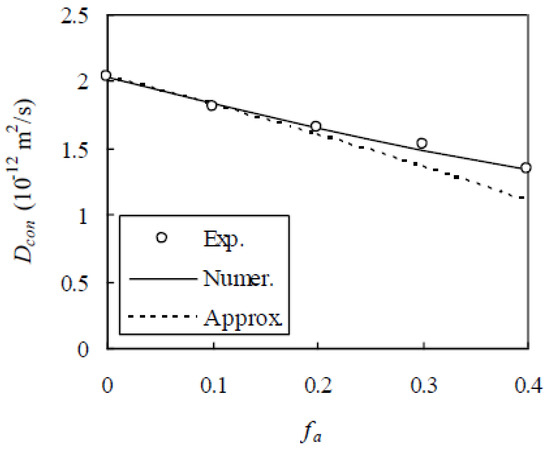
Figure 16.
Comparison of numerical method with experimental results of Yang and Su [8] and approximate analytical solution of Shafikhani and Chidiac [38].
Recently, Shafikhani and Chidiac [38] derived an approximate analytical solution of the chloride diffusivity of concrete based on phenomenological multi-scale models. By considering the effects of aggregate and ITZ on the diffusion of chloride ions in concrete separately, the solution can be expressed as
where Sa is the aggregate surface area per unit volume of concrete and given by
With the size distribution of aggregates and Dbcp known, the approximate analytical solution can be calculated as shown in Figure 16. It is seen from Figure 16 that, compared with the numerical method, the approximate analytical solution underestimates the experimental results and the diviation from the experimental results increases with the increase of fa. The relative error between them is 0.941%, 3.09%, 10.7%, and 17.2% for a given fa at 0.1, 0.2, 0.3, and 0.4, respectively. The reason for this could be that the interactions between aggregates and ITZs are not fully considered. Therefore, the numerical method developed in this paper is of higher accuracy than the approximate analytical solution.
As seen in the previous sections, there are two limitations in this study. First, to increase the computational efficiency, the EAM is adopted. As a result, the connectivity of ITZs cannot be fully embodied and the accelerated effect is neglected. Second, two of data points from each experimental database have to be chosen to calibrate the chloride diffusivities of bulk cement paste and ITZ, thereby reducing the number of data points that are used for verification. Therefore, further experimental investigations with more data points need to be conducted to provide enough statistical evidence for the validity of the RWA.
When the chloride diffusivity of concrete is determined, Fick’s second law can be used to compute the chloride profiles in concrete analytically or numerically [39,40,41] and the time for the reinforcement surface to reach the critical chloride content [42,43], which is beyond the scope of this paper.
6. Conclusions
Based on the RWA, a numerical method has been proposed for evaluating the chloride diffusivity of concrete. The concrete mesostructure with periodic aggregate distribution has been reconstructed for a given aggregate volume fraction and gradation and an estimated ITZ thickness. When the chloride diffusivities of two sets of concrete samples are measured, the inverse method has been used to calibrate that of ITZ. To decrease the computing cost, an EAM has been constructed. The ITZ thickness and chloride diffusivity of the equivalent aggregate have been derived. It has been shown that heq/h decreases with increasing fa and h and that, compared with the Fuller gradation, the EVF one has a smaller value of heq/h. Dea/Di is almost directly and inversely proportional to heq and R, respectively. With the EAM, concrete is simplified as a two-phase material. The chloride diffusivity has been estimated with the three-dimensional RWA with periodic boundary conditions on the movement of Brownian particles. The main advantage of the RWA is that there is no need to simulate the detailed zigzag walk of a Brownian particle with finite step sizes and therefore the computational time is greatly reduced and the sensitivity of chloride diffusivity to the step size is eliminated. Finally, the validation of the RWA has preliminarily been verified with experimental results.
Author Contributions
Conceptualization, H.R., X.-Z.Z., J.-J.Z., and B.Z.; methodology, X.-Z.Z., J.-J.Z., and J.Z.; software, C.-Y.Z. and J.Z.; validation, C.-Y.Z. and J.Z.; formal analysis, H.R., J.-J.Z., J.Z., and B.Z.; investigation, J.Z., X.-Z.Z., and B.Z.; writing and editing, J.-J.Z.; visualization, C.-Y.Z., and J.Z.; project administration, H.R., X.-Z.Z., J.-J.Z., and B.Z.; funding acquisition, H.R., X.-Z.Z., and J.-J.Z. All authors have read and agreed to the published version of the manuscript.
Funding
This research was funded by the National Natural Science Foundation, grant numbers 51878615, 51978619, 51779227, and 52078509 of the People’s Republic of China.
Conflicts of Interest
The authors declare no conflict of interest.
References
- Liu, Q.F.; Hu, Z.; Lu, X.Y.; Yang, J.; Azim, I.; Sun, W.Z. Prediction of chloride distribution for offshore concrete based on statistical analysis. Materials 2020, 13, 174. [Google Scholar] [CrossRef] [PubMed]
- Cao, C.; Cheung, M.M.S. Non-uniform rust expansion for chloride-induced pitting corrosion in RC structures. Constr. Build. Mater. 2014, 51, 75–81. [Google Scholar] [CrossRef]
- Buenfeld, N.R.; Glass, G.K.; Hassanein, A.M.; Zhang, J.Z. Chloride transport in concrete subjected to electric field. J. Mater. Civ. Eng. 1998, 10, 220–228. [Google Scholar] [CrossRef]
- Cady, P.D.; Weyers, R.E. Deterioration rates of concrete bridge decks. J. Transp. Eng. 1984, 110, 34–44. [Google Scholar] [CrossRef]
- Liam, K.C.; Roy, S.K.; Northwood, D.O. Chloride ingress measurements and corrosion potential mapping study of a 24-year-old reinforced concrete jetty structure in a tropical marine environment. Mag. Concr. Res. 1992, 44, 205–215. [Google Scholar] [CrossRef]
- Delagrave, A.; Bigas, J.P.; Ollivier, J.P.; Marchand, J.; Pigeon, M. Influence of the interfacial zone on the chloride diffusivity of mortars. Adv. Cem. Based Mater. 1997, 5, 86–92. [Google Scholar] [CrossRef]
- Liu, Q.F.; Easterbrook, D.; Li, L.Y.; Li, D.W. Prediction of chloride diffusion coefficients using multi-phase models. Mag. Concr. Res. 2017, 69, 134–144. [Google Scholar] [CrossRef]
- Yang, C.C.; Su, J.K. Approximate migration coefficient of interfacial transition zone and the effect of the aggregate content on the migration coefficient of mortar. Cem. Concr. Res. 2002, 32, 1559–1565. [Google Scholar] [CrossRef]
- Caré, S. Influence of aggregates on chloride diffusion coefficient into mortar. Cem. Concr. Res. 2003, 33, 1021–1028. [Google Scholar] [CrossRef]
- Garboczi, E.J.; Schwartz, L.M.; Bentz, D.P. Modeling the influence of the interfacial zone on the DC electrical conductivity of mortar. Adv. Cem. Based Mater. 1995, 2, 169–181. [Google Scholar] [CrossRef]
- Garboczi, E.J.; Bentz, D.P. Analytical formulas for interfacial transition zone properties. Adv. Cem. Based Mater. 1997, 6, 99–108. [Google Scholar] [CrossRef]
- Caré, S.; Hervé, E. Application of a n-phase model to the diffusion coefficient of chloride in mortar. Transp. Porous Media 2003, 56, 119–135. [Google Scholar] [CrossRef]
- Zheng, J.J.; Wong, H.S.; Buenfeld, N.R. Assessing the influence of ITZ on the steady-state chloride diffusivity of concrete using a numerical model. Cem. Concr. Res. 2009, 39, 805–813. [Google Scholar] [CrossRef]
- Zheng, J.J.; Zhou, X.Z.; Wu, Y.F.; Jin, X.Y. A numerical method for the chloride diffusivity in concrete with aggregate shape effect. Constr. Build. Mater. 2012, 31, 151–156. [Google Scholar] [CrossRef]
- Oh, B.H.; Jang, S.Y. Prediction of diffusivity of concrete based on simple analytic equations. Cem. Concr. Res. 2004, 34, 463–480. [Google Scholar] [CrossRef]
- Sun, G.W.; Zhang, Y.S.; Sun, W.; Liu, Z.Y.; Wang, C.H. Multi-scale prediction of the effective chloride diffusion coefficient of concrete. Constr. Build. Mater. 2011, 25, 3820–3831. [Google Scholar] [CrossRef]
- Scrivener, K.L.; Nemati, K.M. The percolation of pore space in the cement paste/aggregate interfacial zone of concrete. Cem. Concr. Res. 1996, 26, 35–40. [Google Scholar] [CrossRef]
- Kim, I.C.; Torquato, S. Determination of the effective conductivity of heterogeneous media by Brownian motion simulation. J. Appl. Phys. 1990, 68, 3892–3903. [Google Scholar] [CrossRef]
- Kim, I.C.; Torquato, S. Effective conductivity of suspensions of hard spheres by Brownian motion simulation. J. Appl. Phys. 1991, 69, 2280–2289. [Google Scholar]
- Amiri, O.; Aït-Mokhtar, A.; Dumargue, P.; Touchard, G. Electrochemical modeling of chloride migration in cement based materials part I: Theoretical basis at microscopic scale. Electrochim. Acta 2001, 46, 1267–1275. [Google Scholar] [CrossRef]
- Amiri, O.; Aït-Mokhtar, A.; Dumargue, P.; Touchard, G. Electrochemical modeling of chloride migration in cement based materials part II: Experimental study-calculation of chlorides flux. Electrochim Acta 2001, 46, 3589–3597. [Google Scholar] [CrossRef]
- Bourbatache, K.; Millet, O.; Aït-Mokhtar, A. Ionic transfer in charged porous media. Periodic homogenization and parametric study on 2D microstructures. Int. J. Heat Mass Transf. 2012, 55, 5979–5991. [Google Scholar] [CrossRef]
- Friedmann, H.; Amiri, O.; Aït-Mokhtar, A. Shortcomings of geometrical approach in multi-species modeling of chloride migration in cement-based materials. Mag. Concr. Res. 2008, 60, 119–124. [Google Scholar] [CrossRef]
- Zheng, J.J.; Li, C.Q. Three-dimensional aggregate density in concrete with wall effect. ACI Mater. J. 2002, 99, 568–575. [Google Scholar]
- Zheng, J.J.; Zhou, X.Z. Percolation of ITZs in concrete and effects of attributing factors. J. Mater. Civ. Eng. 2007, 19, 784–790. [Google Scholar] [CrossRef]
- Zheng, J.J.; Zhang, J.; Zhou, X.Z.; Wang, X.R. Numerical method for predicting chloride diffusivity of mature cement paste. J. Mater. Civ. Eng. 2019, 31, 04019080. [Google Scholar] [CrossRef]
- Zheng, J.J.; Li, C.Q.; Zhou, X.Z. Thickness of interfacial transition zone and cement content profiles around aggregates. Mag. Concr. Res. 2005, 57, 397–406. [Google Scholar] [CrossRef]
- Devore, J.L. Probability and Statistics for Engineering and the Sciences; Duxbury: Belmont, CA, USA, 1995. [Google Scholar]
- Lu, B.L.; Torquato, S. Nearest-surface distribution functions for polydispersed particle system. Phys. Rev. A 1992, 45, 5530–5544. [Google Scholar] [CrossRef]
- Zheng, J.J.; Li, C.Q.; Zhao, L.Y. Simulation of two-dimensional aggregate distribution with wall effect. J. Mater. Civ. Eng. 2003, 15, 506–510. [Google Scholar] [CrossRef]
- Duan, H.L.; Karihaloo, B.L.; Wang, J.; Yi, X. Effective conductivities of heterogeneous media containing multiple inclusions with various spatial distributions. Phys. Rev. B 2006, 73, 1743203. [Google Scholar] [CrossRef]
- Islam, M.A. Einstein-Smoluchowski diffusion equation: A discussion. Phys. Scr. 2004, 70, 120–125. [Google Scholar] [CrossRef]
- Liu, L.; Sun, W.; Ye, G.; Chen, H.S.; Qian, Z.W. Estimation of the ionic diffusivity of virtual cement paste by random walk algorithm. Constr. Build. Mater. 2012, 28, 405–413. [Google Scholar] [CrossRef]
- Torquato, S.; Kim, I.C. Efficient simulation technique to compute effective properties of heterogeneous media. Appl. Phys. Lett. 1989, 55, 1847–1849. [Google Scholar] [CrossRef]
- Torquato, S. Random Heterogenerous Materials: Microstructure and Macroscopic Properties; Springer: New York, NY, USA, 2001. [Google Scholar]
- Andrade, C. Calculation of chloride diffusion coefficients in concrete from ionic migration measurements. Cem. Concr. Res. 1993, 23, 724–742. [Google Scholar] [CrossRef]
- Zheng, J.J.; Zhou, X.Z. Effective medium method for predicting the chloride diffusivity in concrete with ITZ percolation effect. Constr. Build. Mater. 2013, 47, 1093–1098. [Google Scholar] [CrossRef]
- Shafikhani, M.; Chidiac, S.E. A holistic model for cement paste and concrete diffusion coefficient. Cem. Concr. Res. 2020, 133, 106049. [Google Scholar] [CrossRef]
- Li, D.W.; Wang, X.F.; Li, L.Y. An analytical solution for chloride diffusion in concrete with considering binding effect. Ocean Eng. 2019, 191, 106549. [Google Scholar] [CrossRef]
- Li, D.W.; Li, L.Y.; Wang, X.F. Chloride diffusion model for concrete in marine environment with considering binding effects. Mar. Struct. 2019, 66, 44–51. [Google Scholar] [CrossRef]
- Wu, L.J.; Wang, Y.Z.; Wang, Y.C.; Ju, X.L.; Li, Q.M. Modelling of two-dimensional chloride diffusion concentrations considering the heterogeneity of concrete materials. Constr. Build. Mater. 2020, 243, 118213. [Google Scholar] [CrossRef]
- Chalhoub, C.; Francois, R.; Carcasses, M. Critical chloride threshold values as a function of cement type and steel surface condition. Cem. Concr. Res. 2020, 134, 106086. [Google Scholar] [CrossRef]
- Fakhri, H.; Fishman, K.L.; Ranade, R. A novel experimental method to determine the critical chloride content in cement-based composites. Constr. Build. Mater. 2020, 263, 120101. [Google Scholar] [CrossRef]


Publisher’s Note: MDPI stays neutral with regard to jurisdictional claims in published maps and institutional affiliations. |
© 2020 by the authors. Licensee MDPI, Basel, Switzerland. This article is an open access article distributed under the terms and conditions of the Creative Commons Attribution (CC BY) license (http://creativecommons.org/licenses/by/4.0/).