Article

1H NMR Spin-Lattice Relaxometry of Cement Pastes with Polycarboxylate Superplasticizers

1
Key Laboratory of Advanced Civil Engineering Materials, Ministry of Education, Tongji University, Shanghai 201804, China
2
School of Materials Science and Engineering, Tongji University, Shanghai 201804, China
*
Author to whom correspondence should be addressed.
Materials 2020, 13(24), 5626; https://doi.org/10.3390/ma13245626
Submission received: 30 October 2020 / Revised: 8 December 2020 / Accepted: 8 December 2020 / Published: 10 December 2020
(This article belongs to the Special Issue Testing of Materials and Elements in Civil Engineering)

Abstract

:
1H spin-lattice relaxometry (T1, longitudinal) of cement pastes with 0 to 0.18 wt % polycarboxylate superplasticizers (PCEs) at intervals of 0.06 wt % from 10 min to 1210 min was investigated. Results showed that the main peak in T1 relaxometry of cement pastes was shorter and lower along with the hydration times. PCEs delayed and lowered this main peak in T1 relaxometry of cement pastes at 10 min, 605 min and 1210 min, which was highly correlated to its dosages. In contrast, PCEs increased the total signal intensity of T1 of cement pastes at these three times, which still correlated to its dosages. Both changes of the main peak in T1 relaxometry and the total signal intensity of T1 revealed interferences on evaporable water during cement hydration by dispersion mechanisms of PCEs. The time-dependent evolution of weighted average T1 of cement pastes with different PCEs between 10 min and 1210 min was found regular to the four-stage hydration mechanism of tricalcium silicate.

1. Introduction

Since Bloch [1] and Purcell [2] awarded the Nobel Prize for successful monitoring the magnetic situation of protons in water and parafilm using low-field nuclear magnetic resonance(NMR) instruments, 1H NMR (proton NMR) has been used as an effective technology in cement and concrete research for a long while. 1H NMR could detect the nuclear spin-lattice relaxometry (T1, longitudinal) or spin–spin relaxometry (T2, transverse) of 1H nuclei. T1 and T2 depend on fluctuations in magnetic dipole–dipole interactions caused by the relative motion of pairs of spins [3]. Relaxometry (relaxation time) may extend due to the relative motion of spins in a fluid as water or oil, theoretical studies have been done by Korb [4,5] previously, and recent studies on cement hydrates by McDonald [6,7,8,9].
There are many studies about water transport and distributions in cement-based materials based on T2 relaxometry [10,11,12,13]. T2 relaxometry has also been used for detecting porosity of oil-well cement pastes [14], C3S hydrated pastes [15,16], white cement mortars [17], lime plaster–brick systems [18], complex wall materials [19], carbonated cement pastes [20]. Besides macropores in cement-based materials, nanopores (or gel pores) in calcium silicate hydrate (C-S-H) gel could also be demonstrated by T2 relaxometry [21]. Given that C-S-H gel being one poorly crystalline, which is quasi-amorphous and contains nanopores with water [22], some attempts have been made with water in C-S-H gel pores [23,24]. There are some other applications of T2 relaxometry in alkali-activated binders [25], lime concrete [26], cement pastes with superabsorbent polymers [27], cellulose ethers [28], woods [29], MgO-based cement [30]. However, the paramagnetic species (mainly Fe3+) in cement pastes could influence T2 relaxometry [6]. It has been reported that T2 relaxometry would result in a reduced volume because of its access to the paramagnetic species in a single channel based on the crystalline structure of ettringite [31].
Compared to T2 relaxometry, there are few applications of T1 relaxometry in cement-based materials. It has been found that T1 relaxometry of white cement pastes with w/c = 0.3, 0.4, 0.6, 0.7 could show a significant increase after drying at 105 °C while the freeze–thaw cycling of 25 times could not make obvious changes [32]. Many theoretical studies of T1 relaxometry in cement-based materials have been done by one joint research group in Yugoslavia and Canada from 1978 to 1996. They have measured the T1 relaxometry of absorbed water in cement pastes and C3S pastes during the hardening process [33]. A method has been proposed to determine the specific surface of cement hydrates based on T1 relaxometry (1/T1) [34]. T1 relaxometry of Portland cement and white cement, as well as white cement with 5 wt % MSF salts (sulfonated-melamine-formaldehyde), has been monitored, respectively [35,36,37]. They have also compared signal differences between the synthesized white cement at 40 MHz and at 200 MHz [38]. The fractal geometry of C-S-H gel, quantitative changes of water and Ca(OH)2 in white cement pastes have been monitored successively [39,40]. T1 relaxometry of calcium aluminate cement, T1 relaxometry of self-stressed expansive cement, T1-weighted line shape of white cement pastes have been explored by some coworkers with this group afterward [41,42,43]. Moreover, some researchers have tried to correlate signals of T1 relaxometry to microcracks in cement pastes [44]. Other researchers have studied the dynamics of liquid water in pores of cement-based materials based on T1 relaxometry [45].
As it has been found that 5 wt % MSF salts could change T1 relaxometry of white cement pastes, which have acted as the superplasticizers [37], could polycarboxylate superplasticizers (PCEs) change T1 relaxometry of Portland cement pastes? In this research, effects of the synthesized PCEs on the hydration process of Portland cement pastes were initially explored by 1H NMR technique based on T1 relaxometry and its total signal intensity at three selected time points of 10 min, 605 min, 1210 min, as well as the evolution process of weighted average T1 from 10 min to 1210 min. We are certain that this study would enrich the applications of T1 relaxometry in cement-based materials. PCEs are popular chemicals for ultra-high performance concrete (UHPC). Hence, this study could also provide useful data to enrich understandings of the effects of PCEs to cement pastes in UHPC.

2. Materials and Methods

2.1. Materials

The P.Ⅱ.52.5 cement used in this experiment was purchased from Jiangnan Onoda Cement Co. LTD., Jiangsu, China. The fineness of cement was 315 m2/kg, and its chemical composition as supplied by its manufacturer is shown in Table 1. The PCEs used in this experiment were synthesized from these materials. Methyl allyl polyethenoxy ether (TPEG) was purchased from Yangzi Aoke Chemical Company(Nanjing, China). Maleic anhydride (MA, analytical-grade), acrylic acid methyl ester (AAME, analytical-grade) and acrylic acid (AA, analytical-grade) were purchased from Shanghai Guoyao Chemical Company (Shanghai, China).

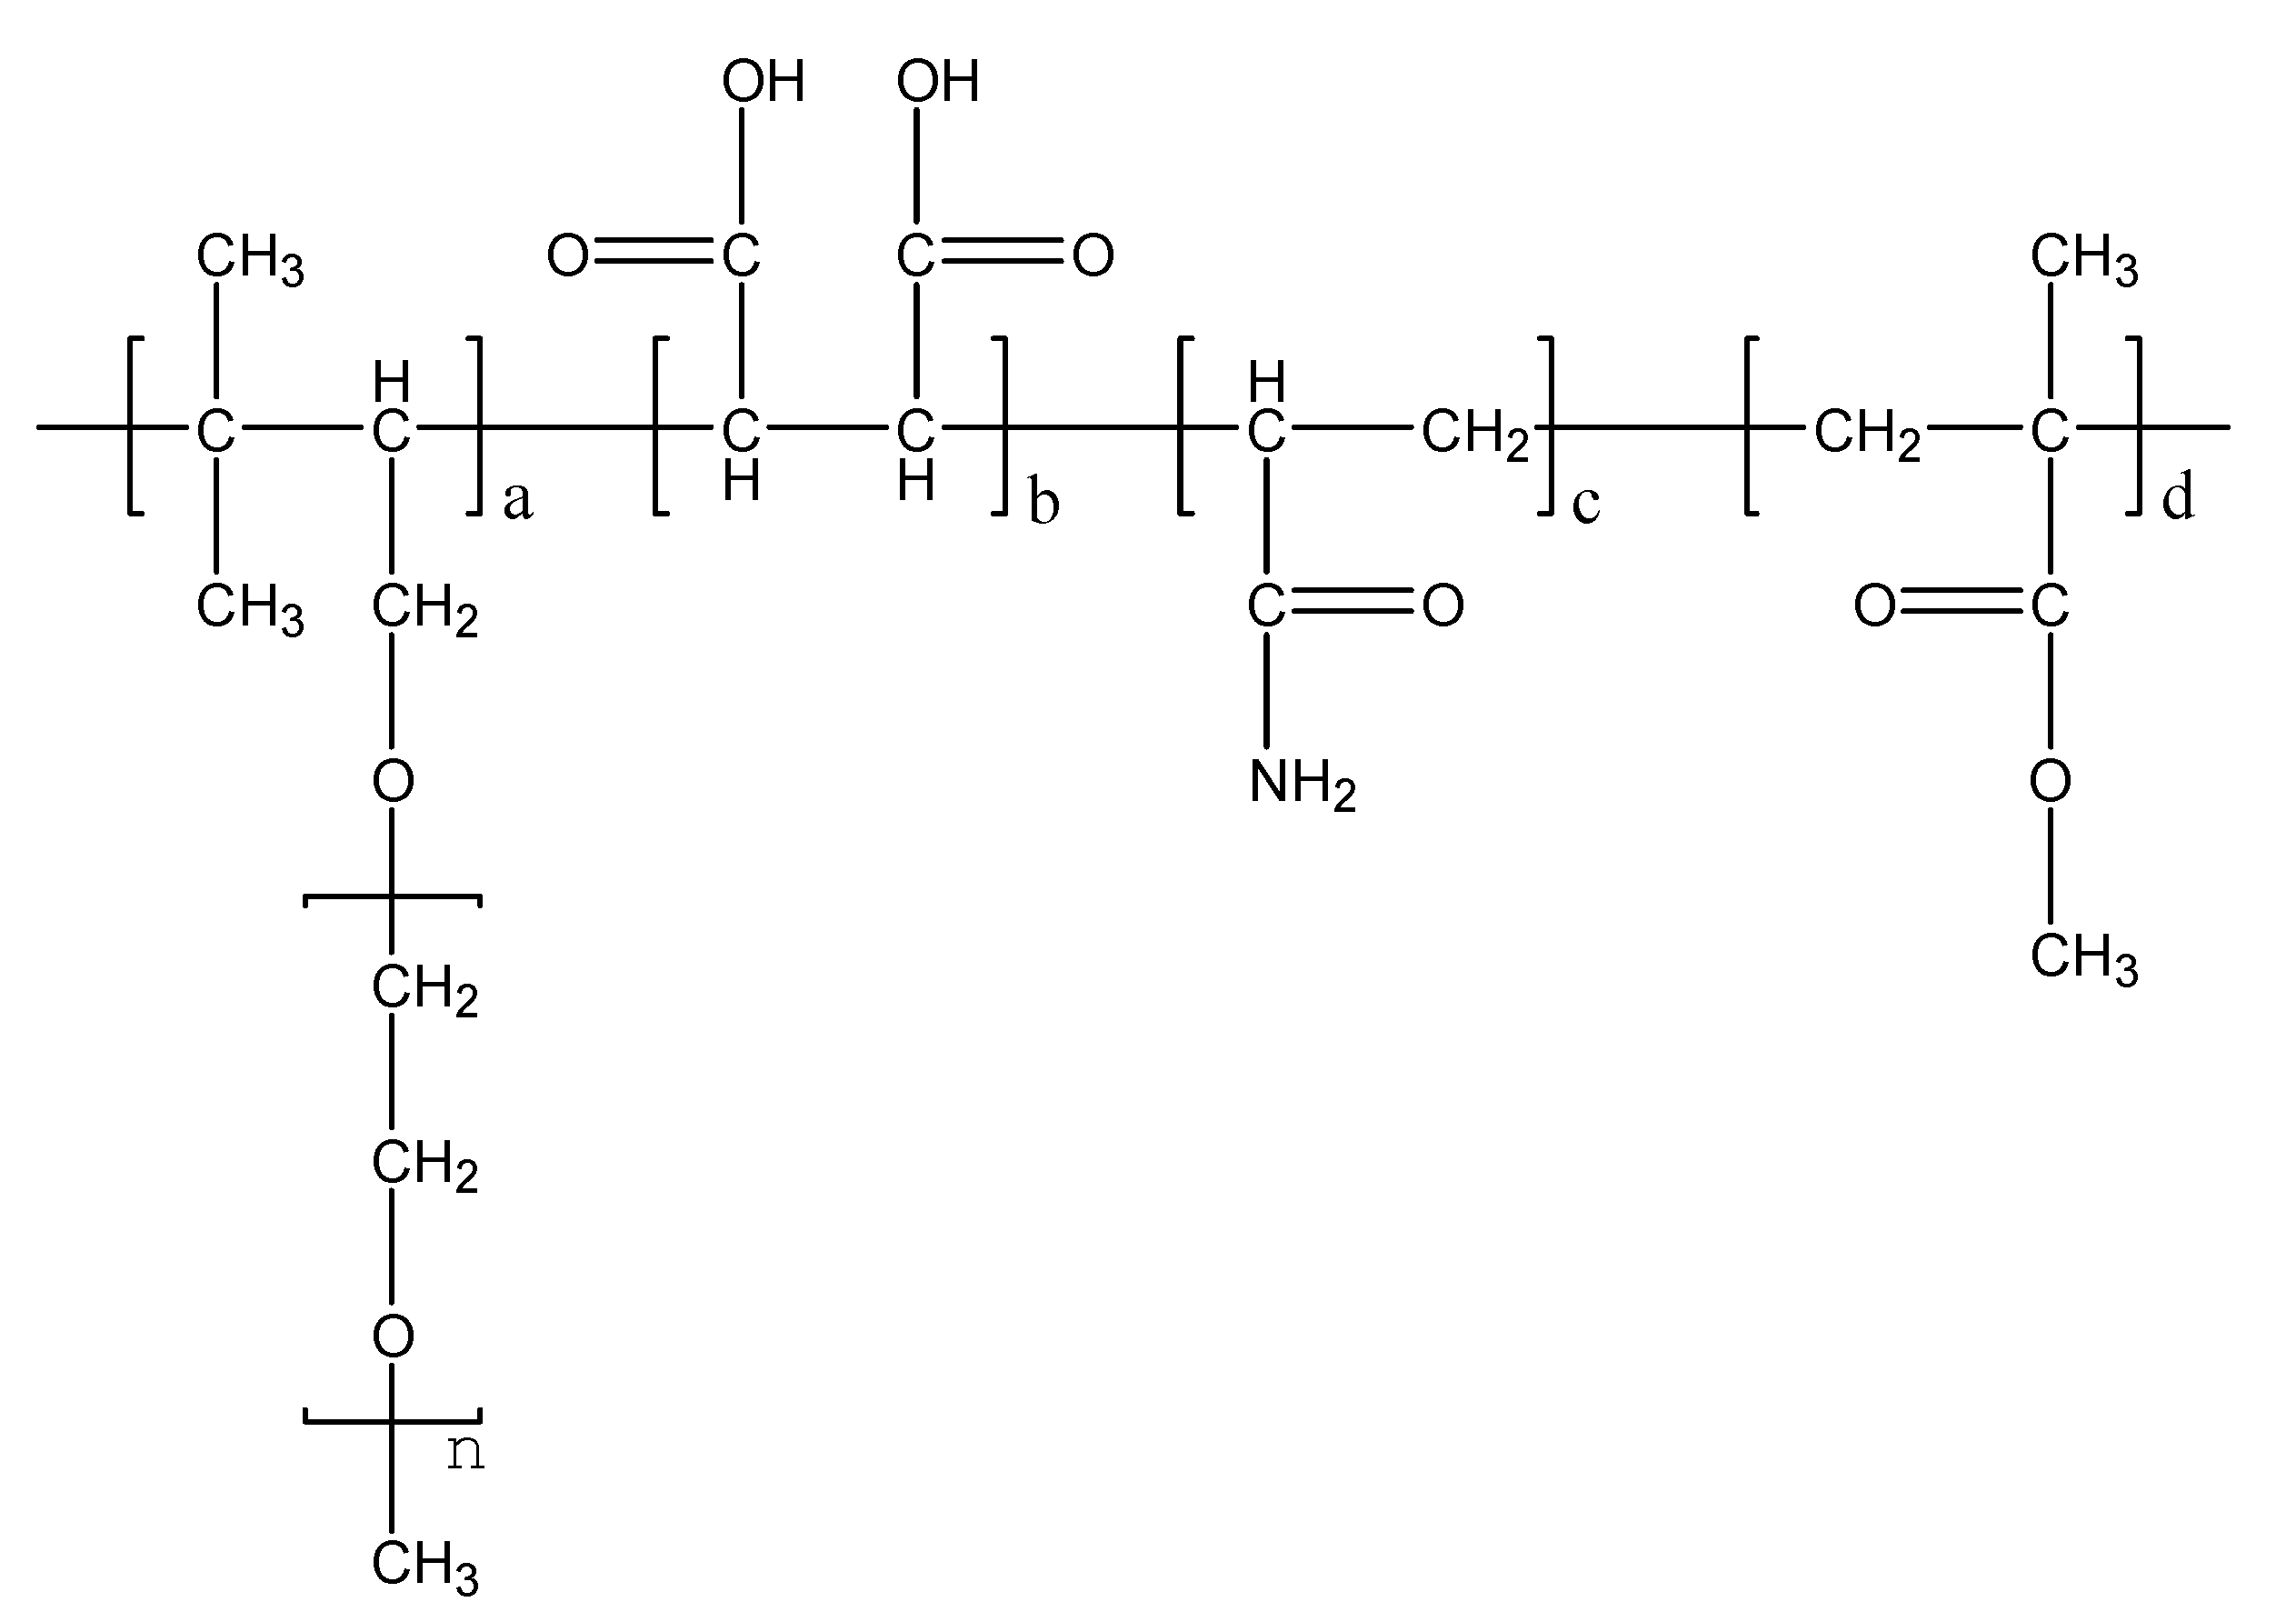
2.2. Preparation of PCEs

PCEs were synthesized via aqueous free radical copolymerization at the molar ratios of TPEG: MA: AAME: AA at 6:9:12:6. The average polymerization degree of TPEG was 35, and the Mn of TPEG was 2400 g/mol, which were provided by its manufacturer. The equipment for the synthesized process of PCEs was as same as the previous investigation [46]. The initiator in the synthesized process was (NH4)2S2O8 (ammonium persulfate, AP), which was 3 wt % to total monomers and purchased from Shanghai Guoyao Chemical Company (Shanghai, China). The temperature in the synthesis process was 80 °C. The adding time of monomers and the soaking time in the synthesized process were 1 h and 0.5 h, respectively. The synthesized formula is shown in Figure 1.

2.3. NMR Equipment and Theory

The low-field NMR instrument in this experiment was PQ-001 NMR (Niumag Electric Corporation, Shanghai, China). This instrument had a constant magnetic field of 0.49 T, a proton resonance frequency of 21 MHz, a permanent magnet of 32 °C. T1 relaxometry was detected with the inversion recovery (IR). The IR sequence (π-τ-π/2-acq) was applied to measure the T1, where t was the waiting time, acq was the received signal. After the NMR equipment debugged, the prepared samples of different cement pastes with PCEs were poured into an NMR tube with a height between 17 mm to 20 mm and then sealed by a PTFE film.
Commonly, the T1 relaxometry used in the cement-based materials was based on the fast-exchange model, which was originated from the standard model. Based on the assumption that the molecular exchanging between two phases faster than individual proton relaxation times, the integrated relaxation rate could be described as Equation (1) in [47]. In Equation (1), T 1 , 2 bulk and T 1 , 2 surf were the proton relaxation times in the bulk and at the surface, f surf and f bulk were the volume fractions of the surface and bulk phases. The correlation between f surf and f bulk could be described as Equation (2). The surface relaxation rate was much higher than the bulk relaxation rate, so Equation (1) was simplified to Equation (3), which had been successfully used [6]. In Equation (3), ρ 1 , 2 was the corresponding surface relaxivity, S and V were the pore surface and the pore volume.
1 T 1 , 2 = f bulk T 1 , 2 bulk + f surf T 1 , 2 surf
f surf + f bulk = 1
1 T 1 , 2 = ρ 1 , 2 S V + 1 T 1 , 2 bulk ρ 1 , 2 S V

2.4. Methods

The water-to-cement ratio (w/c) was 0.28, with the detailed proportions listed in Table 2. In cement pastes with PCEs, the spectroscopic observation of the liquid water phase was achieved by exploiting T1 relaxometry from the initial time point at 10 min, with intervals of 30 min, to the final time point at 1210 min. The curves of T1 relaxometry were obtained by fitting the magnetization recovery curves with a log-normal distribution of relaxation times. The setting time of cement pastes with PCEs is shown in Figure 2, which was according to GB/T 1346–2011. It could be seen that the setting time of cement pastes were delayed by PCEs.

3. Results and Discussion

T1 relaxometry of cement pastes with PCEs at 10 min, 605 min and 1210 min are shown in Figure 3, Figure 4 and Figure 5, respectively. One can see that there is a main peak in every curve of T1 relaxometry. To be specific, for T1 relaxometry at 10 min in Figure 3, the main peak of plain cement pastes (S00) is shorter than those of cement pastes with PCEs. Among T1 relaxometry of cement pastes with PCEs (S06, S12, S18), the main peak seems to stand at the same time. Furthermore, the main peak of plain cement pastes is obviously lower than those of cement pastes with PCEs. The main peak of S06 (0.06 wt % PCEs) is remarkably lower than those of S12 (0.12 wt % PCEs) and S18(0.18 wt % PCEs), while those of S12 and S18 are nearly the same.
Based on principles of the fast-exchange model [47], any shift of peaks in T1 relaxometry means changes in the motion trail of a proton (or water). T1 relaxometry of plain cement pastes (S00) represents the “normal” motion trails of protons in cement pastes at 10 min. Consequently, the prolonged main peaks of cement pastes with PCEs (S06, S12, S18) reveal that the “normal” motion trails of the protons have already been hindered by the dispersed cement grains due to PCEs.
According to [40,43], this main peak represents the quantity of evaporable water in cement pastes. The lowest main peak of plain cement pastes (S00) equals the smallest quantity of evaporable water left in this sample. The higher main peaks of the cement pastes with PCEs (S06, S12, S18) mean that more evaporable water was left in those samples. In other words, the hydration process in plain cement pastes (S00) exhausted more evaporable water than cement pastes with PCEs.
It can be seen that the main peaks of cement pastes with PCEs (S06, S12, S18) in Figure 4 are all lower and shorter than those in Figure 3. The deepening hydration process is becoming an extensive consumer of evaporable water. Meanwhile, the conglomerating cement hydrates are becoming strong inhibitors of the “normal” motion trail of protons. All of the main peaks of cement pastes (S00, S06, S12, S18) in Figure 5 are shorter than those in Figure 4. As shown by the setting time of cement pastes with PCEs in Figure 2, the hardened cement pastes at 1210 min have controlled the “normal” motion trail of the protons. Larger area ratios of the main peak in Figure 5 may refer to the bleeding situation in some subregions in hardening cement pastes, which has been revealed by T1 relaxometry [48].
The total signal intensity of T1 is proportional to the quantity of evaporable water in cement pastes [49]. It can be found in Figure 6 that the total signal intensity was decreasingly lower from 10 min to 1210 min, which implies the downside of evaporable water in cement pastes. The orders of evaporable water left in cement pastes at three times are opposite to the dosages of PCEs.
The time-dependent evolution of weighted average T1 is shown in Figure 7. It is shown that the time evolution of the weighted average T1 of cement pastes with PCEs has decreased successively. The time-dependent evolution of T1 has been described according to the four-stage hydration mechanism of tricalcium silicate (3CaO.SiO2, C3S), which occupies 50 wt % to 70 wt % in clinkers [50].
The first stage of C3S hydration is the initial period, which is within 15 min. The initial period in Figure 7 is only 5 min. During the initial period, the original hydration products form gelatinous coatings surrounding cement grains. The entire proton magnetization relaxes with a common T1, which is due to the fast exchange between water spins in the various environments. The fast exchange may maintain the apparent relaxation homogeneity because of the fluidity of the gelatinous coating and the permeability of the gel–liquid interface [35]. Therefore, the weighted average T1 of each sample (S00, S06, S12, S18) seems unchanged from 10 min to 15 min in Figure 7. There are still some differences among the initial values of weighted average T1 at 10 min. The order of these initial values is against the dosages of PCEs. The order of weighted average T1 at 10 min is the feedback to gelatinous coatings thickness of cement hydrates, which has means that the coatings of hydrates in plain cement pastes were the thickest.
The second stage of C3S hydration is the slow-reaction (dormant) period, which is from 15 min to 120 min. During the dormant period, the weighted average T1 of each sample (S00, S06, S12, S18) decreased slowly (Figure 7). The fast exchange of water was hindered by the newly formed hydrates coatings. Therefore, the decline of weighted average T1 occurred, which was shown by comparisons of proton magnetization fractions and relaxation times of H2O, Ca(OH)2 and C-S-H gel [40]. The third stage of C3S hydration is the accelerated period, which is from 120 min to 1210 min. During the accelerated period, the weighted average T1 of each sample (S00, S06, S12, S18) has decreased sharply. The fast exchange of water was heavily hindered by thickening hydrates coatings. The weighted average T1 of each sample may be regarded as the reverse translation of resistance to the fast exchange of water.
Why does the weighted average T1 of S18 (most PCEs) have the biggest value during the whole timeline? Based on T2 relaxometry of cement pastes with PCEs [51], dispersion mechanism of PCEs in OPC [52], the effects of PCEs on C3A/gypsum [53], the bleeding condition of fresh cement pastes caused by PCEs [54], this answer would come from two aspects: (1) retardation of PCEs on cement hydration; (2) dispersion effects of PCEs on cement grains.

4. Conclusions

(1)
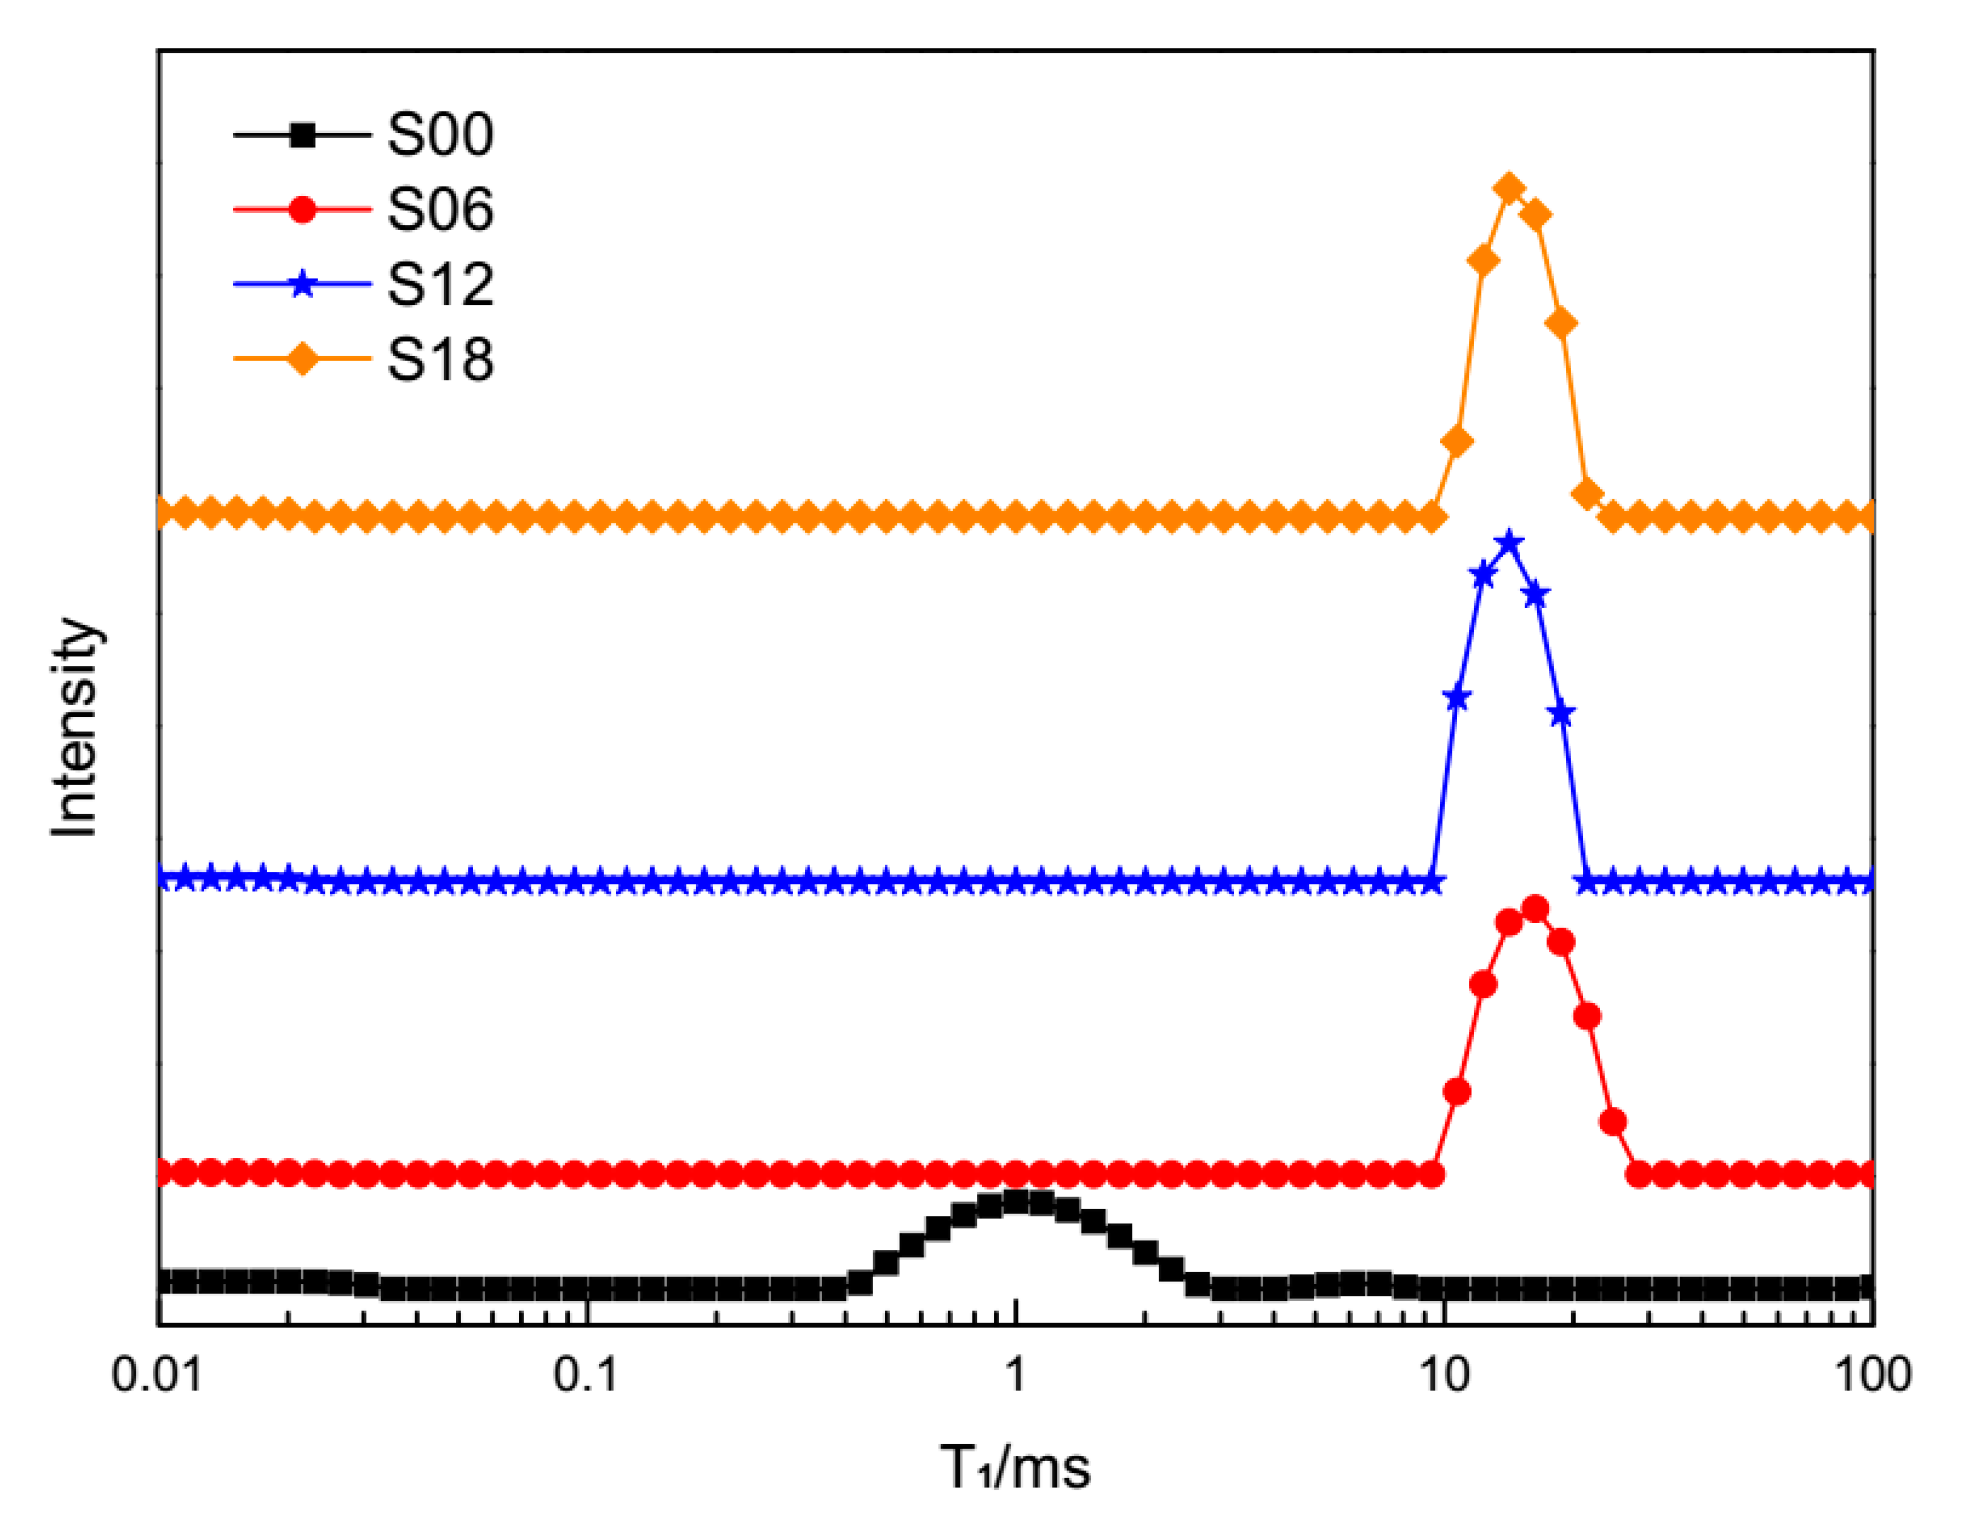
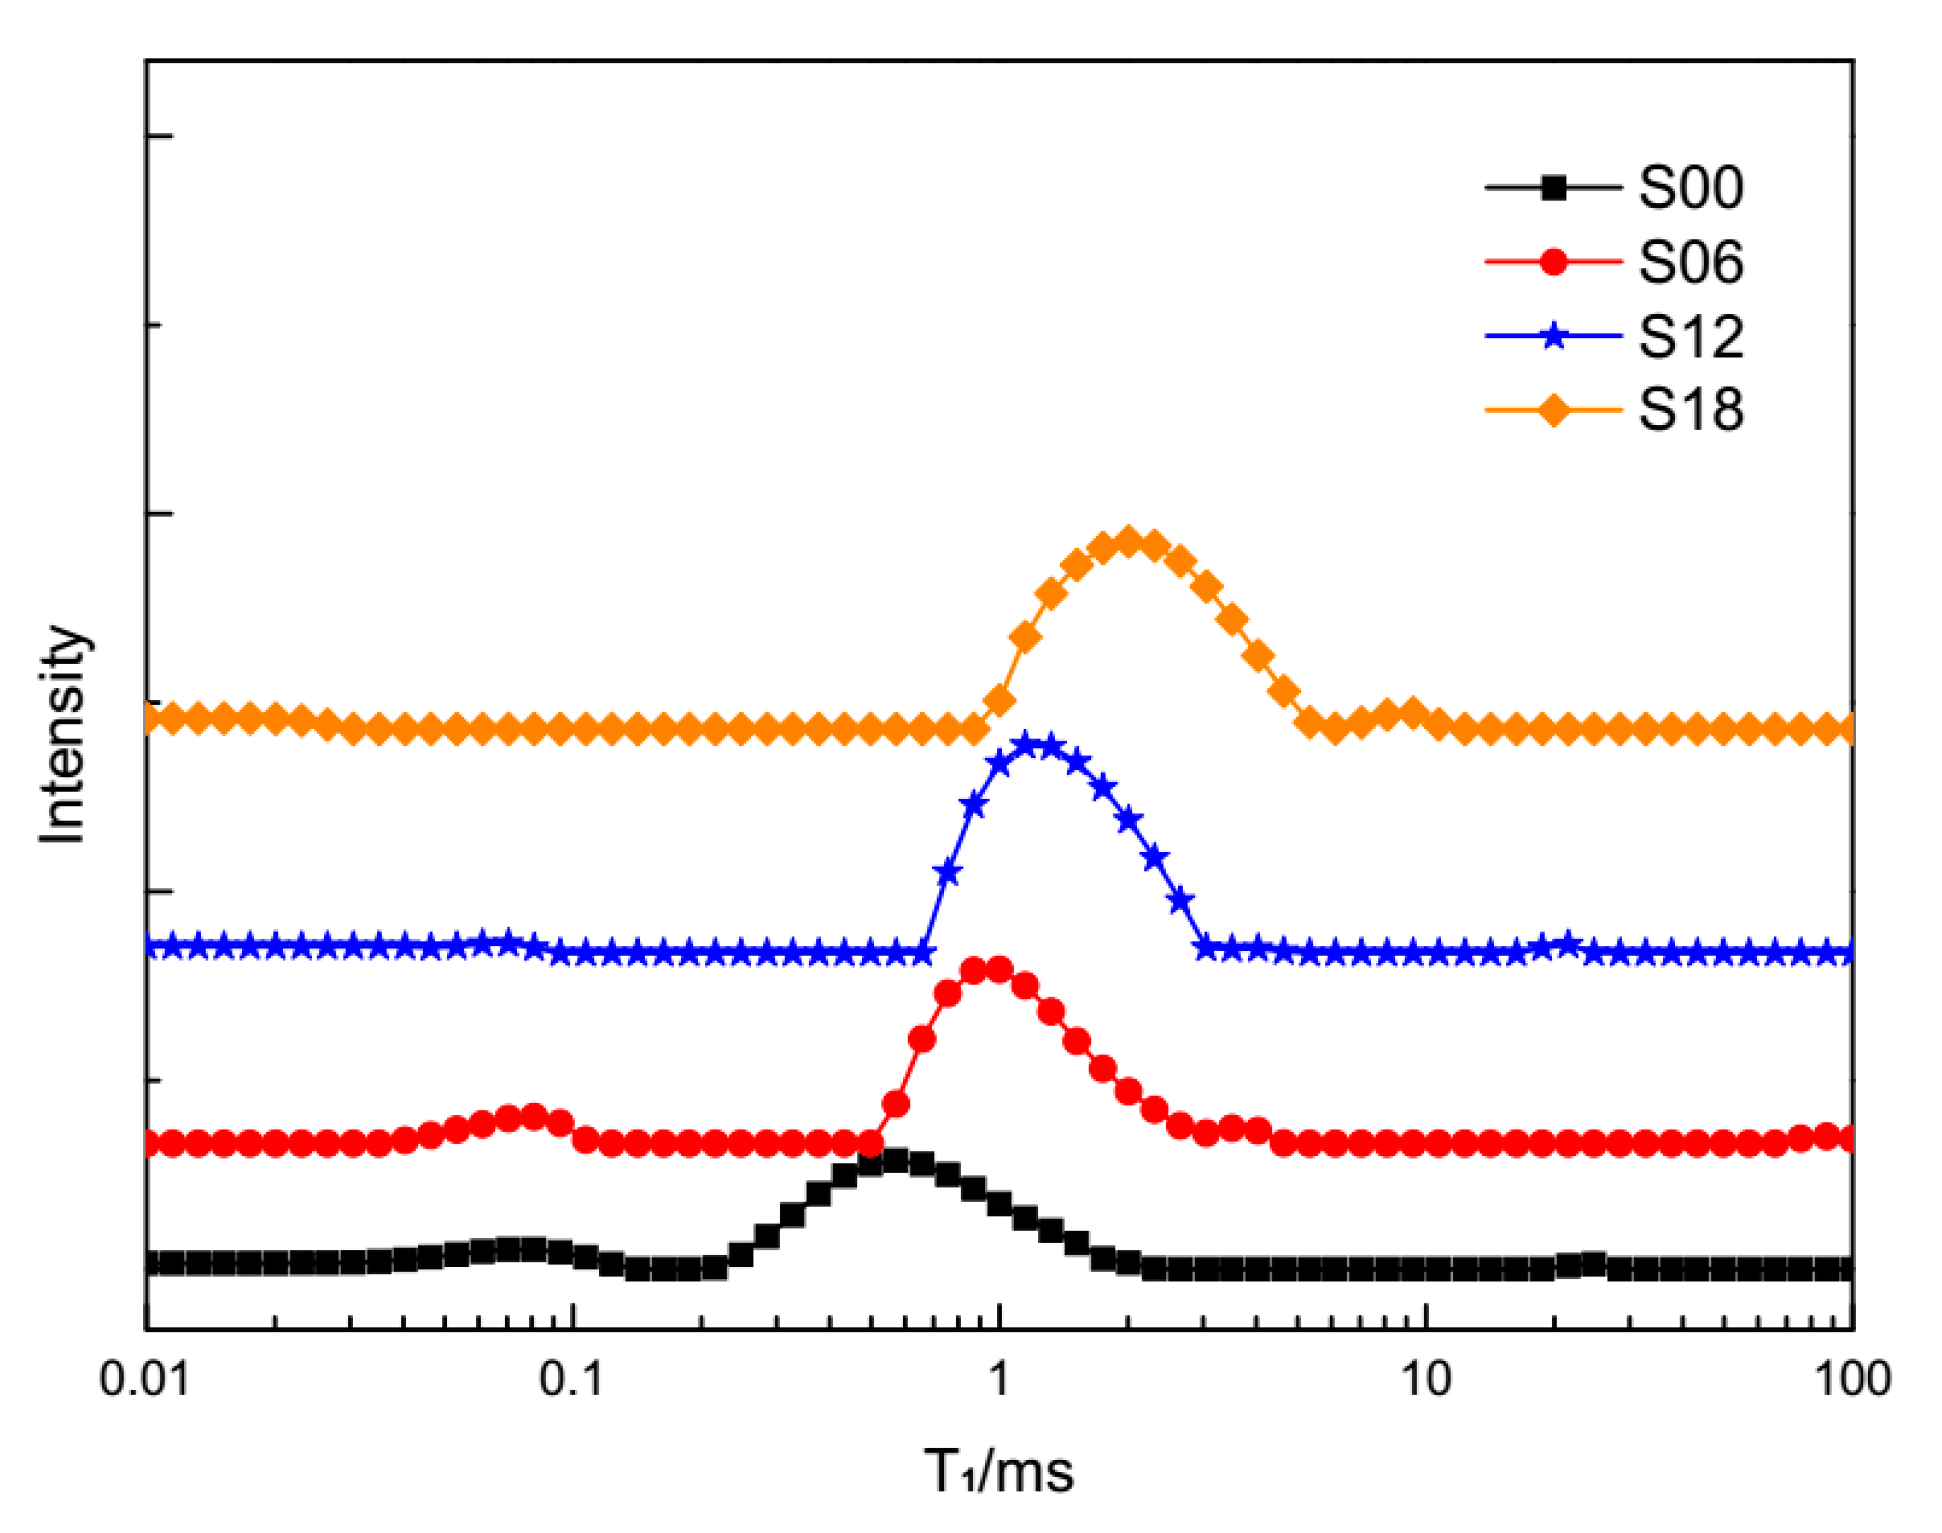
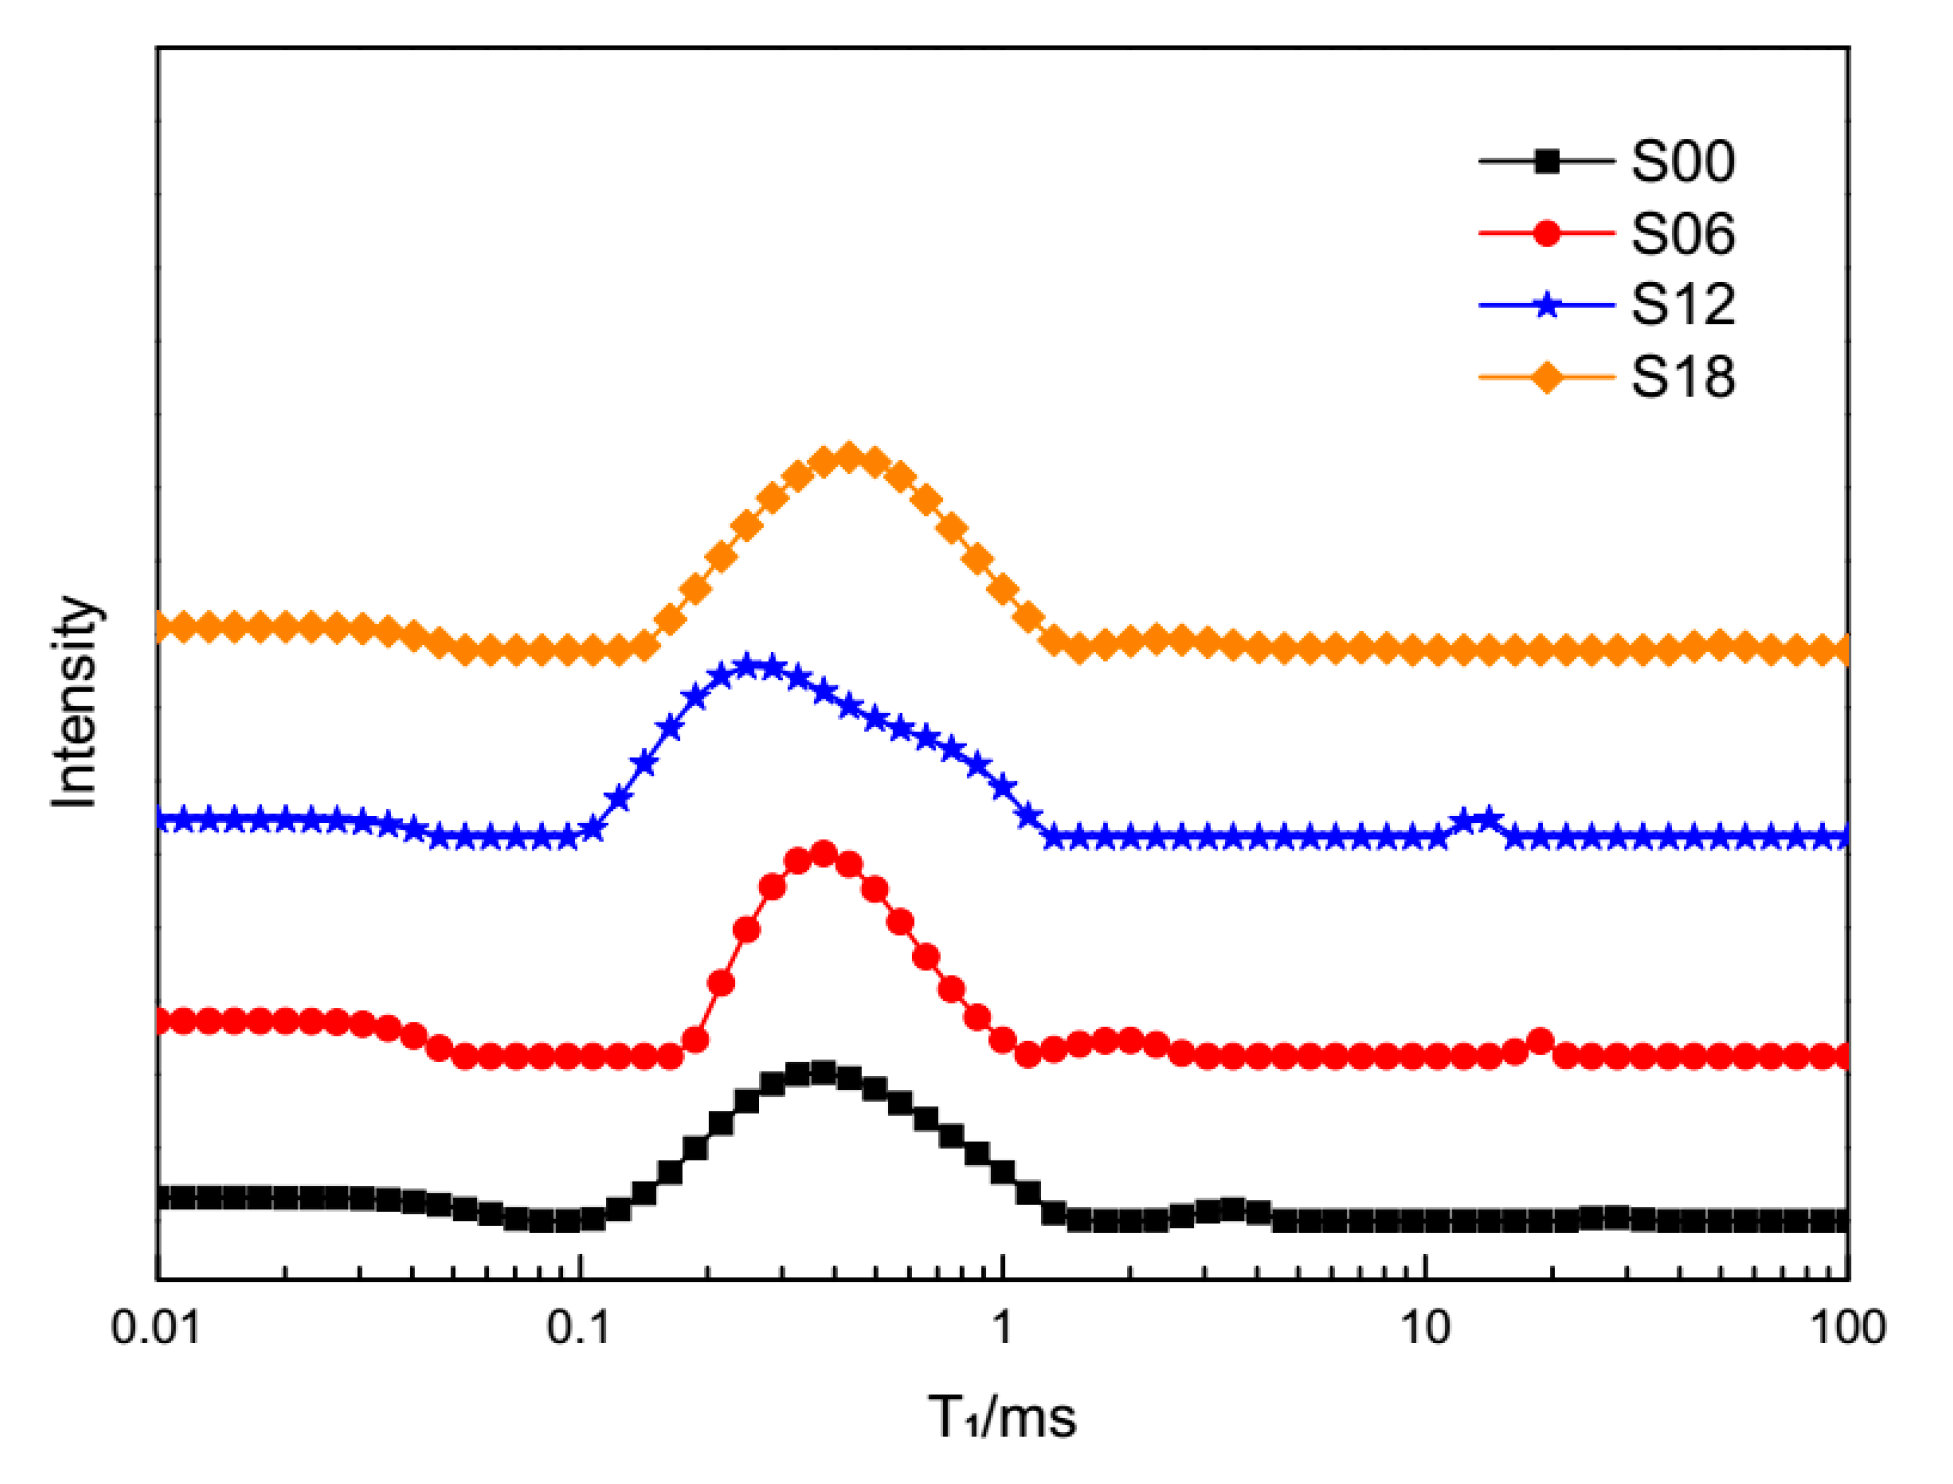
The main peak in the T1 relaxometry of cement pastes at the hydration times of 10 min, 605 min and 1210 min was delayed by polycarboxylate superplasticizers (PCEs). The delayed intensity correlated to the dosage of PCEs. The main peak in T1 relaxometry of cement pastes became shorter along with the hydration times from 10 min to 1210 min;
(2)
The height of the main peak in T1 relaxometry of cement pastes at these three times was decreased by PCEs. In addition to the larger area ratios of the main peak in T1 relaxometry of cement pastes at the hydration time of 1210 min due to bleeding, the decreased intensity correlated to the dosage of PCEs:
(3)
The main peak in T1 relaxometry of cement pastes represented the quantity of evaporable water in cement pastes. The delaying situation and the decreasing situation of the main peak was due to the dispersion mechanism and the retardation mechanism of PCEs on cement grains;
(4)
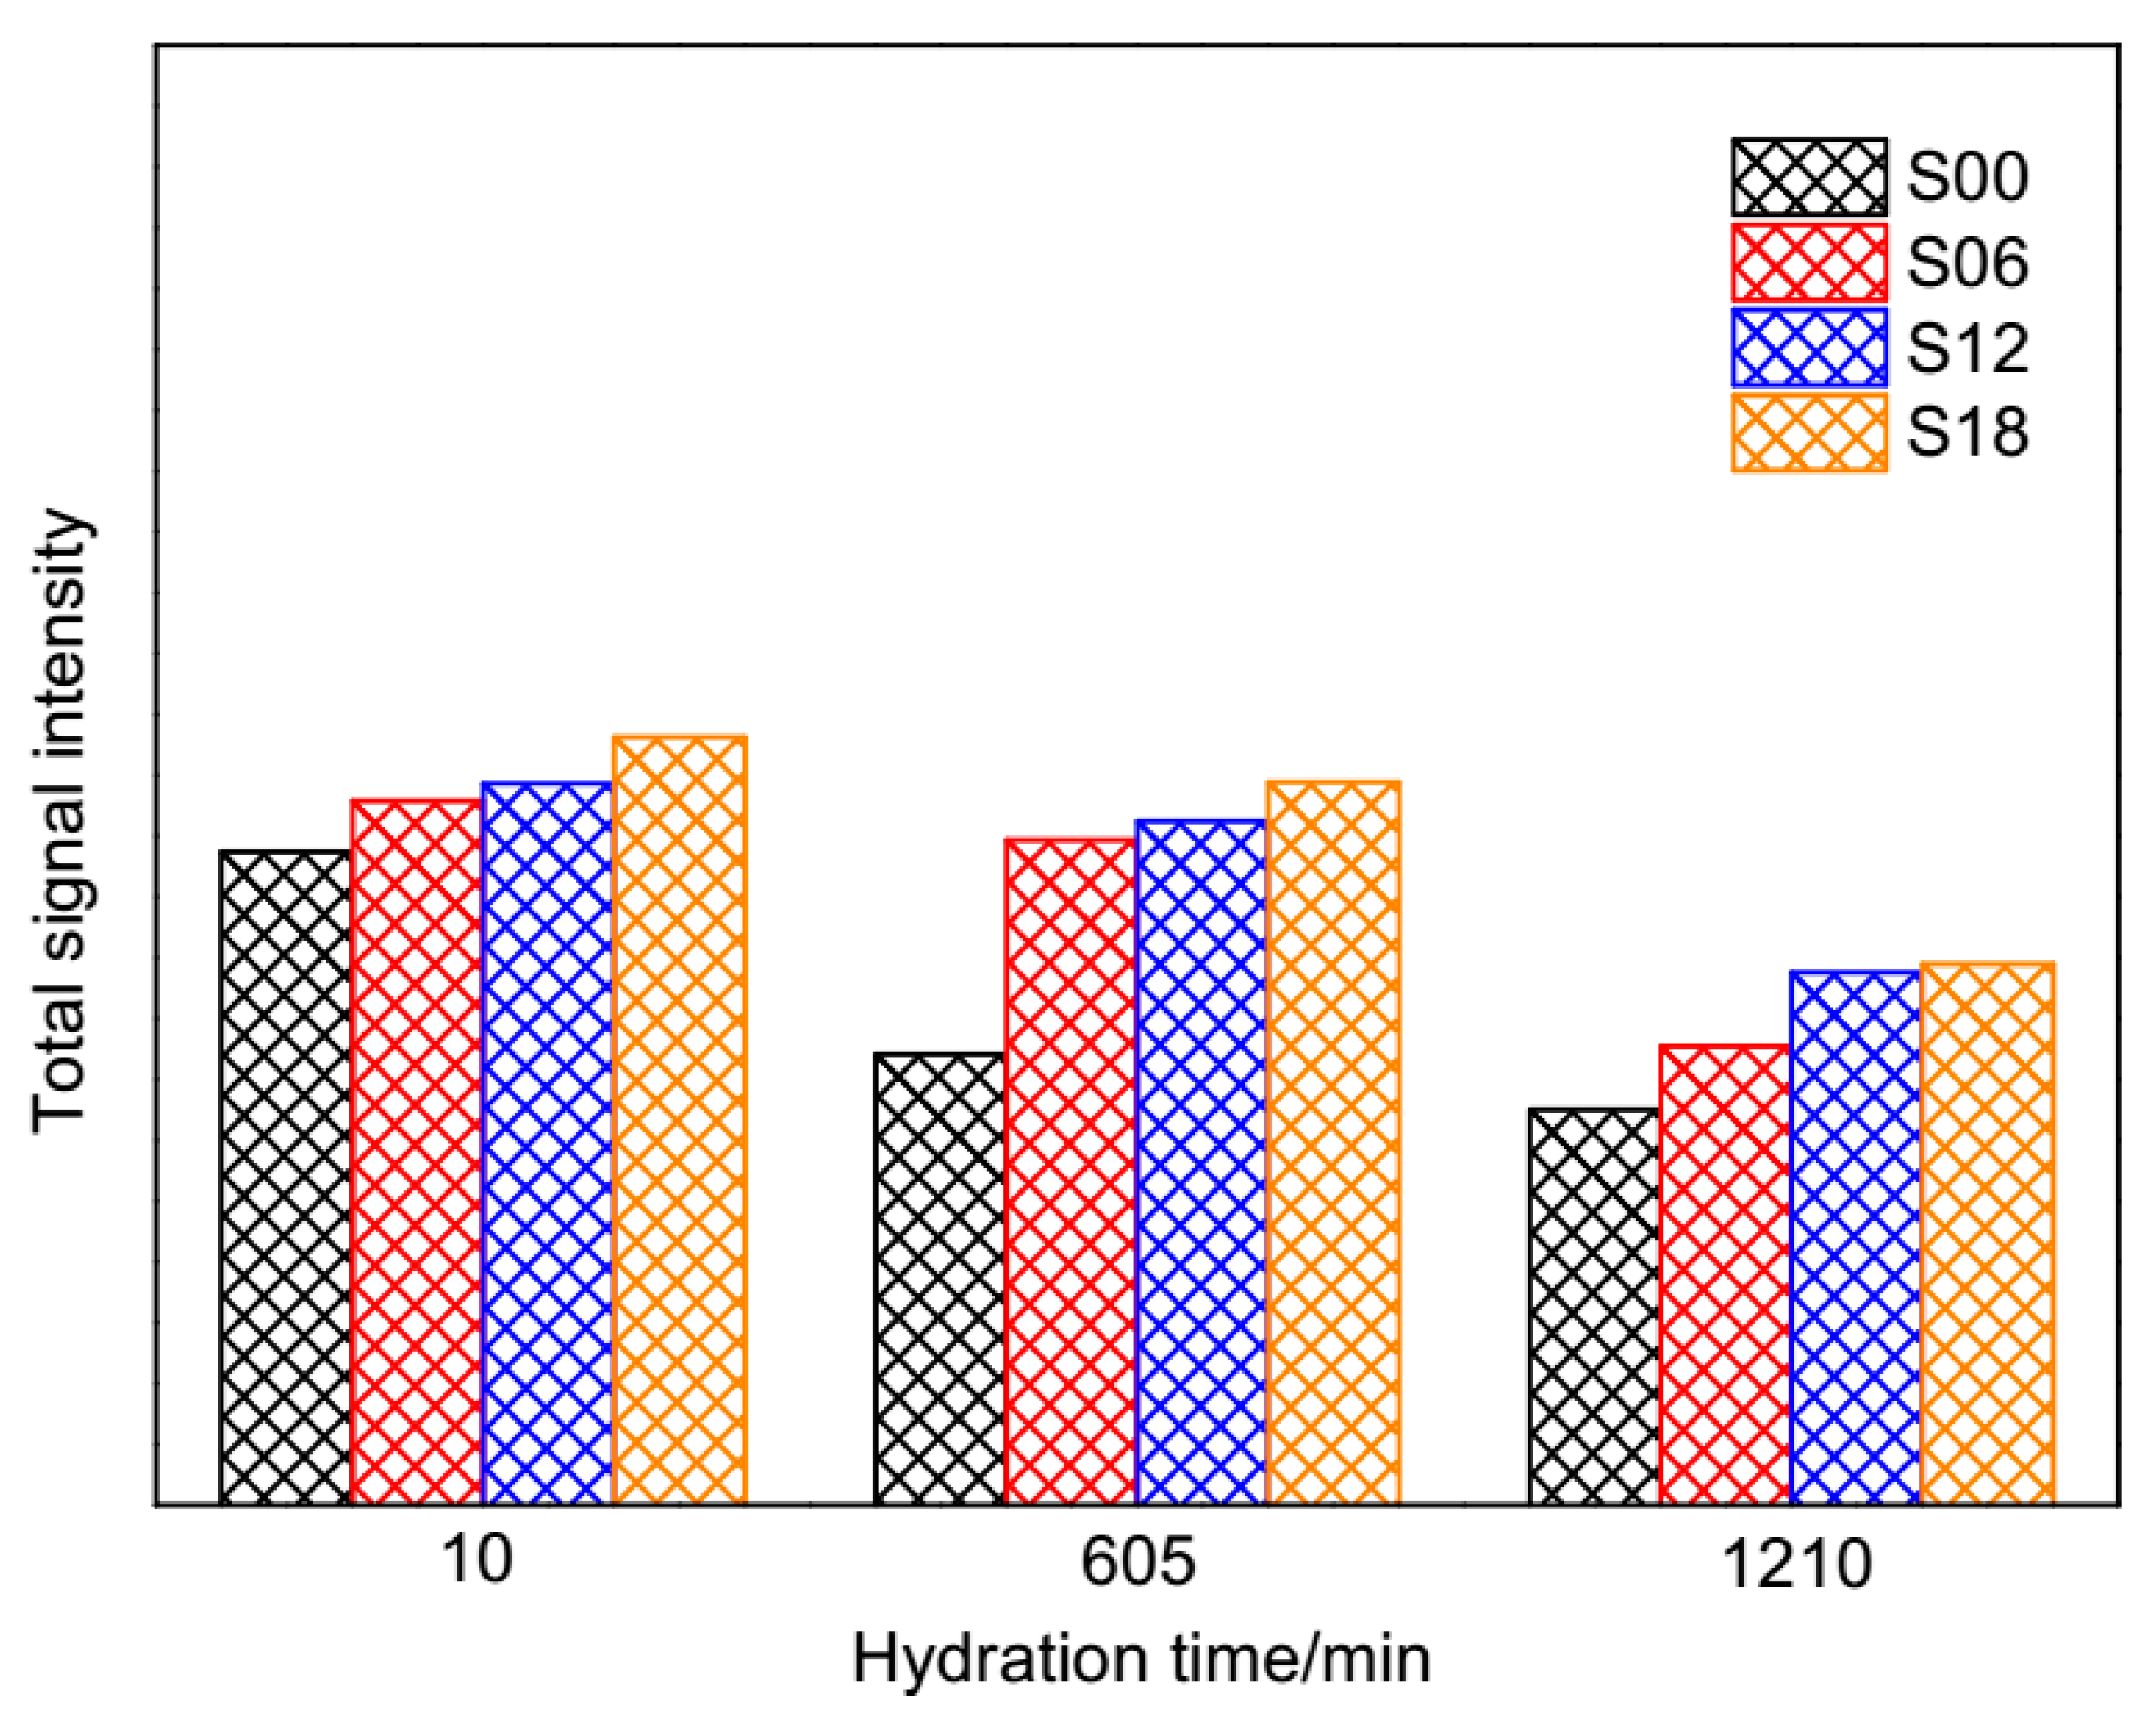
The total signal intensity of T1 of cement pastes at these three times was increased by PCEs. The increasing intensity correlated to the dosage of PCEs. The total signal intensity of T1 of cement pastes became smaller during the hydration process. As this intensity was proportional to the quantity of evaporable water, its changes mirrored disturbances of PCEs to situations of evaporable water in the hydration process;
(5)
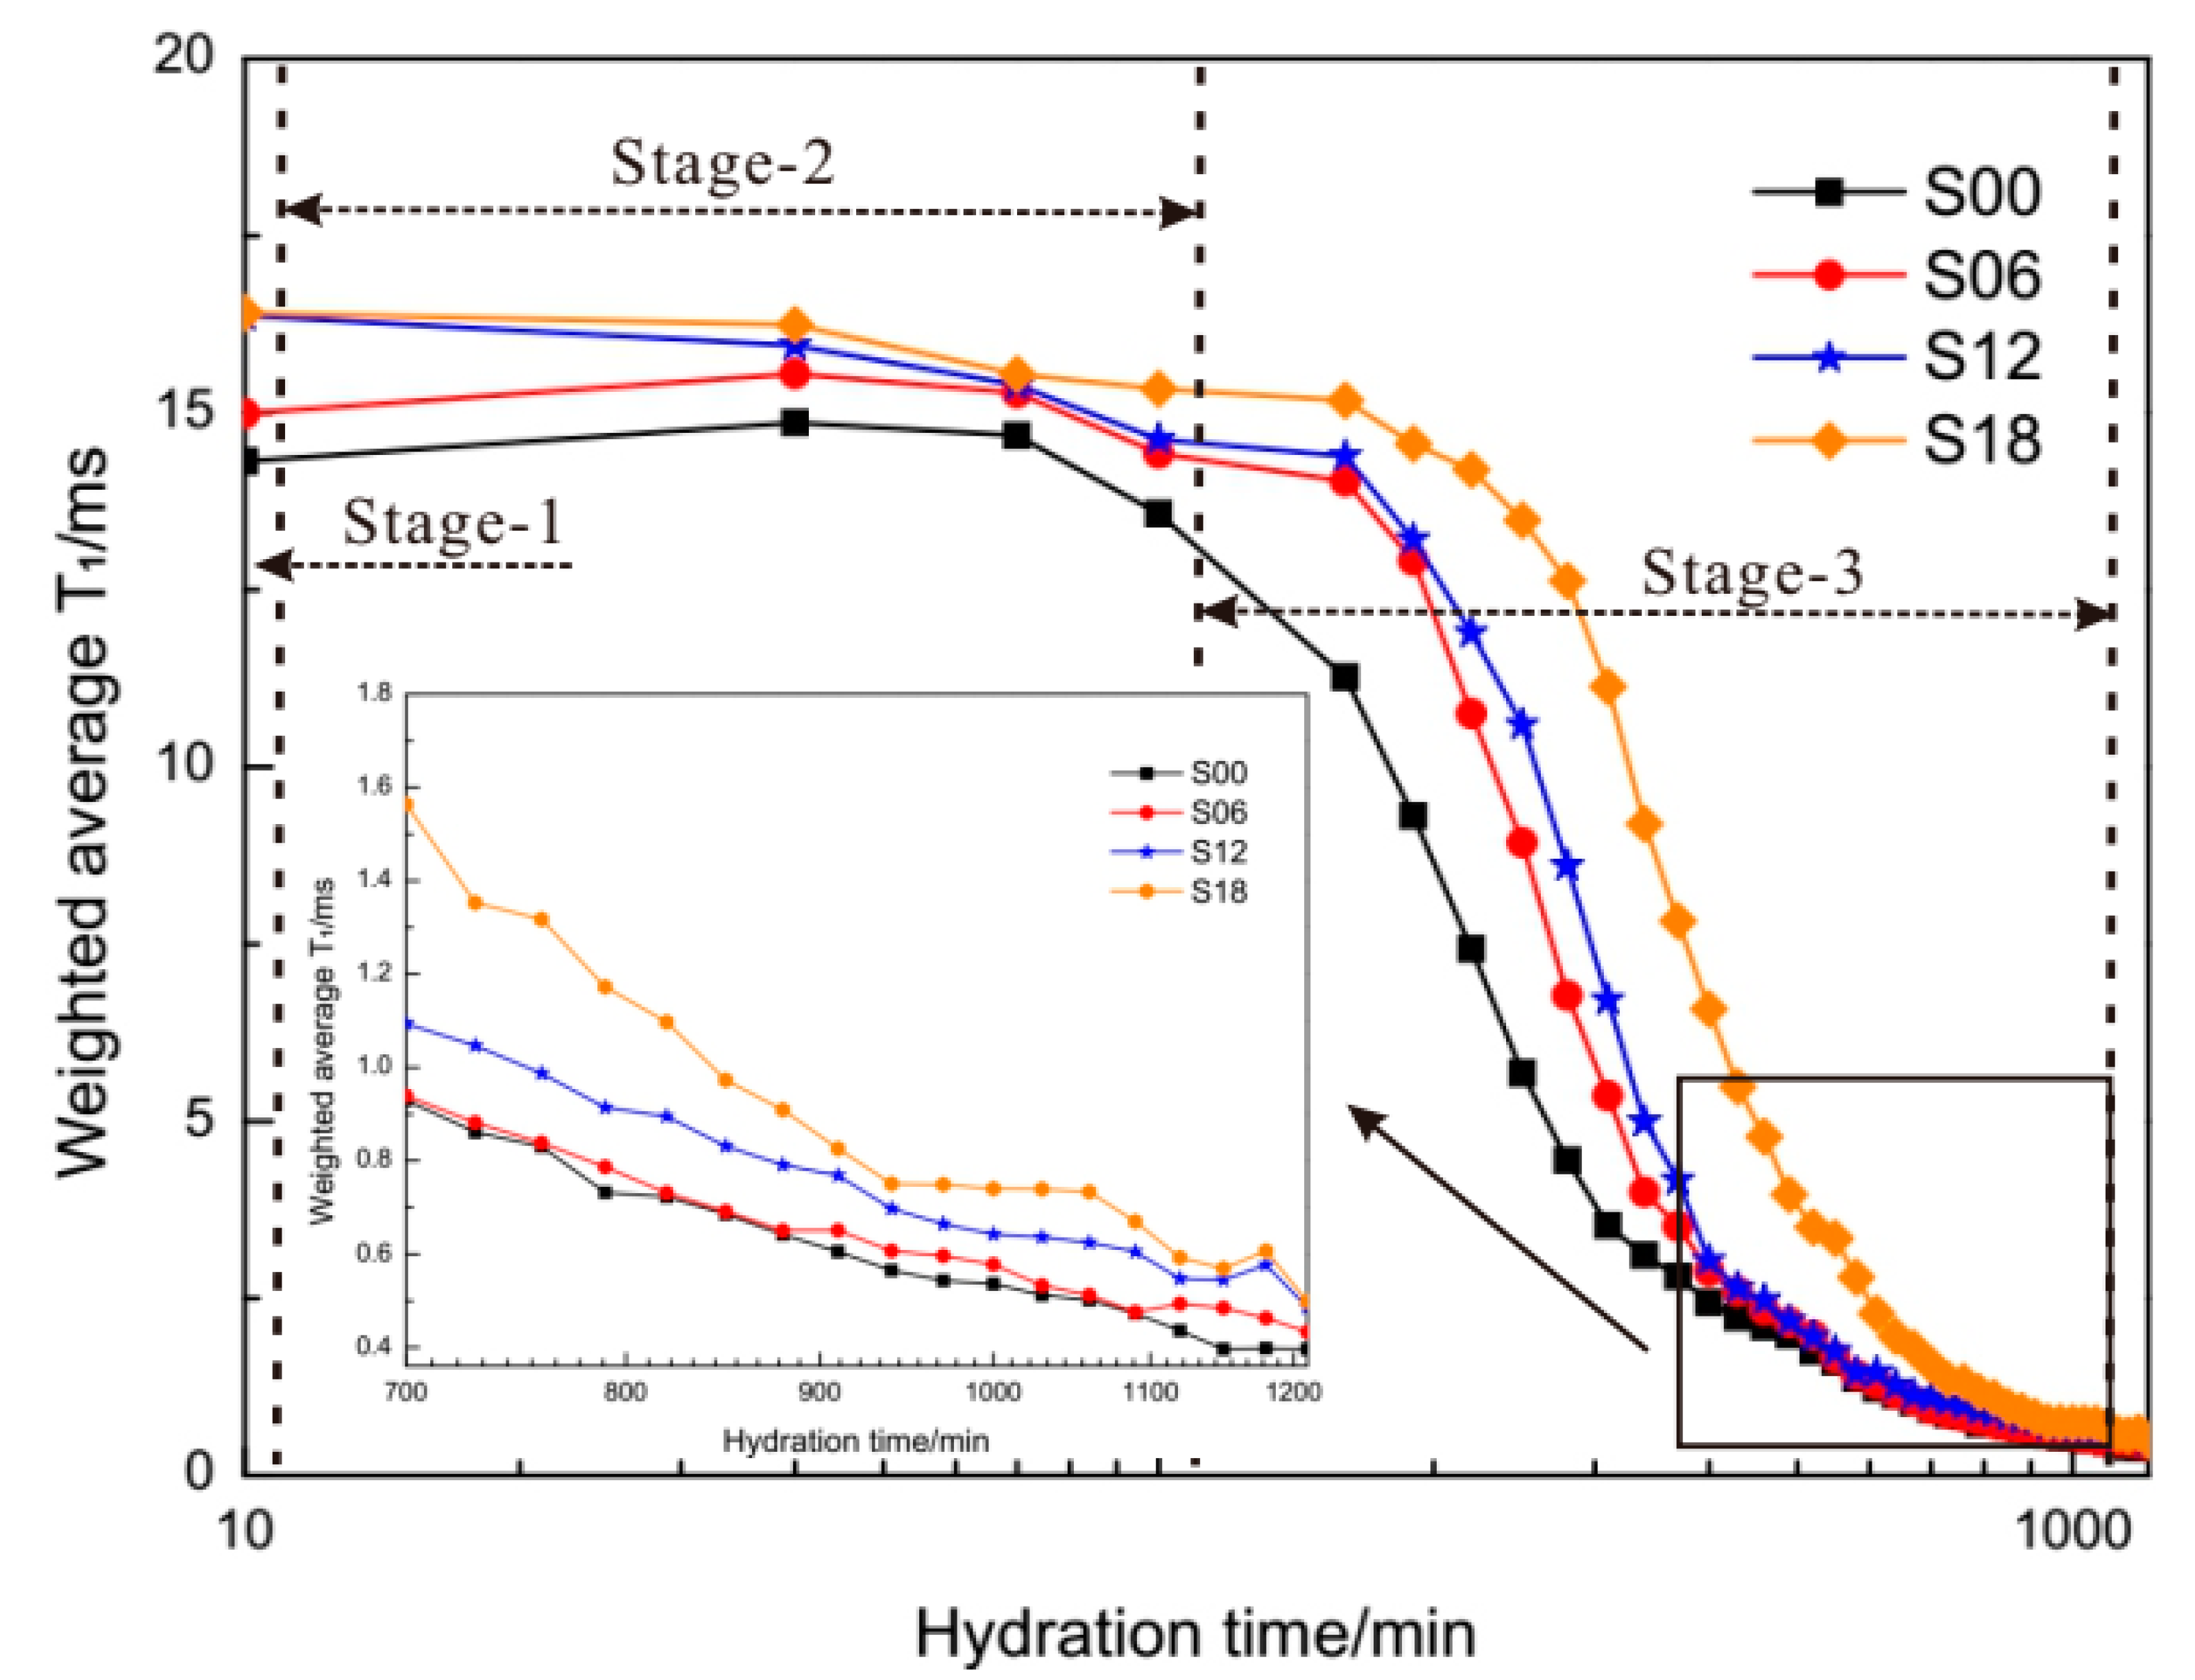
The time-dependent evolution of weighted average T1 of cement pastes from 10 min to 1210 min was elevated by PCEs. The elevated intensity correlated to the dosage of PCEs. The curves of weighted average T1 of cement pastes were well followed by the four-stage hydration mechanism of tricalcium silicate.

Author Contributions

M.P. and Z.S. conceived the project, M.P., Q.L. and Y.J. performed the experiments, M.P., Q.L. and Y.J. carried out the equipment, M.P. wrote the manuscript with the supervision of Z.S. All authors have read and agreed to the published version of the manuscript.

Funding

The authors want to acknowledge the financial support provided by the China National Key R&D Program during the 13th Five-year Plan Period (2016YFC0701004), and Shanghai “Alliance Plan” Project in 2019 (LM201947), the Science and Technology Commission of Shanghai Municipality (19DZ1201404, 19DZ1202702) and the Gansu science and technology-funded project (19YF3GA004). The project is also supported by the Key Laboratory of Advanced Civil Engineering Materials (Tongji University), Ministry of Education.

Conflicts of Interest

The authors declare no conflict of interest.

References

  1. Bloch, F.; Hansen, W.W.; Packard, M.E. Nuclear induction. Phys. Rev. 1946, 69, 127. [Google Scholar] [CrossRef] [Green Version]
  2. Purcell, E.M.; Torrey, H.C.; Pound, R.V. Resonance absorption by nuclear magnetic moments in a solid. Phys. Rev. 1946, 69, 37. [Google Scholar] [CrossRef]
  3. Faux, D.A.; McDonald, P.J. Nuclear-magnetic-resonance relaxation rates for fluid confined to closed, channel, or planar pores. Phys. Rev. E. 2018, 98, 063110. [Google Scholar] [CrossRef]
  4. Korb, J.P. Nuclear magnetic relaxation of liquids in porous media. New J. Phys. 2011, 13, 035016. [Google Scholar] [CrossRef] [Green Version]
  5. Monteilhet, L.; Korb, J.P.; Mitchell, J.; McDonald, P.J. Observation of exchange of micropore water in cement pastes by two-dimensional T2-T2 nuclear magnetic resonance relaxometry. Phys. Rev. E 2006, 74, 061404. [Google Scholar] [CrossRef] [PubMed] [Green Version]
  6. Valori, A.; Rodin, V.; McDonald, P.J. On the interpretation of 1H 2-dimensional NMR relaxation exchange spectra in cements: Is there exchange between pores with two characteristic sizes or Fe3+concentrations? Cem. Concr. Res. 2010, 40, 1375–1377. [Google Scholar] [CrossRef] [Green Version]
  7. Gajewicz-Jaromin, A.M.; McDonald, P.J.; Muller, A.C.A.; Scrivener, K.L. Influence of curing temperature on cement paste microstructure measured by 1H NMR relaxometry. Cem. Concr. Res. 2019, 122, 147–156. [Google Scholar] [CrossRef]
  8. McDonald, P.J.; Istok, O.; Janota, M.; Gajewicz-Jaromin, A.M.; Faux, D.A. Sorption, anomalous water transport and dynamic porosity in cement paste: A spatially localized 1H NMR relaxation study and a proposed mechanism. Cem. Concr. Res. 2020, 133, 106045. [Google Scholar] [CrossRef]
  9. Holthausen, R.S.; McDonald, P.J. On the quantifcation of solid phases in hydrated cement paste by 1H nuclear magnetic resonance relaxometry. Cem. Concr. Res. 2020, 135, 106095. [Google Scholar] [CrossRef]
  10. Olaru, A.M.; Blümich, B.; Adams, A. Water transport in cement-in-polymer dispersions at variable temperature studied by magnetic resonance imaging. Cem. Concr. Res. 2013, 44, 55–68. [Google Scholar] [CrossRef]
  11. Brocken, H.J.P.; Spiekman, M.E.; Pel, L.; Kopinga, K.; Larbi, J.A. Water extraction out of mortar during brick laying: An NMR study. Mater. Struct. 1998, 31, 49–57. [Google Scholar] [CrossRef]
  12. Wyrzykowski, M.; Gajewicz-Jaromin, A.M.; McDonald, P.J.; Dunstan, D.J.; Scrivener, K.L.; Lura, P. Water redistribution-microdiffusion in cement paste under mechanical loading evidenced by 1H NMR. J. Phys. Chem. C 2019, 123, 16153–16163. [Google Scholar] [CrossRef] [Green Version]
  13. Wyrzykowski, M.; McDonald, P.J.; Scrivener, K.L.; Lura, P. Water redistribution within the microstructure of cementitious materials due to temperature changes studied with 1H NMR. J. Phys. Chem. C 2017, 121, 27950–27962. [Google Scholar] [CrossRef] [Green Version]
  14. Saoût, G.L.; Lécolier, E.; Rivereau, A.; Zanni, H. Micropore size analysis in oil-well cement by proton nuclear relaxation. Magn. Reson. Imaging 2005, 23, 371–373. [Google Scholar] [CrossRef]
  15. Plassais, A.; Pomiès, M.P.; Lequeux, N.; Boch, P.; Korb, J.P. Micropore size analysis in hydrated cement paste by NMR. Magn. Reson. Imaging 2001, 19, 493–495. [Google Scholar] [CrossRef]
  16. Plassais, A.; Pomiès, M.P.; Lequeux, N.; Boch, P.; Korb, J.P.; Petit, D.; Barberon, F. Micropore size analysis by NMR in hydrated cement. Magn. Reson. Imaging 2003, 21, 369–371. [Google Scholar] [CrossRef]
  17. Zhou, C.S.; Ren, F.Z.; Zeng, Q.; Xiao, L.Z.; Wang, W. Pore-size resolved water vapor adsorption kinetics of white cement mortars as viewed from proton NMR relaxation. Cem. Concr. Res. 2018, 105, 31–43. [Google Scholar] [CrossRef]
  18. Nunes, C.; Pel, L.; Kunecký, J.; Slížková, Z. The influence of the pore structure on the moisture transport in lime plaster-brick systems as studied by NMR. Constr. Build. Mater. 2017, 142, 395–409. [Google Scholar] [CrossRef]
  19. Schönfelder, W.; Dietrich, J.; Märten, A.; Koping, K.; Stallmach, F. NMR studies of pore formation and water diffusion in self-hardening cut-off wall materials. Cem. Concr. Res. 2007, 37, 902–908. [Google Scholar] [CrossRef]
  20. Cano-Barrita, P.F.d.J.; Balcom, B.J.; Castellanos, F. Carbonation front in cement paste detected by T2 NMR measurements using a low field unilateral magnet. Mater. Struct. 2017, 50, 150. [Google Scholar] [CrossRef] [Green Version]
  21. Bortolotti, V.; Brizi, L.; Brown, R.J.S.; Fantazzini, P.; Mariani, M. Nano and sub-nano multiscale porosity formation and other features revealed by 1H NMR relaxometry during cement hydration. Langmuir 2014, 30, 10871–10877. [Google Scholar] [CrossRef] [PubMed]
  22. Youssef, M.; Pellenq, R.J.M.; Yildiz, B. Glassy nature of water in an ultraconfining disordered material: The case of calcium-silicate-hydrate. J. Am. Chem. Soc. 2011, 133, 2499–2510. [Google Scholar] [CrossRef] [PubMed]
  23. Mcdonald, P.J.; Rodin, V.; Valori, A. Characterisation of intra- and inter-C–S–H gel pore water in white cement based on an analysis of NMR signal amplitudes as a function of water content. Cem. Concr. Res. 2010, 40, 1656–1663. [Google Scholar] [CrossRef] [Green Version]
  24. Fischer, N.; Haerdtl, R.; McDonald, P.J. Observation of the redistribution of nanoscale water filled porosity in cement based materials during wetting. Cem. Concr. Res. 2015, 40, 148–155. [Google Scholar] [CrossRef] [Green Version]
  25. Cong, X.Y.; Zhou, W.; Geng, X.R.; Elchalakani, M. Low field NMR relaxation as a probe to study the effect of activators and retarders on the alkali-activated GGBFS setting process. Cem. Concr. Compos. 2019, 104, 103399. [Google Scholar] [CrossRef]
  26. Faure, P.; Peter, U.; Lesueur, D.; Coussot, P. Water transfers within hemp lime concrete followed by NMR. Cem. Concr. Res. 2012, 42, 1468–1474. [Google Scholar] [CrossRef]
  27. Yang, J.B.; Sun, Z.P.; Zhao, Y.H.; Ji, Y.L.; Li, B.Y. The water absorption-release of superabsorbent polymers in fresh cement paste: An NMR study. J. Adv. Concr. Technol. 2020, 18, 139–145. [Google Scholar] [CrossRef] [Green Version]
  28. Patural, L.; Korb, J.P.; Govin, A.; Grosseau, P.; Ruot, B.; Devès, O. Nuclear magnetic relaxation dispersion investigations of water retention mechanism by cellulose ethers in mortars. Cem. Concr. Res. 2012, 42, 1371–1378. [Google Scholar] [CrossRef] [Green Version]
  29. Cheumani, Y.A.M.; Ndikontar, M.; De Jéso, B.; Sèbe, G. Probing of wood–cement interactions during hydration of wood–cement composites by proton low-field NMR relaxomet. J. Mater. Sci. 2011, 46, 1167–1175. [Google Scholar] [CrossRef]
  30. Martini, F.; Borsacchi, S.; Geppi, M.; Tonelli, M.; Ridi, F.; Calucci, L. Monitoring the hydration of MgO-based cement and its mixtures with portland cement by 1H NMR relaxometry. Microporous Mesoporous Mater. 2018, 269, 26–30. [Google Scholar] [CrossRef]
  31. Dalas, F.; Korb, J.P.; Pourchet, S.; Nonat, A.; Rinaldi, D.; Mosquet, M. Surface relaxivity of cement hydrates. J. Phys. Chem. C 2014, 118, 8387–8396. [Google Scholar] [CrossRef]
  32. Gran, H.C.; Hansen, E.W. Effects of drying and freeze/thaw cycling probed by 1H-NMR. Cem. Concr. Res. 1997, 27, 1319–1331. [Google Scholar] [CrossRef]
  33. Blinc, R.; Burgar, M.; Lahajnar, G.; Rožmarin, M.; Rutar, V.; Kocuvan, I.; Uršič, J. NMR relaxation study of adsorbed water in cement and C3S pastes. J. Am. Ceram. Soc. 1978, 61, 35–37. [Google Scholar] [CrossRef]
  34. Barbič, L.; Kocuvan, I.; Blinc, R.; Lahajnar, G.; Merljak, P.; Zupančič, I. The determination of surface development in cement pastes by nuclear magnetic resonance. J. Am. Ceram. Soc. 1982, 65, 25–31. [Google Scholar] [CrossRef]
  35. Schreiner, L.J.; Mactavish, J.C.; Miljkovic, L.; Pintar, M.M.; Blinc, R.; Lahajnar, G.; Lasic, D.; Reeves, L.W. NMR line shape-spin-lattice relaxation correlation study of portland cement hydration. J. Am. Ceram. Soc. 1985, 68, 10–16. [Google Scholar] [CrossRef]
  36. Mactavish, J.C.; Miljkovic, L.; Pintar, M.M.; Blinc, R.; Lahajnar, G. Hydration of white cement by spin grouping NMR. Cem. Concr. Res. 1985, 15, 367–377. [Google Scholar] [CrossRef]
  37. Miljkovic, L.; Mactavish, J.C.; Jian, J.; Pintar, M.M.; Blinc, R.; Lahajnar, G. NMR study of sluggish hydration of superplasticized white cement. Cem. Concr. Res. 1986, 16, 864–870. [Google Scholar] [CrossRef]
  38. Lasic, D.D.; Corbett, J.M.; Jian, J.; Mactavish, J.C.; Pintar, M.M.; Blinc, R.; Lahajnar, G. NMR spin grouping in hydrating cement at 200 MHz. Cem. Concr. Res. 1988, 18, 649–653. [Google Scholar] [CrossRef]
  39. Blinc, R.; Lahajnar, G.; Žumer, S.; Pintar, M.M. NMR study of the time evolution of the fractal geometry of cement gels. Phys. Rev. B 1988, 38, 2873–2875. [Google Scholar] [CrossRef]
  40. Mactavish, J.C.; Miljkovic, L.; Peemoeller, H.; Corbett, J.M.; Jian, J.; Lasic, D.D.; Blinc, R.; Lahajnar, G.; Milia, F.; Pintar, M.M. Nuclear magnetic resonance study of hydration of synthetic white cement: Continuous quantitative monitoring of water and Ca(OH)2 during hydration. Adv. Cem. Res. 1996, 32, 155–161. [Google Scholar] [CrossRef]
  41. Kosmač, T.; Lahajnar, G.; Sepe, A. Proton NMR relaxation study of calcium aluminate hydration reactions. Cem. Concr. Res. 1993, 23, 1–6. [Google Scholar] [CrossRef]
  42. Dolinšek, J.; Apih, T.; Lahajnar, G.; Blinc, R.; Papavassiliou, G.; Pintar, M.M. Two-dimensional nuclear resonance study of a hydrated porous medium: And application to white cement. J. Appl. Phys. 1998, 87, 3535–3540. [Google Scholar] [CrossRef]
  43. Apih, T.; Lahajnar, G.; Sepe, A.; Blinc, R.; Milia, F.; Cvelbar, R.; Emri, I.; Gusev, B.V.; Titova, L.A. Proton spin–lattice relaxation study of the hydration of self-stressed expansive cement. Cem. Concr. Res. 2001, 31, 263–269. [Google Scholar] [CrossRef]
  44. Tritt-Goc, J.; Kościelski, S.; Piślewski, N. The hardening of portland cement observed by 1H spin-lattice relaxation and single-point imaging. Appl. Magn. Reson. 2000, 18, 155–164. [Google Scholar] [CrossRef]
  45. Nestle, N.; Zimmermann, C.; Dakkouri, M.; Kärger, J. Transient high concentrations of chain anions in hydrating cement—Indications from proton spin relaxation measurements. J. Phys. D Appl. Phys. 2002, 35, 166–171. [Google Scholar] [CrossRef]
  46. Sun, Z.P.; Yang, H.J.; Shui, L.L.; Liu, Y.; Yang, X.; Ji, Y.L.; Hu, K.Y.; Luo, Q. Preparation of polycarboxylate-based grinding aid and its influence on cement properties under laboratory condition. Constr. Build. Mater. 2016, 127, 363–368. [Google Scholar] [CrossRef]
  47. Korb, J.P. NMR and nuclear spin relaxation of cement and concrete materials. Curr. Opin. Colloid Interface Sci. 2009, 14, 192–202. [Google Scholar] [CrossRef]
  48. Ji, Y.L.; Pel, L.; Sun, Z.P. The microstructure development during bleeding of cement paste: An NMR study. Cem. Concr. Res. 2019, 125, 105866. [Google Scholar] [CrossRef]
  49. She, A.M.; Yao, W.; Wei, Y.Q. In-situ monitoring of hydration kinetics of cement pastes by low-field NMR. J. Wuhan Univ. Technol.-Mater. Sci. Ed. 2010, 25, 692–695. [Google Scholar] [CrossRef]
  50. Odler, I. Chapter-6: Hydration, Setting and Hardening of Portland Cement. In Lea’s Chemistry of Cement and Concrete, 4th ed.; Hewlett, P., Ed.; Elsevier Science & Technology Books: London, UK, 2004; pp. 241–297. [Google Scholar]
  51. Yu, Y.; Sun, Z.P.; Pang, M.; Yang, P.Q. Probing development of microstructure of early cement paste using 1H low-field NMR. J. Wuhan Univ. Technol.-Mater. Sci. Ed. 2013, 28, 963–967. [Google Scholar] [CrossRef]
  52. Shui, L.L.; Sun, Z.P.; Yang, H.J.; Yang, X.; Ji, Y.L.; Luo, Q. Experimental evidence for a possible dispersion mechanism of polycarboxylate-type superplasticisers. Adv. Cem. Res. 2016, 28, 287–297. [Google Scholar] [CrossRef]
  53. Hu, K.Y.; Sun, Z.P. Influence of polycarboxylate Superplasticizers with different functional units on the early hydration of C3A-gypsum. Materials 2019, 12, 1132. [Google Scholar] [CrossRef] [PubMed] [Green Version]
  54. Ji, Y.L.; Sun, Z.P.; Yang, J.B.; Pel, L.; Raja, A.J.; Ge, H.S. NMR study on bleeding properties of the fresh cement pastes mixed with polycarboxylate (PCE) superplasticizers. Constr. Build. Mater. 2020, 240, 117938. [Google Scholar] [CrossRef]
Figure 1. The synthesized formula of polycarboxylate superplasticizers (PCEs).
Materials 13 05626 g001
Figure 2. Effects of the synthesized PCEs on the setting time of cement pastes.
Materials 13 05626 g002
Figure 3. T1 relaxometry of different cement pastes at 10 min.
Materials 13 05626 g003
Figure 4. T1 relaxometry of different cement pastes at 605 min.
Materials 13 05626 g004
Figure 5. T1 relaxometry of different cement pastes at 1210 min.
Materials 13 05626 g005
Figure 6. The total signal intensity of cement pastes at different hydration times.
Materials 13 05626 g006
Figure 7. Time-dependent evolution of weighted average T1 of different cement pastes within 1210 min.
Materials 13 05626 g007
Table 1. Chemical compositions of cement (wt %).
SiO2CaOAl2O3Fe2O3MgONa2OK2OTiO2SO3Loss on Ignition
Cement21.164.35.32.61.70.20.350.31.72.45
Table 2. Mix proportion of cement pastes with PCE (wt %).
SampleCement (g)Water (g)PCE (g)
S0010.280
S0610.280.06
S1210.280.12
S1810.280.18
Publisher’s Note: MDPI stays neutral with regard to jurisdictional claims in published maps and institutional affiliations.

