Abstract
In this work, the influence of various electrochemical parameters on the production of porous anodic alumina (PAA)-based DBRs (distributed Bragg reflector) during high-temperature-pulse-anodization was studied. It was observed that lowering the temperature from 30 to 27 °C brings about radical changes in the optical performance of the DBRs. The multilayered PAA fabricated at 27 °C did not show optical characteristics typical for DBR. The DBR performance was further tuned at 30 °C. The current recovery (iamax) after application of subsequent UH pulses started to stabilize upon decreasing high (UH) and low (UL) voltage pulses, which was reflected in a smaller difference between initial and final thickness of alternating dH and dL segments (formed under UH and UL, respectively) and a better DBR performance. Shortening UH pulse duration resulted in a progressive shift of photonic stopbands (PSBs) towards the blue part of the spectrum while keeping intensive and symmetric PSBs in the NIR-MIR range. Despite the obvious improvement of the DBR performance by modulation of electrochemical parameters, the problem regarding full control over the homogeneous formation of dH+dL pairs remains. Solving this problem will certainly lead to the production of affordable and efficient PAA-based photonic crystals with tunable photonic properties in the NIR-MIR region.
1. Introduction
Distributed Bragg reflectors (DBRs) are 1D photonic crystals (PCs) built of alternate low and high refractive index (RI) layers designed to forbid specific light to propagate in the structure. This phenomenon arises from the partial reflection of a wavelength that is close to four times the optical thickness of the layers from each layer boundary. As a consequence of constructive interference of the multiple reflections, DBR demonstrates high reflectance (or low transmittance) of light in a given part of the spectrum, which is called photonic stopband (PSB). DBRs are frequently used in LEDs [1,2], solar cells [3,4], or vertical-cavity surface-emitting lasers [5,6] as important optical components that enhance luminous or light trapping efficacy. Conventional DBRs are made of two different materials that require careful consideration of their optical and mechanical properties, as well as when choosing a reliable/reproducible method to grow the anticipated structure. This approach has many limitations, including thermal expansion mismatch and necessity to use costly equipment. An alternative approach that can avoid these problems relies on the production of the same material-based DBRs. These kinds of photonic structures were frequently built of indium tin oxide (ITO) [7], amorphous silicon (a-Si) [8], amorphous germanium (a-Ge) [9], or titanium dioxide (TiO2) [10] by the oblique angle deposition (OAD) technique, also known as the glancing angle deposition (GLAD) [11]. The OAD methods usually employ electron beam evaporation or magnetron sputtering in oblique geometric configuration with rotating substrates. Despite the inevitable attractiveness of the OAD, such as controllability and reproducibility, this method also has many disadvantages, including a relatively high production cost owing to the required vacuum conditions, low productivity due to the angular dependence of the deposition rate, and quite complicated fabrication process [12]. It is therefore still necessary to develop highly reflective DBRs with good thermal and mechanical stability by low-cost and simple processes.
Anodizing is an affordable and simple method used to fabricate porous anodic alumina (PAA) with a desired pore architecture that can be fully controlled by electrochemical parameters applied during the process [13,14]. A DBR-like structure is produced by pulse anodization, which involves the application of alternative low and high voltage (or current) pulses, which translate directly into low and high porosity layers. Porosity (P), in turn, determines the RI of the respective layers: RI decreases as P increases. Photonic materials are very sensitive to a slight change of the refractive index of a medium, which was used to fabricate a broad range of optical sensors [15,16,17,18]. The application of PAA-based PCs was limited to the visible (VIS) part of the spectrum due to the absence of corresponding crystals operating in mid-infrared (MIR) region. Yet, the MIR spectral range contains strong characteristic vibrational transitions of many important molecules and gases (e.g., CO2, CH4, CO, NO), which makes it crucial for applications in environmental monitoring, various industrial and security systems, or medical diagnosis. Despite the great potential of the MIR region, the optical components operating in this spectral domain are still under development. The situation is caused mainly by the lack of adequate and inexpensive optical materials, which would enable a precise manipulation of the infrared light. PAA-based PCs with photonic properties in UV-VIS were utilized in the detection of many biological molecules such as glucose, proteins, toxins, etc. [19,20,21]. Here, the biochemical interaction (e.g., binding) with the PC surface caused a change of the effective refractive index, which resulted in a shift of the PSB peak (the resonance wavelength shift per refractive index unit (nm/RIU)), which is proportional to the concentration of the bio-target. However, the utilization of PSBs’ shift as the sensing principle in MIR is impossible since many important organic and inorganic molecules have their absorbance bands there. The detection principle in MIR rely on the Beer-Lambert law [22,23,24]. A very important part of a typical sensor is a gas cell (an optical path, l) that guides light to interact with the gas [25]. An optical sensor operates by measuring the changes in the property of light as it passes through an analyte. To increase the sensor signal response long l is required (>3 cm [26]), which is in conflict with the emerging trend towards miniaturization of optical devises based on integration on-chip (lab-on-chip optical technology). The most promising strategy is based on the exploitation of enhancement layers, such as photonic crystals or optical cavities. Thanks to the slow light in the photonic structures, the required optical path length can be greatly reduced as slow light enhanced light–gas interaction and thus the absorption coefficient. Consequently, the sensor’s sensitivity can be significantly increased. Moreover, the approach enables the realization of miniature infrared gas sensors and provides potential applications for a real-time detecting trace of toxic gases in remote distance. Compared to complex and expensive techniques such as optical and electron-beam lithography methods, electrochemical synthesis offers a very attractive alternative to prepare cost-effective 1D PCs with repeatable optical properties.
Recently, we studied the influence of a broad range anodizing temperature (5–30 °C) on structural and photonic features of PAA-based DBRs [27]. It was revealed that above 10 °C the PSBs begin to drastically deteriorate. However, at 30 °C the material started to restore its photonic properties with distinct PSBs extending from the NIR to the MIR region. The preliminary results suggested the appearance of temperature induced reorganization of pore architecture into the DBR structure at 30 °C. In this work we analyze the influence of other anodizing parameters, such as magnitude of low (UL) and high (UH) voltage pulses, UH-UL contrast, duration of the UH and UL pulses on the growth and optical characteristic of multilayered PAA during high-temperature-pulse anodization. The data demonstrates that the structural and photonic properties of PAA-based DBRs in the NIR-MIR spectral range can be substantially improved upon selection of the appropriate electrochemical parameters.
2. Materials and Methods
The PAA-based distributed Bragg reflector (DBR) structures were synthesized by a pulse anodization of aluminum. High-purity aluminum foil (99.9995% Al, Puratronic, Alfa-Aesar, Haverhill, MA, USA) with a thickness of about 0.25 mm was cut into specimens (2 cm × 1 cm). Before the anodization process, the Al foils were annealed under an argon atmosphere at 400 °C for 2 h. Then, the samples were degreased in acetone and ethanol and subsequently electropolished in a 1:4 mixture of 60% HClO4 and ethanol at 0 °C, under constant voltage of 25 V for 2.5 min. Next, the samples were rinsed with distilled water, ethanol, and dried. Al specimens were insulated at the back, and the edges were covered with acid resistant tape, which served as the anode. A Pt grid was used as a cathode and the distance between both electrodes was kept constant (ca. 5 cm). A large, 1 L electrochemical cell, a powerful low-constant-temperature bath (with temperature stability ±0.01 °C), and vigorous stirring (500 rpm) were employed in the anodizing process. Programmable DC power supply, model 62012P-600-8 Chroma, was used to control the applied voltage and the pulse parameters. The first anodization was carried out at 5 °C in 0.3 M C2H2O4 water-based solution, at 40 V, for 20 h. As obtained, alumina was chemically removed in a mixture of 6 wt% phosphoric acid and 1.8 wt% chromic acid at 60 °C for 3 h. Subsequently, pulse anodization with 20 cycles was conducted at the temperature range 26–29 °C. In general, a pulse sequence consisted of three steps: (1) a constant high voltage step (UH = 50, 45, 40 V) (2) a gradual reduction of the voltage to low voltage at rates of 0.312, 0.234, 0.156, and 0.078 V/s; and (3) the anodization at a constant low voltage (UL = 20, 15, 10 V). The duration of UH = 50 V and UL = 20 V voltages was varied: tH = 360, 300, 240, 180 s, and tL = 480, 420, 360, 300 s, respectively. After the pulse anodization was completed, the remaining aluminum substrate was selectively removed in a saturated solution of HCl/CuCl2.
Structural characterization of the PAA-based photonic structures was made using a field-emission scanning electron microscope FE-SEM (AMETEK, Inc., Mahwah, NJ, USA) equipped with energy dispersive X-ray spectrometer (EDS). The measurement of layer thickness was repeated three times at different points in the BSE (backscattered electrons) image of a given PAA sample and an average of the three measurements was taken to determine the initial and final dH (the layers produced under UH pulse) and dL (the layers produced under UL pulse) thickness. To obtain the geometrical parameters of the fabricated samples, Fast Fourier transforms (FFTs) were generated based on three SEM images taken at the same magnification for every sample and were further used in calculations with a freeware WSxM software (version 5.0). The average interpore distance (Dc) was estimated as an inverse of the FFT’s radial average abscissa from three FE-SEM images for each sample. The average pore diameter (Dp) was estimated from three FE-SEM images for each analyzed sample, using NIS-Elements software provided by Nikon Company, Tokyo, Japan.
The transmission spectra were measured with two instruments. The shortwave end of the spectrum (250–2500 nm) was measured using a Cary 5000 spectrometer with a DRA-2500 integrating sphere from Agilent Technologies Inc., Santa Clara, CA, USA. The longwave end of the spectrum (2500–25,000 nm) was measured using the Fourier-transform infrared (FTIR) spectrometer Alpha II from Bruker Corp., Billerica, MA, USA. The resolution of spectra was set to 1 nm in the shortwave range and 2 cm−1 in the longwave range.
3. Results and Discussion
Recently, it was demonstrated that the optical characteristics of PAA-based photonic material are extremely sensitive to anodizing temperature [27]. Particularly, the region between 25 and 30 °C appeared to be very interesting. It was observed that for the DBR prepared at 25 °C, photonic stopbands (PSBs) were split and hardly distinguishable, whereas the DBR synthesized at 30 °C demonstrated well-resolved and symmetric PSB peaks, shifted towards red part of the spectrum. Hence, the 25 to 30 °C region is further investigated in this work. In Figure 1, current density (ia)—time (t) transients along with the corresponding transmittance spectra of the multilayered PAA prepared during pulse anodization in the temperature range 26–29 °C, are shown (for comparison, the transmission spectrum of the sample anodized at 30 °C is also presented [27]).
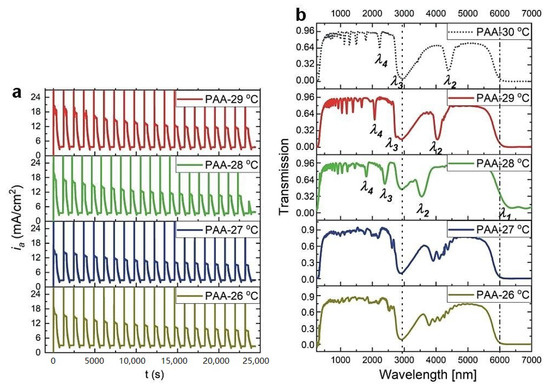
Figure 1.
Current density (ia)—time (t) transients (a) and corresponding transmittance spectra (b) of PAA-based photonic structures anodized at the temperature range 29–26 °C with the following parameters: UH = 50 V, tH = 360 s, UL = 20 V, tL = 480 s, UH->UL rate = 0.078 V/s, 20 cycles (the transmission spectrum for the PAA-30 °C sample is from ref. [27]).
As can be seen, up to 27 °C PSBs remain distorted. The peaks start to shape up again at 28 °C. Furthermore, the spectral positions of the bands shift towards the red part of the spectrum as the temperature increases. Although above 6 μm Al2O3 does not transmit light due to absorption by Al-O bond vibrations [28,29], in the sample fabricated at 28 °C, just above the edge of the transmission, a vague first order PSB (λ1) can be also discernable. The resonance peaks were assigned to different orders of a given stop band based on the Bragg-Snell equation [30], assuming the angle of incidence θ ~ 0 (λi, i = 1–4, correspond to 1–4 orders of PSB). The broad peak at around 3000 nm, present in all spectra and marked by vertical, black, dotted line, originate from the OH group vibrations of adsorbed water [31].
In Figure 2, BSE images of the PAA multilayered structure prepared at 29 (a), 28 (b), 27 (c), and 26 °C (d) are demonstrated, where the material density contrast between alternate and subsequent dH (formed under UH) and dL (formed under UL) layers are clearly visible. As can be seen in Figure 1a, the current recovery peak (the iamax was determined as in the work [27]) after application of subsequent UH pulses decreased with the number of cycles, which indicates a decrease of the total amount of charge involved in the anodization reaction. The decreasing amount of the net amount of charge, in turn, means that the thickness of the dH segments grown at the following UH pulses will be gradually reduced. In Figure 2e, the normalized iamax as a function of number of cycles is presented for the samples synthesized at different temperature. The iamax course can be well described by a simple first order exponential decay (y = A1 exp(−x/dc) + y0, where A1 is the amplitude, y0 is the offset term that represents residual imax, and dc is the decay constant). In this particular case, the dc indicates the UH pulse at which the course reaches 1/e or ≈37% of the difference between the initial (y0) and final (y) steady state values. y0 value was fixed to 0.5 for all samples, to assure the same fitting range from the maximum value up to the point where the iamax reaches the half of its maximum value. The larger the dc value, the more efficient is the current recovery under subsequent UH pulses, and thus a better selection of the electrochemical parameters to maintain a stable pulse anodization is achieved. Based on this analysis, the processes conducted at 27 (dc = 11) and 30 °C (dc = 12) were better designed than the other ones (Figure 2e). This is, however, not compatible with optical analyses (Figure 1b), where the sample produced at 27 °C did not show features characteristic of the DBR structure. It thus seems that the variability of the dc parameter within the range 6–12 does not significantly affect the optical characteristics of the multilayer PAA structure. The only parameter that matters in this case is the temperature: the multilayered PAA transforms into the DBR only at relatively high temperature (28–30 °C). The statement is also supported by the difference between initial (mean thickness of the first three layers) and final (mean thickness of the last three layers) dH. Figure 2d shows that this difference weakens as the anodizing temperature increases. However, it has to be noticed that starting from 28 °C, the number of dH+dL pairs decreases (the numbers are shown in square frames in Figure 2f). This means that the thickness of initial dH was not determined for exactly the first three (1–3) layers, but for 2–4, or even 6–8 ones, which might have decreased slightly its average value. Consequently, the difference between initial and final dH thickness is a bit underestimated. The lack of several layers may be due to non-equilibrated rate- and diffusion-controlled processes at a high anodization temperature [27]. However, it is also very probable that the first layers are simply falling off from the stack after the synthesis. The BSE image of the sample PAA-26 °C (Figure 2d), for instance, suggests that the first segments are more brittle and vulnerable to exfoliation. The exfoliation may occur during the Al dissolution in the mixture of HCl acid and CuCl2 or during the preparation of the samples to analysis (the samples have to be broken in order to analyze their cross-sectional). While the thickness of the dH layers increased substantially with the anodizing temperature, the dL for the samples anodized at 26–29 °C apparently stayed on more or less the same level (Figure 2f).
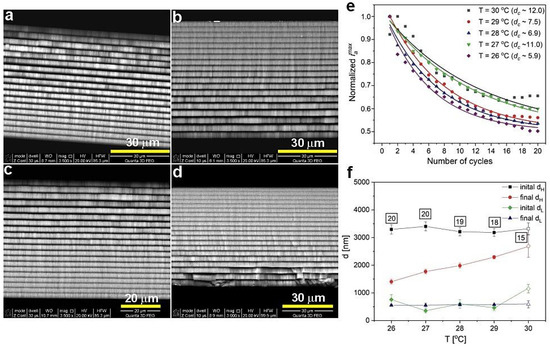
Figure 2.
BSE images of PAA-29 °C (a), PAA-28 °C (b), PAA-27 °C (c), PAA-26 °C (d) samples; normalized iamax as a function of number of cycles (e); initial and final thickness of dH and dL layers as a function of anodizing temperature (f); the number in black squares indicate the number of dH+dL pairs in the respective samples (the normalized iamax and layer thickness for the PAA-30 °C sample [27] are also shown for comparison).
Previously, an improvement of the geometrical and photonic properties of the PAA-based DBR produced at 30 °C upon increasing the UH->UL rate was observed [27]. The same protocol was applied to the PAA sample anodized at 29 °C. As visible in Figure 3, the increase of this parameter resulted in a complete distortion of the PSBs. Already under application of the UH->UL = 0.156 V/s, the transmission spectrum lacks the features typical for the DBR structure. This is quite surprising considering the small (only by 1 °C) temperature drop. Figure 4a–c shows typical multilayer structures with an increased number of dH+dL layers as the UH->UL rate increases. The dc determined for the samples prepared with the increased UH->UL rates is even larger than the dc determined for the sample anodized with the lowest UH->UL rate = 0.078 V/s (Figure 4d). Again, this might suggest that the dc within the 8–13 range does not influence the optical performance of the PAA material. As previously observed [27], the thickness of the initial and final dH layers decreases as the UH->UL increases (Figure 4e), whereas dL demonstrates a quite stable behavior. Taking into account the possible exfoliation of the first two layers (in the sample anodized under the 0.078 V/s rate) and the first one (in the sample anodized under the 0.156 V/s rate) from the potential 20-layer stack, the difference between the initial and final dH seems to remain stable. What is, therefore, the reason causing the deterioration of the PSBs in these samples? It is possible that the temperature of 29 °C is already too low to maintain good pore reorganization when the change from UH to UL is too fast.
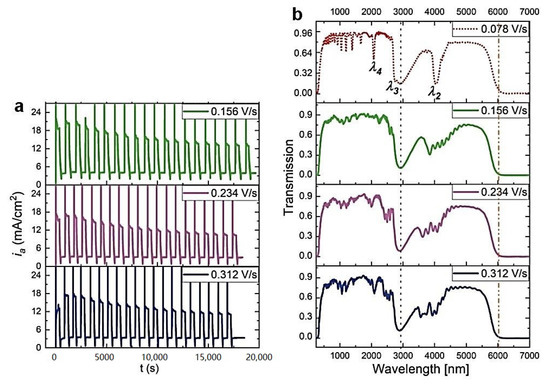
Figure 3.
The ia(t) curves recorded during pulse anodization at 29 °C (other parameters: UH = 50 V, tH = 360 s, UL = 20 V, tL = 480 s, 20 cycles) with increasing UH->UL rate from 0.156 V/s down to 0.312 V/s (a), the corresponding transmission spectra (b). The transmission spectra of the PAA-29 °C sample synthesized with the UH->UL rate of 0.078 V/s is also shown for comparison.
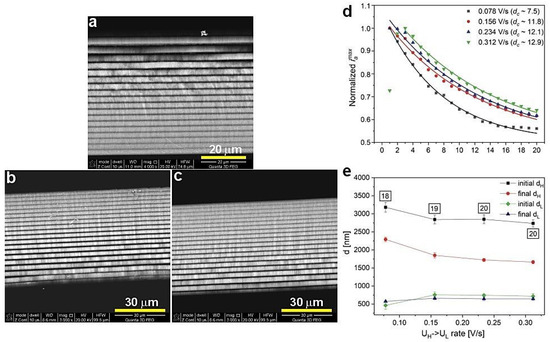
Figure 4.
BSE images of the PAA synthesized at 29 °C with different UH->UL rate: 0.156 (a), 0.234 (b), and 0.312 V/s (c), normalized iamax as a function of number of cycles (d), and initial and final dH and dL layer thickness as a function of UH->UL rate (e); in black squares—the number of dH+dL pairs.
Since lowering the temperature already by 1 °C has such detrimental effect on the optical characteristics of PAA multilayered structures, we decided to analyze the influence of other anodizing parameters on the PAAs prepared at 30 °C using an optimal UH->UL rate (0.234 V/s), as determined based on the previous investigations [27]. At first, the effect of UH and UL values and UH-UL contrast of the geometrical and optical properties of multilayer PAAs was analyzed. In Figure 5, the ia(t) curves along with the corresponding transmission spectra recorded for PAA anodized under different UH and UL pulses, are shown. As can be seen, the photonic characteristics typical for the DBR structure are maintained for all the studied samples. Upon a decrease of UH from 50 to 40 V and simultaneously a decrease of the UH-UL contrast, the PSB peaks shift towards the blue part of the spectrum, while keeping their intensity and symmetry. Additionally, in the spectrum of the PAA_40-20 sample, a clear λ1 band is discernable at ~5560 nm. Decreasing UL from 20 to 10 V, and at the same time increasing the UH-UL contrast, causes a further shift of the PSB peaks towards shorter wavelengths. In general, the PAA-based DBRs in this batch of the samples preserve their good optical characteristics, which is particularly visible when monitoring the λ2 mode behavior. It can be stated that the best optical performance demonstrates the PAA_40-15 sample for which both λ1 and λ2 bands are symmetric and intensive (T = 0.3 and 0.07, respectively). In the PAA_40-10 sample, the λ1 and λ2 peaks appear to weaken and become less symmetric. The intensity of higher photonic modes (e.g., λ3 and λ4) varies from sample to sample. It is well known that higher interference modes are more sensitive to possible structural imperfections or boundary conditions [32]. Therefore, any deviation from ideal multilayered structure (e.g., irregular layer thickness) or some damages in the structure, is more noticeable in higher modes.
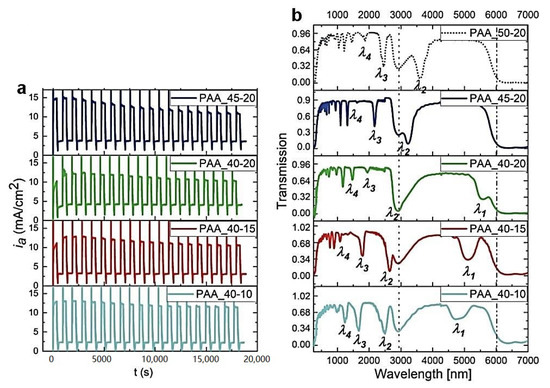
Figure 5.
The ia(t) curves recorded during pulse anodization at 30 °C under different UH and UL pulses [V] (PAA_UH-UL, other applied parameters: tH = 360 s, tL = 480 s, UH->UL drop rate = 0.234 V/s, 20 cycles) (a) and the corresponding transmission spectra (the transmission spectra for the PAA_50-20 is taken from ref. [27] for comparison) (b).
Figure 6 demonstrates BSE images of the PAA_45-20 (a), PAA_40-20 (b), PAA_40-15 (c), and PAA_40-10 (d) samples, normalized iamax as a function of number of cycles (e), and initial and final dH and dL layer thickness (f) of the respective samples. For this group of the samples there is an obvious trend in the dc behavior: the dc gradually increases as UH and then UL decreases (Figure 6e). This trend is followed by the decrease of the difference between initial and final dH values (Figure 6f). In the PAA_50-20, PAA_45-20, and PAA-40-20 samples, the different decreases are owed to the UH-UL contrast decrease and is the smallest for the PAA_40-20 sample. This sample is also built out of complete 20 dH+dL segments, suggesting that the actual difference between initial and final dH layers in the samples PAA_50-20 and PAA_45-20 (16 dH+dL pairs) is even greater than shown in Figure 6f. The difference seems to decrease as well for the subsequent PAA-40-15 and PAA-40-10 samples, despite the increase of the UH-UL contrast. This is, however, an apparent effect coming from the reduced number of the dH+dL pairs. The sample PAA_40-10 consists of only 13 dH+dL segments, so initial dH value was actually determined for the 8th to 10th layer, not for the first three (1–3) real layers. The BSE image of the PAA_40-10 sample (Figure 6d) strongly indicates that this DBR structure is more susceptible to exfoliation as compared to other samples, which is most likely caused by its higher brittleness. The higher fragility, in turn, may result from relatively low values of potential pulses applied during anodization (UL is only 10 V). Owing to the large structural imperfection, the PAA_40-10 DBR demonstrates also a slightly worse optical characteristics (Figure 5b), as compared to other samples from this batch. Contrary to the dH behavior, both initial and final dL layers are stable in the PAA_50-20, PAA_45-20, and PAA-40-20 samples, and go down in the PAA-40-15 and PAA-40-10 samples due to the UL decrease.
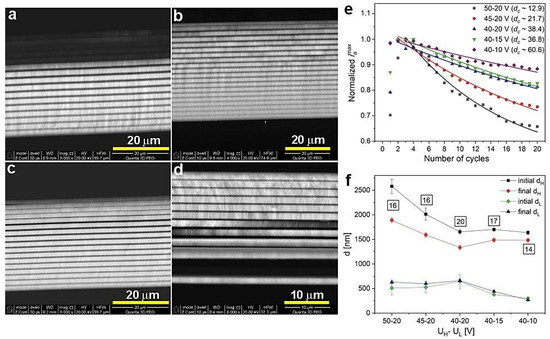
Figure 6.
BSE images of the samples PAA_45-20 (a), PAA_40-20 (b), PAA_40-15 (c), PAA_40-10 (d), normalized iamax (the data for the PAA_50-20 sample comes from ref. [27]) as a function of number of cycles (e) and initial and final dH and dL layer thickness for the presented samples (f); in black squares—the number of dH+dL pairs.
Next, the influence of the UH and UL pulse duration on the multilayer PAA formation and its optical performance was tested. In Figure 7, the ia(t) curves and corresponding transmission spectra of the PAA-based DBRs prepared under UH with decreasing duration (tH) are shown. Owing to the shorter tH, the dH segments become progressively thinner. This results in a blue shift of PSBs. When UH pulses with tH = 240 s are applied, a weak outline of the λ1 peak is already visible in the transmission spectrum. The λ1 band becomes well-resolved in the PAA-based DBR anodized with tH = 180 s.
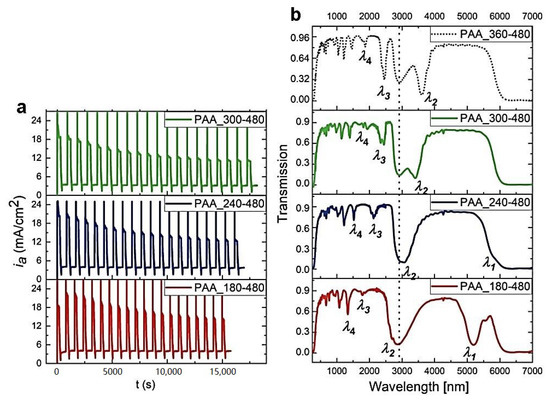
Figure 7.
The ia(t) curves recorded during pulse anodization at 30 °C, under UH of different tH [s] (PAA_tH-tL, other parameters: UH = 50 V, UL = 20 V, UH->UL rate = 0.234 V/s, 20 cycles) (a) and the corresponding transmission spectra (the transmission spectra for the PAA_360-480 is taken from ref. [27] for comparison) (b).
The BSE images of the PAA_300-480, PAA_240-480, and PAA_180-480 are shown in Figure 8a, b, and c, respectively. The course of iamax is comparable for all samples from this batch (Figure 8d). The dc parameter is within the range of 5 to 13. The decrease of dH segments upon shortening of the UH duration is well presented in Figure 8d. Moreover, with shorter tH, the number of dH+dL layers increases; the PAA_180-480 DBR is built out of complete 20 dH+dL segments. Taking into account the lower number of the dH+dL pairs in other DBRs (Figure 8e) it can be concluded that the difference between initial and final dH remains pretty stable. Therefore, the analysis presented in Figure 8 confirms similar optical characteristics for all these samples: the PSBs are well-resolved (although some λ2 bands are overlapped with water peak), symmetric, and intensive (Figure 7).
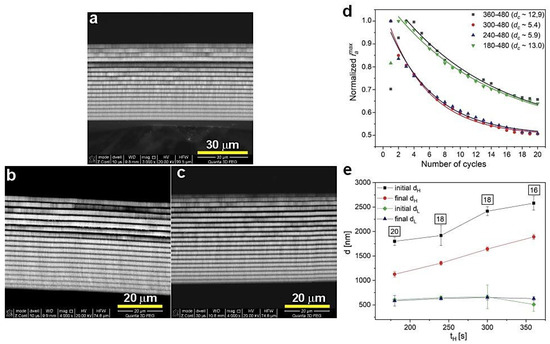
Figure 8.
BSE images of the samples PAA_300-480 (a), PAA_240-480 (b), PAA_180-480 (c), normalized iamax as a function of number of cycles (d) and initial and final layer dH and dL thickness as a function tH (e); in black squares—the number of dH+dL pairs.
In Figure 9, the ia(t) curves and corresponding transmission spectra of the PAA-based DBRs fabricated under UL with decreasing duration (tL) are demonstrated. With decreasing tL, a small blue shift of PSBs is observed. However, these DBRs seem to start losing their good photonic properties: the PSBs are becoming progressively broadened and start to severely split as tL decreases (Figure 9b). The samples PAA_180-480, PAA_180-420, PAA_180-360, and PAA_180-300 consist of full 20 dH+dL pairs (Figure 10a–c) and the dc parameter varies within the range 10–18 (Figure 10d). Moreover, the difference between initial and final dH appears to be stable for all samples in this series or even slightly decreases when shortening the tL (Figure 10e). The latter observation may indicate more efficient diffusional processes occurring when tL is shortened. Hence, both current behavior and determined geometrical features do not say much about the source of the slight but visible worsening of optical performance. However, the changes are evident upon shortening tL. It can thus be supposed that the resulted thinner dL segments (Figure 10e) somehow affect an overall multilayer structure, which becomes to a certain degree distorted. The distortion can for instance be linked with worse pore arrangement and circularity in the dL layers formed under shorter UL pulses. It was demonstrated that these parameters depend on the anodizing time: the longer the anodization time, the better the pore arrangement and circularity [33].
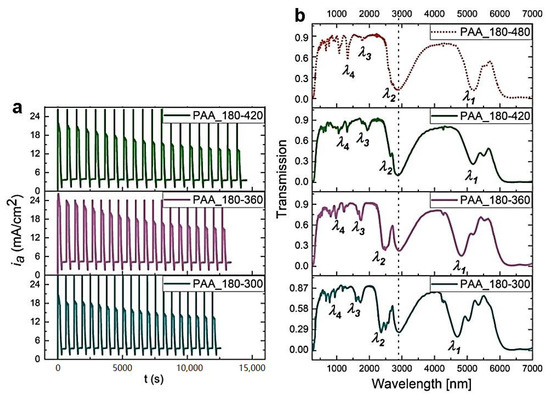
Figure 9.
The ia(t) curves recorded during pulse anodization at 30 °C, under UL of different tL [s] (PAA_tH-tL, other parameters: UH = 50 V, UL = 20 V, UH->UL drop rate = 0.234 V/s, 20 cycles) (a) and the corresponding transmission spectra (the transmission spectra for the PAA_180-480 is shown for comparison) (b).
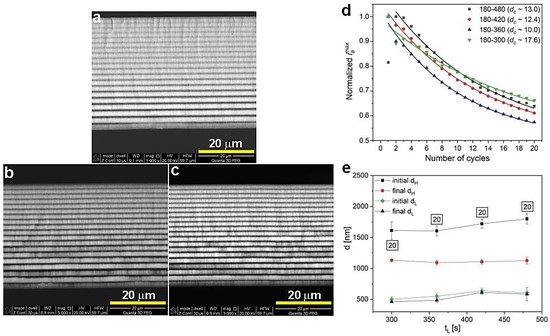
Figure 10.
BSE images of the samples PAA_180-420 (a), PAA_180-360 (b), PAA_180-300 (c), normalized iamax as a function of number of cycles (d) and initial and final layer dH and dL thickness as a function tL (e); in black squares—the number of dH+dL pairs.
Summarizing, the PAA-based DBR is extremely sensitive to pulse anodization temperature. In the temperature >10 °C and up to 27 °C the typical DBR features are not observed in transmission spectra. Above 27 °C, the PAA multilayer structure transforms into the DBR photonic crystal, which is manifested by the appearance of distinct, well-resolved, and symmetric peaks in the transmission spectra. Within the conditions applied in this study, optimal PAA-based DBRs are produced at 30 °C using a UH->UL drop rate close to 0.234 V/s. The optical properties of the DBRs formed under the high-temperature pulse-anodization can be tuned by changing other anodization parameters, such as UH, UL, UH-UL contrast, and tH. Decreasing tL causes progressive deterioration of the optical characteristics of the photonic crystals. On the other hand, too low UL voltage contributes to the formation of too much brittleness of the multilayer PAA material and, consequently, harsh exfoliation of initial dH and dL layers.
DBR performance (i.e., transmittance and PSB bandwidth) is determined by the number of pairs as well as the refractive index contrast between low and high RI layers [34]. A larger contrast and higher number of pairs can lead to lower transmittance and wider PSBs. In the electrochemical production of PAA-based DBR at relatively high temperature, the most challenging task is to control a uniform growth of dH+dL pairs, which is directly proportional to the net amount of the charge involved in the anodization reaction. The non-uniform layer formation can be partially counteracted by decreasing UH and UL values and UH-UL contrast. Nevertheless, it is still difficult to maintain a steady current recovery (constant value of iamax) during the whole process. Therefore, to master the production of PAA-based photonic crystals with the desired photonic properties in NIR-MIR spectral range, this experimental approach will be modified in future studies. The PAA-based DBRs with the best optical properties observed in this work are presented in Table 1 with the anodization parameters used to produce those samples.

Table 1.
Electrochemical parameters applied during a 20-cycle pulse anodization at relatively high temperatures, which was used to synthesize PAA-based DBRs with the best optical properties along with the observed PSBs (T stands for transmission intensity).
The observed optical resonances generated by the samples gathered in the Table 1 were also verified theoretically assuming a DBR structure built of uniform segments that are formed under equilibrated conditions (no rate and diffusion limitations). These conditions are operative during application of the first UH and UL pulses in a given pulse sequence. Accordingly, the thickness of the initial dH and dL layers can be considered as the one that would be repeated in every cycle if no rate- and/or diffusion-limited processes occurred, thereby assuring the same amount of charge flowing in each cycle. However, owing to the lack of the first one to three layers in some of the multilayer stacks, the thickness of the initial dH and dL segments (dHinit and dLinit, respectively) was determined with support of the data established in ref. [35]. In Figure 11a, the growth rate (kPAA) of PAA layers formed under pulse anodization (this work) is compared with that determined in [35]. It can be seen that owing to the lack of the first layers in the DBR stacks, the kPAA of dHinit segments formed at 40 and 45 V were underestimated. However, the kPAA of the dLinit segments formed at 15 and 20 V and that of dHinit formed at 50 V (the PAA_180-480 sample with the full 20 dH+dL pairs) agreeed very well with the trend established in ref. [35]. The dHinit and dLinit thicknesses for the DBR produced at 29 °C was measured directly on the sample PAA_29 °C. In order to determine refractive indices of the dHinit and dLinit layers, porosity of PAA layers was calculated using the following equation [36]:
where Dp is pore diameter and Dc is the interpore distance. To measure Dp and Dc of dH layers, two-period stacks were synthesized using the following pulse sequence: UH-UL-UH-UL, whereas the UL-UH-UL-UH inverse pulse sequence was used to analyze the dL layers. In Figure 11b–f, SEM images of dH and dL layers (top views) of the selected samples are shown. It can be seen that the dL layers have a complex structure where a few smaller pores are located within a larger hexagonal cell (about 10 pores per cell; the image showing larger magnification of the dL layer in Figure 11d). The hexagonal cells form an almost perfect honeycomb structure. Since it was not possible to determine both pore diameter and interpore distance from such complex images using the protocol described in the Section 2, the DdL and DcL were derived from the formulas developed in the work [37]. All geometrical parameters of PAA layers are gathered in Table 2.
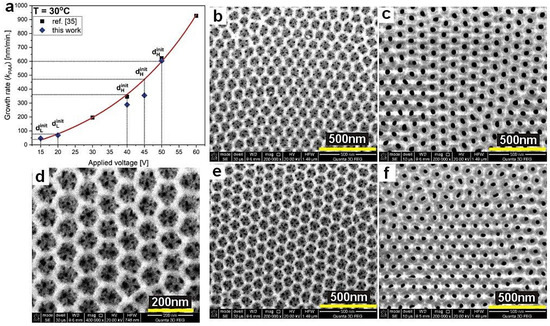
Figure 11.
PAA growth rate (kPAA) as a function of applied voltage for T = 30 °C (a), SEM images of the dLinit and dHinit layers (top views) formed under UL = 20 V (b), UH = 50 V (c), UL = 15 V (d,e), UH = 40 V (f) pulses at 30 °C.
Table 2.
Geometrical parameters of PAA layers: DdH and DdL—pore diameters, DcH and DcL—interpore distances, PH and PL—porosity of the dH and dL segments, respectively; dHinit and dLinit are the initial segments formed under first UH and UL pulses, respectively; and are the mean values of both initial and final thicknesses of dH and dL layers, respectively
Having porosity values, the refractive indices of the dHinit and dLinit segments (nH and nL, respectively) were determined based on the Bruggeman’s effective medium theory [38], and the effective refractive index (neff) of each double layer was calculated using the following formula [39]:
Bragg-Snell law gives the spectral positions of photonic stop bands (PSBs) [30]:
where λ is the wavelength of a photonic stop band (PSB), m is the order of the PSB, d is the periodicity (d = dHinit + dLinit), θ is the angle of incidence (θ ~ 0 in the studied cases), neff is the effective refractive index, and nair is the refractive index of air. The optical constants and the calculated PSBs are presented in Table 3.
Table 3.
Optical indices (nH and nL are refractive indices of the respective dHinit and dLinit segments, neff is the effective refractive index) and PSBs calculated for dHinit and dLinit (λ1 and λ2) and for and (λ′1 and λ′2).
As can be seen, the resulting spectral positions of λ1 and λ2 are shifted towards longer wavelengths as compared to the observed ones (λ1obs and λ2obs), suggesting that the real neff and/or d values of the studied DBRs are smaller. Therefore, the PSBs spectral positions were also determined, taking into account the mean values of both initial and final dH and dL layers ( and , respectively, Table 2; d = + in this case). The corresponding PSBs (λ′1 and λ′2) are collected in Table 3. The neff remained practically stable when dHinit and dLinit were substituted by the and in Equation (2): its values changed only in the third decimal place. Now, the λ′1 and λ′2 are much closer the observed ones (λ1obs and λ2obs). The match would be even better if an average porosity of all 20 dH and dL pairs was known. The porosity of subsequent segments may also vary: in the 20-period DBR stacks the initial segments most likely have larger pore diameters—and thus porosity—than the final ones due to the prolonged stay in the oxalic solution. Consequently, the average PH and PL would be larger than the ones determined for the two-period stacks. The larger porosity, in turn, contributes to smaller refractive indices of porous layers and thus to smaller neff. In Table S1 (Supplementary Materials), simulated optical spectra of the PAA-29 °C, PAA_45-20, PAA_40-15, and PAA_180-480 DBRs are demonstrated for dHinit, dLinit, and the nH and nL determined based on the layer porosities. The optical spectra are compared with those simulated for the and and for nH and nL chosen to make PSBs match with the the λ1obs and λ2obs. Based on this analysis it appears that the actual nH and nL of the DBRs are in the ranges 1.28–1.41 and 1.18–1.24, respectively. The effective refractive index, in turn, lies within the range 1.24–1.39.
4. Conclusions
In this work, the influence of various electrochemical parameters on the production of PAA-based DBRs during high-temperature-pulse anodization was studied. It was observed that the process and resulting DBR properties are very sensitive to anodizing temperature: lowering the temperature from 30 to 27 °C brings about drastic changes in optical performance of the DBRs. The multilayered PAA fabricated at 27 °C did not demonstrate optical properties typical for DBR. Upon decreasing UH and UL potential and UH-UL contrast, the current recovery (iamax) after application of subsequent UH pulses started to stabilize, which was also manifested by a smaller difference between initial and final dH thickness and a better DBR performance. The optimal UH-UL contrast at 30 °C is 25 V: in the PAA_40-15 sample both λ1 and λ2 bands in the transmission spectra are well-resolved, intensive and symmetric. Furthermore, shortening the UH pulse duration results in a progressive shift of PSBs towards blue part of the spectrum without signs of PSB deterioration. The sample PAA_180-480 generates well-developed peaks in the MIR (λ1 = 5183 nm) and NIR (λ2 = 2697 nm) region. The effective refractive indices neff for the best performing samples lie within the range 1.24–1.39 and are smaller than the ones calculated for perfect multilayer structures of uniform thickness and porosity. Despite the obvious improvement of DBR properties in the NIR-MIR region by modulation of electrochemical parameters, there is still a problem with a full control over the homogeneous formation of dH+dL pairs. Since the amount of charge determines the thicknesses of anodized segments at given anodization potentials, the problem with the non-uniform growth of dH+dL pairs can be solved, for instance, by designing potential pulse sequences with a given amount of charge for UH and UL pulses. In this approach, the duration of subsequent UH and UL pulses would be adjusted to the time needed to reach the same amount of charge for each UH and UL pulses—this work is now in progress.
Supplementary Materials
The following are available online at https://www.mdpi.com/1996-1944/13/24/5622/s1, Table S1: Simulated optical spectra of the PAA-29 °C, PAA_45-20, PAA_40-15, and PAA_180-480 DBRs.
Author Contributions
Conceptualization, M.N.; electrochemical synthesis of PAA-based PCs and data analysis, E.B.; optical measurements, M.W.; SEM analysis, M.N.; writing—original draft preparation, M.N. All authors have read and agreed to the published version of the manuscript.
Funding
The research was financed by the National Science Centre, Poland (UMO-2019/35/B/ST5/01025). The work was also supported by the statutory research funds of the Department of Functional Materials and Hydrogen Technology, Military University of Technology, Warsaw, Poland. The UV-vis-NIR spectrometers used in these studies were obtained with funds from the Polish Ministry of Science and Higher Education grant for investment in large research infrastructure no. 7044/IA/SP/2019.
Conflicts of Interest
The authors declare no conflict of interest.
References
- Lin, H.-Y.; Chen, K.-J.; Wang, S.-W.; Lin, C.-C.; Wang, K.-Y.; Li, J.-R.; Lee, P.-T.; Shih, M.-H.; Li, X.; Chen, H.-M.; et al. Improvement of light quality by DBR structure in white LED. Opt. Express 2015, 23, A27–A33. [Google Scholar] [CrossRef]
- Oh, J.R.; Cho, S.-H.; Lee, Y.-H.; Do, Y.-R. Enhanced forward efficiency of Y3Al5O12:Ce3+ phosphor from white light-emitting diodes using blue-pass yellow-reflection filter. Opt. Express 2009, 17, 7450–7457. [Google Scholar] [CrossRef] [PubMed]
- Dubey, R.S.; Saravanan, S.; Kalainathan, S. Performance enhancement of thin film silicon solar cells based on distributed Bragg reflector & diffraction grating. Aip Adv. 2014, 4, 127121. [Google Scholar]
- Zhou, L.; Zuo, Y.H.; Zhou, C.L.; Li, H.L.; Diao, H.W.; Wang, W.J. A highly efficient light-trapping structure for thin-film silicon solar cells. Sol. Energy 2010, 84, 110–115. [Google Scholar] [CrossRef]
- Persano, L.; Camposeo, A.; Carro, P.; Mele, E.; Cingolani, R.; Pisignano, D. Very high-quality distributed Bragg reflectors for organic lasing applications by reactive electron-beam deposition. Opt. Express 2006, 14, 1951–1956. [Google Scholar] [CrossRef] [PubMed]
- Chang, T.-C.; Hashemi, E.; Hong, K.-B.; Bengtsson, J.; Gustavsson, J.; Haglund, Å.; Lu, T.-C. Electrically injected GaN-based vertical-cavity surface-emitting lasers with TiO2 high-index-contrast grating reflectors. ACS Photonics 2020, 7, 861–866. [Google Scholar] [CrossRef]
- Schubert, M.F.; Xi, J.Q.; Kim, J.K.; Schubert, E.F. Distributed Bragg reflector consisting of high- and low refractive- index thin film layers made of the same material. Appl. Phys. Lett. 2007, 90, 141115. [Google Scholar] [CrossRef]
- Jang, S.J.; Song, Y.M.; Yeo, C.I.; Park, C.Y.; Lee, Y.T. Highly tolerant a-Si distributed Bragg reflector fabricated by oblique angle deposition. Opt. Mater. Express 2011, 1, 451–457. [Google Scholar] [CrossRef]
- Leem, J.W.; Yu, J.S. Broadband and wide-angle distributed Bragg reflectors based on amorphous germanium films by glancing angle deposition. Opt. Express 2012, 20, 20576–20581. [Google Scholar] [CrossRef]
- Leem, J.W.; Guan, X.-Y.; Yu, J.S. Tunable distributed Bragg reflectors with wide-angle and broadband high-reflectivity using nanoporous/dense titanium dioxide film stacks for visible wavelength applications. Opt. Express 2014, 22, 18519–18526. [Google Scholar] [CrossRef]
- Kwon, H.; Lee, S.H.; Kim, J.K. Three-dimensional metal-oxide nanohelix arrays fabricated by oblique angle deposition: Fabrication, properties, and applications. Nanoscale Res. Lett. 2015, 10, 369. [Google Scholar] [CrossRef] [PubMed]
- Barranco, A.; Borras, A.; Gonzalez-Elipe, A.R.; Palmero, A. Perspectives on oblique angle deposition of thin films: From fundamentals to devices. Prog. Mater. Sci. 2016, 76, 59–153. [Google Scholar] [CrossRef]
- Md Jani, A.M.; Losic, D.; Voelcker, N.H. Nanoporous anodic aluminium oxide: Advances in surface engineering and emerging applications. Prog. Mater. Sci. 2013, 58, 636–704. [Google Scholar] [CrossRef]
- Lee, W.; Park, S.-J. Porous anodic aluminum oxide: Anodization and templated synthesis of functional nanostructures. Chem. Rev. 2014, 114, 7487–7556. [Google Scholar] [CrossRef] [PubMed]
- Acosta, L.K.; Bertó-Roselló, F.; Xifre-Perez, E.; Law, C.S.; Santos, A.; Ferré-Borull, J.; Marsal, L.F. Tunable nanoporous anodic alumina photonic crystals by Gaussian pulse anodization. ACS Appl. Mater. Interfaces 2020, 12, 19778–19787. [Google Scholar] [CrossRef]
- Kumeria, T.; Rahman, M.M.; Santos, A.; Ferreé-Borrull, J.; Marsal, L.F.; Losic, D. Nanoporous Anodic alumina rugate filters for sensing of ionic mercury: Toward environmental point-of-analysis systems. ACS Appl. Mater. Interfaces 2014, 6, 12971–12978. [Google Scholar] [CrossRef] [PubMed]
- Kaur, S.; Law, C.S.; Williamson, N.H.; Kempson, I.; Popat, A.; Kumeria, T.; Santos, A. Environmental copper sensor based on polyethylenimine-functionalized nanoporous anodic alumina interferometers. Anal. Chem. 2019, 91, 5011–5020. [Google Scholar] [CrossRef]
- Acosta, L.K.; Bertó-Roselló, F.; Xifre-Perez, E.; Santos, A.; Ferré-Borull, J.; Marsal, L.F. Stacked nanoporous anodic alumina gradient-index filters with tunable multispectral photonic stopbands as sensing platforms. ACS Appl. Mater. Interfaces 2019, 11, 3360–3371. [Google Scholar] [CrossRef]
- Chen, Y.; Santos, A.; Wang, Y.; Kumeria, T.; Li, J.; Wang, C.; Losic, D. Biomimetic nanoporius anodic alumina distributed Bragg reflectors in the form of films and microsized particles for sensing applications. ACS Appl. Mater. Interfaces 2015, 7, 19816–19824. [Google Scholar] [CrossRef]
- Kumeria, T.; Rahman, M.M.; Santos, A.; Ferreé-Borrull, J.; Marsal, L.F.; Losic, D. Structural and optical nanoengineering of nanoporous anodic alumina rugate filters for real-time and label-free biosensing applications. Anal. Chem. 2014, 86, 1837–1844. [Google Scholar] [CrossRef]
- Santos, A.; Yoo, J.H.; Rohatgi, C.V.; Kumeria, T.; Wang, Y.; Losic, D. Realisation and advanced engineering of true optical rugate filters based on nanoporous anodic alumina by sinusoidal pulse anodization. Nanoscale 2016, 8, 1360–1373. [Google Scholar] [CrossRef] [PubMed]
- Zhao, Y.; Zhang, Y.; Wang, Q. High sensitivity gas sensing method based on slow light in photonic crystal waveguide. Sens. Actuators B 2012, 173, 28–31. [Google Scholar] [CrossRef]
- Jannesari, R.; Ranacher, C.; Consani, C.; Grille, T.; Jakoby, B. Sensitivity optimization of a photonic crystal ring resonator for gas sensing applications. Sens. Actuators A 2017, 264, 347–351. [Google Scholar] [CrossRef]
- Kraeh, C.; Martinez-Hurtado, J.L.; Popescu, A.; Hedler, H.; Finley, J.J. Slow light enhanced gas sensing in photonic crystals. Opt. Mater. 2018, 76, 106–110. [Google Scholar] [CrossRef]
- Popa, D.; Udrea, F. Towards integrated mid-infrared gas sensors. Sensors 2019, 19, 2076. [Google Scholar] [CrossRef]
- Hodgkinson, J.; Tatam, R.P. Optical gas sensing: A review. Meas. Sci. Technol. 2013, 24, 012004. [Google Scholar] [CrossRef]
- Białek, E.; Włodarski, M.; Norek, M. Influence of anodization temperature on geometrical and optical properties of porous anodic alumina (PAA)-based photonic structures. Materials 2020, 13, 3185. [Google Scholar] [CrossRef]
- Ozin, G.A.; Arsenault, A. Nanochemistry: A Chemical Approach to Nanomaterials, 2nd ed.; Royal Society of Chemistry: London, UK, 2015. [Google Scholar]
- Li, W.L.; Tian, S.B.; Zhu, F. Sulfonic acid functionalized nano-γ-Al2O3: A new, efficient, and reusable catalyst for synthesis of 3-substituted-2H-1,4-benzothiazines. Sci. World J. 2013, 6, 838374. [Google Scholar]
- Wang, H.-K.; Yi, C.-Y.; Tian, L.; Wang, W.-J.; Fang, J.; Zhao, J.-H.; Shen, W.-G. Ag-Cu bimetallic nanoparticles prepared by microemulsion method as catalyst for epoxidation of styrene. J. Nanomater. 2012, 6, 453915. [Google Scholar] [CrossRef]
- Włodarski, M.; Putkonen, M.; Norek, M. Infrared absorption study of Zn-S hybrid and ZnS ultrathin films deposited on poorus AAO ceramic support. Coatings 2020, 10, 459. [Google Scholar] [CrossRef]
- Yoshioka, S.; Nakano, T.; Nozue, Y.; Kinoshita, S. Coloration using higher order optical interference in the wing pattern of the Madagascan sunset moth, J.R. Sic. Interface 2008, 5, 457–464. [Google Scholar] [CrossRef] [PubMed]
- Stępniowski, W.J.; Zasada, S.; Bojar, Z. First step of anodization influences the final nanopore arrangement in anodized alumina. Surf. Coat. Technol. 2011, 206, 1416–1422. [Google Scholar]
- Blum, O.; Fritz, I.J.; Dawson, L.R.; Howard, A.J.; Headley, T.J.; Klem, J.F.; Drummond, T.J. Highly reflective, long wavelength AlAsSb/GaAsSb distributed Bragg reflector grown by molecular beam epitaxy on InP substrates. Appl. Phys. Lett. 1995, 66, 329–331. [Google Scholar] [CrossRef]
- Sulka, G.D.; Stępniowski, W.J. Structural features of self-organized nanopore arrays formed by anodization of aluminum in oxalic acid at relatively high temperatures. Electrochim. Acta 2009, 54, 3683–3691. [Google Scholar] [CrossRef]
- Nielsch, K.; Choi, J.; Schwirn, K.; Wehrspohn, R.B.; Gösele, U. Self-ordering regimes of porous alumina: The 10% porosity rule. Nano Lett. 2002, 2, 677–680. [Google Scholar] [CrossRef]
- Stępniowski, W.J.; Norek, M.; Michalska-Domańska, M.; Bojar, Z. Ultra-small nanopores obtained by self-organized anodization of aluminum in oxalic acid at low voltages. Mater. Lett. 2013, 111, 20–23. [Google Scholar] [CrossRef]
- Sulka, G.D.; Hnida, K. Distributed Bragg reflector based on porous anodic alumina fabricated by pulse anodization. Nanotechnology 2012, 23, 075303. [Google Scholar] [CrossRef]
- Paternò, G.M.; Manfredi, G.; Scotognella, F.; Lanzani, G. Distributed Bragg reflectors for the colorimetric detection of bacterial contaminants and pollutants for food quality control. APL Photon. 2020, 5, 080901. [Google Scholar] [CrossRef]


Publisher’s Note: MDPI stays neutral with regard to jurisdictional claims in published maps and institutional affiliations. |
© 2020 by the authors. Licensee MDPI, Basel, Switzerland. This article is an open access article distributed under the terms and conditions of the Creative Commons Attribution (CC BY) license (http://creativecommons.org/licenses/by/4.0/).