Article

Characterising the Microstructure of an Additively Built Al-Cu-Li Alloy

1
Foundry Institute, RWTH Aachen University, Intzestraße 5, 52072 Aachen, Germany
2
Central Facility for Electron Microscopy (GFE), RWTH Aachen University, Ahornstraße 55, 52074 Aachen, Germany
*
Author to whom correspondence should be addressed.
Materials 2020, 13(22), 5188; https://doi.org/10.3390/ma13225188
Submission received: 30 October 2020 / Revised: 13 November 2020 / Accepted: 15 November 2020 / Published: 17 November 2020

Abstract

:
Al-Cu-Li alloys are famous for their high strength, ductility and weight-saving properties, and have for many years been the aerospace alloy of choice. Depending on the alloy composition, this multi-phase system may give rise to several phases, including the major strengthening T1 (Al2CuLi) phase. Microstructure investigations have extensively been reported for conventionally processed alloys with little focus on their Additive Manufacturing (AM) characterised microstructures. In this work, the Laser Powder Bed Fusion (LPBF) built microstructures of an AA2099 Al-Cu-Li alloy are characterised in the as-built (no preheating) and preheat-treated (320 °C, 500 °C) conditions using various analytical techniques, including Synchrotron High-Energy X-ray Diffraction (S-HEXRD). The observed dislocations in the AM as-built condition with no detected T1 precipitates confirm the conventional view of the difficulty of T1 to nucleate on dislocations without appropriate heat treatments. Two main phases, T1 (Al2CuLi) and TB (Al7.5Cu4Li), were detected using S-HEXRD at both preheat-treated temperatures. Higher volume fraction of T1 measured in the 500 °C (75.2 HV0.1) sample resulted in a higher microhardness compared to the 320 °C (58.7 HV0.1) sample. Higher TB volume fraction measured in the 320 °C sample had a minimal strength effect.

1. Introduction

The aerospace industry‘s interest in Al-Li alloys dates back to the 1950′s, and this is attributed to their high strength and weight-saving potential, based on the unique property of the Al-Li system where there is a density reduction of 3% and an increase in the elastic modulus between 5% to 6% with each wt.% of Li added [1]. This alloy group generally possesses remarkable fatigue toughness and cryogenic properties that make them suited for applications in aircrafts [2]. Although there are no commercially known binary Al-Li alloys, a number of alloy additions have led to the development of several high-strength Al-Li alloys [3]. One of such high-strength Al-Li alloys is the precipitation hardenable 2XXX series Al-Cu-Li alloy. With Cu as the principal alloying element, minor alloying element possibilities like Mg, Ag, and Zr or their combinations can lead to a multi-phase system of various strengthening phases such as Al3Li (δ/δ’), Al3Zr, Al2Cu (θ/θ’), Al2CuLi (T1) or Al2CuMg (S’) [4]. The main strengthening phase notable among them is the T1 phase, who’s strengthening effect, when maximized, leads to significant improvement in strength and ductility of the alloy [5].
The principal strengthening effect of the semi-coherent T1 phase is reportedly due to the resulting interfacial energies between the boundaries of the T1 plates and the matrix, which generates high lattice strains [6]. In an earlier work done by the authors [7], they asserted that the T1 plate which lies on the {111} matrix planes, through their broad coherent face, applies more pressure on incoming dislocations rather than with their thin incoherent face. They postulated that any dislocation impingement would rather take place through the path of least resistance, in this case, the thin incoherent face, making the thickness of the plate vital to the strength of the alloy. The authors [8] observed that increasing T1 plate thickness led to decreasing yield strength, but a constant thickness of high-volume fraction T1 rather led to an increase in yield strength in an AA2198 alloy. Depending on the alloy composition and the thermomechanical treatment employed, other phases such as TB (Al.7.5Cu4Li), T2 (Al6CuLi3) or R (Al5CuLi3) phase may form [3].
T1 precipitate found in conventionally processed Al-Cu-Li alloys has a platelet morphology, hexagonal crystal structure, with a p6/mmm symmetry which occurs on the {111}Al crystallographic planes [9]. According to Reference [10], T1 in conventionally processed Al-Cu-Li alloys require prior deformation by cold working, which induces dislocations that act as nucleation sites for its precipitation. The authors further concluded that increasing the dislocation density through various degrees of cold working prior to appropriate artificial ageing increases the volume fraction of finely distributed T1, which consequently improves the strength and ductility of the alloy. Deformation by cold working ahead of artificial ageing is therefore a prerequisite to achieving peak mechanical properties in conventionally processed Al-Cu-Li alloys [5].
In work done in Reference [8] on an AA2198 Al-Cu-Li alloy, the authors reported that through a combination of various degrees of pre-deformation and artificial ageing, mean thickness and diameter of 1.3 and 40 nm at 155 °C ageing temperature respectively, increased to 2 and 55 nm at 190 °C. They also reported a volume fraction of between 0.3% and 3.5% with a conclusion that phases such as ϴ’ and S were only significantly found in non-pre-deformed samples. From investigations by the authors of Reference [11], an average T1 diameter of between 49 and 51 nm and an average thickness of between 1.1 and 1.3 nm were reported after various degrees of pre-deformation and different ageing conditions, suggesting possible formation of Guiner-Preston (GP) Zones (GP I/GP II) or ϴ’ phase. From thermal stability investigations on an AA 2099 Al-Cu-Li alloy in Reference [12], the authors concluded that T1 was thermally stable and was responsible for the strength of the alloy after over-ageing between 200 and 305 °C. Up to about 200 nm of T1 diameter was observed in their work. Using an annular dark-field scanning transmission electron microscopy (ADF-STEM), the authors also confirmed the presence of other phases such as the S, ϴ’ and δ’ after a T83 heat treatment. In studies conducted in Reference [13] using Small-Angle X-ray Scattering (SAXS) and High-Angle Annular Dark Field Scanning Transmission Electron Microscopy (HAADF-STEM) imaging investigations on the structure of T1, found T1 to be very thin in thickness, largely less than 1 nm. They also found streaks in which they attributed to ϴ’ precipitates. A 5–10 nm diameter of T1 occurring on the {111} planes was reported by the authors of Reference [14], who investigated microstructural evolution of an AA2198 Al-Cu-Li alloy using Atom Probe Tomography (APT). Phases such as S and ϴ’ were equally observed at various ageing temperatures. Using APT and Transmission Electron Microscopy (TEM) to characterize a T8 processed AA 2195 Al-Li alloy, the authors [15] concluded that the composition of T1 was non-stoichiometric and that it deviated from the stoichiometry (Al2CuLi) of the bulk equilibrium T1 phase. The authors further concluded that the T1/matrix interface is one of Al-Cu layer rather than an Al-Li layer.
The structure and morphology of TB phase was also characterised by the authors of References [16,17] as rod-like with lattice parameters a = 0.583 nm and a [100]TB || [ll0]AI and [001]TB || [001]AI orientation with the Al matrix in an Al-Cu-Li alloy.
These investigations and many more have been carried out using conventional manufacturing methods through a combination of thermomechanical processes with various analytical techniques. A huge research gap however exists as far as Additive Manufacturing (AM) processing of Al-Li alloys. The qualification of Al-Cu-Li alloys for AM applications will therefore require a comprehensive characterization of their AM-built microstructures, which will bring to the fore the requisite knowledge and understanding for maximizing their strength properties. Due to the enormous AM process advantages compared to conventional manufacturing methods, such as the wide design and fabrication freedom as well as tool-free manufacturing, which helps to eliminate many production steps, among others [18], it is expedient to focus research attention not only on processability, but also microstructure characterisation and their correlation to mechanical properties of the AM-built Al-Cu-Li alloys. The generation of finer microstructures due to the high cooling rates, which is characteristic to AM processes like Laser Powder Bed Fusion (LPBF), usually leads to comparable or even better mechanical properties than conventional methods, consistent with the Hall-Petch relationship [19]. Maximizing the strength potential of the major strength contributing T1 phase as well as other strengthening phases in AM-processed Al-Cu-Li alloys, will present AM as a process route of choice for high-strength and lightweight applications.
In our earlier work [20], we first successfully reported the LPBF processability of the AA2099 Al-Cu-Li alloy with relative density of 98.8% and a micro-Vickers hardness (HV) of 72 HV0.1 using a preheat treatment temperature of 520 °C. The alloy’s recorded microhardness was suspected to be due to the presence of the T1 phase, although no phase characterisation was performed. In a recent work carried out by the authors of Reference [21] on LPBF processability, microstructure and mechanical properties of an AA 2195 Al-Li alloy, the authors focused on as-built (no preheating) and T6 post-heat-treated conditions. They also attributed mechanical properties to T1 precipitates.
In this work, however, focus is given to the characterisation of the microstructure and microstructure phases using a combination of several analytical instruments as well as the quantification of phase volume fractions. The correlation with the microhardness of as-built and preheat-treated LPBF samples is also reported. The influence of preheat treatment as opposed to any form of post-heat treatment on the phase precipitation of the precipitation hardenable AA 2099 alloy is preferred in this investigation.

2. Materials and Methods

The alloy considered under this study, AlCu2.7Li1.8Mg0.3 (AA2099) Al-Cu-Li alloy, was gas-atomized by Nanonval GmbH (Berlin, Germany) under argon (Ar) inert atmosphere. The nominal composition (wt.%) indicating a Cu/Li ratio of 1.3 is highlighted in Table 1 below.
Particle size distribution (PSD), as illustrated in Figure 1, is a graph showing the superimposition of the cumulative particle distribution on the density distribution of the particles. The particles recorded high average aspect ratio and symmetry of 0.84 and 0.92 respectively, as well as a median particle diameter (d50) of 40.5 µm. They were generally spherical in morphology with satellites, recording an average sphericity of 0.8.
Nominal composition of the powder was determined with the Spectro ARCOS Inductively Coupled Plasma Optical Emission Spectroscopy (ICP-OES) (SPECTRO Analytical Instruments GmbH, Kleve, Germany). Using Retsch Technology GmbH‘s CAMSIZER X2 (Haan, Germany), particle size analysis was performed. Microstructure analyses were carried out using the Zeiss Light Optical Microscope (LOM) (Carl Zeiss Microscopy GmbH, Jena, Germany) and the Zeiss Scanning Electron Microscope (SEM); Field Emission Gun (FEG) (Carl Zeiss Microscopy GmbH) with Oxford Instrument Inca X-sight Energy Dispersive Spectroscopy (EDS)/Electron Backscatter Diffraction (EBSD) detectors (Oxford Instruments GmbH, Wiesbaden, Germany). Etching was performed with 0.5% hydrofluoric (HF) acid for the AM-built samples for 15 s. Relative densities of LPBF-built samples were determined with FIJI IMAGEJ open source software (Version 2). Due to the low atomic number of lithium and hence its low characteristic energy radiation, making it not detectable by Energy Dispersive Spectroscopy (EDS), Synchrotron High-Energy X-ray Diffraction (S-HEXRD) at the Deutsches Elektronen-Synchrotron (DESY) (Hamburg, Germany) was used for phase characterisation. Beamline P02.1 (wavelength of 0.20682Å) with a PerkinElmer XRD1621 fast area detector was used for the experiment. The European Synchrotron Radiation Facility (ESRF), (Grenoble, France) Fit2D software (Version 18 beta), was utilised for post-processing of the results from two (2)-dimensional patterns (2D) to 1-dimensional diffraction peaks (1D) with a 2ϴ ring pattern range of 2.85 Å to 11.35 Å. MAUD (Material Analysis Using Diffraction) open source software (Version 2.94), was used for refinement and fitting as well as phase characterisation and quantification. Bright field mode (BF) of the FEI Tecnai F20 JEOL JEM 2000 FX II Transmission Electron Microscope (TEM) was utilised to detect dislocation presence. The JEOL JXA-8530F field-emission electron microprobe analyser (EPMA) (JEOL Limited, Japan) was also used for local elemental analysis of segregations on the grain boundary, especially of Cu for both the powder and AM solidly built sample.
A Computer-Aided Design (CAD) test sample model of 5 × 5 × 10 mm3 (Length × Breadth × Height) dimension designed with the Materialise Magics 24 CAD software (Gilching, Germany) was printed using the Aconity MINI (IPG Photonics YLR 400, F-Theta lens (f = 420 mm, λ = 1030–1080 nm) Laser Powder Bed Fusion (LPBF) equipment (Herzogenrath, Germany) with a beam diameter of 70 µm. This was done under an inert Argon (Ar) gas atmosphere. The test samples were built with a bidirectional XY scanning strategy which turned about at 90 °C on each layer. Seven (7) test samples were printed both in the as-built and preheat-treated conditions to obtain the optimum process parameters, based on which, the densest test samples were chosen for microstructural analytics. The preheat treatment temperatures chosen for the purposes of these investigations were 320 and 500 °C based on the Scheil-Gulliver ThermoCalc (Calculation of Phase Diagrams) CALPHAD-based phase simulation (TCAL6 database). The process parameters which yielded the densest test samples both in the as-built and preheat-treated conditions are highlighted in Table 2 below.
Microhardness measurements were performed with the Buehler Microhardness testing equipment (Esslingen, Germany) using a load of 100 g (0.1 N). The measurements were taken on all the seven printed samples, on both the as-built and preheat-treated samples. The measurement on each sample was determined by averaging nine sets of microhardness measurements: three each at the bottom, middle and top.

3. Results

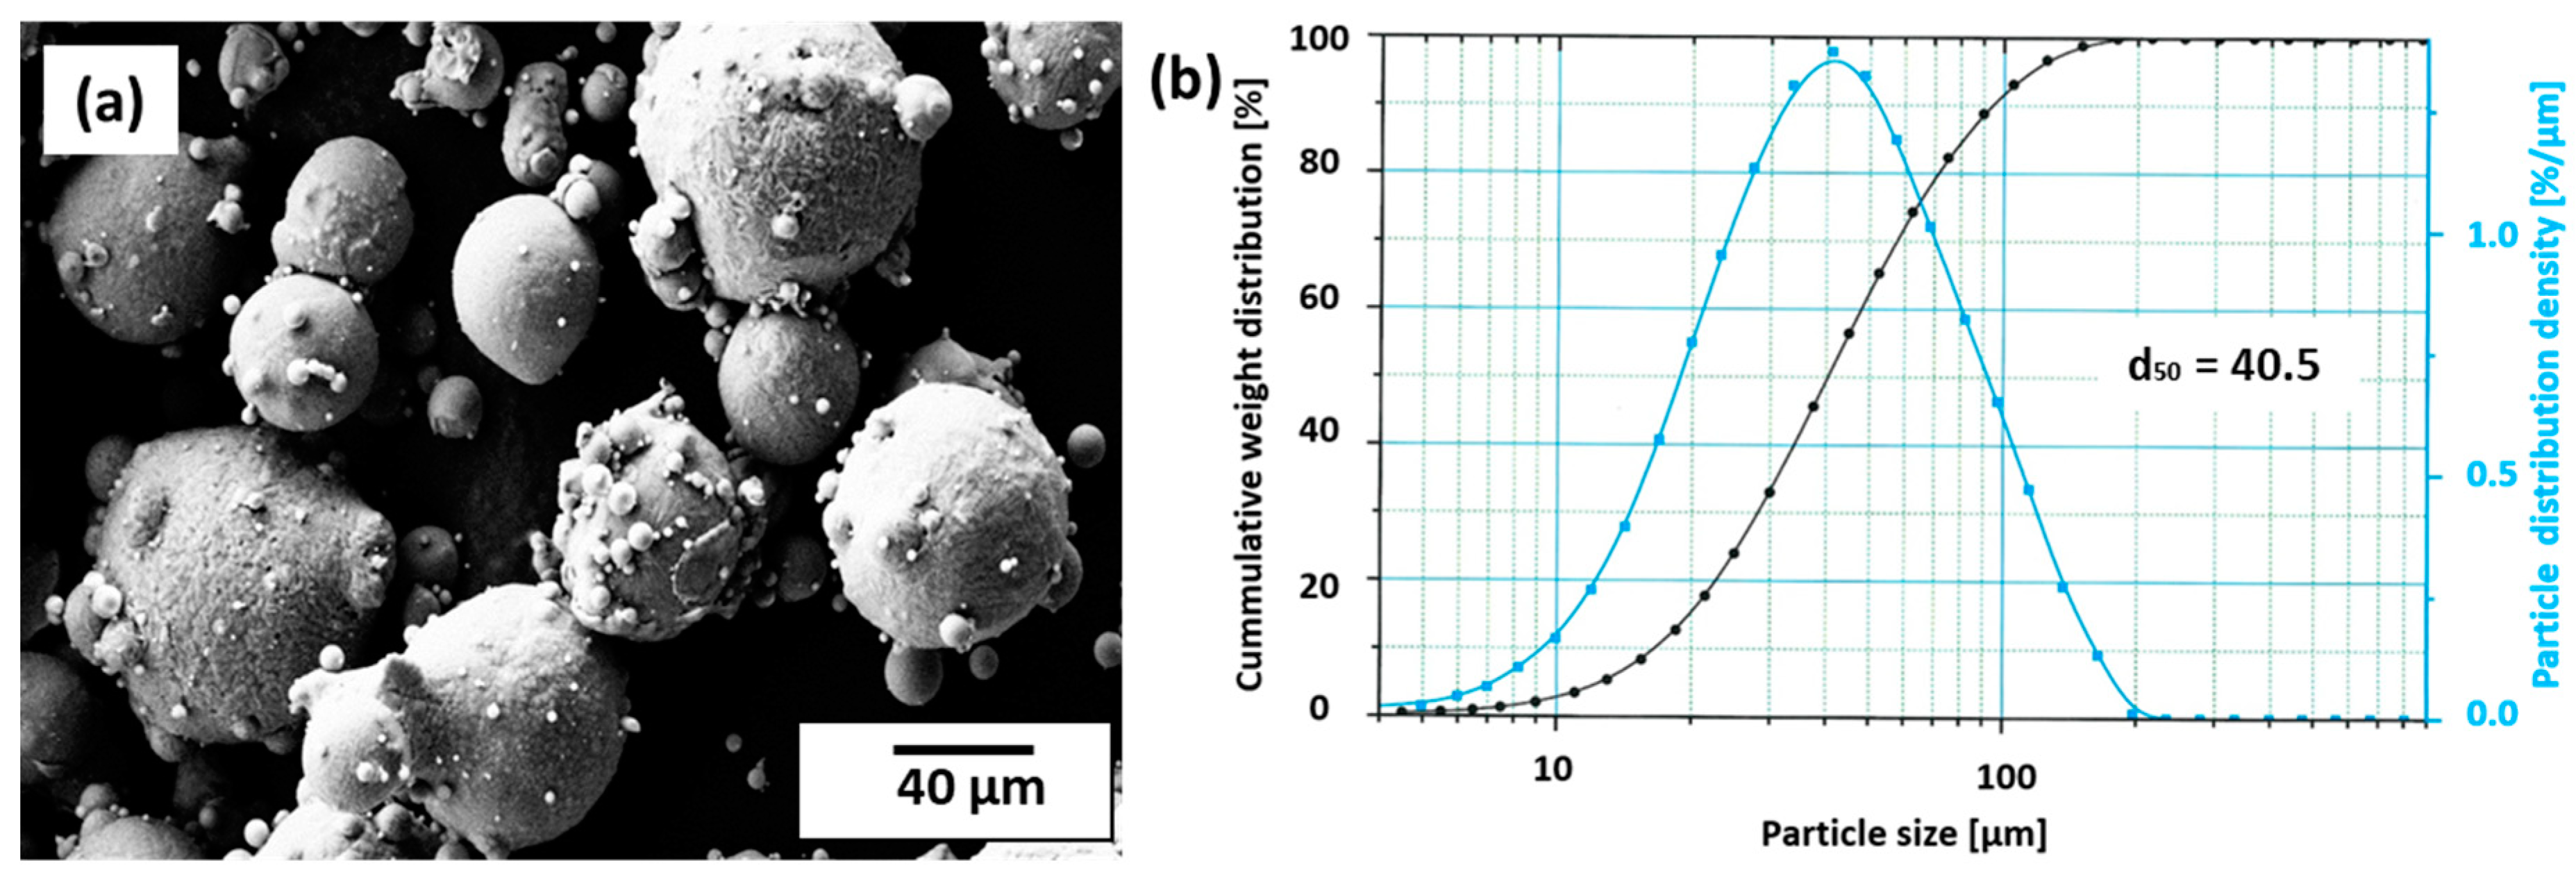
3.1. Powder Characterisation

In the cross-section of the gas-atomized powder shown by the EPMA maps in Figure 2, the microstructures show inter-dendritic phases arising from solidification of the melt droplets during the gas atomization. This was similarly reported in Reference [22] in a gas-atomized Al-Cu alloy with 4 wt.% Cu, and the authors attributed it to partitioning of solute between the liquid and solid phase during solidification. From the EPMA maps, these inter-dendritic phases were found to possess high Cu with significant amounts of Zn and Mg segregations. Mn, however, is seen to be have been homogenously dissolved in the matrix. Owing to the small compositional amount of Li available in the alloy, a local EPMA map of Li could not be generated.

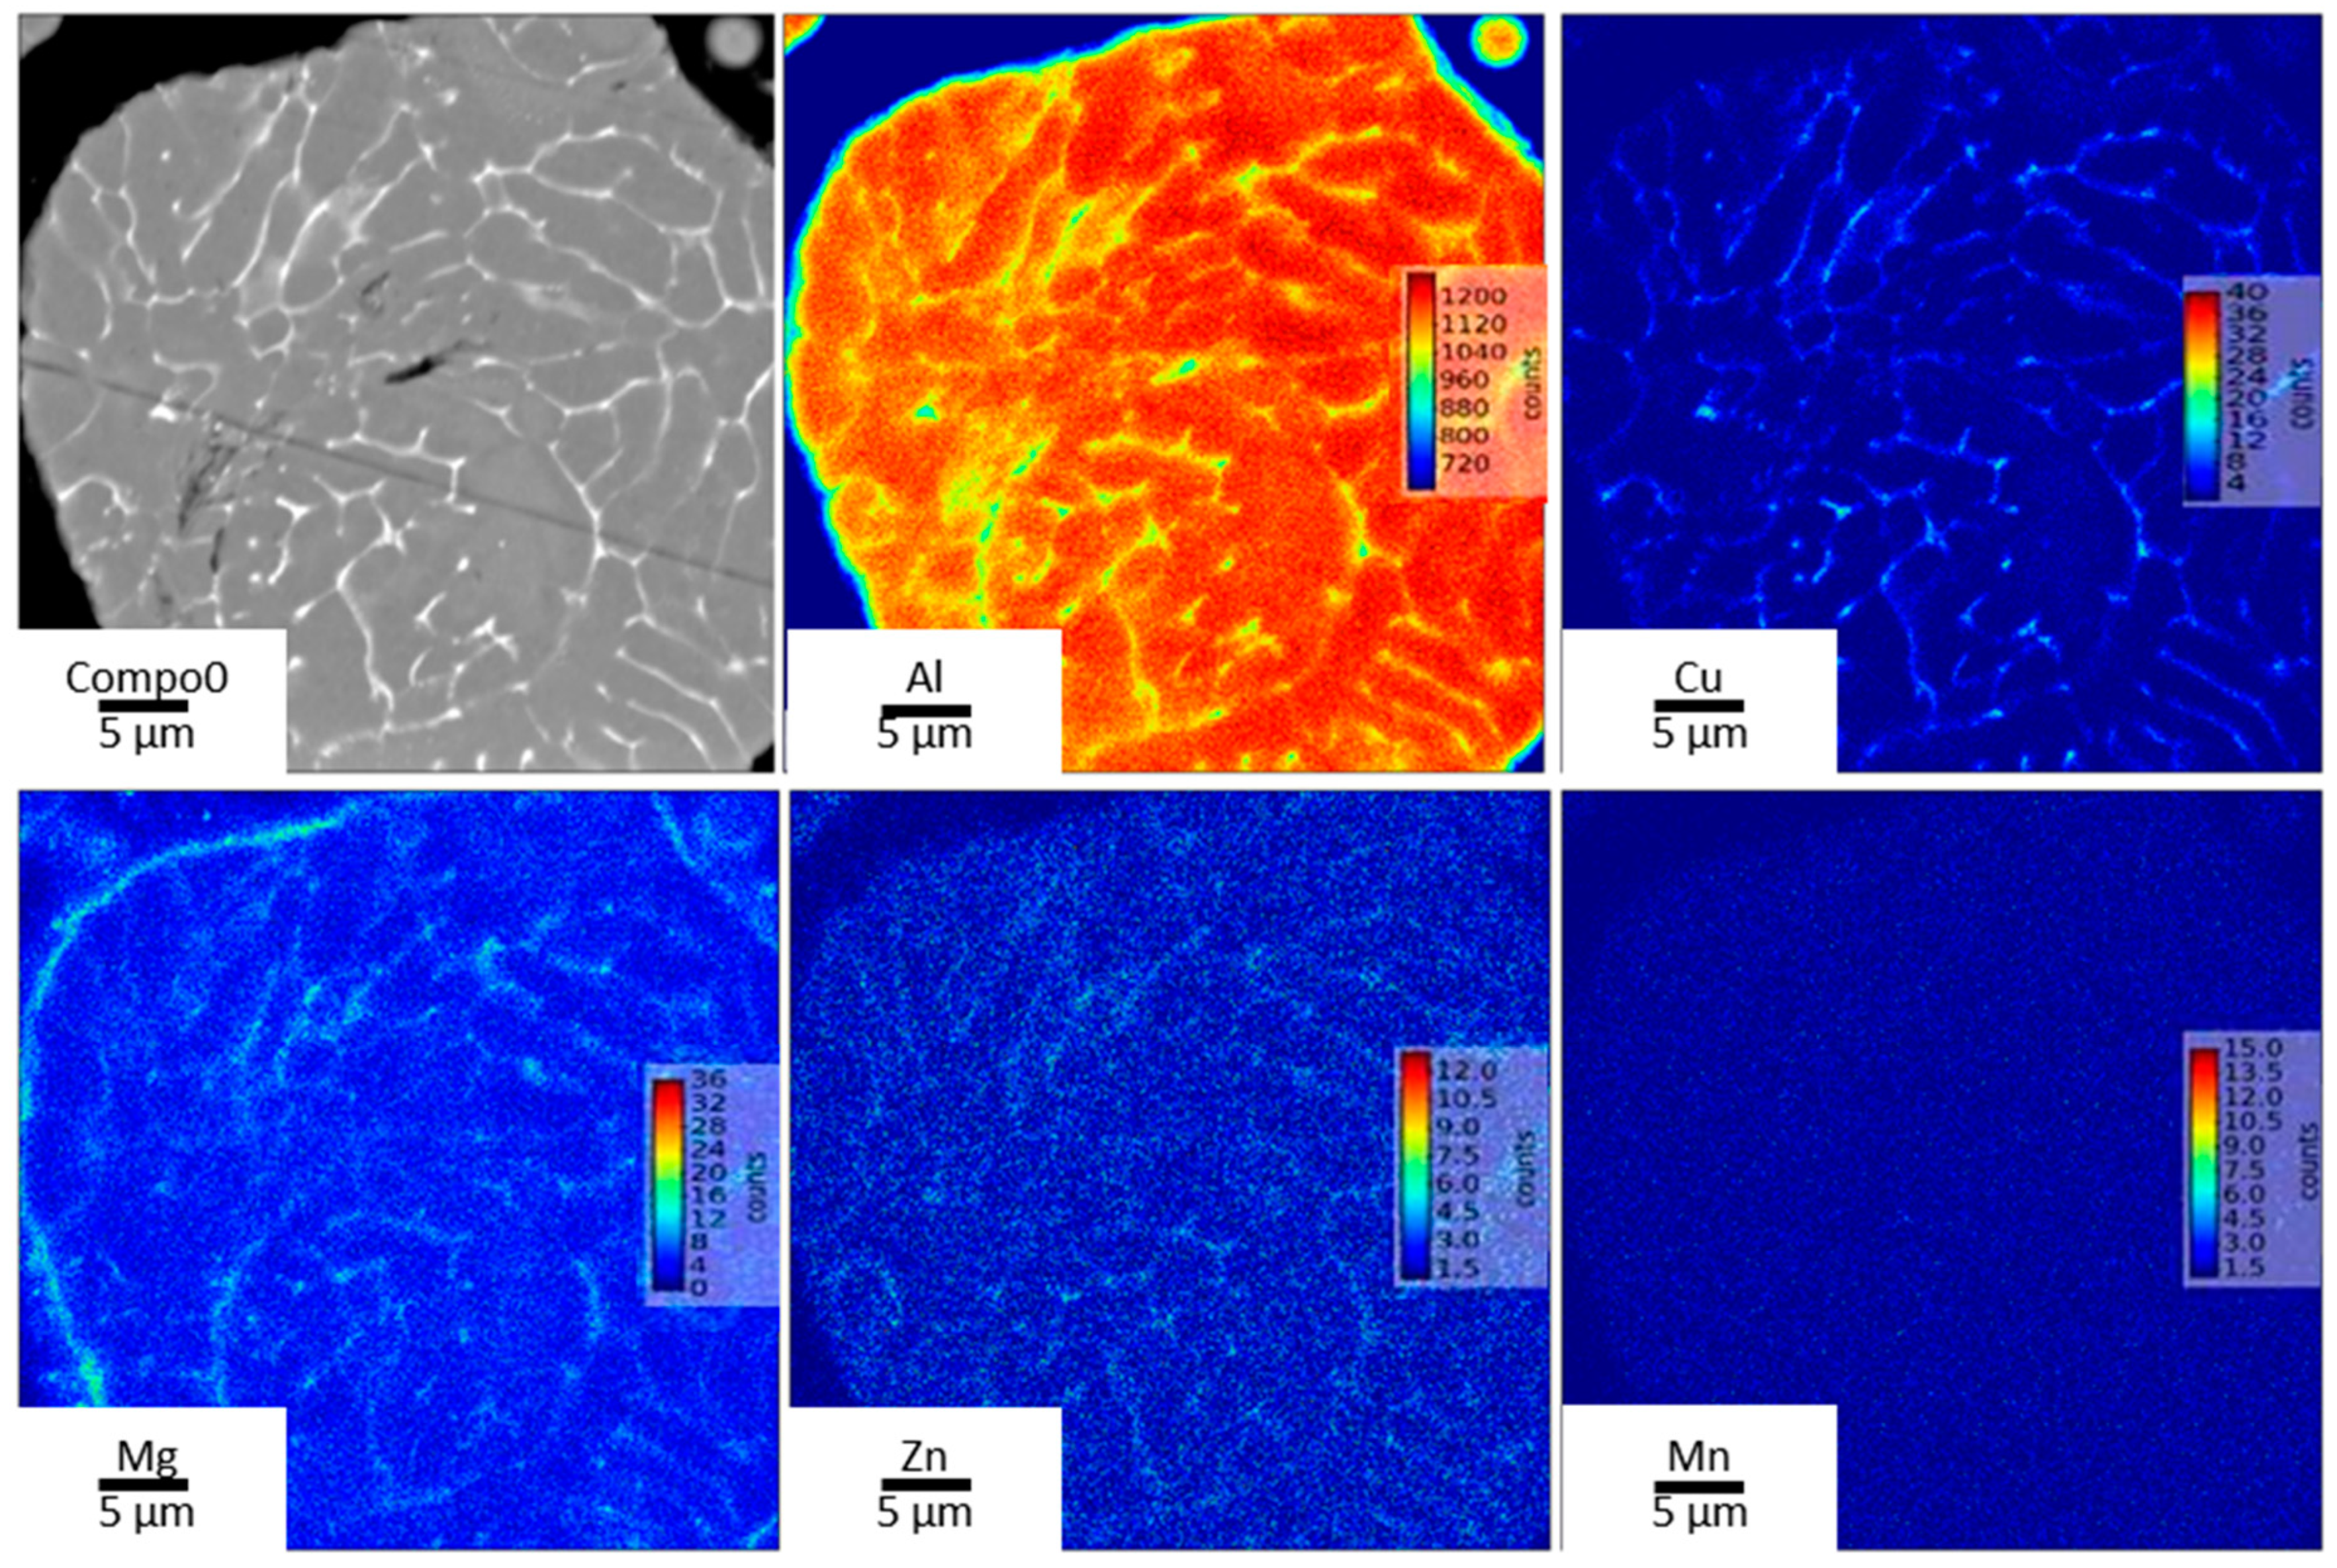
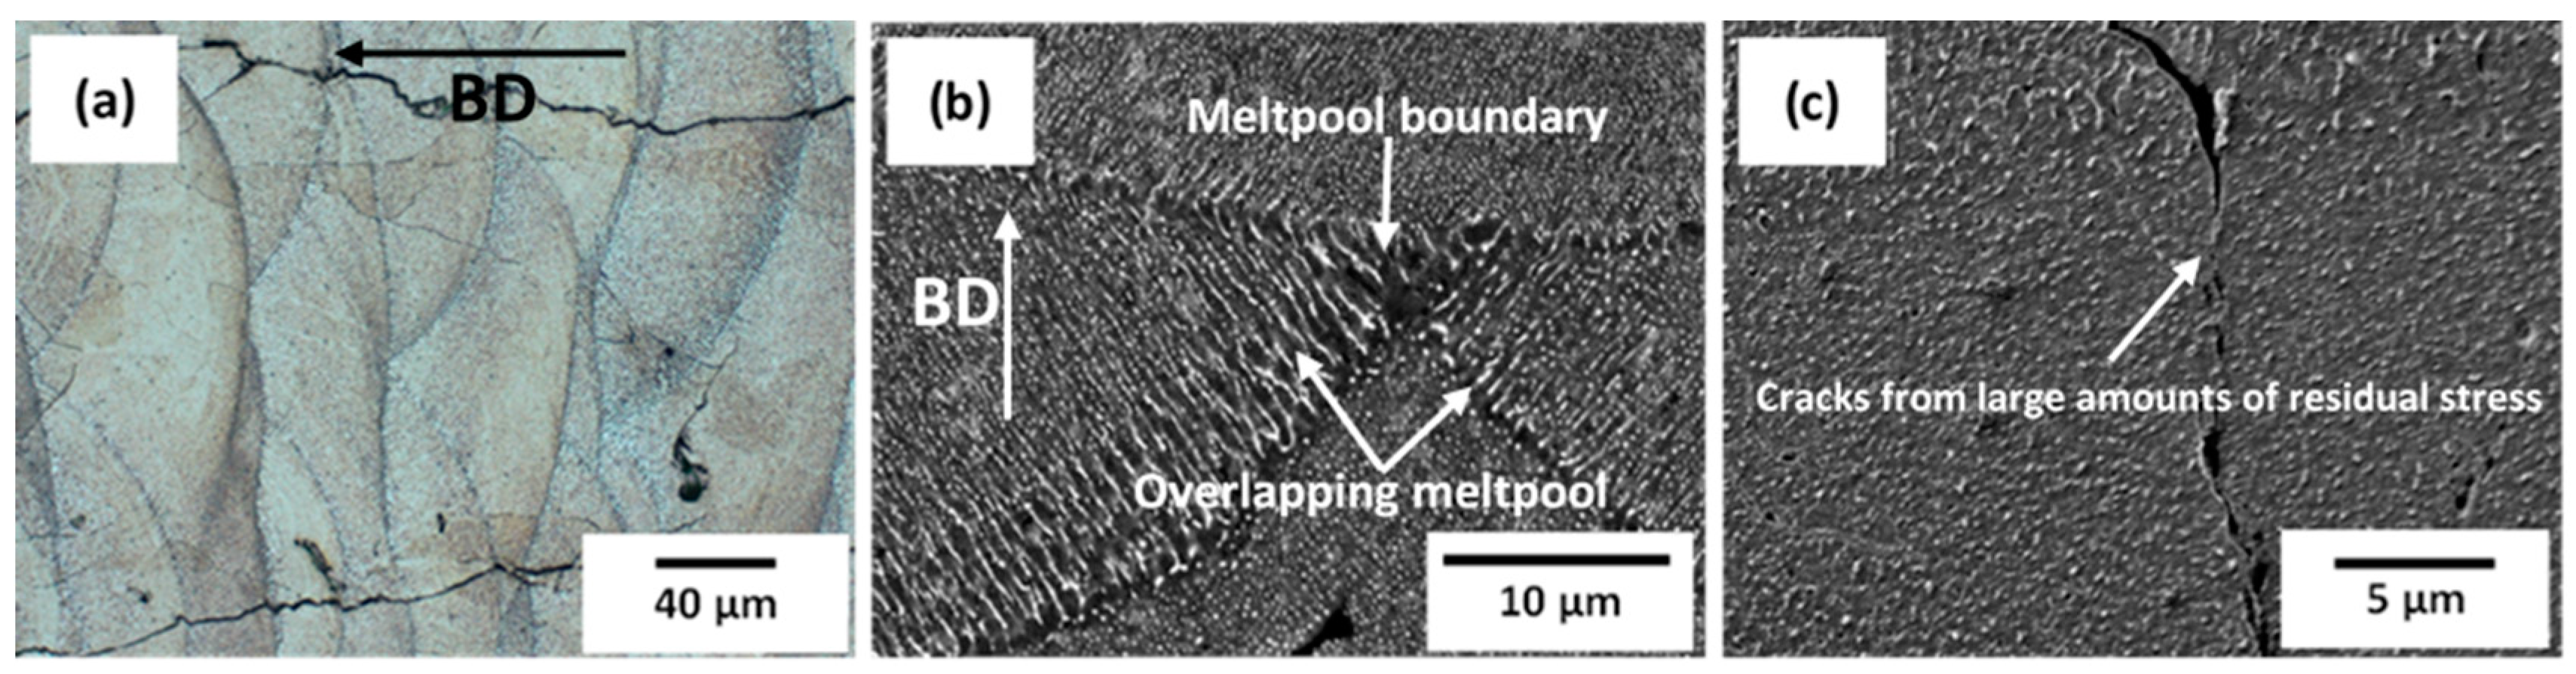
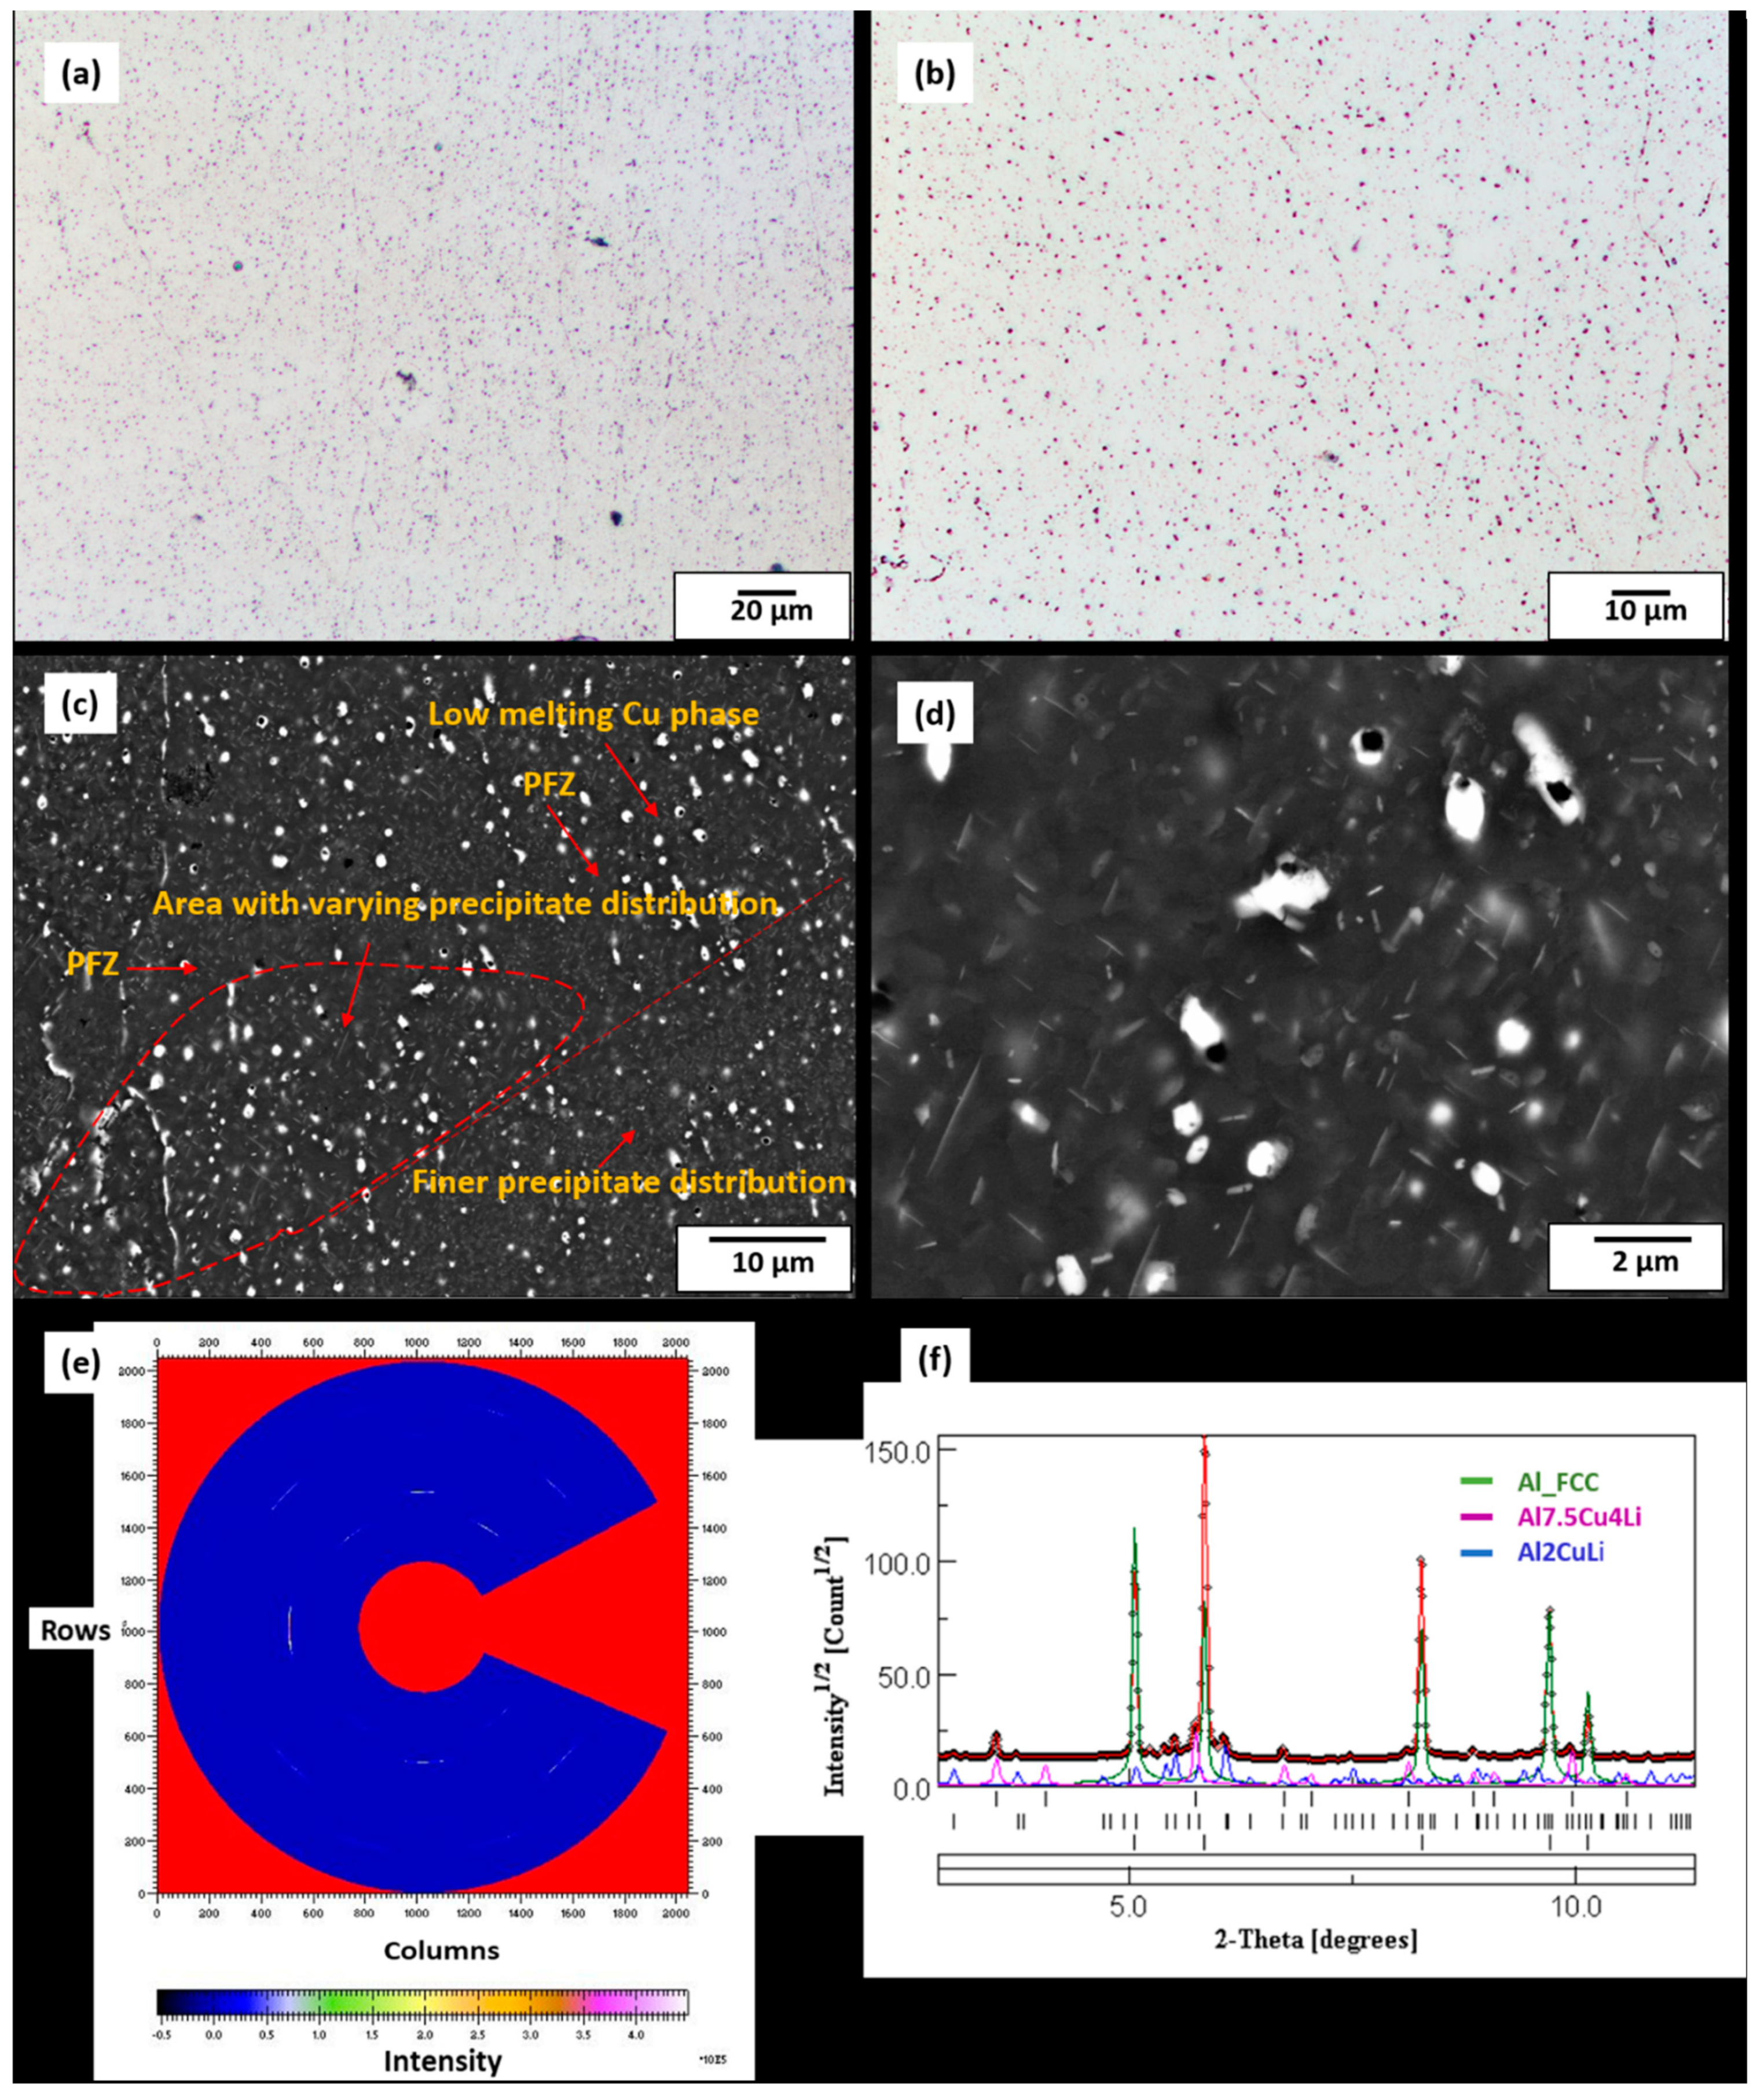
3.2. Microstructure of As-Built Sample

The microstructure of as-built samples shown in the LOM micrograph in Figure 3a, is consistent with as-built microstructures with overlapping melt-pool boundary and with columnar orientation along the building direction. The preferential growth of columnar grains in additive manufacturing during solidification is driven by the steep temperature gradient (G) and the extremely high cooling rates (T) [23]. Columnar grains introduce anisotropic properties in AM-built parts and may be detrimental for multidimensional stress applications, however with inoculation with potent nucleants or the adjustment of process parameters to control temperature gradient and melt velocity, equiaxed grains can be promoted to yield isotropic properties in AM-built parts [24,25]. The steep temperature gradient usually results in the build-up of large amounts of residual stresses in the as-built condition, which may lead to fracture when the local tensile strength is exceeded [26]. As shown in Figure 3a, the residual stress-induced cracks are clearly seen in the as-built sample. Several options are available for minimizing residual stresses in LPBF such as the adoption of in-situ heat treatment, post-fabrication stress-relief mechanisms (post-heat treatment) or the lowering of the high-temperature gradient through variation of scanning strategy between the scan tracks [27]. Post-heat-treated as-built samples at various temperatures proved to be detrimental to the mechanical properties (hardness), as opposed to in-situ heat treatment [20].
The presence of dislocations in as-built LPBF samples have been reported several times by various authors [19,28,29]. According to the authors of Reference [19], who found many dislocation networks in as-built duplex stainless-steel, the high dislocation density in as-built LPBF samples can be compared to prior deformation by cold working, which gives rise to many dislocation networks, as seen in typical conventional manufacturing methods, including the alloy under investigation. As mentioned earlier, conventional processing of Al-Cu-Li alloys such as the AA 2099 alloy requires various degrees of prior deformation by cold working, with appropriate artificial aging treatment to be able to precipitate a high-volume fraction of the main strengthening T1 precipitates. In Figure 3b,c, the SEM micrographs show no presence of T1 plate formation even at a highly observed magnification of 10,000. In the BF mode, using Transmission Electron Microscope (TEM) micrographs, dislocations in the as-built sample were found, as shown in Figure 4a,b.
It stands to reason that, although dislocations induced by the large amounts of residual stress in the as-built condition, which could have acted as potent T1 nucleation sites, T1 nucleation and growth could not possibly have taken place without sufficient time and appropriate temperature. This is consistent with work done by the authors of Reference [21], who found high-density dislocations in the as-built sample with no formed T1 phases, but reportedly found T1 only after T6 heat treatment of the LPBF processed Al-Cu-Li alloy. Through appropriate LPBF preheat treatment (in combination with dissociated dislocation spots which act as nucleation sites), T1 phase formation can be achieved through the LPBF process. This puts LPBF in a competitive advantage compared to conventional processing of Al-Cu-Li alloys through the elimination of prior-deformation by cold working with subsequent artificial ageing treatments [20].
Several authors [30,31,32] have also reported that minor alloying elements such as Mg, Zn and Ag are able to facilitate T1 nucleation. In work done by the authors of Reference [30], it was indicated that the greatest effect on T1 precipitation was by Mg. In all these investigations, the effects of these minor elements were studied with cold working and aging treatment and not in an unconventional manufacturing process like the LPBF. In the current investigations, 0.26 wt.% Mg and 0.67 wt.% Zn could not be said to have facilitated T1 nucleation in the LPBF as-built sample, because of the high cooling rate and the resulting lack of appropriate T1 formation temperature and time. This further reinforces the point that relying on micro-alloying alone may not be enough to facilitate T1 precipitation. However, adopting appropriate T1 formation temperature in combination with sufficient nucleation sites arising from dissociated dislocations and/or with key minor elements such as Mg can help facilitate their formation and growth using LPBF processing.

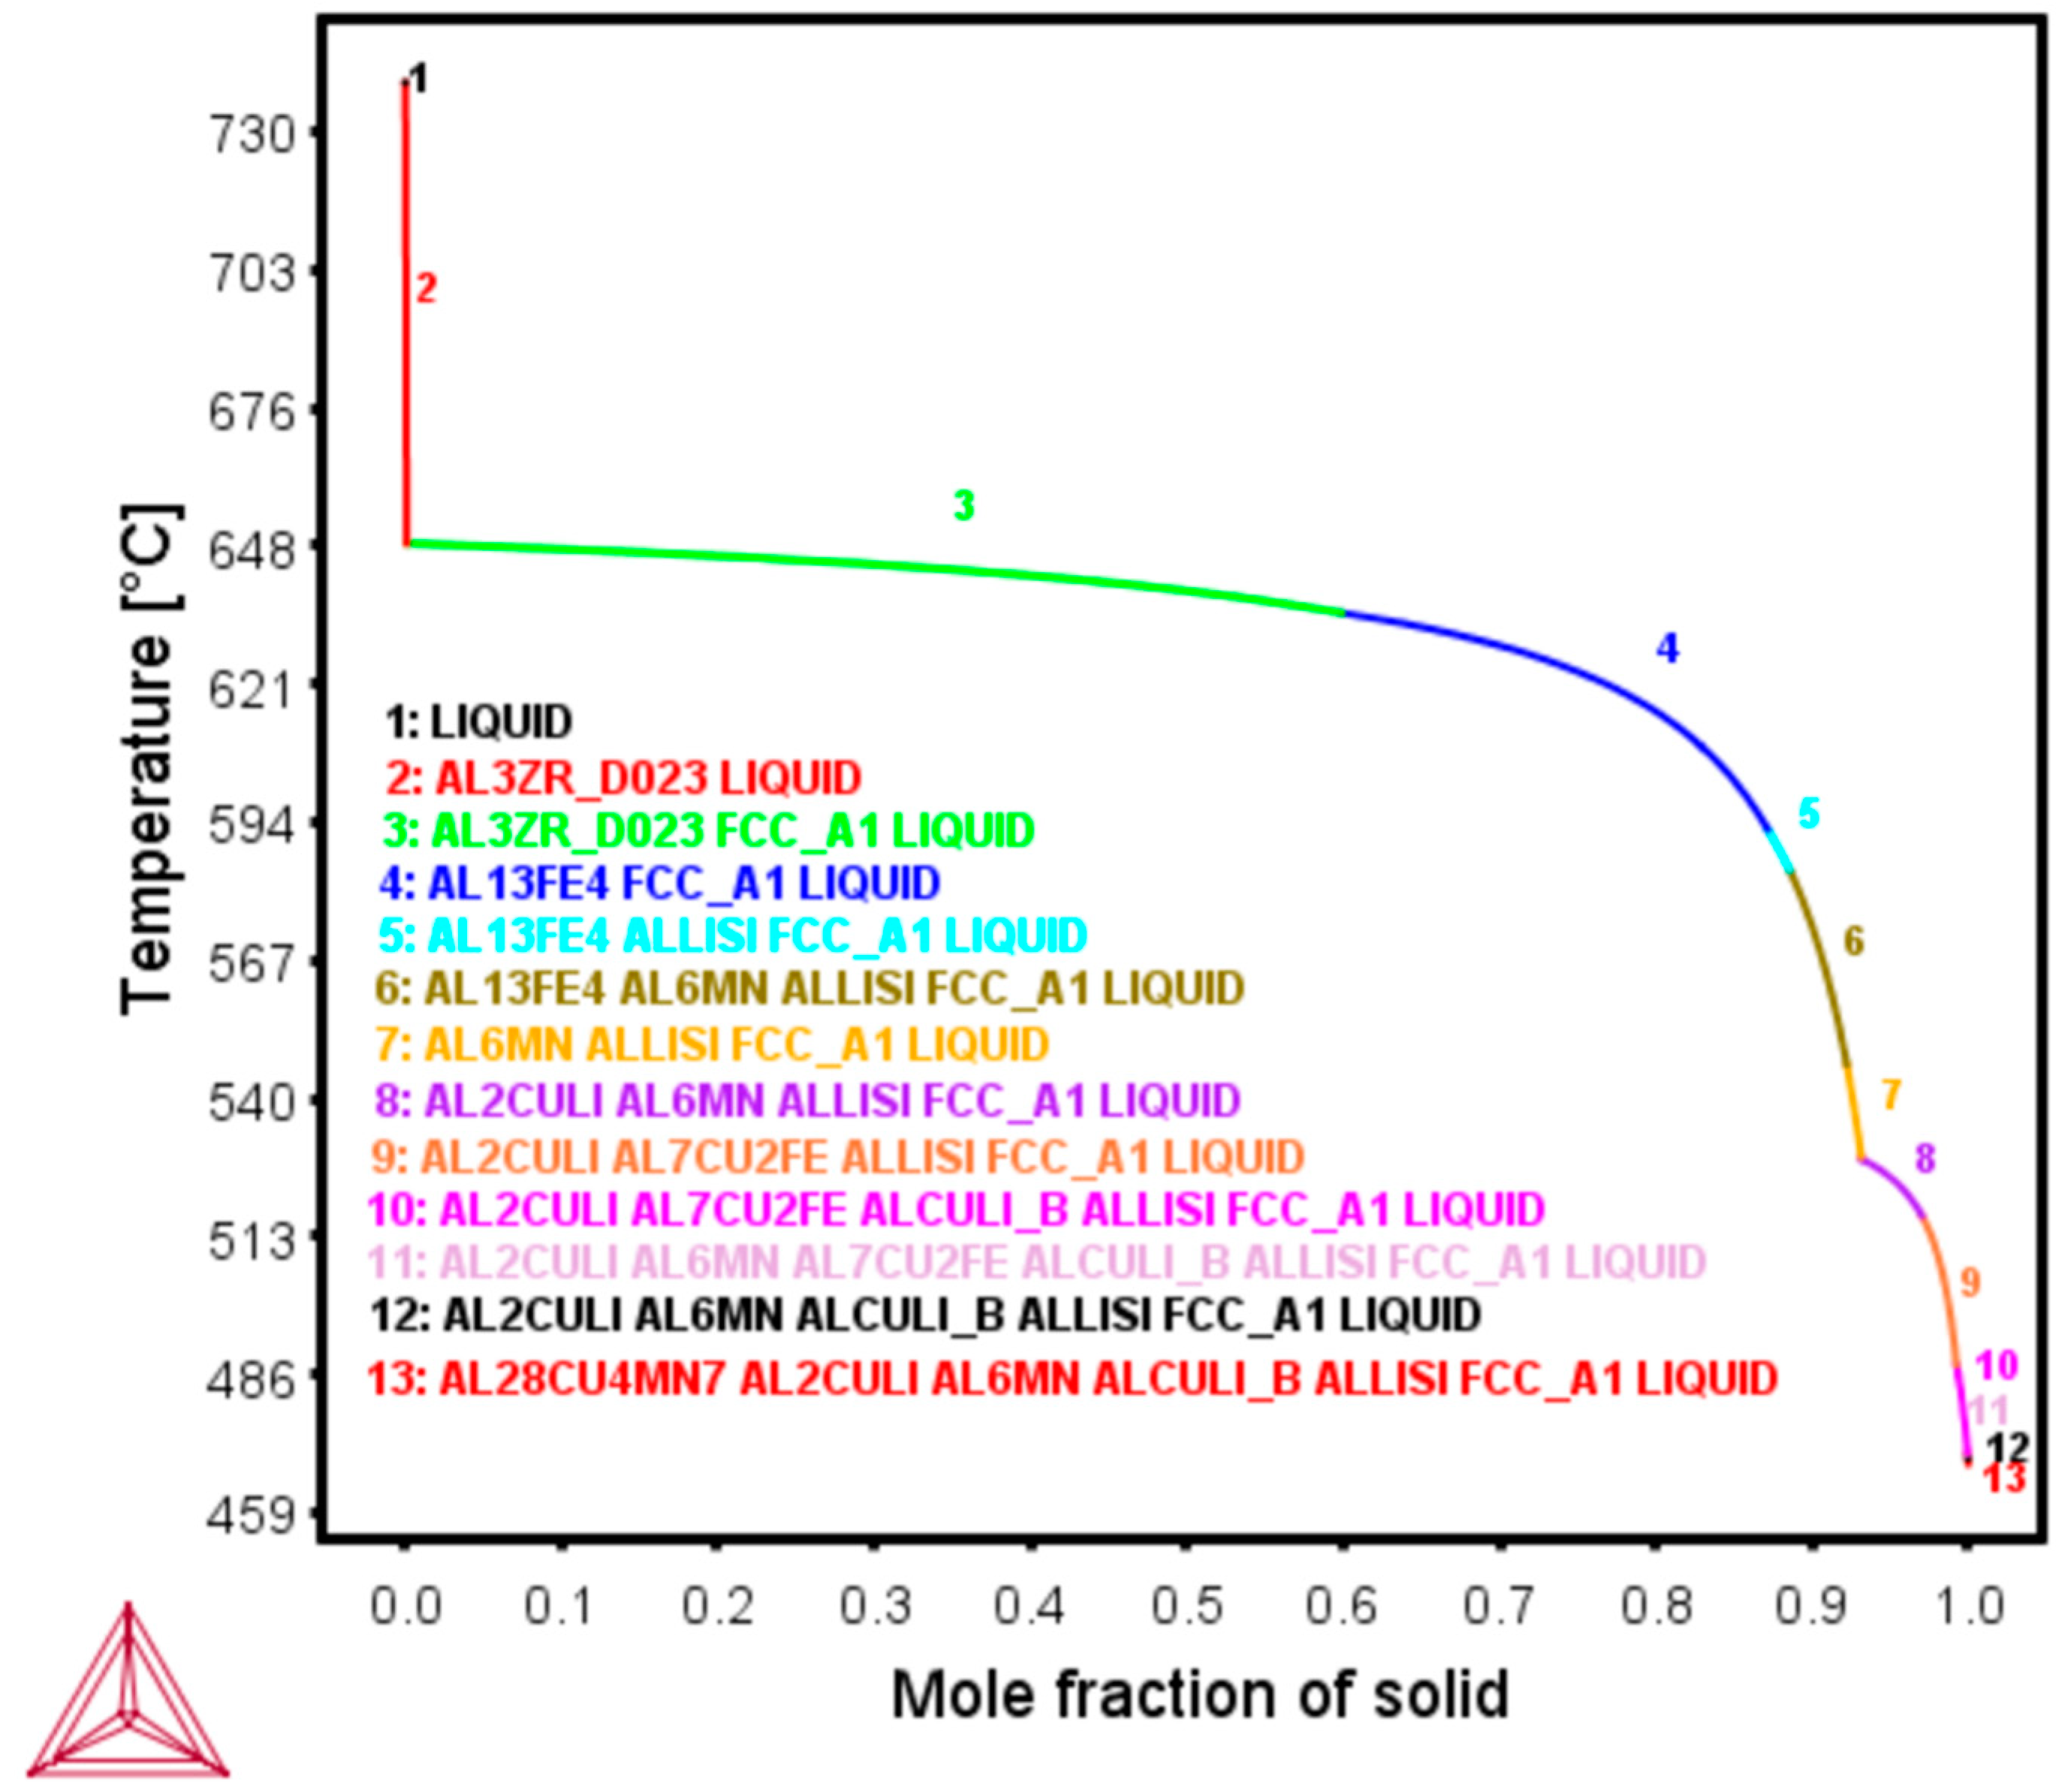
3.3. Phase Field Simulation

T1 formation temperature in a ternary Al-Cu-Li equilibrium system is reported to be greater than 635 °C [3]. However, in an equilibrium ThermoCalc simulation of an Al-Cu-Li alloy of similar composition to the alloy under investigation [20], T1 formation temperature was predicted to approximately range between 240 and 480 °C and that of Scheil-Gulliver between 460 and 520 °C. The authors concluded that LPBF processing using a preheat treatment temperature of 520 °C therefore created favourable conditions for the nucleation and growth of the T1 phase, which was suspected to be responsible for improved microhardness over post-heat-treated samples.
In the Scheil simulation of the alloy in Figure 5 below, T1 is similarly expected to start forming around 520 °C, together with other inter-metallics. Subsequently, at about 480 °C, TB is expected to precipitate along with the T1 phase down to about 460 °C. Notable phases common to the Al-Li system such as S´, ϴ’ and δ’ are not expected to form based on the Scheil calculations. Subsequent sections will further discuss and correlate the phase field simulations with microstructures and phase characterisations of preheat-treated LPBF (320 and 500 °C) samples.

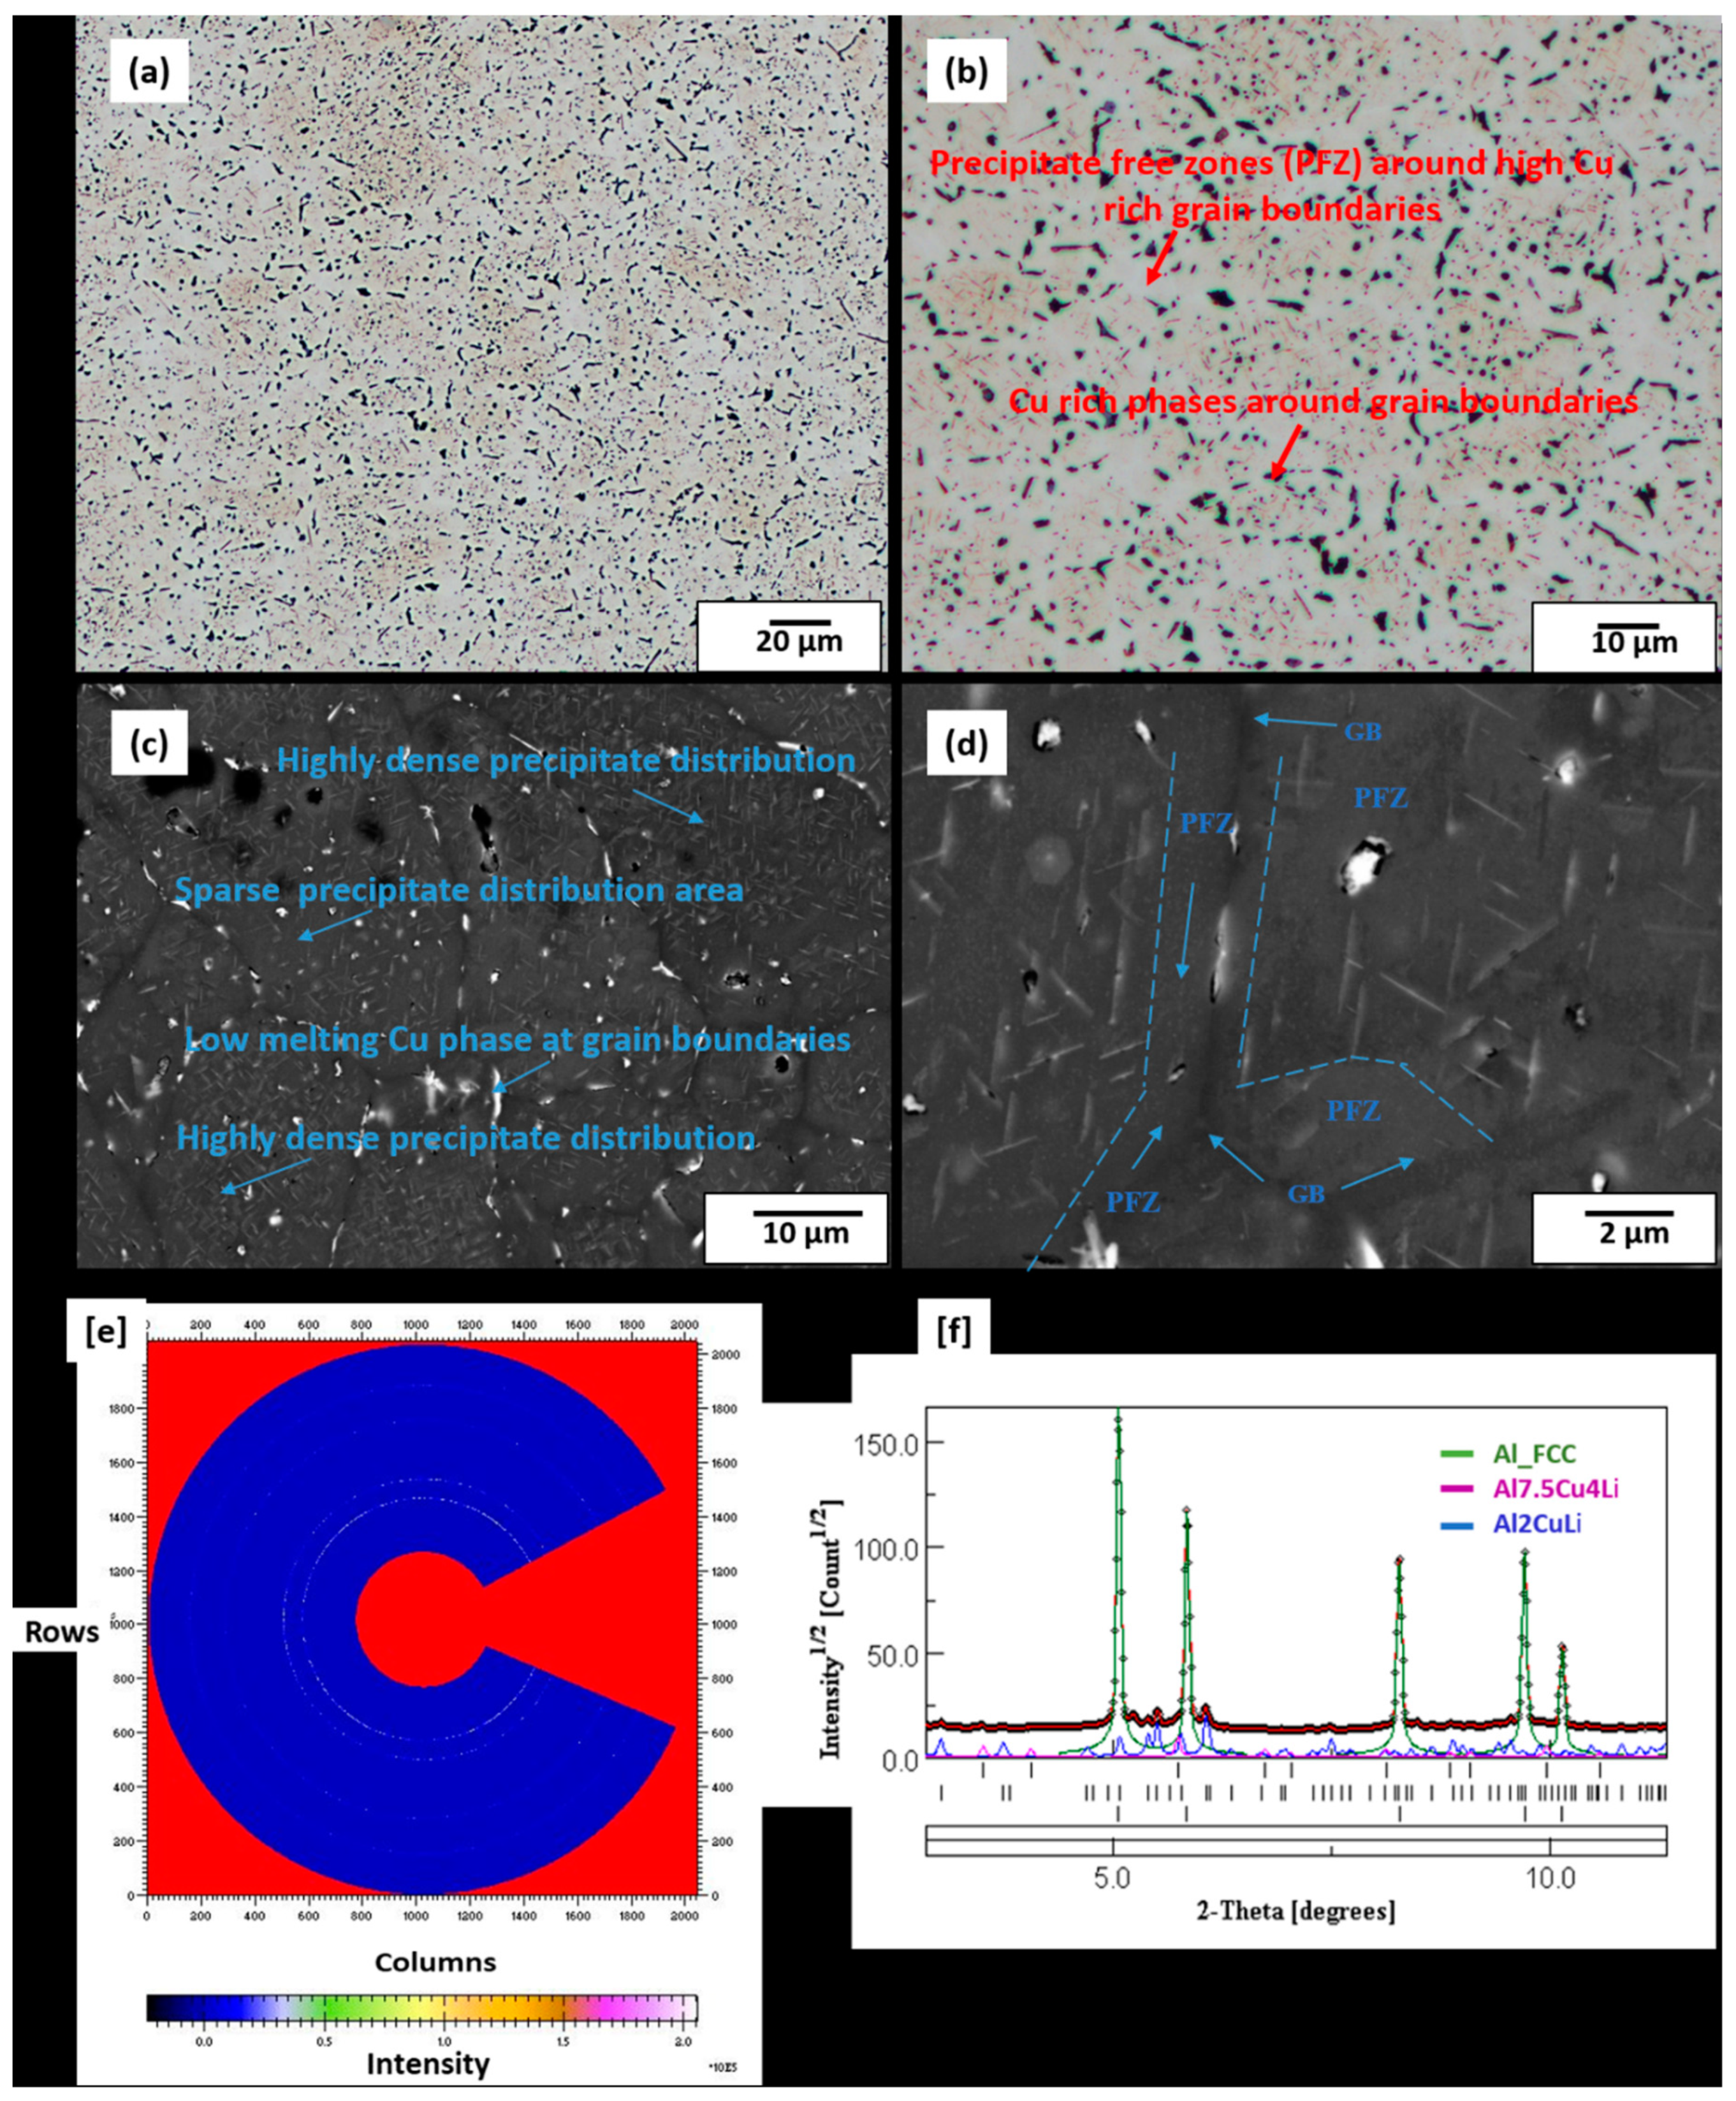
3.4. Microstructure of Preheat-Treated LPBF-Built Sample

LOM microstructures (etched) of 320 °C preheat-treated samples (Figure 6a,b) clearly differ from etched LOM microstructure of the as-built sample (Figure 3a). Contrary to the as-built microstructures, melt-pool boundaries and overlapping melt-pool boundaries are hardly visible after preheat treatment at 320 °C. Heat treatments tend to homogenise microstructures and may have accounted for melt-pool dissolution at 320 °C [33,34]. SEM of 320 °C micrographs shown in Figure 6c,d at different magnification levels show a microstructure with a variety of rod-like precipitates in the matrix, as well as globular-like phases which are seen as bright spots and appear to be Cu-rich. These rod-like precipitates are not only seen to be unevenly distributed, they also vary in size (≤2 µm) and orientation. Since the LPBF process is characterised by localised rapid solidifications [23], disparities in local cooling rates at the preheat treatment temperature (320 °C) may have influenced the varying precipitate morphology across the matrix. Whereas precipitate-free zones (PFZ) are observed in certain portions of the matrix, other portions show sparsely distributed, bigger rod-like precipitates as well as smaller and densely distributed ones (Figure 6d). From the SEM morphological observations, one can suspect these rod-like precipitates to be either T1 (Al2CuLi) or TB (Al7.5Cu4Li), which is also confirmed by the S-HEXRD ring pattern and diffraction peaks shown in Figure 6e,f.
The S-HEXRD masked ring patterns (Figure 6e) were first integrated into one-dimensional diffraction peaks, after which the peaks were refined based on the Rietveld refinement method and fitted with their respective phases (Figure 6f). The diffraction peaks from the confirmed T1 and TB phases were generally of low intensity. The T1 phase formation temperature is predicted to start at elevated temperatures, at about 520 °C according to the Scheil-Gulliver simulation, and continuously down to about 460 °C (Figure 5). Similarly, the Scheil simulation also predicts TB later forming along with the T1 phase between 460 °C and 480 °C. At the 320 °C preheat temperature, however, T1 and TB rod-like precipitates were still present, since this temperature is in their equilibrium stability range. In conventionally processed alloys, the rod-like TB phase is reportedly formed from the metastable Al2Cu (ϴ’) phase by the replacement of Al by Li atoms [35,36]. It was also reported to form during overage treatments at higher temperatures (>350 °C) by the authors of Reference [37] in a conventionally processed AA 2099 alloy and also between 542 and 550 °C for an equilibrium ternary Al-Cu-Li system by the authors of Reference [3]. In the work by the authors of Reference [6], on over-aging and tempered AA 2198, TB was reportedly formed as an equilibrium phase upon the dissolution of phases such as ϴ’ and T1. The non-equilibrium LPBF process which was followed by experimental S-HEXRD phase characterisation confirms that the TB phase can be formed under non-equilibrium conditions, and under this investigation, it was found after the preheat treatment temperature of 320 °C.
At the preheat treatment temperature of 500 °C, LOM and SEM micrographs shown in Figure 7a–d highlight the distribution of rod-like precipitates in the matrix. These precipitates, which were similarly found in the 320 °C preheat-treated sample, are confirmed in this sample as T1 and TB plates after masking and integrating the two-dimensional ring patterns (Figure 7e) into one-dimensional diffraction peaks (Figure 7f) through S-HEXRD diffraction experiments. The peaks were also refined and fitted according to the Rietveld refinement method, and the identified phases were consistent with the Scheil calculations. PFZ around the grain boundaries as well as grain boundaries of highly rich Cu phases can also be observed. These low-melting Cu-rich phases formed due to the non-equilibrium solidification conditions and the fast cooling rates of the LPBF process, which triggered the movement of vacancy-solute atoms’ complexes towards vacancy sinks, like the grain boundaries and their interfaces [38]. Grain boundary Cu-rich films were also seen in conventionally produced AA2099 Al-Cu-Li alloy and were described as being susceptible for corrosion attack [39]. The EPMA maps in Figure 8 further reveal the segregated Cu-rich phases, which appear as thin films on the grain boundaries of the 500 °C preheat-treated sample. In the 320 °C preheat-treated sample, however, these Cu-phases appeared globular in shape. The Cu-rich phases observed in all the preheat-treated samples also contained significant Mg and Zn concentrations, which is consistent with the EPMA mapping observations of the gas-atomized powder cross-section. Several options can be adopted in the reduction of grain boundary Cu-rich phases as well as the elimination of PFZ. These include grain refinement, alloy chemistry modification, particularly the Cu/Li, Cu/Mg ratio and the precipitation of the S’ (Al2CuMg) strengthening phase, which is known to eliminate PFZ in Al-Li alloys [40]. The presence of PFZ around grain boundaries have been widely reported [40,41,42] in conventionally processed Al-Li alloys. They were either attributed to grain boundary misorientation, depleted vacancies around grain boundaries which were conducted towards grain boundary sinks or the depletion of solute around grain boundaries [42]. In this multi-precipitation Al-Cu-Li system, Cu/Li ratio, as well as the presence of other minor solute elements such as Mg, Zr and Ag, among others, can either influence T1 precipitation kinetics or its preferential precipitation over other phases [9,43]. Although T1 and TB precipitates are also known to form both within the grains and on grain boundaries [9], perhaps the segregation of Cu to grain boundary sinks as shown in Figure 7a–d might have created locally depleted Cu zones around the grain boundaries and deprived those areas of Cu available for the formation of T1 and TB.

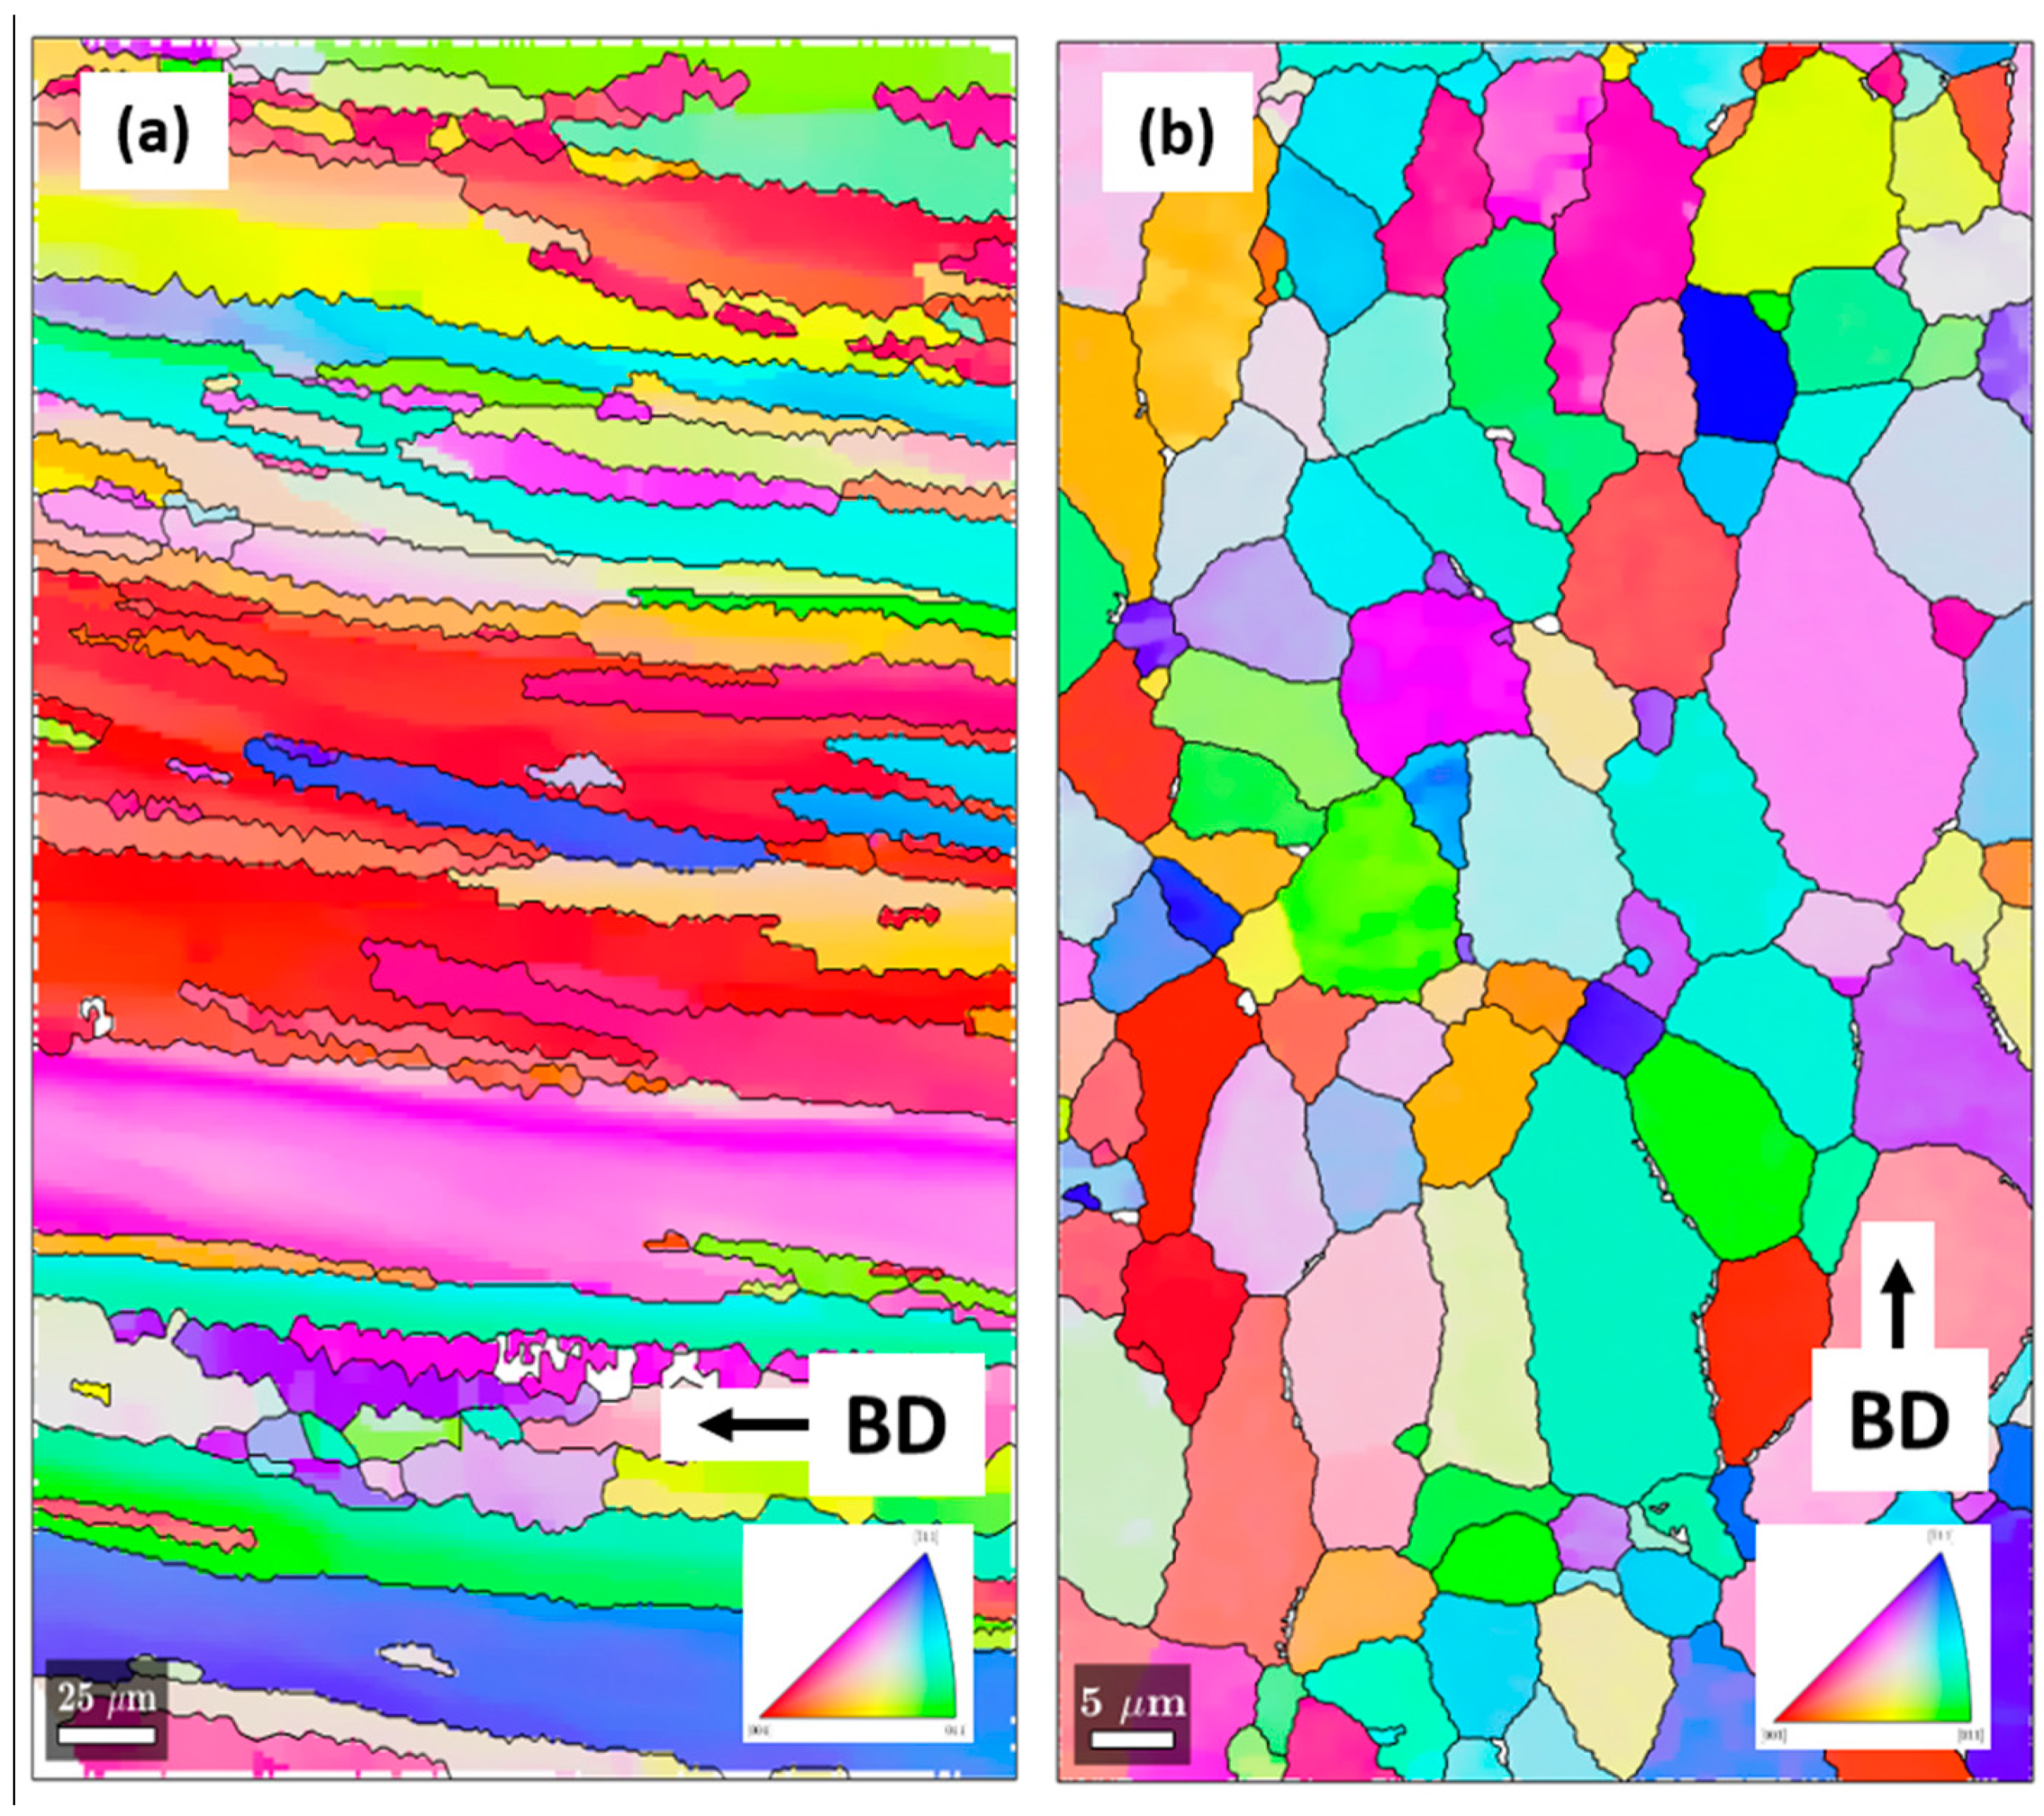
3.5. EBSD Characterisation
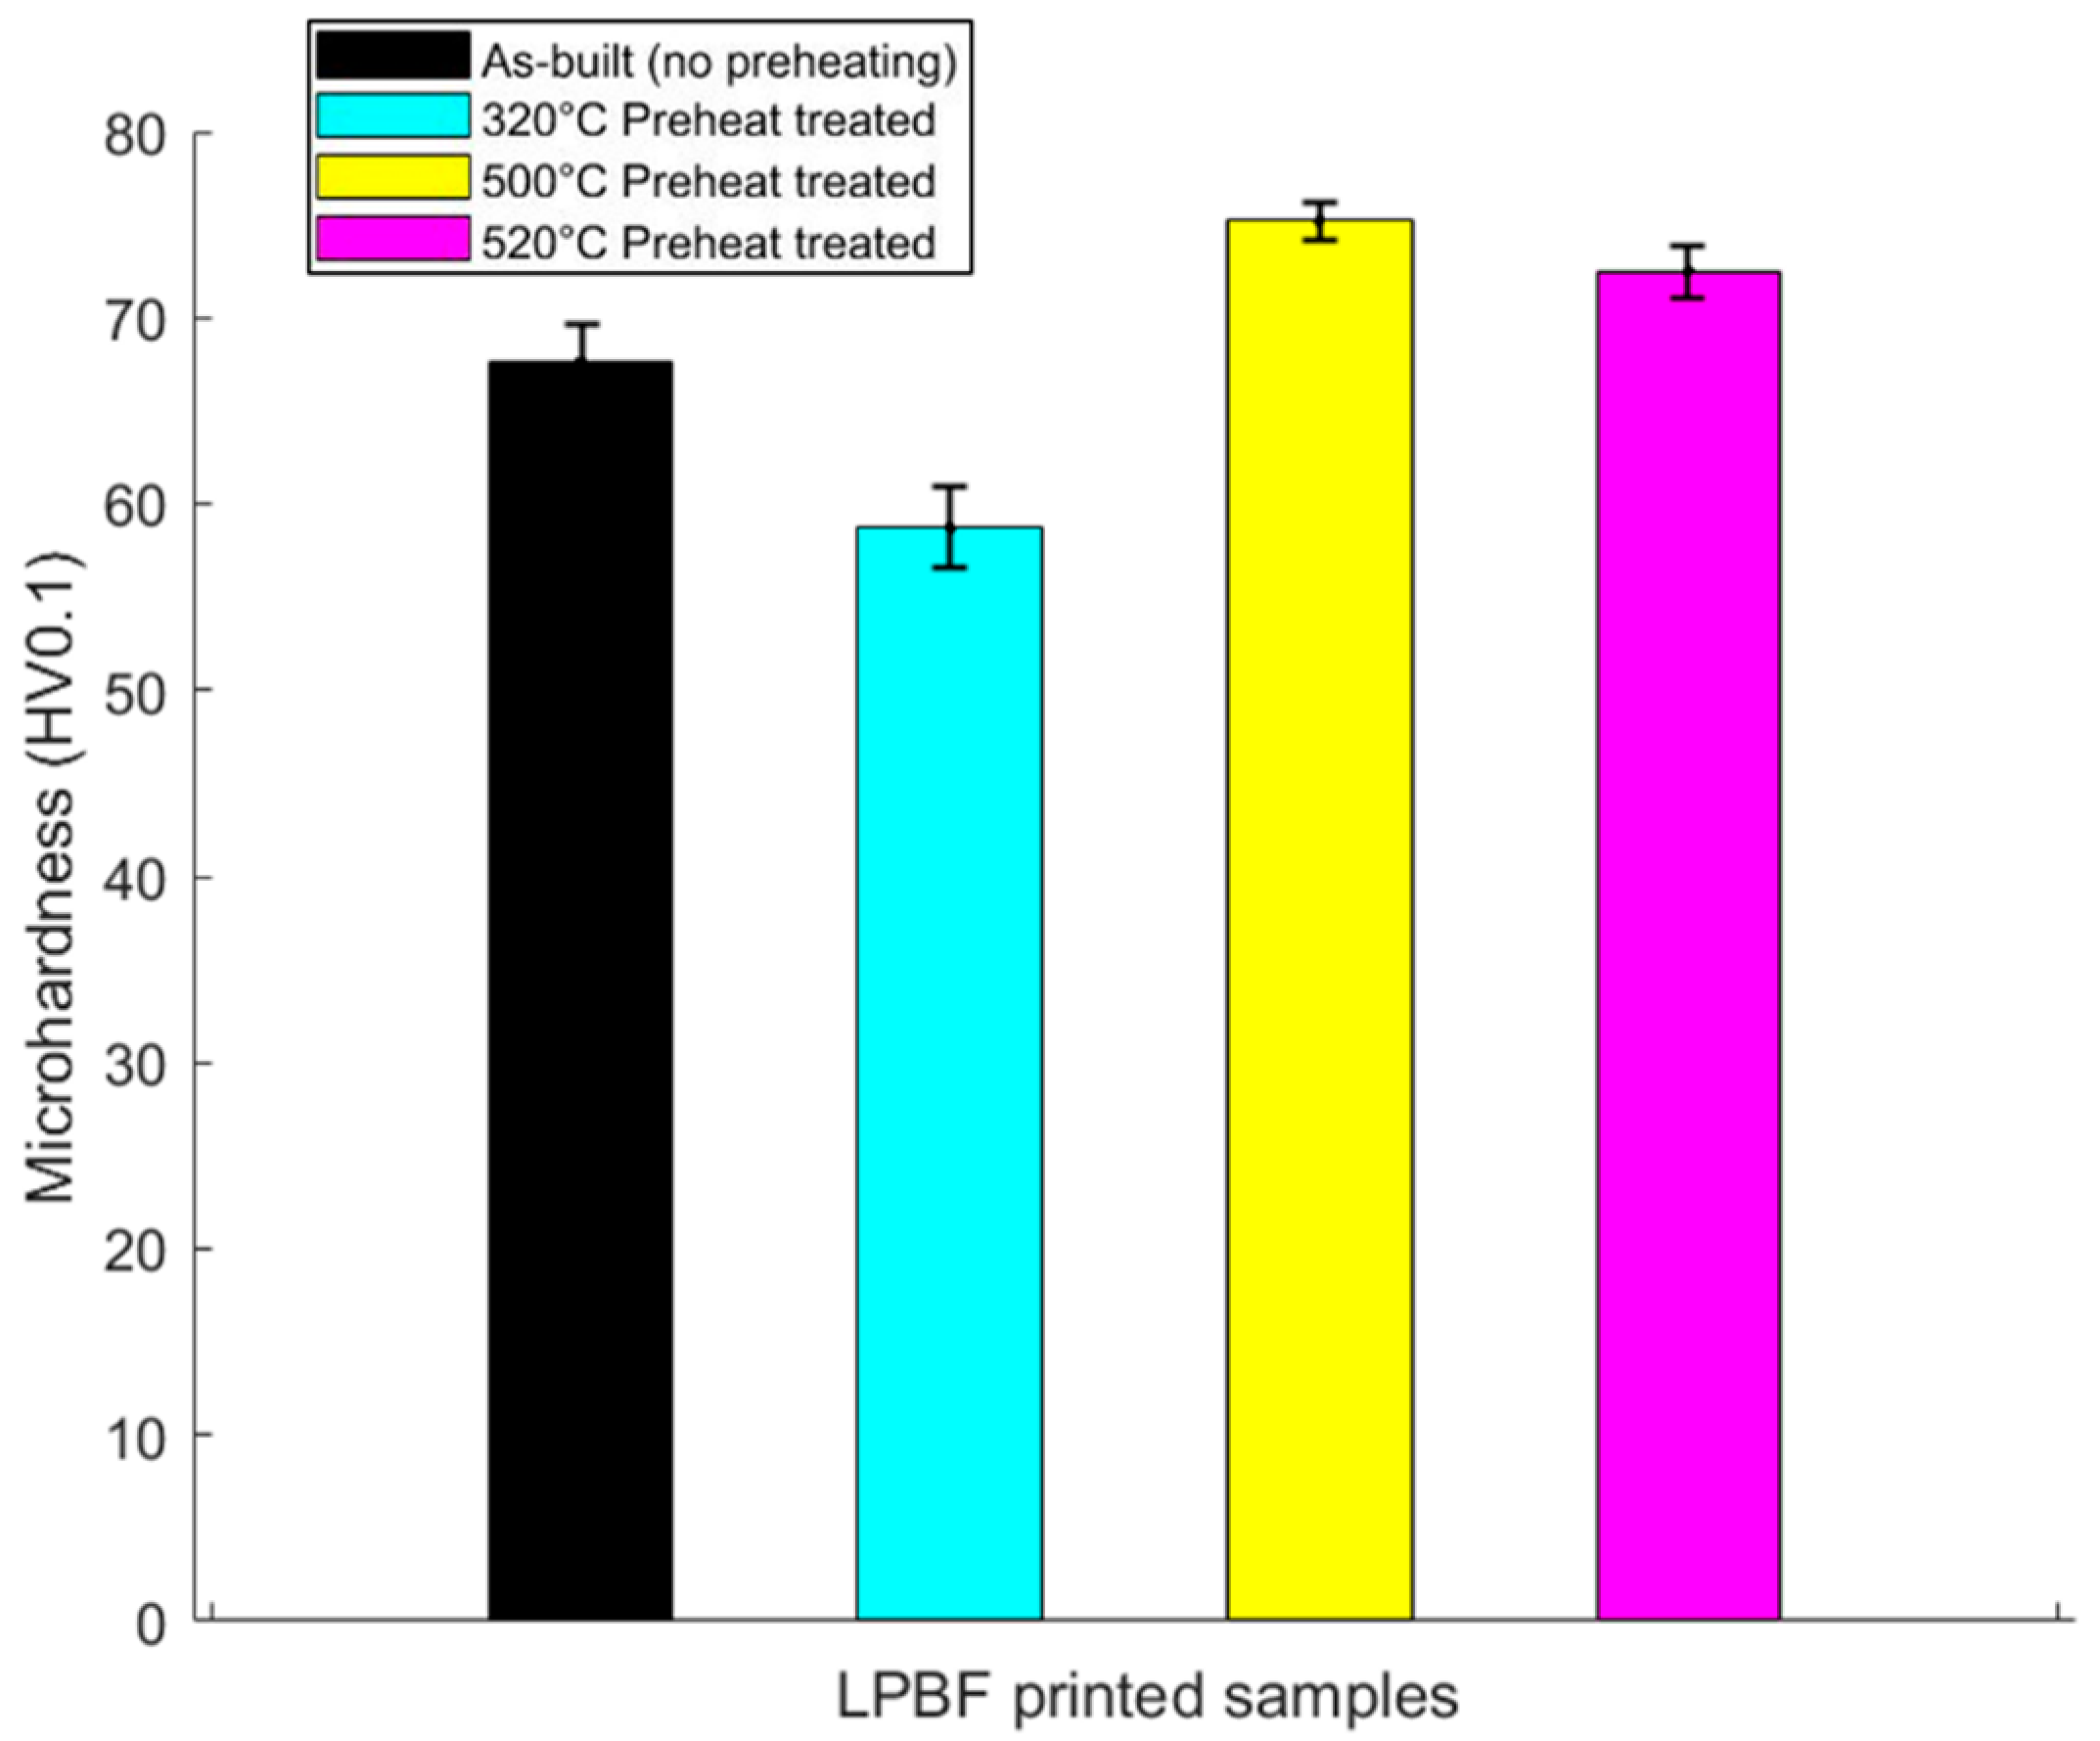
Figure 9 highlights and compares EBSD Inverse Pole Figure (IPF) figures of the preheat-treated samples at 320 and 500 °C. A sharp contrast can be observed in terms of grain structure and orientation. It is clearly seen in Figure 9a that the 320 °C preheat-treated sample is characterised by elongated grains which are also oriented along the building direction. The influence of the unidirectional flow of heat flux away from the substrate plate towards the building direction, the temperature gradient thereof and the fast cooling rates which persisted even after preheat treatment of 320 °C can be said to be responsible for the elongated grain growth orientation towards the building direction [44]. Preheat treatment temperature of 320 °C is expected to have slowed down the cooling rate through lowering the temperature gradient (G). The ratio of G to R (rate of solidification), which is predictive of the solidification morphology, was probably not sufficient enough to cause a grain transition into a completely equiaxed structure. A nearly equiaxed grain structure is seen in Figure 9b, of the 500 °C preheat-treated sample. Through the combination of process parameters such as the laser power and scanning speed, coupled with the 500 °C preheat treatment temperature, the cooling rate and the temperature gradient reduced, creating optimum conditions for the growth of nearly equiaxed grains, as observed in the EBSD IPF figure [45].

3.6. Microhardness

A comparison of averaged microhardness of as-built, 320 °C and 500 °C preheat-treated samples using a load of 100 g is illustrated in Figure 10 below. The microhardness illustration shows that the highest microhardness was recorded in the 500 °C preheat-treated samples, followed by the as-built samples, and then that of the 320 °C preheat-treated samples. The highest recorded microhardness for the 500 °C preheated samples was 75.2 HV0.1 compared to 58.7 HV0.1 for 320 °C and 67.6 HV0.1 for as-built samples, respectively. The microhardness of 72 HV0.1 for 520 °C preheat-treated samples in our earlier work [20], shows that it is possible to achieve a relatively higher microhardness with a lower preheat treatment temperature (500 °C). The build-up of residual stresses in the LPBF-built part, typically in the as-built condition, is due to the high-temperature gradient, thermal contraction and expansion or the lack of uniformity in plastic deformation as a result of heating and cooling cycles, and is known to boost hardness properties [46]. High residual stresses can equally be detrimental to part properties, inducing residual stress-related cracks, as shown earlier in this work. As stated earlier, stress relief, preheat treatment or the adoption of appropriate scanning strategies are possible mitigation steps which can be adopted to deal with the detrimental effects of residual stresses. Since no known strengthening phases were detected in the characterised as-built microstructure, the relatively high microhardness (67.6 HV0.1) can be attributed to the build-up of large amounts of residual stress.
From our earlier work, post heat treatment rather than pre-heat treatment on the precipitation hardenable alloy [20] proved to have detrimental effects on the mechanical properties (microhardness). In this work, however, for both preheat-treated samples (320 °C, 500 °C), the 500 °C samples recorded superior relative density and microhardness. Quantitative compositional phase measurements by MAUD software shows that while the volume fraction of the TB phase was higher at 320 °C than at 500 °C preheat treatment temperature, the T1 phase was conversely slightly higher in volume fraction at 500 °C preheat treatment temperature. A TB volume fraction of 4.2% was recorded at 320 °C and 0.34% at 500 °C, while T1 volume fraction was 2.1% at 320 °C and 2.9% at 500 °C preheat treatment temperatures, respectively. The contribution of TB phase to the strength of Al-Cu-Li alloys is regarded as not significant [6] and that explains why although a higher volume fraction was recorded in the 320 °C samples, it possessed a lower microhardness, as seen in Figure 10. The other possible reason is process-related defects from pores and cracks, which were also observed, although this is considered as having minimal contributing effect. The higher microhardness measured at the 500 °C preheat treatment is attributed to the comparatively finer grain structure shown by the EBSD IPF figure, the higher part relative density, and, most significantly, the strengthening effect of the T1 phase, which has been confirmed by various authors [5,12,47,48]. This is also evidenced by the slightly higher T1 volume fraction recorded at the 500 °C preheat treatment temperature and confirms our earlier work [20] on AM (LPBF)-processed AA2099 Al-Cu-Li alloy, where increased microhardness was attributed to the strengthening effect of the T1 phase after 520 °C preheat treatment temperature. The authors of Reference [21], after LPBF processing of AA2195 and performing a T6 thermal treatment, also attributed improvement in mechanical properties to the T1 phase. The TB phase is, however, in this work, reported for the first time in an AM (LPBF)-processed Al-Cu-Li alloy, although its strengthening effect is regarded as not significant. The precipitation of a high-volume fraction of strengthening phases, including T1, is therefore consequential to improving the mechanical properties of the alloy.

4. Conclusions

The Al-Cu-Li alloy is a multi-precipitation system with a precipitation kinetics dependant on several factors: (a) alloy chemistry (Cu:Li ratio, Cu:Mg ratio and the presence of Mn, Zr, Zn or Ag) and (b) appropriate heat treatment strategies that help facilitate the formation of several phases, including the main strengthening phase, T1 (Al2CuLi). The T1 formation through conventional manufacturing methods using various forms of thermomechanical treatments requires prior deformation by cold working with appropriate aging treatments. There has been extensive reporting on the microstructure of conventionally processed Al-Cu-Li alloys but not much is known of their AM-characterised microstructure. Considering the enormous lightweight potential of the Al-Cu-Li alloy system, the alloys’ strength and properties can be maximized for AM applications through a clear correlation between the micro- and macro-structure properties. This can be achieved first of all through a gainful understanding of their AM microstructure resulting from process parameters and a careful tailoring of the microstructure through the precipitation of a high-volume fraction strength contributing phase.
This work utilised a combination of various analytical measurements including S-HEXRD to characterise the microstructure of as-built (no preheating) and preheat-treated AA2099 Al-Cu-Li LPBF-built samples. No post-heat treatment was performed.
In the as-built microstructure, cracks were observed (Figure 3), which are attributed to residual stress build-up. TEM investigations showed dislocations with no detection of the T1 phase, consistent with observations in Reference [21]. This confirms the conventional view that T1, even at dislocation sites, still finds it difficult to nucleate without appropriate time and heat treatment temperatures.
In the 500 °C preheat-treated samples, Cu-rich phases which appeared as films on the grain boundaries were surrounded by PFZ. The Cu-rich phases caused Cu-depleted areas around the grain boundaries. In the 320 °C preheat-treated sample, Cu-rich phases appeared as globular phases. The PFZ around the low-melting Cu-rich phases at the grain boundaries are attributed to the movement of vacancy and Cu solute atoms to grain boundary sinks during solidification. Cu-depleted areas (PFZ) around the grain boundaries inadvertently affect the local Cu:Li and Cu:Mg ratios, which are critical for T1 phase formation. An interplay between the Cu:Mg as well as Cu:Li ratios can facilitate the precipitation of grain boundary precipitates such as S and T1 phase and minimize the PFZ effect around the grain boundary. Minimizing grain boundary Cu-rich phases as well as PFZ around grain boundaries is a main goal, because they lead to susceptible corrosion attack [39] and also reduce the fracture toughness of the alloy [41].
Through preheat treatment temperatures at 320 and 500 °C, two main dominant phases (T1–Al2CuLi and TB–Al7.5Cu4Li) were detected with S-HEXRD homogenously distributed at different volume fractions and sizes. Because TB phase (Al7.5Cu4Li) is a stabilised form of metastable Al2Cu (ϴ’) and known to form at its expense [16], it was not surprising that no ϴ’ phase was detected with the S-HEXRD. Microhardness was comparatively higher in the 500 °C preheat-treated samples than in the 320 °C preheat-treated samples. This is attributed to the higher volume fraction of the T1 phase (2.9%) in the 500 °C preheat-treated sample and not the strengthening effect of the TB phase, which is considered as minimal. Although a higher volume fraction of the TB phase (4.2%) was measured in the 320 °C preheat-treated samples than in the 500 °C samples, a lower microhardness was recorded (Figure 9). Scheil simulation performed for this alloy composition indicated that T1 phase starts first at a higher temperature, and TB phase follows afterwards, concurrently with the T1 phase. It is suggestive to conclude that if the TB phase is a stabilised form of the Al2Cu (ϴ’) phase, forming at its expense [49], and subsequently forming concurrently with the T1 phase, then it deprives the alloy of strengthening phases such as the metastable Al2Cu (ϴ’) phase and the main strengthening T1 phase. The stabilisation of the Al2Cu (ϴ’) phase into TB is reported to take place by the replacement of Al atoms by Li atoms [50], and it is therefore plausible to conclude that local Li atoms which should be available for the precipitation of a high-volume fraction of T1 could be lost to the TB phase since they are both Li-bearing phases.
Therefore, future work will investigate TB suppression at the expense of strength-contributing phases such as ϴ’ and T1 to optimise the strength and ductility properties of the alloy. Through modification of the alloy chemistry and appropriate heat treatment strategies, a high-volume fraction of finely distributed T1 precipitates can be formed at the expense of other minimal strengthening contributing phases like TB. Further investigations are therefore recommended in the finding of optimum conditions for forming fine and homogenously distributed T1 precipitates which are critical to achieving peak strength through AM processing.
Grain refinement proved to be effective in the removal of cracks in the LPBF-built AA2099 alloy [20]. This provides a pathway for further investigations for lowering preheat treatment temperatures and inhibiting cracks, as well as achieving the precipitation of strengthening phases through modification of the alloy chemistry.
The next phase of this work will also focus on the deployment of other analytical instruments, including Atom Probe Tomography (ATP) and Scanning Transmission Electron Microscope (STEM), to conduct a local precipitate investigation/characterisation, especially of T1, as found in the LPBF-built sample.

Author Contributions

Conceptualization, I.R. and F.A.-K.; Methodology, I.R.; Software, F.A.-K.; Data curation, I.R.; Investigation, F.A.-K. and S.R.; Supervision, I.R.; Validation, A.B.-P.; Writing–original draft, I.R. and F.A.-K.; Writing–review & editing, U.V. All authors have read and agreed to the published version of the manuscript.

Funding

This research received no external funding.

Acknowledgments

The authors would like to acknowledge Deutsches Elektronen-Synchrotron (DESY), Hamburg, for the use of their facility for this investigation.

Conflicts of Interest

The authors declare no conflict of interest.

References

  1. Łukaszek-Sołek, A.; Motyka, M.; Baran-Sadleja, A. Numerical and Experimental Analysis of Isothermal Forging Process of Ribbed Plates Made of 2099 Aluminium Alloy for Aircraft Structures. Adv. Manuf. Sci. Technol. 2016, 40, 61–72. [Google Scholar] [CrossRef]
  2. Sauermann, R.; Arnold, A.; Friedrich, B.; Hallstedt, B.; Schneider, J.M. Development of Al-Li-Based Alloys for Thixoformed Automotive Parts. In Proceedings of the European Metallurgical Conference, EMC 2005, Dresden, Germany, 8–21 September 2005. [Google Scholar]
  3. Belov, N.A.; Eskin, D.; Aksenov, A.A. Alloys with Lithium. In Multicomponent Phase Diagrams; Elsevier BV: Amsterdam, The Netherlands, 2005; pp. 257–286. [Google Scholar]
  4. Kumar, K.; Brown, S.; Pickens, J.R. Microstructural evolution during aging of an AlCuLiAgMgZr alloy. Acta Mater. 1996, 44, 1899–1915. [Google Scholar] [CrossRef]
  5. Romios, M.; Tiraschi, R.; Parrish, C.; Babel, H.W.; Ogren, J.R.; Es-Said, O.S. Design of Multistep Aging Treatments of 2099 (C458) Al-Li Alloy. J. Mater. Eng. Perform. 2005, 14, 641–646. [Google Scholar] [CrossRef]
  6. Ovri, H. Micromechanisms Governing Plastic Instability in Al—Li Based Alloys. Ph.D. Thesis, The Ohio State University, Columbus, OH, USA, 2015. [Google Scholar]
  7. Blankenship, C.; Hornbogen, E.; Starke, E. Predicting slip behavior in alloys containing shearable and strong particles. Mater. Sci. Eng. A 1993, 169, 33–41. [Google Scholar] [CrossRef]
  8. Dorin, T.; Deschamps, A.; De Geuser, F.; Sigli, C. Quantification and modelling of the microstructure/strength relationship by tailoring the morphological parameters of the T1 phase in an Al–Cu–Li alloy. Acta Mater. 2014, 75, 134–146. [Google Scholar] [CrossRef]
  9. Decreus, B.; Deschamps, A.; De Geuser, F.; Donnadieu, P.; Sigli, C.; Weyland, M. The influence of Cu/Li ratio on precipitation in Al–Cu–Li–x alloys. Acta Mater. 2013, 61, 2207–2218. [Google Scholar] [CrossRef]
  10. Gable, B.M.; Csontos, A.; Starke, E.J. The Role of Mechanical Stretch on Processing-Microstructure-Property Relationships of AF/C 458. Mater. Sci. Forum 2000, 331, 1341–1346. [Google Scholar] [CrossRef]
  11. Decreus, B.; Deschamps, A.; De Geuser, F.; Sigli, C. Influence of Natural Ageing and Deformation on Precipitation in an Al-Cu-Li Alloy. Adv. Eng. Mater. 2013, 15, 1082–1085. [Google Scholar] [CrossRef]
  12. Balducci, E.; Ceschini, L.; Messieri, S.; Wenner, S.; Holmestad, R. Thermal stability of the lightweight 2099 Al-Cu-Li alloy: Tensile tests and microstructural investigations after overaging. Mater. Des. 2017, 119, 54–64. [Google Scholar] [CrossRef] [Green Version]
  13. Donnadieu, P.; Shao, Y.; De Geuser, F.; Botton, G.A.; Lazar, S.; Cheynet, M.; De Boissieu, M.; Deschamps, A. Atomic structure of T1 precipitates in Al–Li–Cu alloys revisited with HAADF-STEM imaging and small-angle X-ray scattering. Acta Mater. 2011, 59, 462–472. [Google Scholar] [CrossRef]
  14. Araullo-Peters, V.; Gault, B.; De Geuser, F.; Deschamps, A.; Cairney, J.M. Microstructural evolution during ageing of Al–Cu–Li–x alloys. Acta Mater. 2014, 66, 199–208. [Google Scholar] [CrossRef] [Green Version]
  15. Khushaim, M.; Boll, T.; Seibert, J.; Haider, F.; Al-Kassab, T. Characterization of Precipitation in Al-Li Alloy AA2195 by means of Atom Probe Tomography and Transmission Electron Microscopy. Adv. Condens. Matter Phys. 2015, 2015, 1–11. [Google Scholar] [CrossRef] [Green Version]
  16. Kang, S.; Grant, N.J. Rapidly solidified P/M X2020 aluminum alloys. Met. Mater. Trans. A 1987, 18, 2037–2046. [Google Scholar] [CrossRef]
  17. Ludwiczak, E.; Rioja, R. TB precipitates in an Al-Cu-Li alloy. Scr. Met. Mater. 1991, 25, 1415–1419. [Google Scholar] [CrossRef]
  18. Suryawanshi, J.; Kaban, I.; Scudino, S.; Eckert, J.; Prakash, O.; Ramamurty, U. Simultaneous enhancements of strength and toughness in an Al-12Si alloy synthesized using selective laser melting. Acta Mater. 2016, 115, 285–294. [Google Scholar] [CrossRef]
  19. Hengsbach, F.; Koppa, P.; Duschik, K.; Holzweissig, M.J.; Burns, M.; Nellesen, J.; Tillmann, W.; Tröster, T.; Hoyer, K.-P.; Schaper, M. Duplex stainless steel fabricated by selective laser melting - Microstructural and mechanical properties. Mater. Des. 2017, 133, 136–142. [Google Scholar] [CrossRef]
  20. Raffeis, I.; Adjei-Kyeremeh, F.; Vroomen, U.; Suwanpinij, P.; Ewald, S.; Bührig-Polazcek, A. Investigation of the Lithium-Containing Aluminum Copper Alloy (AA2099) for the Laser Powder Bed Fusion Process [L-PBF]: Effects of Process Parameters on Cracks, Porosity, and Microhardness. JOM 2019, 71, 1543–1553. [Google Scholar] [CrossRef]
  21. Qi, Y.; Zhang, H.; Nie, X.; Hu, Z.; Zhu, H.; Zeng, X. A high strength Al–Li alloy produced by laser powder bed fusion: Densification, microstructure, and mechanical properties. Addit. Manuf. 2020, 35, 101346. [Google Scholar] [CrossRef]
  22. Mullis, A.; Farrell, L.; Cochrane, R.F.; Adkins, N.J. Estimation of Cooling Rates During Close-Coupled Gas Atomization Using Secondary Dendrite Arm Spacing Measurement. Met. Mater. Trans. A 2013, 44, 992–999. [Google Scholar] [CrossRef] [Green Version]
  23. Bermingham, M.; StJohn, D.; Easton, M.; Yuan, L.; Dargusch, M. Revealing the Mechanisms of Grain Nucleation and Formation During Additive Manufacturing. JOM 2020, 72, 1065–1073. [Google Scholar] [CrossRef]
  24. Todaro, C.J.; Easton, M.A.; Qiu, D.; Zhang, D.; Bermingham, M.J.; Lui, E.W.; Brandt, M.; StJohn, D.H.; Qian, M. Grain structure control during metal 3D printing by high-intensity ultrasound. Nat. Commun. 2020, 11, 1–9. [Google Scholar] [CrossRef]
  25. Debroy, T.; Wei, H.; Zuback, J.; Mukherjee, T.; Elmer, J.; Milewski, J.; Beese, A.; Wilson-Heid, A.; De, A.; Zhang, W. Additive manufacturing of metallic components—Process, structure and properties. Prog. Mater. Sci. 2018, 92, 112–224. [Google Scholar] [CrossRef]
  26. Zhang, B.; Li, Y.; Bai, Q. Defect Formation Mechanisms in Selective Laser Melting: A Review. Chin. J. Mech. Eng. 2017, 30, 515–527. [Google Scholar] [CrossRef] [Green Version]
  27. Syed, A.K.; Ahmad, B.; Guo, H.; Machry, T.; Eatock, D.; Meyer, J.; Fitzpatrick, M.E.; Zhang, X. An experimental study of residual stress and direction-dependence of fatigue crack growth behaviour in as-built and stress-relieved selective-laser-melted Ti6Al4V. Mater. Sci. Eng. A 2019, 755, 246–257. [Google Scholar] [CrossRef]
  28. Song, B.; Dong, S.; Deng, S.; Liao, H.; Coddet, C. Microstructure and tensile properties of iron parts fabricated by selective laser melting. Opt. Laser Technol. 2014, 56, 451–460. [Google Scholar] [CrossRef]
  29. Kanagarajah, P.; Brenne, F.; Niendorf, T.; Maier, H. Inconel 939 processed by selective laser melting: Effect of microstructure and temperature on the mechanical properties under static and cyclic loading. Mater. Sci. Eng. A 2013, 588, 188–195. [Google Scholar] [CrossRef]
  30. Gumbmann, E.; De Geuser, F.; Lefebvre, W.; Sigli, C.; Deschamps, A. The Influence of Mg and Ag on the Precipitation Kinetics and the Formation of the T1 Phase in Al-Cu-Li Alloys. Mater. Sci. Forum 2014, 794, 945–950. [Google Scholar] [CrossRef]
  31. Gumbmann, E.; Lefebvre, W.; De Geuser, F.; Sigli, C.; Deschamps, A. The effect of minor solute additions on the precipitation path of an Al Cu Li alloy. Acta Mater. 2016, 115, 104–114. [Google Scholar] [CrossRef]
  32. Murayama, M.; Hono, K. Role of Ag and Mg on precipitation of T1 phase in an Al-Cu-Li-Mg-Ag alloy. Scr. Mater. 2001, 44, 701–706. [Google Scholar] [CrossRef]
  33. Mertens, R.; Vrancken, B.; Holmstock, N.; Kinds, Y.; Kruth, J.-P.; Van Humbeeck, J. Influence of Powder Bed Preheating on Microstructure and Mechanical Properties of H13 Tool Steel SLM Parts. Phys. Procedia 2016, 83, 882–890. [Google Scholar] [CrossRef] [Green Version]
  34. Ronneberg, T.; Davies, C.; Hooper, P. Revealing relationships between porosity, microstructure and mechanical properties of laser powder bed fusion 316L stainless steel through heat treatment. Mater. Des. 2020, 189, 108481. [Google Scholar] [CrossRef]
  35. Lee, Y. Microstructures in Over-aged Al–Cu–Li–Mg–Ag Alloys. J. Mater. Sci. Lett. 1998, 17, 1161–1164. [Google Scholar] [CrossRef]
  36. Totten, G.E.; Tiryakioglu, M.; Kessler, O. Encyclopedia of Aluminum and Its Alloys, Volume 2; CRC Press: Boca Raton, FL, USA, 2018. [Google Scholar]
  37. Padgett, B.N.; Buchheit, R.; Frankel, G.; Morral, J. Investigation into the Stress Corrosion Cracking Properties of Aa2099, an Al-Li-Cu Alloy. Ph.D. Thesis, The Ohio State University, Columbus, OH, USA, 2008. [Google Scholar]
  38. Lin, Y.; Zheng, Z.; Li, S.; Kong, X.; Han, Y. Microstructures and properties of 2099 Al-Li alloy. Mater. Charact. 2013, 84, 88–99. [Google Scholar] [CrossRef]
  39. Carrick, D.M.; Hogg, S.C.; Wilcox, G.D. Influence of Li Additions on the Microstructure and Corrosion Response of 2XXX Series Aluminium Alloys. Mater. Sci. Forum 2014, 794, 193–198. [Google Scholar] [CrossRef]
  40. Srivatsan, T.S.; Place, T.A. Microstructure, tensile properties and fracture behaviour of an Al-Cu-Li-Mg-Zr alloy 8090. J. Mater. Sci. 1989, 24, 1543–1551. [Google Scholar] [CrossRef]
  41. Lütjering, G.; Albrecht, J.; Sauer, C.; Krull, T. The influence of soft, precipitate-free zones at grain boundaries in Ti and Al alloys on their fatigue and fracture behavior. Mater. Sci. Eng. A 2007, 201–209. [Google Scholar] [CrossRef]
  42. Srivatsan, T.S.; Lavernia, E.J. The presence and consequences of precipitatefree zones in an aluminium-copper-lithium alloy. J. Mater. Sci. 1991, 26, 940–950. [Google Scholar] [CrossRef]
  43. Rioja, R.J.; Liu, J. The Evolution of Al-Li Base Products for Aerospace and Space Applications. Met. Mater. Trans. A 2012, 43, 3325–3337. [Google Scholar] [CrossRef]
  44. Kuo, Y.-L.; Nagahari, T.; Kakehi, K. The Effect of Post-Processes on the Microstructure and Creep Properties of Alloy718 Built Up by Selective Laser Melting. Mater. 2018, 11, 996. [Google Scholar] [CrossRef] [Green Version]
  45. Liu, P.; Wang, Z.; Xiao, Y.; Horstemeyer, M.F.; Cui, X.; Chen, L.-Q. Insight into the mechanisms of columnar to equiaxed grain transition during metallic additive manufacturing. Addit. Manuf. 2019, 26, 22–29. [Google Scholar] [CrossRef]
  46. Sun, S.; Brandt, M.; Easton, M. Powder bed fusion processes. In Laser Additive Manufacturing; Elsevier BV: Amsterdam, The Netherlands, 2017. [Google Scholar]
  47. Li, H.; Li, H.-Y.; Zeng, Z.; Zheng, Z.; Zheng, F. Effect of ageing time on strength and microstructures of an Al–Cu–Li–Zn–Mg–Mn–Zr alloy. Mater. Sci. Eng. A 2008, 498, 314–320. [Google Scholar] [CrossRef]
  48. Mishra, S.; Beura, V.K.; Singh, A.; Yadava, M.; Nayan, N. Deformation behaviour of Al–Cu–Li alloy containing T1 precipitates. Mater. Sci. Technol. 2018, 34, 2105–2113. [Google Scholar] [CrossRef]
  49. Prasad, N.E.; Ramachandran, T. Phase Diagrams and Phase Reactions in Al–Li Alloys. In Aluminum-lithium Alloys; Elsevier BV: Amsterdam, The Netherlands, 2014. [Google Scholar] [CrossRef]
  50. Yoshimura, R.; Konno, T.J.; Abe, E.; Hiraga, K. Transmission electron microscopy study of the evolution of precipitates in aged Al–Li–Cu alloys: The θ′ and T1 phases. Acta Mater. 2003, 51, 4251–4266. [Google Scholar] [CrossRef]
Figure 1. (a) Morphology of the gas-atomized particles with few satellites. (b) Particle size distribution (PSD) graph of the AlCu2.7Li1.8Mg0.3 alloy recording a d50 of 40.5 µm.
Materials 13 05188 g001
Figure 2. Electron Probe Micro Analyser (EPMA) maps of a cross-sectioned powder particle showing inter-dendritic phase with high Cu enrichments and significant concentrations of Zn and Mg.
Materials 13 05188 g002
Figure 3. As-built LPBF microstructures: (a) Observed under Light Optical Microscope (LOM), (b) observed under Scanning Electron Microscope (SEM), showing melt-pool boundary and melt-pool boundary overlaps and (c) observed residual stress-induced cracks in the as-built condition.
Materials 13 05188 g003
Figure 4. (a) Bright Field (BF)-Transmission Electron Microscope (TEM) micrograph showing dislocations in the as-built sample taken at 200 KV. (b). Insert: BF-TEM image taken at high magnification (43,000, 200 kV).
Materials 13 05188 g004
Figure 5. Scheil non-equilibrium simulation (TCal6), predicting T1 and TB formation temperatures.
Materials 13 05188 g005
Figure 6. (a,b) LOM micrographs of etched preheat-treated sample (320 °C). (c,d) SEM micrographs of preheat-treated sample (320° C) showing rod-like precipitates suspected to be T1 and TB plates of varying sizes as well as globular precipitates which appear to be rich in Cu. Synchrotron High-Energy X-ray Diffraction (S-HEXRD) measurements (320 °C sample), (e) masked ring pattern, (f) diffraction peaks confirming two main dominant phases, T1 and TB.
Materials 13 05188 g006
Figure 7. (a,b) LOM micrographs of preheat-treated sample (500 °C) showing Cu-rich phases at grain boundaries (GB), light colour: Al-rich, dark: Cu-rich, little golden (brown) rod-like precipitates. (c,d) SEM micrographs of preheat-treated sample (500 °C) showing rod-like precipitates suspected to be T1 and TB precipitates of varying sizes and orientations, as well as Cu-rich phases around grain boundaries and Precipitate Free Zone (PFZ). S-HEXRD measurements (500 °C sample), (e) masked ring pattern, (f) diffraction peaks confirming the two main dominant phases, T1 and TB.
Materials 13 05188 g007
Figure 8. SEM/EPMA maps of preheat-treated sample (500 °C) showing Cu-, Mg- and Zn-enriched phases, and PFZ as well as T1 and TB plates.
Materials 13 05188 g008
Figure 9. Electron Backscatter Diffraction (EBSD) Inverse Pole Figures (IPF) of: (a) 320 °C preheat-treated sample showing elongated grains along the building direction (BD) and (b) 500° C preheat-treated sample with a nearly equiaxed grain structure.
Materials 13 05188 g009
Figure 10. Microhardness of 520 °C preheat-treated sample [20]. Microhardness comparison of as-built, 320 °C and 500° C preheat-treated samples showing elevated microhardness of the 500 °C sample due to higher T1 volume fraction, followed by the as-built samples, which is attributed to residual stress build-up.
Materials 13 05188 g010
Table 1. Nominal composition (wt.%) of gas-atomized AlCu2.7Li1.8Mg0.3 powder.
MaterialNominal Composition (wt.%)
AlCu2.7Li1.8Mg0.3AlCuLiZnMgMnZrSi
-Bal2.631.560.670.280.170.090.02
Table 2. Laser Powder Bed Fusion (LPBF) process parameters of densest test samples.
Parameter Table for Printed LPBF Samples
LPBF Built ConditionLaser Power (W)Scanning Speed (mm/s)Hatch Distance (µm)Layer Thickness (µm)Relative Density (%)
As-built sample (no preheating)2006501603099.0
Preheat-treated sample, 320 °C1705001403098.5
500 °C1205001403099.6
Publisher’s Note: MDPI stays neutral with regard to jurisdictional claims in published maps and institutional affiliations.

